Article

Raman Technology for Process Control: Waste Shell Demineralization for Producing Transparent Polymer Foils Reinforced with Natural Antioxidants and Calcium Acetate By-Products

by
Simona Cîntă Pînzaru
1,2,*,
Iuliana-Cornelia Poplăcean
1,*,
Karlo Maškarić
1,2,*,
Dănuț-Alexandru Dumitru
1,
Lucian Barbu-Tudoran
3,4,
Tudor-Liviu Tămaș
5,
Fran Nekvapil
1,2,3 and
Bogdan Neculai
6
1
Biomolecular Physics Department, Babeş–Bolyai University, Kogălniceanu 1, 400084 Cluj-Napoca, Romania
2
Institute for Research, Development and Innovation in Applied Natural Sciences, Babeș-Bolyai University, Fântânele 30, 400327 Cluj-Napoca, Romania
3
National Institute for Research and Development of Isotopic and Molecular Technologies, Donath 67-103, 400293 Cluj-Napoca, Romania
4
Electron Microscopy Center, Babeș-Bolyai University, Clinicilor 5-7, 400006 Cluj-Napoca, Romania
5
Department of Geology, Babeș-Bolyai University, M. Kogălniceanu 1, 400084 Cluj-Napoca, Romania
6
Metrohm Analytics Romania SRL, E. Racoviţă 5, 041753 Bucharest, Romania
*
Authors to whom correspondence should be addressed.
Processes 2024, 12(4), 832; https://doi.org/10.3390/pr12040832
Submission received: 15 March 2024 / Revised: 12 April 2024 / Accepted: 14 April 2024 / Published: 19 April 2024
(This article belongs to the Special Issue Solid and Hazardous Waste Disposal and Resource Utilization)

Abstract

:
Waste biogenic materials derived from seafood exploitation represent valuable resources of new compounds within the blue bioeconomy concept. Here, we describe the effectiveness of Raman technology implementation as an in-line tool for the demineralization process control of crustaceans or gastropods. Transparent chitin polymeric foils and calcium acetate by-products were obtained from three waste crustacean shells (C. sapidus, S. mantis, and M. squinado) using a slow, green chemical approach employing acetic acid. Progressive mineral dissolution and increasing of the Raman characteristic signal of chitin is shown in a time-dependent manner using NIR-Raman spectroscopy, while resonance Raman shows intact carotenoids in reacted shells after 2 weeks. Chitin foil products are species-specific, and the demineralization bath of the waste shell mixture can be effectively tracked by Raman tools for solvent control and decision making for the recovery of calcium acetate by-products. Comparatively obtained calcium acetate from Rapana venosa snail shells, the subject of Raman analyses, allowed assessing by-product identity, hydration status, purity, and suitability as recrystallized material for further use as a pharmaceutical compound derived from different crustaceans or gastropod species. Cross validation of the results was done using FT-IR, XRD, and SEM-EDX techniques. A hand-held flexible TacticID Raman system with 1064 nm excitation demonstrated its effectiveness as a rapid, in-line decision making tool during process control and revealed excellent reproducibility of the lab-based instrument signal, suitable for in situ evaluation of the demineralization status and solvent saturation control.

1. Introduction

The demineralization of crustacean shells has wide applicability not only in materials science but also in aquatic research and environmental studies, especially in light of the increasing demands of the bioeconomy sector. The main objective of the blue bioeconomy is to obtain new and valuable products from aquatic waste, making it one of the rapidly expanding research fields in the context of current priorities [1].
The abundant aquatic waste material in focus here is the biogenic calcium carbonate originating from crustacean or gastropod shells. Among these, the Atlantic blue crab Callinectes sapidus (Rathbun, 1896) and whelk Rapana venosa (Valenciennes, 1846) are ranked as some of the most invasive species in the Mediterranean and Black Sea basins. There are many studies related to the increased awareness regarding the most invasive species in the Mediterranean Sea, such as the one conducted by Marchessaux et al., who advocate the resilient idea of turning the threat into new opportunities [2,3,4].
The Atlantic blue crab C. sapidus and the whelk R. venosa are both ranked among the 100 worst invasive species, with a negative impact on the ecology of invaded areas, seashore ecosystems, touristic areas, as well as the aquaculture exploitation of the local bivalve products. These species have garnered attention not only from environmental scientists but also from the blue bioeconomy research field due to their potential for multidisciplinary approaches. Aquatic resources can be sustainably exploited to produce value-added compounds or innovative products from aquatic waste.
We demonstrated in several recently published papers that the highly ordered 3D nanostructure of the C. sapidus shells, comprising mineral and organic components [5], possesses an intricate porosity, which could be exploited for various applications [6]. These include serving as an efficient material for solution loading and slow release [7,8], a drug carrier, an efficient absorbent of pollutants [9], and a new biostimulant [10], while being compliant with the regulations regarding their heavy metal content [11].
The complex scaffold of chitin-protein fibrils, which supports biomineralization, has never been considered with respect to its potential utility as a chitin-based polymer foil. This green product might be available as a subject of the intact raw material being demineralized, without powdering. As recently reviewed, numerous studies reporting chitin or chitosan production from crustaceans [12] have used powdering as a main step in the production process, where understanding dependencies for efficient extraction is crucial. When speeding up the process, the energy consumption and the workload for the multi-step preparation of powders are high, while a slower process could eliminate all these steps. The demineralization process, however, can be considered without powdering, heating, and stirring of the demineralization bath, resulting in a material that can be further tailored according to the desired products.
Chitin, the second most abundant polymer after cellulose, is widely produced from the primary source of aquatic waste derived from crab and shrimp processing. Industrially, chitin is produced throughout acid treatment, with hydrochloric acid being the preferred demineralization agent, even though it may negatively impact the molecular mass and the degree of deacetylation of the resulted polymer. Therefore, it may impair the purified chitin’s inherent qualities [13]. The demineralization process is followed by deproteinization and decolorization to obtain pure, colorless chitin, without any residues, reaching the required quality for specific applications in many fields, such as drug delivery and tissue engineering as well as agriculture, food industry, and others [12]. Due to the variability of the chitin source, the entire production process requires optimization.
To obtain chitin from various crustacean species, the demineralization process may depend on the structural and morphological characteristics of each species; thus, knowledge-based decisions on the most convenient process steps are required. Additionally, during the demineralization process, tools needed for informed decisions (to continue, to modify conditions, or to stop) are scant. Most of the studies rely on obtaining the “final product” under certain conditions and consider the necessary repeating of operations or improved conditions to achieve the optimal processing. This is done with the aim of ensuring compatibility with the transition to the industrial environment at the highest technology readiness level (TRL), while achieving a low-cost, high-quality final product, minimal workload, and an environmentally friendly chemical consumption [14].
When exposed to acid treatment (usually hydrochloric acid), the biogenic carbonate reacts to yield the secondary product, calcium acetate, in addition to CO2 and water. Calcium acetate, approved by the regulatory bodies [15], is widely used as a food additive, an acidity regulator, a preservative and stabilizing agent for nutraceuticals, a calcium supplement, and a medication for patients with kidney disease undergoing dialysis, to control hyperphosphatemia. There are two widely used industrial methods to obtain calcium acetate. One involves the reaction between calcium carbonate and acetic acid, often using natural limestones or marble as the starting material, resulting in calcium acetate, carbon dioxide, and water. The other method employs using calcium hydroxide and acetic acid, yielding calcium acetate and water. The biogenic carbonate waste material, typically referring to calcium carbonate derived from crustaceans’ waste, bivalve or mollusc shells, is not usually considered, as it is often blamed for the potential impurity residues that may alter the quality of the calcium acetate product.
To the best of our knowledge, there are neither reported studies on obtaining transparent polymeric foils of chitin from unground, unpowdered biogenic materials derived from Callinectes sapidus, the mantis shrimp Squilla mantis (Linnaeus, 1758), and the European spider crab Maja squinado (Herbst, 1788), nor reports on calcium acetate obtained from these crustaceans. Iftekhar et al. [16] noted the preparation of an optically transparent crab shell by removing non-chitin components (e.g., calcium carbonate, proteins, lipids, and pigments) to create transparent nanocomposites with improved properties. The species considered was Chionoecetes opilio (Fabricius, 1788), and the demineralization process occurred under hydrochloric acid treatment [16].
Previous studies have employed Raman spectroscopy as a tool for characterizing shells from various species. Polyene pigments (carotenoids) and inorganic calcium carbonate have been identified within the shells of several gastropod species through Raman spectroscopy [17], while investigations of the inorganic composition of bivalve [18] and crustacean [19] shells have also been conducted using Raman techniques. All these studies analyzed the efficiency of Raman spectroscopy in marine shell characterization. However, we use Raman spectroscopy in controlling the demineralization process, which has not been previously explored.
In this paper, we demonstrate the usefulness of the Raman spectroscopy techniques to assist in the demineralization process of the biogenic carbonates derived from three distinct crustacean species to obtain chitin or derived from R. venosa shells to valorize the abundant calcium content for calcium acetate production, as this gastropod shell does not comprise chitin. We compared the in-line process control results in terms of Raman spectroscopy signal, to check the appearance of the chitin signal in the resulting demineralized biological samples in a timely manner using both the lab-based Raman system and the hand-held Raman instrument. We further comparatively evaluate the calcium acetate by-products resulting from application of a ‘green’ method, using the acetic acid reaction on the biogenic waste at room temperature, without powdering or heating. Finally, we evaluate the quality of the calcium acetate resulting from the crustaceans and snail shells. Fourier-transform infrared spectroscopy (FT-IR), X-ray diffraction (XRD), and scanning electron microscopy combined with energy dispersive X-ray spectroscopy (SEM-EDX) were employed as cross-validation methods to confirm the identity and the morphology of the final bio-products.
Considering the time, cost, effort, and chemicals required for such a crucial industrial approach, here we propose the implementation of Raman technology as an effective tool to assist every step of this economically important activity.

2. Materials and Methods

2.1. Biogenic Material Selection and Processing

Biological samples from three crustacean species—C. sapidus, S. mantis and M. squinado—were acquired through a collaboration between the Babeș-Bolyai University and the University of Dubrovnik, originating from the Neretva River Delta (Southeasten Adriatic Sea). The specimens of S. mantis and M. squinado were caught and maintained in frozen conditions, while the shells from C. sapidus represented food waste from cooked crabs. One specimen from each of S. mantis and M. squinado were eviscerated. We considered waste biogenic material from cooked carapace fragments of C. sapidus, cuticle segments of the abdomen, the telson cuticle from S. mantis, and the whole, raw carapace of M. squinado for the experimental studies. Fresh specimens of the R. venosa snail were gathered from a cluster of individuals along the Romanian shores of the Black Sea, specifically Năvodari, at the geographical coordinates 44°18′07.4″ N, 28°37′38.4″ E. The R. venosa shells were randomly selected from a large stock comprising both the specimens with intensive pink-orange pigmentation and the specimens with pronounced blue pigmentation.
The selected crustacean shells were cleaned from adherent aquatic materials, degreased, washed abundantly with deionized pure water (resistivity 18.2 MΩ × cm at 22 °C) and immersed in pure glacial acetic acid. R. venosa specimens were immersed in a vinegar bath (acetic acid 9%) after undergoing a thorough cleaning process with the removal of soft tissue from the shells. Demineralization occurred at room temperature, with the process systematically monitored through periodic analysis of the biological samples by Raman techniques.

2.2. Chemicals

Glacial acetic acid was provided by Sigma Aldrich, St. Louis, MO, USA, while geogenic calcium carbonate was purchased from CHIMREACTIV S.R.L, with both substances being used without any further purification.

2.3. Demineralization By-Products and Reference Calcium Acetate Synthesis

The immersion bathing solutions of the biological samples were evaporated by exposure to controlled heat to fully investigate the demineralization process. Given that calcium carbonate is the main mineral of the biological samples considered, the reaction between this compound and acetic acid was observed to obtain geogenic calcium acetate as a reference material of the demineralization by-products. Geogenic calcium acetate was synthetized using 1 g of standard geogenic calcium carbonate dissolved in a mixture solution of 2 mL pure glacial acetic acid and 3 mL acetic acid aqueous solution 10%. The obtained mixture was prepared under magnetic stirring at a controlled temperature for 60 min, with the resulting solution being evaporated under controlled heat. All powders obtained were dried in an oven at 60 °C for 24 h and investigated through Raman spectroscopy and X-ray diffraction.

2.4. Instrumentation

As a lab-based instrument to validate the hand-held Raman system, we employed the Renishaw InVia Reflex Raman system (Renishaw, Gloucestershire, UK) with a Leica confocal microscope. For Raman excitation, a laser diode emitting at 785 nm was employed to characterize the starting materials and the ones during the demineralization progress. An additional Cobolt diode pumped solid-state laser emitting at 532 nm was employed to control the presence of native carotenoids in biogenic shells, exploiting their selective signal under resonance Raman conditions, and a He-Ne- laser providing the 632.8 nm excitation line was used for detecting the carotenoprotein resonant signal. The laser power and the exposure time were adjusted for each acquisition to achieve optimal signal-to-noise ratio, with the data presented in Figure S1. The laser power was selected within the range of 1–50 for 785 nm excitation and 0.5–10 for 532 nm and 633 nm. Due to the different thicknesses of the samples, the exposure times varied accordingly, from 1 s to 10 min in the case of extended acquisitions (Figure S1). The instrument calibration was achieved with the internal silicon providing the band centered at 520 cm1. WiRETM 3.4 Software (Renishaw, UK) was used for data acquisition. The spectral resolution was 1 cm1 in NIR and 0.5 cm1 for the visible range excitation.
A hand-held TacticID® Mobile Raman system, model BWS493TSII (BWTEK, a Metrohm Group Company, Herisau, Switzerland), with a NIR-laser emitting at 1064 nm, 220 mW, with a TE-Cooled InGaAs Array detector, was used to record spectra during the process in the 176–2000 cm1 spectral range, with a spectral resolution of 11 cm1. The system is equipped with a database of 1200 spectra of synthetic chemicals, narcotics, drugs, explosives, cutting agents, precursors, and solvents [20].
A Shimadzu FT-IR IRSPIRIT with an QATR-S accessory (Shimadzu Europa GmbH, Duisburg, Germany), holding a single-reflection integration-type ATR module and with a diamond prism, was employed to record the FT-IR spectra of the demineralized fragments in the 650–4000 cm1 spectral range, setting 50 accumulations per spectrum, with 4 cm1 spectral resolution selected in the LabSolutions IR software version 2. 31 (3 February 2023).
X-ray powder diffraction (XRD) analyses were achieved using a Bruker D8 Advance diffractometer (Bruker Corporation (Bruker AXS Advanced X-ray Solutions GmbH), Karlsruhe, Germany) in Bragg–Brentano geometry, possessing a Cu tube with λ K α = 0.15418 nm, a Ni filter, and a LynxEye detector. Corundum (NIST SRM1976a) was used as an internal standard. The data were collected in the 3.8–64° 2θ interval at a 0.02° 2θ step, measuring each step for 0.2 s. Acetate precipitates were ground in an agate mortar and placed in Bruker PMMA sample holders. In the case of the demineralized foils, surface XRD was performed on foil fragments, with the surface of the fragments aligned to the X-ray beam. The identification of mineral phases was performed with the Diffrac.Eva 2.1 software (Bruker AXS) using the PDF2 (2023) database from the ICDD (International Centre for Diffraction Data).
Scanning electron microscopy and energy-dispersive X-ray spectroscopy (SEM-EDX) analyses were achieved using a Hitachi SU8320 ultra-high resolution cold field emission scanning electron microscope (Hitachi, Ibaraki, Japan) with a Quorum Q150T gold sputtering coater of a controlled thickness of 11 nm at a rate of 14 nm/min and evaporating carbon for EDX analysis using an Oxford energy-dispersive X-ray module (Oxford, UK) for semiquantitative elemental analysis of the demineralized shell fragments.
The dataset underwent comprehensive processing and analyzing using OriginPro 2021b version 9.8.5.212, OriginLab Corporation, Northampton, MA, USA. The data processing steps of the Raman spectra include smoothing and background subtraction. Raw spectra together with the spectral acquisition parameters are presented in the supplementary materials (Figure S1).

3. Results and Discussion

3.1. Demineralization Process

The stock of the selected materials for exploring the green demineralization process, consisting of untreated fragments of crustacean shells, is shown in Figure 1A. All the anatomical fragments were subjected to the same demineralization treatment, described above. Following the applied treatment, transparent and flexible samples were obtained, as noted in Figure 1B. In addition, the disappearance of the stiffness indicates the dissolution of the mineral component of the crustaceans’ shells (Supplementary Material, Video S1). The process was accompanied by the extraction of carotenoids, leading to the discovery of acetic acid’s role in the depigmentation of crustacean shells. In the case of R. venosa, Figure 1C highlights the effects of shell demineralization after 14 days of vinegar immersion. The fully developed specimen showed, overall, different prominent signs of shell degradation from the appearance of through holes, shell apex withdrawal, and strong interior depigmentation. Furthermore, fragments of the exterior-side shell layer with brown pigmented lines started to detach from the still-solid body.

3.2. Raman Spectral Analyses during the Demineralization Process

The Raman spectra of the starting materials were checked to comply with the already known [5,6,7,8,9] characteristics: under 785 nm excitation, the crab species shells exhibit the dominant, characteristic bands of calcite at 1085, 712, 281, and 156 cm−1, weak bands of pigments (free and non-covalently bond astaxanthin showing the C=C stretching modes at 1516 and 1494 cm−1, respectively), and several weak trace bands originating from the most intense modes of chitin above a typical background, even for NIR excitation (Supplementary Figure S1). Particularly, in the case of the S. mantis shell, besides the above bands typical for crabs, a strong band is observed for phosphate at 954 cm−1, which is overlapped with the more prominent chitin bands. To track the demineralization process under acetic acid exposure, we analyzed the biological samples at different moments of time, marked in Figure 2 for each individual crustacean specimen.
By monitoring the evolution of the Raman spectrum of the crustacean shells, from the typically raw biogenic calcium carbonate presence to the appearance of the characteristic signal of chitin and the disappearance of the calcium carbonate Raman bands at 1085, 712, 281, and 156 cm−1, the spectra taken during the process control promptly guided decision making regarding whether to stop or to continue the acetic acid exposure of the crustacean shells. It turned out that the different species required varying durations for complete demineralization, with the thick carapace of M. squinado requiring a longer exposure compared to the shell fragments of C. sapidus or S. mantis.
The Raman spectra of the biogenic material from C. sapidus after acetic acid exposure are shown in Figure 2A. The presence of calcium carbonate in the polymorphic form of calcite is revealed by the Raman spectra acquired from the C. sapidus untreated shell and the one exposed to acetic acid for 20 h. Additionally, the strongest band in the astaxanthin Raman spectrum is also present in the spectra of the two discussed samples. The α-chitin specific signals start to appear only after exposure to acetic acid, being covered by the background in the case of the untreated fragment shell. After 140 h of immersion in acetic acid, the C. sapidus shell fragment was completely demineralized. Thus, through exposure to acetic acid, markedly weaker acid than the hydrochloric acid, which was commonly employed in many previous studies [12], the process of dissolving the mineral component in crustacean shells yielded promising outcomes. Following this success, we monitored the evolution of the chitin Raman bands through an extended acetic acid treatment. Once the exposure time increased, the Raman spectrum acquired on the shell fragments began to show an improved spectral resolution of the α-chitin signal. After 65 days of immersion in acetic acid, the spectrum of the shell fragment from the C. sapidus presented the bands of the reference α-chitin with highest accuracy. Additional vibrational bands express the presence of lipids and proteins in fragments of C. sapidus shells exposed to acetic acid.
The different time needed for chitin clear band appearance along the demineralization process could be explained by the fact that the various parts of the crab shell have different compositions and thicknesses [21]. Considering the biological samples, the whole carapace of M. squinado is more mineralized and thicker than the S. mantis cuticles; thus, the latter experienced faster demineralization and clear observation of chitin Raman band occurrence. The earliest chitin bands were observed after 18 h of acetic acid bath treatment (Figure 2B). The calcium carbonate Raman signal was still present after two weeks of treatment in the carapace of M. squinado, indicating an intricate structure and low demineralization process (Figure 2C).
Time-dependent Raman spectra acquired under 785 nm excitation revealed different chitin bands in the case of S. mantis and M. squinado. The first chitin bands observed after 18 h of treatment in S. mantis are present at other points in time. In the case of M. squinado, the first chitin bands were visible two weeks after the treatment. At the same time, calcium carbonate bands at 152 cm−1, 281 cm−1, and 1087 cm−1 were still present. Besides chitin and calcium carbonate, the peaks with the highest intensity were those from the carotenoids and the carotenoproteins (Figure 3). The excitation of the carapace at the end of the treatment (after 65 days) revealed a high background from the remaining proteins (Figure 2C). Due to the high background, the calcium carbonate bands were often not seen. Carotenoids seemed not to be present at the time, or the point of the carapace did not contain carotenoids. The color originating from the carotenoids was still visible with the naked eye at the end of the treatment (Figure 1B).
The crab cuticles contain carotenoids and carotenoproteins, as Figure 3 shows. The carotenoids were still present after 14 days of acetic acid bath solution. In the case of C. sapidus and M. squinado, the carotenoid profile did not experience shifts in the wavenumber position but appeared with lower relative intensity (Figure 3A,C). S. mantis carotenoids exhibited shifts in the wavenumber position, and the relative intensities of the vibrational bands were lower after acetic acid treatment (Figure 3B).

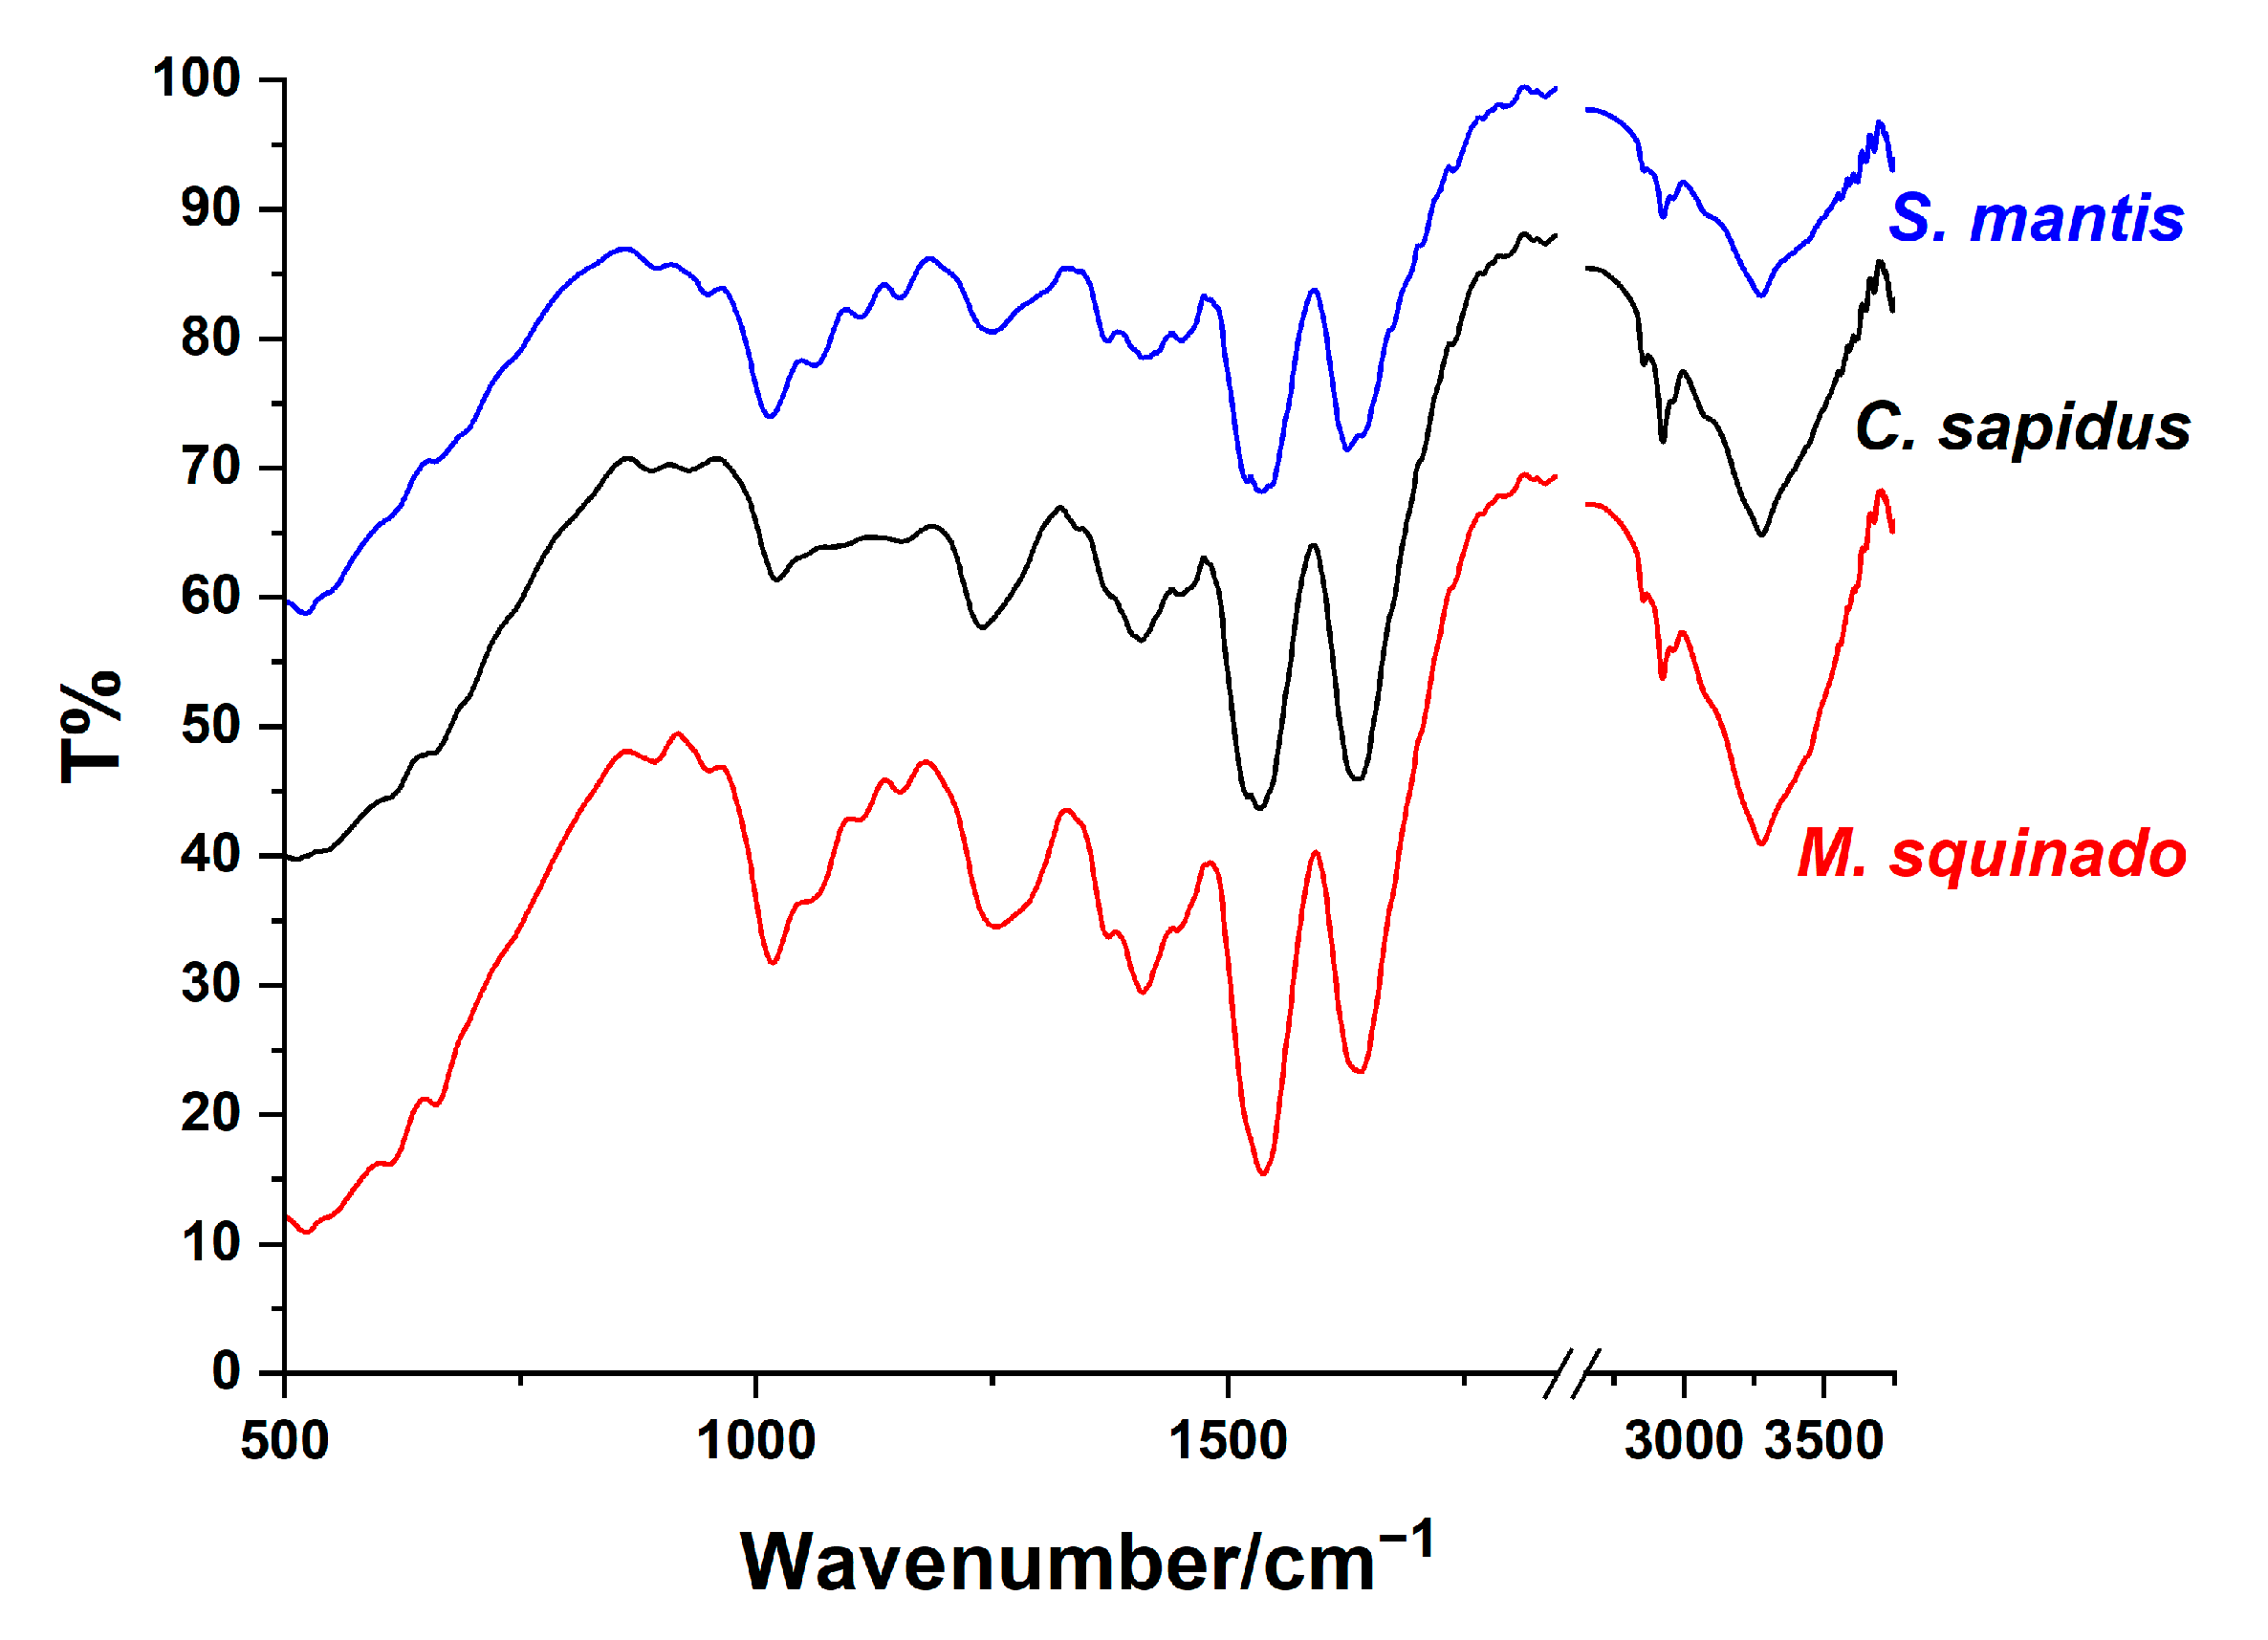
3.3. Validation Results Using FT-IR Spectral Analyses of Demineralized Foil Products Derived from Crustaceans

The FT-IR spectra of the demineralized crustacean foils are shown in Figure 4. In the case of all three crustacean species (C. sapidus, S. mantis, and M. squinado), some new vibrational bands were identified at the end of the demineralization process (65 days) in addition to the specific vibrational signals previously reported for raw crustacean fragments [9]. Among these, chitin-specific FT-IR bands were identified in all specimen fragments, as follows: 891 cm−1 (ring stretching), 1411 cm−1 (CH2 bending and CH3 deformation), 1556 and 1315 cm-1 (amide II (N-H bending and amide III (C-N stretching) and 1628 cm−1 (stretching of amide I) in agreement with other FT-IR data reported on chitin [22,23]. S. mantis and M. squinado demineralized shell fragments also revealed chitin bands at 1113 cm−1 (asymmetric in phase ring stretching) and 1377 cm−1, while higher CO-stretching mode was identified in the case of the C. sapidus-treated shell fragment at 1022 cm−1, [22,23].

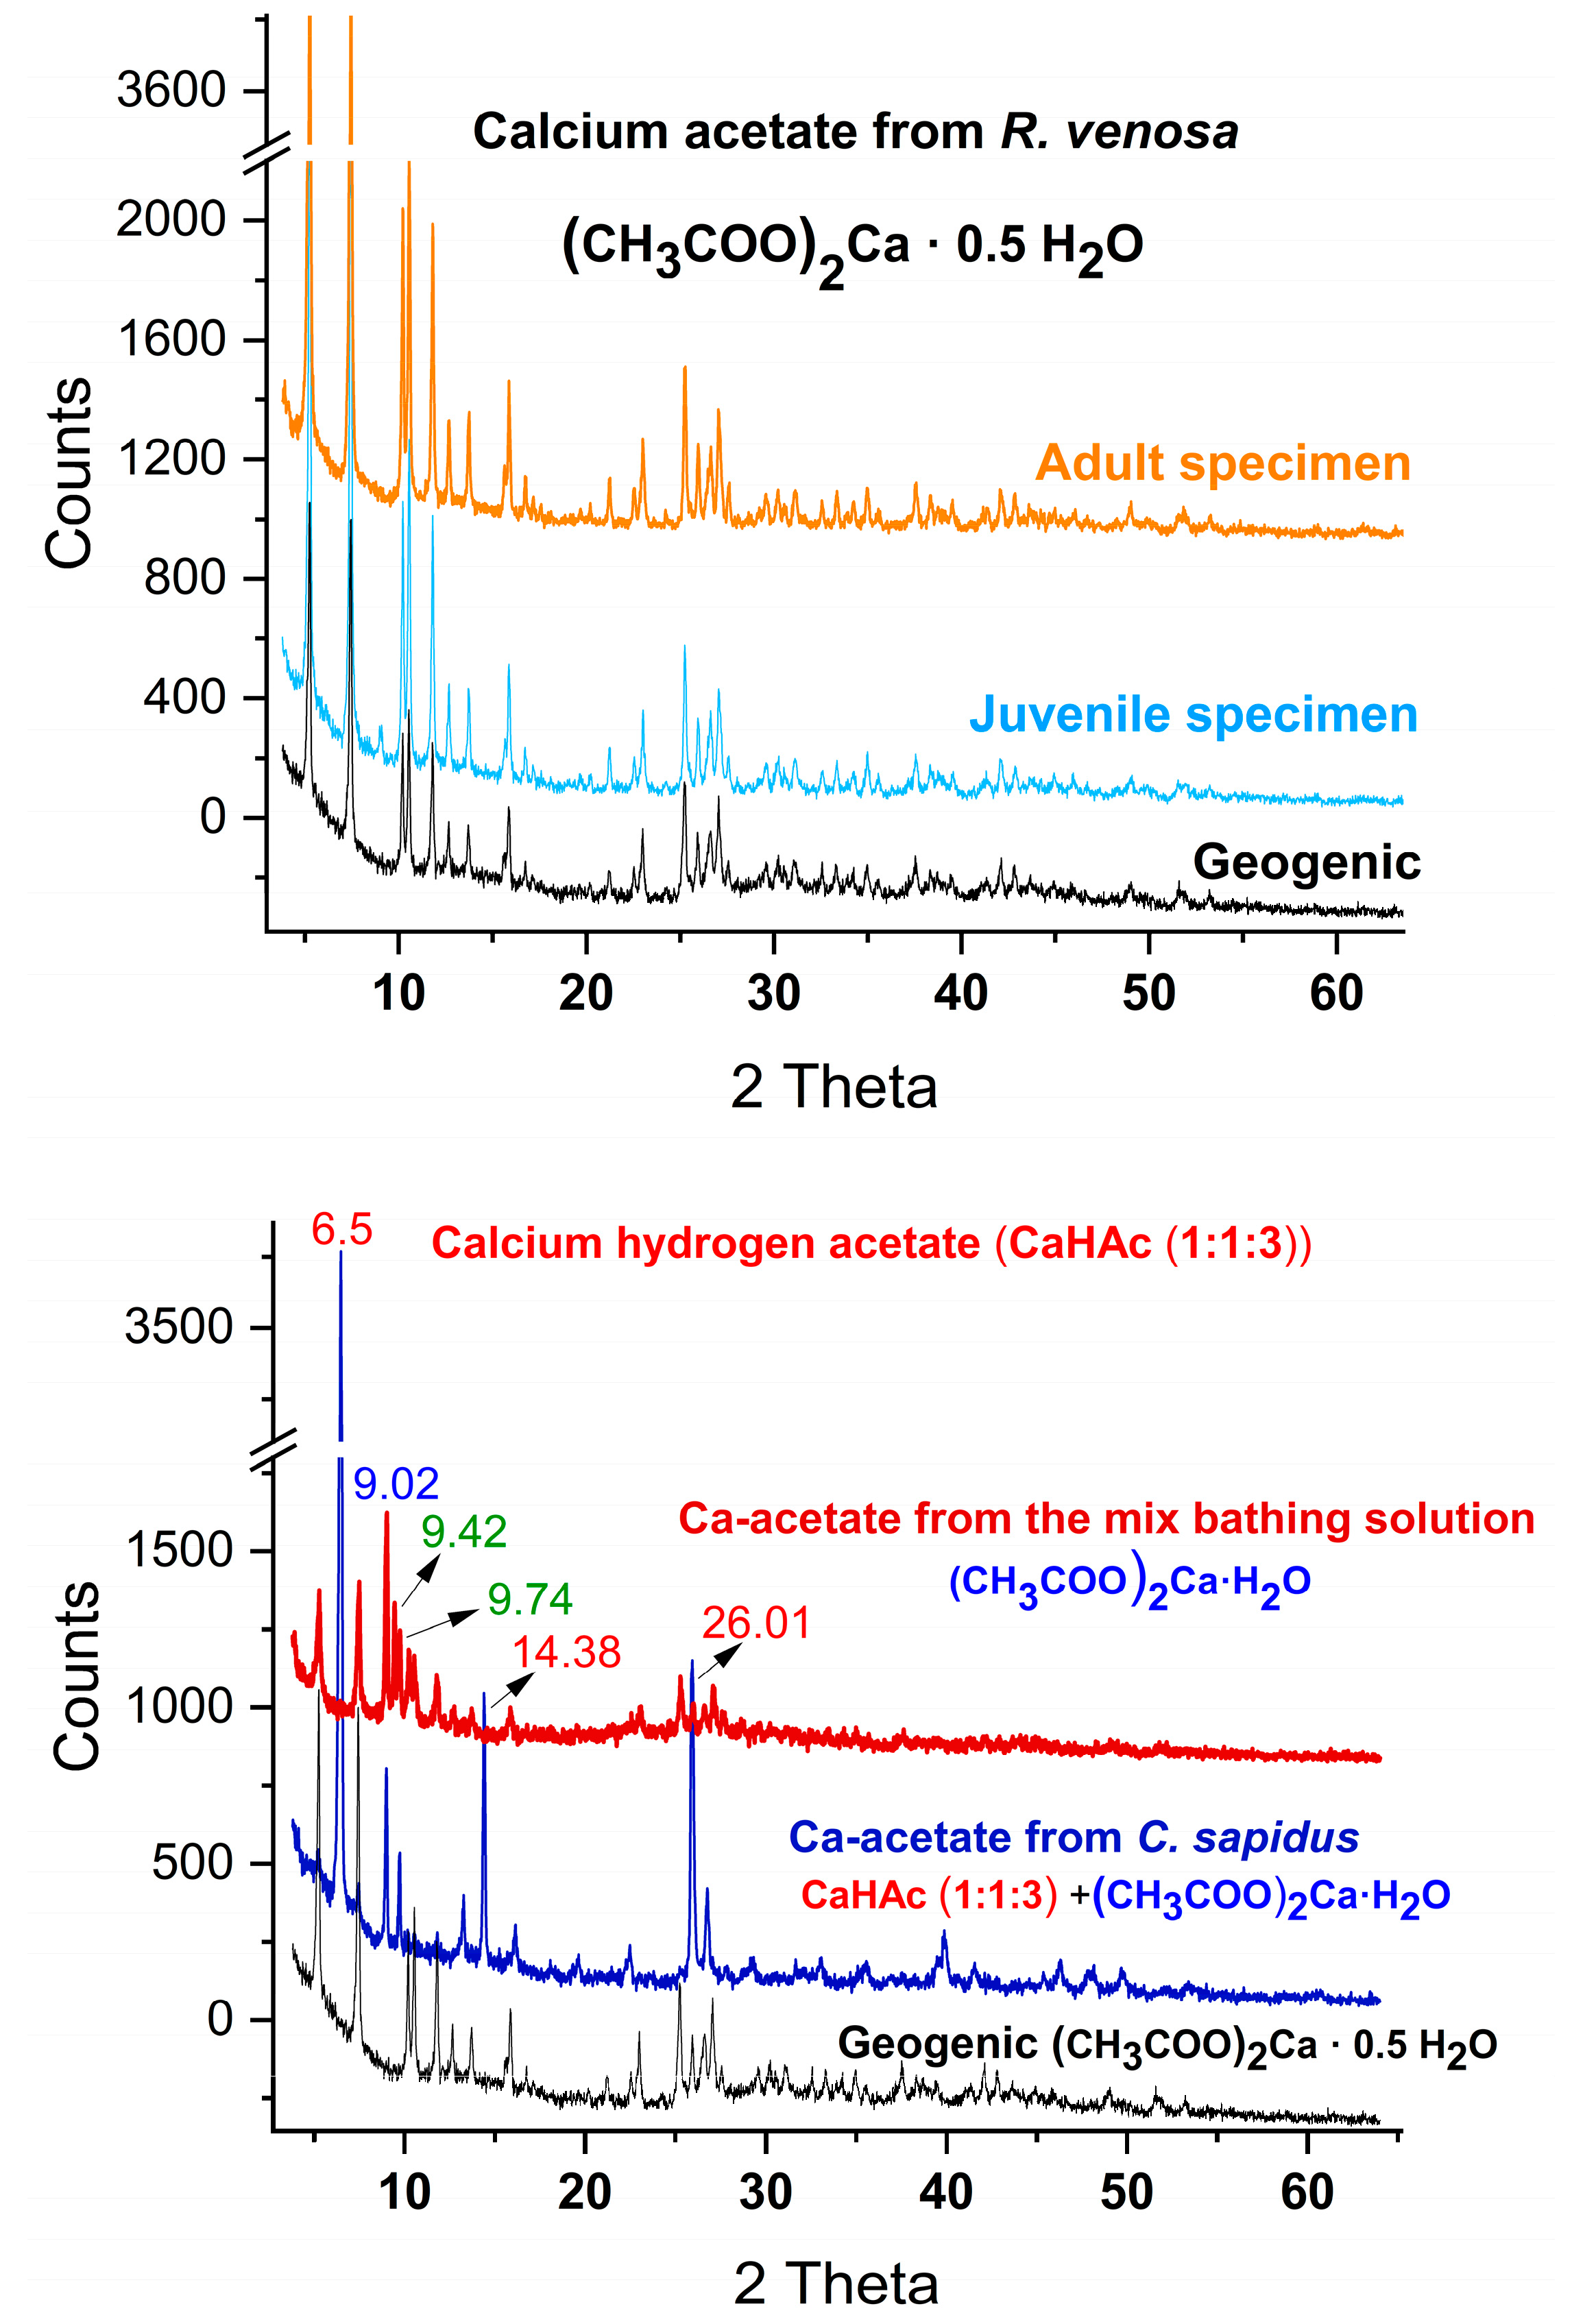
3.4. Validation of the Demineralized Intact Foil Product Content Using X-ray Diffraction

The X-ray diffraction patterns of the demineralized foils from each of the three studied crustacean species are shown in Figure 5. The presence of the characteristic peaks corresponding to the poly-glucosamine functional group, which are indicative of the structural framework of the chitin biopolymer, confirmed the demineralized foils’ chitin content. The diffraction peaks were recorded around the following 2θ values: 9.2°, 19.3°, 23.4°, and 39°. These findings suggest that all three biological demineralized specimen fragments exhibit the same chitin semi-crystalline structure signal, consistent with previously reported characteristics of chitin extracted from insects and cuttlebone [24].

3.5. Validation of the Calcium Acetate By-Product Using X-ray Diffraction Patterns of the Crystallized Compound from Acetate Bath Solutions

Aside from the production of demineralized biological shells, acetic acid treatment of the crustaceans’ cuticle and vinegar treatment of the gastropod resulted in a calcium acetate by-product, a chemical of high interest in the medical field.
According to the XRD data of the calcium acetate resulting from the evaporated demineralization bathing liquid of the crustacean shells, the saturated solution indicates a mixture of at least three distinct compounds: calcium acetate monohydrate, calcium acetate hemihydrate (calcium acetate half-hydrate) [25], and two additional peaks at 9.42° and 9.74° (Figure 6), which can be possibly assigned to calcium magnesium acetate hydrate, as previously noted [26].
The calcium acetate produced from the blue crab (C. sapidus) is in fact a mixture of calcium hydrogen acetate (CaHAc 1:1:3) and calcium acetate monohydrate, while the geogenic form described above, and produced as a reference, is composed of the half-hydrate form ((CH3COO)2Ca ∙ 0.5 H2O), as the X-ray diffraction patterns show. This form was the only one resulting from the comparative demineralization solutions of the two randomly selected R. venosa specimens, appearing as a more pink or blue pigmented shell color. From these comparative data, we can conclude that using R. venosa shell waste for calcium acetate production might be more effective and deserves more elaborate study (under development); these findings may be explained by the lower magnesium content of the R. venosa mineral shell, containing a mixture of aragonite and calcite polymorphs of calcium carbonate. In the case of the crustacean shells, the chitin flexible foils resulting from whole-cuticle macro-fragments as a compact polymer could be recovered, preserving their shape integrity, while the organic component of the demineralized R. venosa shells, where chitin is not present, was dispersed in the acetic acid solution once the biomineral component was dissolved.

3.6. Validation of the Calcium Acetate By-Product Using Raman spectra of the Crystallized Compound from Acetate Bath Solutions

To comprehend the structural variations between the obtained calcium acetate hydrates, Raman spectroscopic analyses of the powdered Ca-acetate by-products were conducted in addition to X-ray diffraction. As shown in Figure 7, calcium acetate derived from R. venosa, both from adult, orange pigmented specimen and the one from a blue pigmented specimen exhibited Raman bands similar to those from the geogenic compound [27]. Regarding the calcium acetate forms obtained from crustaceans, both mixed and only from C. sapidus, the Raman spectra showed the presence of specific vibrational bands of the geogenic form, but their profile is slightly different. Notable differences are observed in the case of C. sapidus calcium acetate by the new vibrational bands at 1697 cm−1 and 903 cm−1 assigned to calcium hydrogen acetate as well as the shift of the 1467 cm−1 signal. These marked differences can be attributed to the saturation of the bathingsolution, and the co-existence of two acetate forms, also confirmed by the XRD analyses.

3.7. Demineralization Process Tracked with a Handheld TacticID Raman System

Using the hand-held Raman instrument, we were able to record the signal of the acetic acid bath solution comprising intact crustacean cuticle fragments exposed to the demineralization process, as well as the minerals in various stages of demineralization. Additionally, three isolated and crystalized calcium acetate by-products could be tracked through the recipient or plastic bag sample. The advantage of the hand-held Raman system relies on the possibility of accurately recording the Raman spectrum of the bathing solution through the glass container. Thus, it is effective for controlling the bathing solution in terms of reagent consumption, the occurrence of the dissolved compounds during reaction, and the status of the intact fragments regarding their calcium carbonate dissolution, as illustrated in Figure 8A. During the process, the TacticID Raman instrument was used for detection of the chitin bands in the treated C. sapidus shell fragment after one week of the acetic acid treatment (Figure 8B). The occurrence of the chitin bands in comparison with the reference α-chitin shows linear correlation (R2 = 0.998 and Pearson’s r = 0.998), demonstrating the value of the employment of the system for optimizing the demineralization process (Figure 8C).
Compared to the lab-based Raman system, where excitation with 785 nm of the demineralized shells in various stages results in a highly fluorescent background, with several steps needed to process multiple data (Supplementary Figure S1), the hand-held system incorporated technology to instantly “see” the processed signal without additional work-loading. The observed Raman bands collected from the resulting intact demineralized shell fragments of the three crustacean species are summarized in Table 1, together with their assignment. In addition to the chitin bands, clearly observed either with the lab-based or with the portable handheld instrument, several additional bands were observed, which might be attributed to proteins or lipids [28]. The by-products (crystalline calcium acetate) were identified through the plastic bag, as samples used in other validation techniques, and confirmed the identity of the product.

3.8. Surface Morphology of the Demineralized Crustacean Foils Determined with SEM

SEM images show surface morphology of the treated cuticle shells at the end of the acetic acid treatment (65 days). The surface morphology of the transparent polymeric foils derived from C. sapidus fragment shells shows the long, unbroken fiber texture of chitin (Figure 9). Additionl images and semi-quantitative analyses of the demineralized crustacean foils determined with SEM-EDX are given in the supplementary material (Figure S2).

4. Conclusions and Outlook

The demineralization process of the waste biogenic carbonates from crustacean and sea snail shells can be optimized and controlled by using Raman techniques and technologies. Optimization could involve monitoring the rate of waste shell demineralization in a time-dependent manner. Such process control is non-destructive and does not compromise the shells. Besides using Raman spectroscopy in laboratory settings, hand-held Raman instruments are promising and more convenient tools for monitoring the demineralization process. Moreover, obtaining chitin-based polymeric materials from the carapace or fragments of the crustacean shells, along with the recovery of calcium acetate as a by-product of interest, which can be crystalized from the treatment bath solution, exemplifies a bioeconomic process. Biogenic calcium acetate was also produced through the environmentally friendly demineralization process of R. venosa shells. Overall, the implementation ofRaman techniques and technologies can be a relevant and convenient tool for successful demineralization processes, increasing the reutilization of marine waste shells for obtaining compounds of interest, such as chitin and calcium acetate, with various applications.
The chitin-based polymeric materials are of increasing interest in the light of proposing a future circular carbon and plastic economy [33] centered on several targets, such as reducing and eliminating 50% of all plastic materials and products, replacing all fossil-fuel-based plastics with those sourced from alternative bio-based waste, accelerating carbon recirculation through the use of biomass and CO2, minimizing the environmental footprint, and maximizing recycling. We expect to use such tools to achieve these goals in finding technical solutions, from waste to new-generation polymeric materials, through sustainable approaches to convert aquatic waste into recyclable polymers.
The conventional demineralization process is conducted using aggressive chemicals, such as hydrochloric acid, and the progressive decomposition of calcium carbonate into water-soluble calcium salts is rarely investigated, unless the final products are taken, filtered, washed and examined. The process is eventually repeated with one or more optimized parameters. After separation by filtration to recover the chitin residue, the residual bath that is left over is eventually discarded, while the solid residue, after extensive washing, is the subject of acidimetric titration to prove its identity (chitin in the case of biogenic carbonates from crustaceans). Titration, a conventional, well-established method, involves chemicals, pH control, and additional workload to complete the description of the demineralization process products. Such processes involve dependencies, and their understanding allows repeated and optimized new processes. These dependencies include the dissolution of respective minerals, which is species-specific; reaction time, temperature, and milling procedures to transform shell fragments in powders; and eventual calibration by milling to control particle size, distribution, acid concentration, and solute-to-solvent ratio, just to name a few. In the approach described here, a significant number of these steps are surpassed.
Regarding the implementation of an in-line tool for demineralization process control, seven major steps and considerations are highlighted:
  • Understanding the process: based on the previous studies within our group [5,6,7,8,9], robust knowledge on the structure, morphology, and distribution of organic and inorganic components of the shell waste as well as the dependencies of the Raman signal on the material status (waste shells derived from fresh or cooked seafood products) is needed to control the process. Thus, the parameters to be controlled are the presence of the carbonate Raman bands on shells under process, the persistence of the carotenoid as organic components in shells or their release in solution, the solution status (acetic acid Raman bands decreasing while acetate bands increasing), and the critical quality attributes of the final product.
  • Characterization of raw waste material to check the initial mineral content, composition, and properties. This baseline data served as a reference for assessing the effectiveness of the demineralization process of the given raw material stock.
  • Selecting the suitability of the Raman monitoring techniques, bearing in mind the classical demineralization approach, reporting only the final product characteristics and ideas to optimize a new approach with several improved parameters. This involves many chemicals and operations, to read out the properties of the final product, without considering the intermediary steps, which can be tailored according to the indicated Raman signal of the intermediary status of product.
  • The efficiency of the in-line monitoring techniques, to provide meaningful information during the demineralization process (for example, the presence of a carbonate Raman signal on the material and the presence of the acetic acid Raman band in solution). Depending on the signal, a decision can be made, such as to remove the material if a carbonate band is absent or to supply more acetic acid if the acetate solution is saturated and the process is incomplete. Classically, this issue may include multiple techniques and workloads, such as conductivity measurement, pH monitoring, specific ion analysis, or other relevant metrics specific to shell demineralization.
    Here, factors such as sensitivity, accuracy, reliability, compatibility with shell material, and ease of integration into the production line could be evaluated by comparing the hand-held Raman instrument performance with the lab-based instrument performance on the same materials.
  • For an upscaled approach, comparable with the industrial environment, integration with the production line can be performed, including monitoring Raman equipment requesting of minimal integration solutions without burdening the existing process equipment and control systems, since the minimal parameters to control are defined (carbonate, chitin, and acetate Raman signal monitoring in optimized acquisition conditions, after understanding dependencies).
  • For calibration and validation of the in-line monitoring equipment, the manufacturer specifications are easy to calibrate, with minimal training of operators (or AI-integrated solutions), and validate, in terms of the performance under actual operating conditions, using representative samples of shell material and lab-based techniques as well as complementary techniques to evaluate the Raman output information.
  • Additionally, decision-making tools during the process allow the implementation of a feedback control loop, using Raman data from the in-line monitoring tool to adjust process parameters in real time, which may include (but are not limited to) the use of sorted raw materials or mixtures, milled or raw grinded materials, temperature, bath solutions, or other factors to optimize demineralization efficiency according to the specific purpose regarding final product composition, quality and morphology, and continuous improvement.
According to the present results, these tailored steps can be effectively implemented as an in-line tool for shell demineralization process control, ensuring consistent quality and performance of the demineralized shell material for various applications or industrial demand.

Supplementary Materials

The following supporting information can be downloaded at: https://www.mdpi.com/article/10.3390/pr12040832/s1, Figure S1: Recorded Raman spectra without any processing, with the spectral acquisition parameters. Parameters are shown in this manner: exposure time, number of acquisitions, laser power, magnification objective for lab-based instrument, laser line/nm; Figure S2: SEM images of the surface morphology of the acetic acid bath treated cuticle of three species with the corresponding EDX graphs; C. sapidus (A), S. mantis (B), M. squinado (C); Video S1: Demonstration of the flexibility of the intact, transparent, demineralized foil products resulted from the three crustacean species after 65 days of acetic acid treatment.

Author Contributions

Conceptualization, S.C.P.; methodology, S.C.P., I.-C.P., K.M. and D.-A.D.; validation, S.C.P., I.-C.P., K.M., T.-L.T., D.-A.D., and B.N.; formal analysis, S.C.P., K.M. and I.-C.P.; investigation, S.C.P., I.-C.P., K.M., D.-A.D., F.N.,T.-L.T., L.B.-T. and B.N.; resources, S.C.P., F.N., D.-A.D. and B.N.; data curation, S.C.P., K.M., I.-C.P., L.B.-T. and B.N.; writing—original draft preparation, I.-C.P. and K.M.; writing—review and editing, S.C.P., I.-C.P., K.M., D.-A.D., T.-L.T. and B.N.; visualization, S.C.P., I.-C.P., K.M., D.-A.D., L.B.-T., T.-L.T., F.N. and B.N.; supervision, S.C.P. All authors have read and agreed to the published version of the manuscript.

Funding

This research received no external funding.

Data Availability Statement

Data supporting the reported results are included in the manuscript and supplementary information.

Conflicts of Interest

Author Neculai Bogdan was employed by the company Metrohm Analytics Romania SRL. The remaining authors declare that the research was conducted in the absence of any commercial or financial relationships that could be construed as a potential conflict of interest. The [company Metrohm Analytics Romania SRL in affiliation] had no role in the design of the study; in the collection, analyses, or interpretation of data; in the writing of the manuscript, or in the decision to publish the results.

References

  1. Bioeconomy Strategy—European Comission, Research-and-Innovation.ec.europa.eu. Available online: https://research-and-innovation.ec.europa.eu/research-area/environment/bioeconomy/bioeconomy-strategy_en (accessed on 20 February 2024).
  2. Glamuzina, B.; Vilizzi, L.; Piria, M.; Žuljević, A.; Cetinić, A.B.; Pešić, A.; Dragičević, B.; Lipej, L.; Pećarević, M.; Bartulović, V.; et al. Global warming scenarios for the Eastern Adriatic Sea indicate a higher risk of invasiveness of non-native marine organisms relative to current climate conditions. Mar. Life Sci. Technol. 2023, 6, 143–154. [Google Scholar] [CrossRef] [PubMed]
  3. Marchessaux, G.; Gjoni, V.; Sarà, G. Environmental drivers of size-based population structure, sexual maturity and fecundity: A study of the invasive blue crab Callinectes sapidus (Rathbun, 1896) in the Mediterranean Sea. PLoS ONE 2023, 18, e0289611. [Google Scholar] [CrossRef] [PubMed]
  4. EC—Commission of the European Communities. Green Paper on the Management of Bio-Waste in the European Union. COM(2008) 811 Final. Available online: https://eur-lex.europa.eu/legal-content/EN/TXT/PDF/?uri=CELEX:52008DC0811&from=EN (accessed on 19 December 2022).
  5. Nekvapil, F.; Pinzaru, S.C.; Barbu–Tudoran, L.; Suciu, M.; Glamuzina, B.; Tamaș, T.; Chiș, V. Color-specific porosity in double pigmented natural 3d-nanoarchitectures of blue crab shell. Sci. Rep. 2020, 10, 3019. [Google Scholar] [CrossRef] [PubMed]
  6. Nekvapil, F.; Aluas, M.; Barbu-Tudoran, L.; Suciu, M.; Bortnic, R.-A.; Glamuzina, B.; Pinzaru, S.C. From Blue Bioeconomy toward Circular Economy through High-Sensitivity Analytical Research on Waste Blue Crab Shells. ACS Sustain. Chem. Eng. 2019, 7, 16820–16827. [Google Scholar] [CrossRef]
  7. Lazar, G.; Nekvapil, F.; Hirian, R.; Glamuzina, B.; Tamas, T.; Barbu-Tudoran, L.; Pinzaru, S.C. Novel Drug Carrier: 5-Fluorouracil Formulation in Nanoporous Biogenic Mg-calcite from Blue Crab Shells—Proof of Concept. ACS Omega 2021, 6, 27781–27790. [Google Scholar] [CrossRef] [PubMed]
  8. Lazar, G.; Nekvapil, F.; Glamuzina, B.; Tamaș, T.; Barbu-Tudoran, L.; Suciu, M.; Cinta Pinzaru, S. pH-Dependent Behavior of Novel 5-FU Delivery System in Environmental Conditions Comparable to the Gastro-Intestinal Tract. Pharmaceutics 2023, 15, 1011. [Google Scholar] [CrossRef] [PubMed]
  9. Nekvapil, F.; Mihet, M.; Lazar, G.; Pinzaru, S.C.; Gavrilović, A.; Ciorîță, A.; Levei, E.; Tamaș, T.; Soran, M.-L. Comparative Analysis of Composition and Porosity of the Biogenic Powder Obtained from Wasted Crustacean Exoskeletonsafter Carotenoids Extraction for the Blue Bioeconomy. Water 2023, 15, 2591. [Google Scholar] [CrossRef]
  10. Nekvapil, F.; Ganea, I.-V.; Ciorîță, A.; Hirian, R.; Tomšić, S.; Martonos, I.M.; Cintă Pinzaru, S. A New Biofertilizer Formulation with Enriched Nutrients Content from Wasted Algal Biomass Extracts Incorporated in Biogenic Powders. Sustainability 2021, 13, 8777. [Google Scholar] [CrossRef]
  11. Nekvapil, F.; Ganea, I.-V.; Ciorîță, A.; Hirian, R.; Ogresta, L.; Glamuzina, B.; Roba, C.; Cintă Pinzaru, S. Wasted Biomaterials from Crustaceans as a Compliant Natural Product Regarding Microbiological, Antibacterial Properties and Heavy Metal Content for Reuse in Blue Bioeconomy: A Preliminary Study. Materials 2021, 14, 4558. [Google Scholar] [CrossRef]
  12. Younes, I.; Rinaudo, M. Chitin and Chitosan Preparation from Marine Sources. Structure, Properties and Applications. Mar. Drugs 2015, 13, 1133–1174. [Google Scholar] [CrossRef]
  13. Gadgey, K.K.; Bahekar, A. Studies on extraction methods of chitin from crab shell and investigation of its mechanical properties. IJMET 2017, 8, 220–231. [Google Scholar]
  14. Gortari, M.C.; Hours, R.A. Biotechnological processes for chitin recovery out of crustacean waste: A mini-review. Electron. J. Biotechnol. 2013, 16, 14. [Google Scholar] [CrossRef]
  15. GRAS Notice (GRN) No. 712. Available online: https://www.fda.gov/Food/IngredientsPackagingLabeling/GRAS/NoticeInventory/default.htm (accessed on 3 March 2024).
  16. Iftekhar Shams, M.d.; Nogi, M.; Berglund, L.A.; Yano, H. The transparent crab: Preparation and nanostructural implications for bioinspired optically transparent nanocomposites. Soft Matter 2012, 8, 1369–1373. [Google Scholar] [CrossRef]
  17. De Oliveira, L.N.; De Oliveira, V.E.; D’ávila, S.; Edwards, H.G.M.; De Oliveira, L.F.C. Raman spectroscopy as a tool for polyunsaturated compound characterization in gastropod and limnic terrestrial shell specimens. Spectrochim. Acta Part. A Mol. Biomol. Spectrosc. 2013, 114, 541–546. [Google Scholar] [CrossRef]
  18. Wehrmeister, U.; Jacob, D.E.; Soldati, A.L.; Loges, N.; Häger, T.; Hofmeister, W. Amorphous, nanocrystalline and crystalline calcium carbonates in biological materials. J. Raman Spectrosc. 2011, 42, 926–935. [Google Scholar] [CrossRef]
  19. Hegna, T.A.; Czaja, A.D.; Rogers, D.C. Raman spectroscopic analysis of the composition of the clam-shrimp carapace (Branchiopoda: Laevicaudata, Spinicaudata, Cyclestherida): A dual calcium phosphate-calcium carbonate composition. J. Crustac. Biol. 2020, 40, 756–760. [Google Scholar] [CrossRef]
  20. Metrohm. Available online: https://www.metrohm.com/ro_ro/products/b/wt-8/bwt-840000920.html (accessed on 21 February 2024).
  21. Watling, L.; Thiel, M. (Eds.) . The Natural History of the Crustacea; Oxford University Press: Oxford, UK; New York, NY, USA, 2013; pp. 141–148. [Google Scholar]
  22. Dahmane, E.M.; Taourirte, M.; Eladlani, N.; Rhazi, M. Extraction and Characterization of Chitin and Chitosan from Parapenaeus longirostris from Moroccan Local Sources. Int. J. Polym. Anal. Charact. 2014, 19, 342–351. [Google Scholar] [CrossRef]
  23. Vino, A.B.; Ramasamy, P.; Shanmugam, V.; Shanmugam, A. Extraction, characterization and in vitro antioxidative potential of chitosan and sulfated chitosan from Cuttlebone of Sepia aculeata Orbigny, 1848. Asian Pac. J. Trop. Biomed. 2012, 2, S334–S341. [Google Scholar] [CrossRef]
  24. Kaya, M.; Sargin, I.; Aylanc, V.; Tomruk, M.N.; Gevrek, S.; Karatoprak, I.; Colak, N.; Sak, Y.G.; Bulut, E. Comparison of bovine serum albumin adsorption capacities of α-chitin isolated from an insect and β-chitin from cuttlebone. J. Ind. Eng. Chem. 2016, 38, 146–156. [Google Scholar] [CrossRef]
  25. Musumeci, A.W.; Frost, R.L.; Waclawik, E.R. A spectroscopic study of the mineral paceite (calcium acetate). Spectrochim. Acta Part. A Mol. Biomol. Spectrosc. 2007, 67, 649–661. [Google Scholar] [CrossRef]
  26. Miller, J.R.; LaLama, M.J.; Kusnic, R.L.; Wilson, D.E.; Kiraly, P.M.; Dickson, S.W.; Zeller, M. On the nature of calcium magnesium acetate road deicer. J. Solid. State Chem. 2019, 270, 1–10. [Google Scholar] [CrossRef]
  27. Koleva, V. Vibrational Behavior of Calcium Hydrogen Triacetate Monohydrate, CaH(CH3COO)3H2O. Croat. Chem. Acta 2005, 78, 581–591. [Google Scholar]
  28. Khoushab, F.; Yamabhai, M. Chitin Research Revisited. Mar. Drugs 2010, 8, 1988–2012. [Google Scholar] [CrossRef]
  29. Socrates, G. Infrared and Raman Characteristic Group Frequencies: Tables and Charts, 3rd ed.; Wiley: Chichester, UK; New York, NY, USA; Weinheim, Germany, 2001; pp. 51–52. [Google Scholar]
  30. Zając, A.; Hanuza, J.; Wandas, M.; Dymińska, L. Determination of N-acetylation degree in chitosan using Raman spectroscopy. Spectrochim. Acta Part. A Mol. Biomol. Spectrosc. 2015, 134, 114–120. [Google Scholar] [CrossRef]
  31. Agbaje, O.B.A.; Brock, G.A.; Zhang, Z.; Duru, K.C.; Liang, Y.; George, S.C.; Holmer, L.E. Biomacromolecules in recent phosphate-shelled brachiopods: Identification and characterization of chitin matrix. J. Mater. Sci. 2021, 56, 19884–19898. [Google Scholar] [CrossRef]
  32. Nekvapil, F.; Glamuzina, B.; Barbu-Tudoran, L.; Suciu, M.; Tămaş, T.; Pinzaru, S.C. Promoting hidden natural design templates in wasted shells of the mantis shrimp into valuable biogenic composite. Spectrochim. Acta Part. A Mol. Biomol. Spectrosc. 2021, 250, 119223. [Google Scholar] [CrossRef]
  33. Vidal, F.; Van Der Marel, E.R.; Kerr, R.W.F.; McElroy, C.; Schroeder, N.; Mitchell, C.; Rosetto, G.; Chen, T.T.D.; Bailey, R.M.; Hepburn, C.; et al. Designing a circular carbon and plastics economy for a sustainable future. Nature 2024, 626, 45–57. [Google Scholar] [CrossRef]
Figure 1. (A) Untreated anatomical parts: carapace fragments (a) and ventral fragment (b) of C. sapidus; cuticle segments of abdomen (c), uropod (d), and telson cuticle (e) from S. mantis; carapace of M. squinado (f); (B) crustacean anatomical shell fragments after exposure to acetic acid for 65 days: carapace fragment (a) and ventral fragment (b) of C. sapidus; cuticle segment of abdomen (c), uropod (d) and telson cuticle (e) from S. mantis; carapace of M. squinado (f); (C) adult R. venosa shell during vinegar demineralization (a) and after 14 days of treatment in ventral (b) and lateral (c) view.
Processes 12 00832 g001
Figure 2. Raman spectra evolution of the biogenic material from C. Sapidus (A), S. mantis (B), and M. squinado (C) at various times (indicated as hours or days) during the acetic acid demineralization process, using a 785 nm laser line, compared to the reference spectrum of α-chitin, as indicated. The blue spectra show the reference signal of calcium carbonate to highlight its disappearance in the final products.
Processes 12 00832 g002
Figure 3. Pigments detected in the raw crustacean shells of C. sapidus (A), S. mantis (B), and M. squinado (C) under resonant Raman excitation with 532 nm for carotenoids (green line) and 633 nm for carotenoproteins (red line) before demineralization, and after 14 days of exposure to the acetic acid bath solution with 532 nm (top spectra, navy blue line in each case).
Processes 12 00832 g003
Figure 4. FT-IR spectra of the intact, transparent, demineralized foil products resulting from the three crustacean species after 65 days of acetic acid treatment: S. mantis (blue line), C. sapidus (black line), and M. squinado (red line).
Processes 12 00832 g004
Figure 5. XRD diffraction patterns of the intact, transparent, demineralized foil products resulting from the three crustacean species after 65 days of acetic acid treatment: C. sapidus (black line), S. mantis (blue line), and M. squinado (red line).
Processes 12 00832 g005
Figure 6. XRD pattern of the calcium acetate hemihydrate by-products from R. venosa snail (top panel), from an adult specimen featuring pink shell color (orange spectrum) and from the blue pigmented shells (light-blue plotted diffractogram). Calcium acetate by-products from crustaceans (bottom panel) show different hydrated forms of Ca-acetate from the bathing solution of mixed crustacean shells (dark-red line), Ca-acetate from C. sapidus as a mixture of Ca-hydrogen acetate and hydrate (navy-blue line), and geogenic Ca-acetate hemihydrate (black line), as indicated on each diffractogram. Additional peaks in the Ca-acetate from the bathing solution of mixed crustacean shells (dark-red line) are plotted in green, indicating other contributions.
Processes 12 00832 g006
Figure 7. Raman Spectra of the calcium acetate hydrates formed in the demineralization bath solutions of tested pink-orange pigmented (orange line) and blue pigmented R. venosa (light-blue line) specimens, mixed crustacean specimens (dark-red line), and C. sapidus (navy-blue line), compared to the geogenic calcium acetate (black line).
Processes 12 00832 g007
Figure 8. Using a TacticID Raman hand-held instrument to control the demineralization process: images of the instrument at work and the displayed Raman spectra of the acetic acid bath solution (A), measured through the demineralization glass container (upper image, red line in the graph) and through its holder accessory for liquids (lower image, green line in the graph). (B) Setup of measurement of C. sapidus fragments: untreated (down-left image, green line in the graph), showing the strong calcium carbonate signal of raw shells and their disappearance after acetic acid treatment (down-right image, red line in the graph). The chitin reference signal is shown for comparison. Excitation: 1064 nm. (C) Linear correlation (R2 = 0.998, Pearson’s r = 0.998) of the chitin bands recorded with TacticID Raman hand-held instrument from the final foil product, with the standard α-chitin bands recorded with a lab-based instrument.
Processes 12 00832 g008
Figure 9. SEM images of the surface morphology of the chitin foils derived from the C. sapidus cuticle. Scale bar: 100 μm (left); 50 μm (right).
Processes 12 00832 g009
Table 1. Summarized Raman bands observed in spectra of the demineralized, chitin-based foil products derived from the three crustacean species, compared to the pure α-chitin [29,30,31,32].
Chitin-Based Foil from C. sapidusWaste Shell of C. sapidusWaste Fragment of M. squinadoWaste Shell
S. mantis (Abdomen Cuticle)
α-Chitin
Raman Bands/cm−1
Assignments
Hand-held
TacticID
Raman
Instrument,
1064 nm
Renishaw InVia Reflex Raman system, 785 nmRenishaw InVia Reflex Raman system, 785 nmRenishaw InVia Reflex Raman system, 785 nm
250253 254253 δ C N H C ,
γ ( O H )
325325 325325 γ O H ,
γ ( ϕ )
366
369369
373 373
395395 397
457456 457458 d C C C   r i n g
499501 501499 C C
s k e l e t a l   b a c k b o n e
527 530
567565 566 d C C ,
δ o p O H
599 599 τ C C ,
δ C O ,
δ C H ,
ν P O 4 3
658650 649 τ C C ,
δ C O ,
δ C H
755709 710 δ o p C O ,
δ o p C H ,
d N H
899894898894899 d C H x
955953955952955 δ C H 3 ,    δ C O H
10591059 1059 ν C O ,
ν C C ,
r i n g
11091109 11081109 ν s C O C ,   r i n g
1146 11471149 ν a s C O C
12661263126812651266Amide III,
ν C H
δ i p N H
δ i p C = O
13371328 13301328Amide III, δ s C H 3
13731372 13741378 ρ C C H 2
δ C C H 3
14161414 14151415 ω C H 2 , ν s C O O
145114481451 1451 δ C H 2 ,
δ a s C H 3
16291620 16211622Amide I, δ N H
16631657 16581657Amide I,
ν C O
Out of the instrument range2880 28822881 ν s C H 2
2913 2909 ν s C H 3
2937293729372936 ν a s C H 2
2958 2963 ν a s C H 3
ν s = symmetrical stretching, ν a s = asymmetrical stretching, δ = bending, δ s = symmetrical bending, δ a s = asymmetrical bending, δ i p = in-plane bending, δ o p = out-of-plane bending, ρ   = rocking, τ = twisting, ω = wagging, d = deformation.
Disclaimer/Publisher’s Note: The statements, opinions and data contained in all publications are solely those of the individual author(s) and contributor(s) and not of MDPI and/or the editor(s). MDPI and/or the editor(s) disclaim responsibility for any injury to people or property resulting from any ideas, methods, instructions or products referred to in the content.

