Article

Interpretation of Cellular Imaging and AQP4 Quantification Data in a Single Cell Simulator

Laboratory for Product and Process Design, Department of Bioengineering, University of Illinois at Chicago, 851 South Morgan St. 218 SEO, Chicago, IL 60607, USA
*
Author to whom correspondence should be addressed.
Processes 2014, 2(1), 218-237; https://doi.org/10.3390/pr2010218
Submission received: 22 July 2013 / Revised: 21 January 2014 / Accepted: 22 January 2014 / Published: 4 March 2014
(This article belongs to the Special Issue Feature Papers)

Abstract

:
The goal of the present study is to integrate different datasets in cell biology to derive additional quantitative information about a gene or protein of interest within a single cell using computational simulations. We propose a novel prototype cell simulator as a quantitative tool to integrate datasets including dynamic information about transcript and protein levels and the spatial information on protein trafficking in a complex cellular geometry. In order to represent the stochastic nature of transcription and gene expression, our cell simulator uses event-based stochastic simulations to capture transcription, translation, and dynamic trafficking events. In a reconstructed cellular geometry, a realistic microtubule structure is generated with a novel growth algorithm for simulating vesicular transport and trafficking events. In a case study, we investigate the change in quantitative expression levels of a water channel-aquaporin 4-in a single astrocyte cell, upon pharmacological treatment. Gillespie based discrete time approximation method results in stochastic fluctuation of mRNA and protein levels. In addition, we compute the dynamic trafficking of aquaporin-4 on microtubules in this reconstructed astrocyte. Computational predictions are validated with experimental data. The demonstrated cell simulator facilitates the analysis and prediction of protein expression dynamics.

1. Introduction

Advancements in optical imaging, microscopy, and quantitative techniques in molecular biology allow the measurement of protein expression levels, localization, and dynamic trafficking events in a single cell or a population of cells. The entire “life-story” of a protein including the transcriptional activation of its gene, mRNA generation and processing, translation, transport of the mature protein to its subcellular destination and its eventual degradation dynamics can be measured with different molecular biology techniques. For example, the temporal evolution of protein expression after exposure to a pharmacological agent is commonly detected by techniques like western blotting. Quantitative methods like proteomics profiling or pulse-chase radioisotope labeling can measure the kinetic rates of transcription, translation and degradation. The dynamics of protein trafficking and transport are captured by using immunofluorescence labeling techniques or through the use of fusion proteins, where the target protein is tagged with a fluorescent molecule for visualization [1,2].
With fluorescent tags like quantum dots [3], single molecule tracking of surface proteins [4,5], motor proteins [6,7], and intracellular protein trafficking [8] can reveal spatial trajectories of proteins of interest within a live cell or on the cellular membrane. If these datasets on gene activation, protein expression and dynamic spatial localization can be integrated, it could lead to the prediction of cellular behavior under different conditions. However, the joint interpretation of quantitative data collected at discrete time points (such as western blotting and quantitative PCR) with imaging data that describes protein localization and transport (such as immunofluorescence) requires a model that contains subcellular to account for the discrete nature of intracellular events occurring in signaling and control of cellular domains, including the cytoskeleton which serves as the backbone for trafficking events. The successful integration of cellular data with spatial information and temporal quantitative measurements by means of a mathematical, mechanistic model of the whole cell can enable the precise prediction of expression level changes in the cellular system.
For the prototype cell simulator, we use stochastic simulations transcription and translation [9,10]. Our methodology further incorporates imaging data of cellular morphology and allows the delineation of subcellular organelles, compatible with image sets derived from confocal microscopy or electron microscopy. The model receives different types of biological data as input, in the forms of absolute concentrations, relative concentrations, or kinetic rates. This computational model also enables derivation of rates of transcription, protein synthesis, and degradation from a combination of indirect measurements that do not contain rate information (such as expression level changes of protein and transcripts). Hence, the simulator can function to extract additional information about a system from existing data points by the simultaneous interpretation of various datasets.
By incorporating kinetic data of protein synthesis and transport rates into the cell simulator, we can (1) predict the spatiotemporal distribution of a protein in response to a pharmacological stimulus; (2) quantify how a drug can alter the expression levels of a protein to better understand the mechanism behind its dynamic response; and (3) discover hidden kinetic rates that are difficult to measure experimentally using inversion methods.
In this study, we use the cell simulator to capture the transcriptional and translational mechanisms behind dynamic changes of aquaporin 4 (AQP4) expression in a single astrocyte. The aquaporin family proteins play a central role in homeostasis. Among the discovered 13 aquaporin families [11], AQP4 is the most abundant water channels in the brain, and they are primarily expressed in astrocytes. Located on astrocytic endfeet opposing the vascular and fluid barriers [12], the regulation and localization of AQP4 in a cell have implications for modulating brain water balance in brain disorders. A beneficial effect of AQP4 down-regulation has been observed in cellular edema [13], and its upregulation improves survival in vasogenic edema [14]. Among several inducers of AQP4, sulforaphane (SFN), an isothiocyanate naturally-derived from cruciferous vegetables, is known to activate a neuroprotective transcription factor (TF)-nuclear factor (erythroid-derived 2)-like 2 (Nrf2) [15,16,17]. Nrf2 is a putative TF of the AQP4 gene and SFN has been found to effectively upregulate AQP4 in vivo [18,19]. We use the cell simulator to investigate the transcriptional mechanisms behind the upregulation of AQP4 upon SFN stimulation in our case study, utilizing temporal expression data from western blotting, spatial localization information from immunofluorescence imaging, and incorporating existing measurements of AQP4 half-life and mRNA stability. In our cell simulator, we are able to reproduce the dynamic upregulation of AQP4 proteins, and derive additional insights about the kinetics of aquaporin 4 gene activation, the generation of its transcripts, and trafficking events of newly synthesized AQP4 after exposure to SFN.
The mathematical modeling of the life-cycle of AQP4 proteins from gene activation to membrane expression is composed of sequential kinetic reaction processes for gene transcription, translation, and the transport of AQP4 proteins in vesicles towards the astrocytic endfeet. Event-based stochastic simulation mimics the random fluctuations of gene activation in a single cell. The kinetic rate constants are estimated from deterministic representation. Alternatively, kinetic rates can be determined by inversion of stochastic differential equation models [20]. The predicted AQP4 upregulation agree well with experimental results. This case study demonstrates the potential of the single cell simulator to integrate datasets on protein and transcript levels with cellular imaging to generate important quantitative information about dynamic processes in a cell, and to predict cellular behavior.

2. Method and Experimental Section

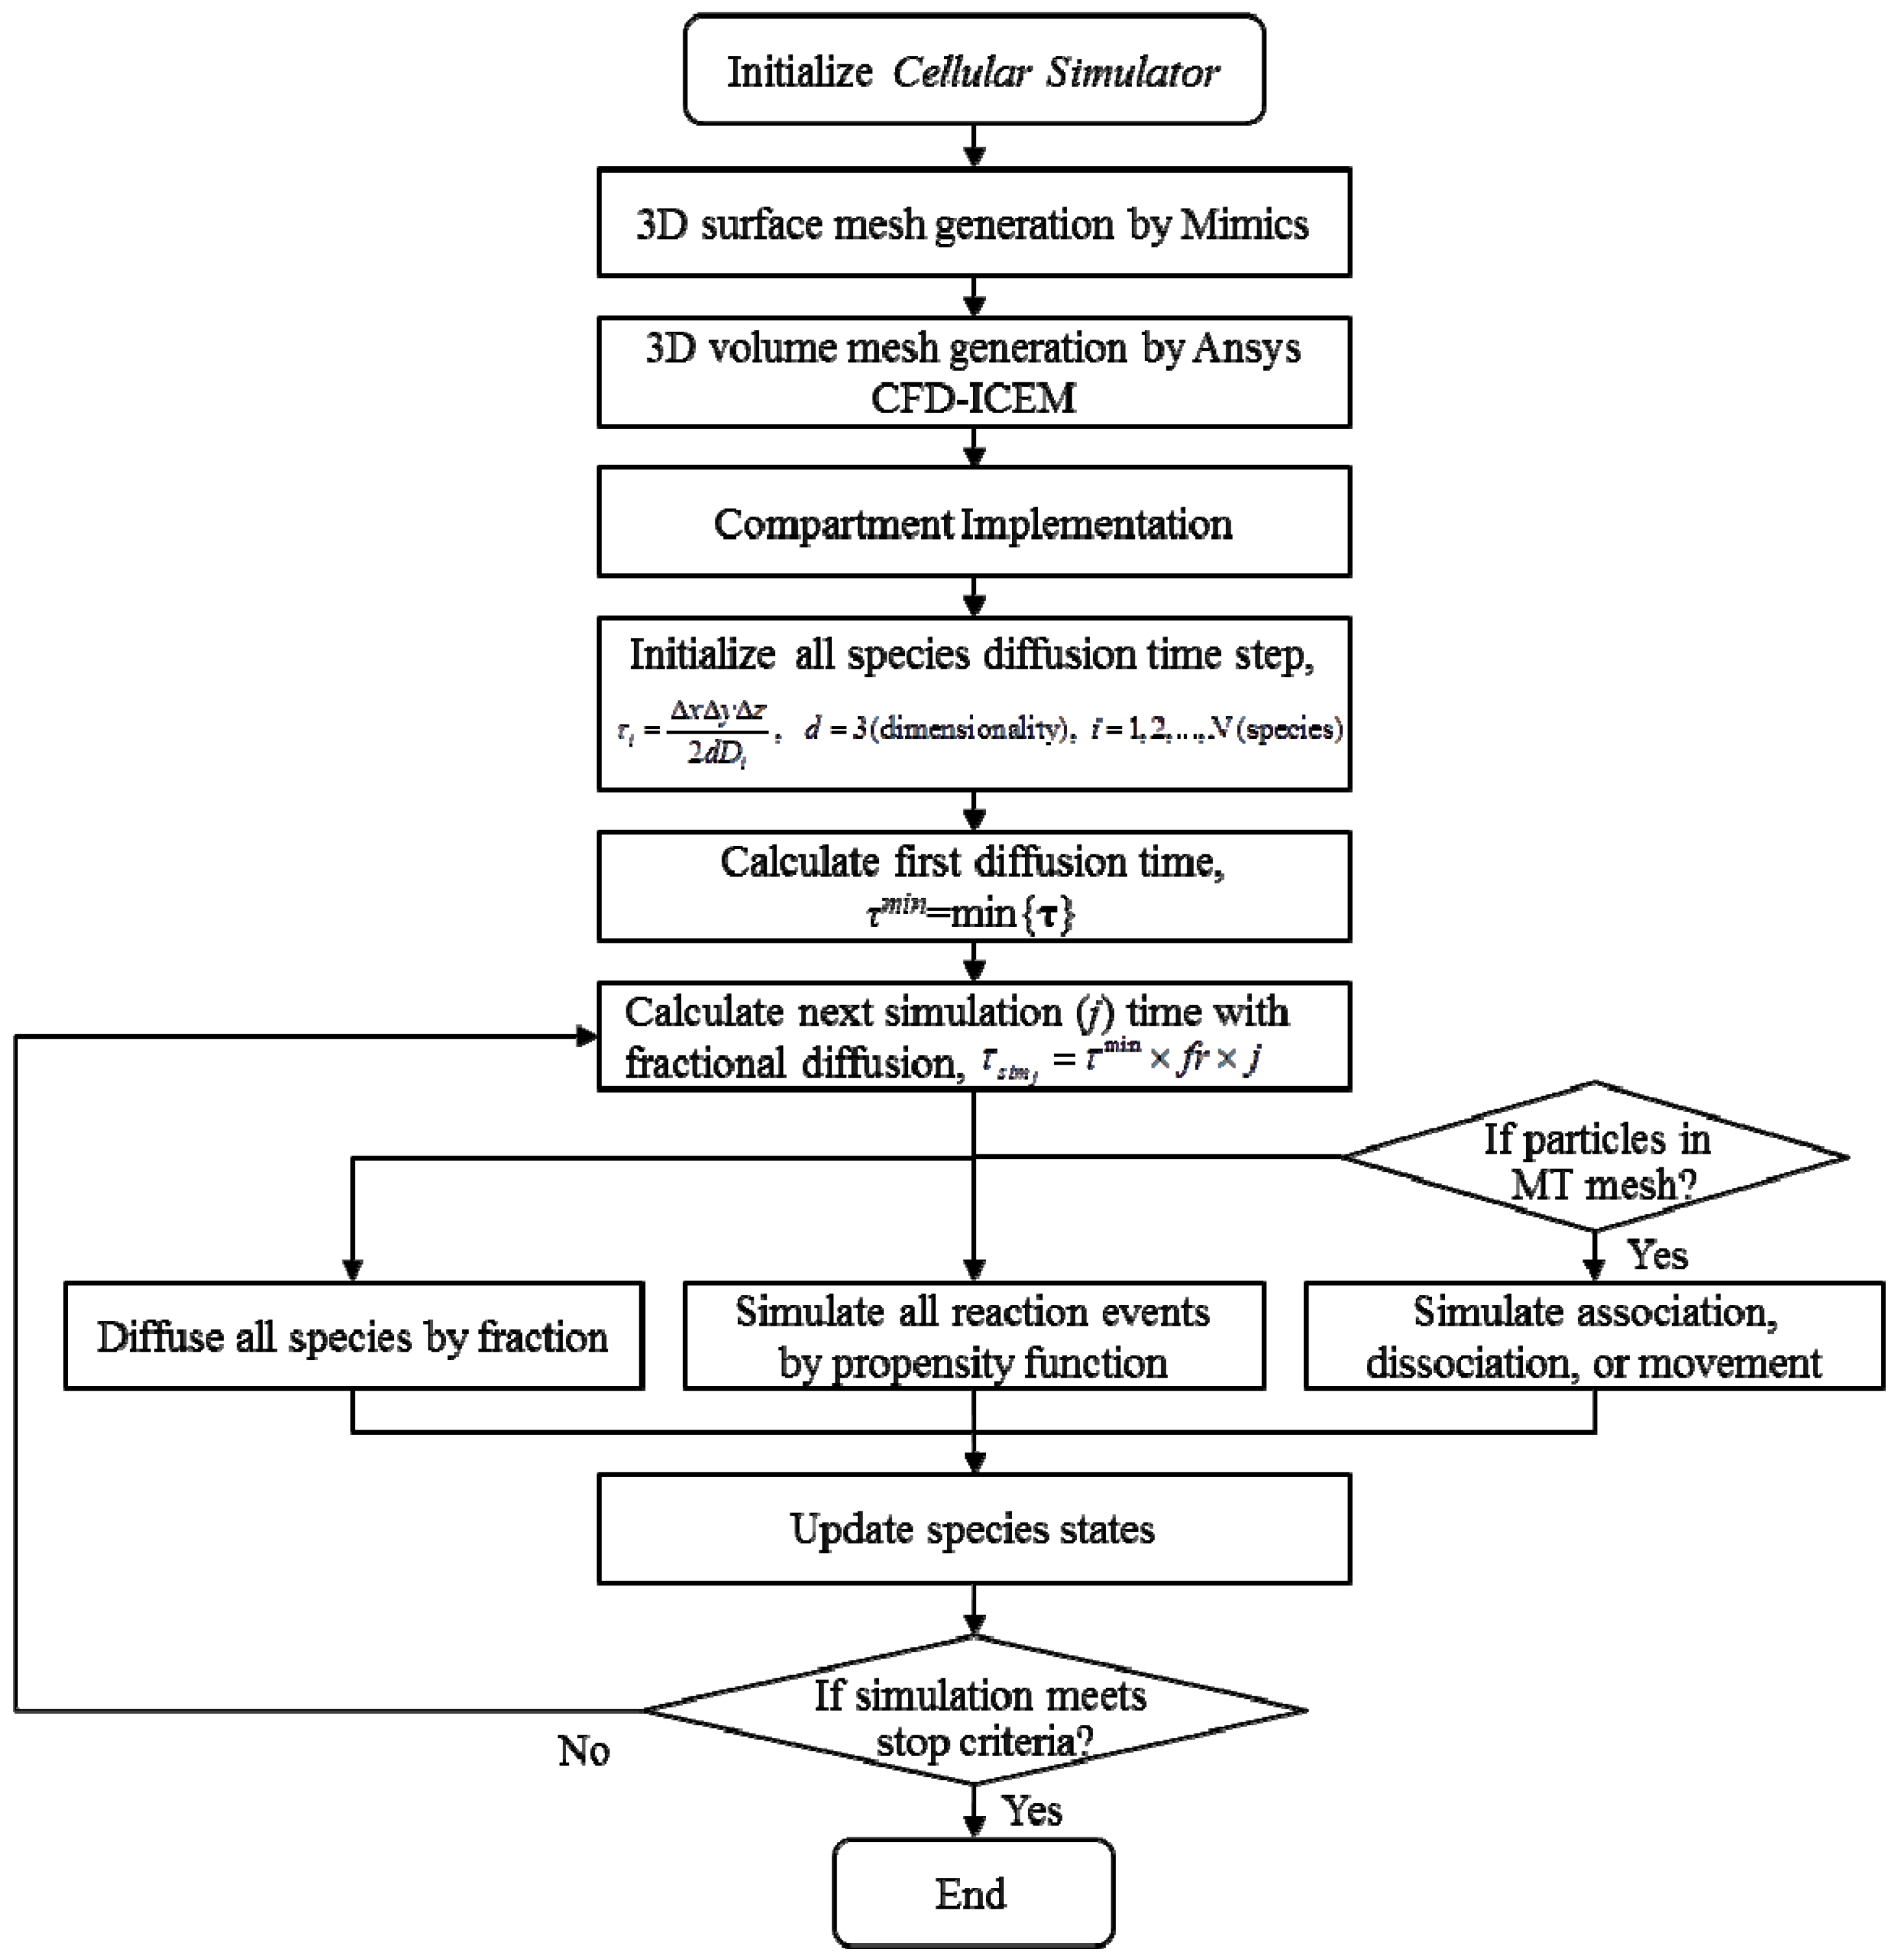
2.1. Prototype Cell Simulator

Powerful cellular simulators exist that can describe dynamic cellular activities with deterministic or stochastic mathematical formulations. For example, MesoRD is one of the representative simulation tools including diffusion and reaction using the exact Markov process [21]. Mcell is a modeling tool for 3d realistic sub-cellular dynamics using Monte Carlo algorithms [22]. However, these programs have not incorporated the hybrid algorithm for integrating stochastic and deterministic models with a shared spatial and temporal domain. Virtual cell (Vcell) is a comprehensive cell simulation tool integrating theoretical and experimental cellular information. Vcell is capable of spatial deterministic as well as non-spatial deterministic and stochastic simulations [23]. E-cell 3d also provides intuitive visualization of highly complex biological systems [24].
One of the advantages of modeling cellular events with a single cell simulator as opposed to using partial differential equations that describe an entire cell population is the ability to portray the trafficking and polarized protein distribution in the cell in a way that is comparable to microscopic images. Protein trafficking through vesicular transport on the cytoskeleton is a key event that brings it to its functional destination. Birbaumer and Schweitzer have simulated the dynamics of vesicle fusion and transport as stochastic transitions with the Langevin equation [25]. Their approach captures realistic size distribution of vesicles, as well as spatial patterns that could be matched by experimental observations. De Heras Ciechomski et al. developed ZigCell3D that employs a particle-based model which includes the directed movement of molecules on the microtubule [26]. Using a novel growth algorithm to stochastically generate a microtubule network that originates from the centrosome, our cell simulator captures the motion of AQP4-containing vesicles on the microtubules leading to the polarized expression of AQP4 on the endfeet. The comparison of existing cell simulators and our simulator is tabulated in Table 1.
Table 1. Overview of cell simulators.
Author, yearCell simulatorSimulation eventMathematical modelTransport on cytoskeletonNatural cell structure3d Visualization
DiffusionReactionDeterministicStochastic
Kim, 2013This work
Loew, 2001 [23]VCell
Tomita, 1999 [24]ECell
Hattne, 2005 [21]MesoRD
Raymond, 2003 [27]JSim
Ander, 2004 [28]SmartCell
Stiles, 1996 [22]MCell
Plimpton, 2003 [29]ChemCell
Andrews, 2004 [30]Smoldyn
Boulianne, 2008 [31]GridCell
Le Novère, 2001 [32]StochSim
For simulating AQP4 upregulation and its endfeet polarization, our model needs to compute gene transcription, translation and protein transport in a spatially distributed system at the single cell level. For proteins that are expressed in a specific cellular location in order to carry out their physiological functions, the trafficking and polarized expression of these proteins after translation becomes very important in understanding the temporal dynamics of cellular response to a stimuli. In our particular case study, the directed transport of mature AQP4 on the microtubules toward the endfoot membrane requires an accurate mathematical representation of the packaging of AQP4 into vesicles, association with motor proteins, and realistic transport kinetics along the cytoskeleton. A major portion of protein trafficking events occurs through active transport by motor proteins along the microtubules. Taking advantage of the discrete population-based stochastic algorithm, our simulator will be able to capture the transport and reaction events of molecules in a single cell, and track the localization of each molecule at any moment in time.
The rationale of our simulator is to integrate experimental observations of cell morphology (confocal microscopy), transcription factor activation (immunofluorescence), and induced target protein expression (western blot) using a cell simulator based on stochastic simulations, and predict future behavior of the cell based on existing experimental data.
Realistic cell geometry was reconstructed from confocal microscopic images of a single astrocyte including detailed intracellular organelles such as nucleus, endoplasmic reticular, microtubules, etc. Our proposed simulator will be compared with experimental measurements of AQP4 upregulation for validation of the simulation outcomes. The detailed stepwise procedures for generating a cell-specific model will be described in the following sections.

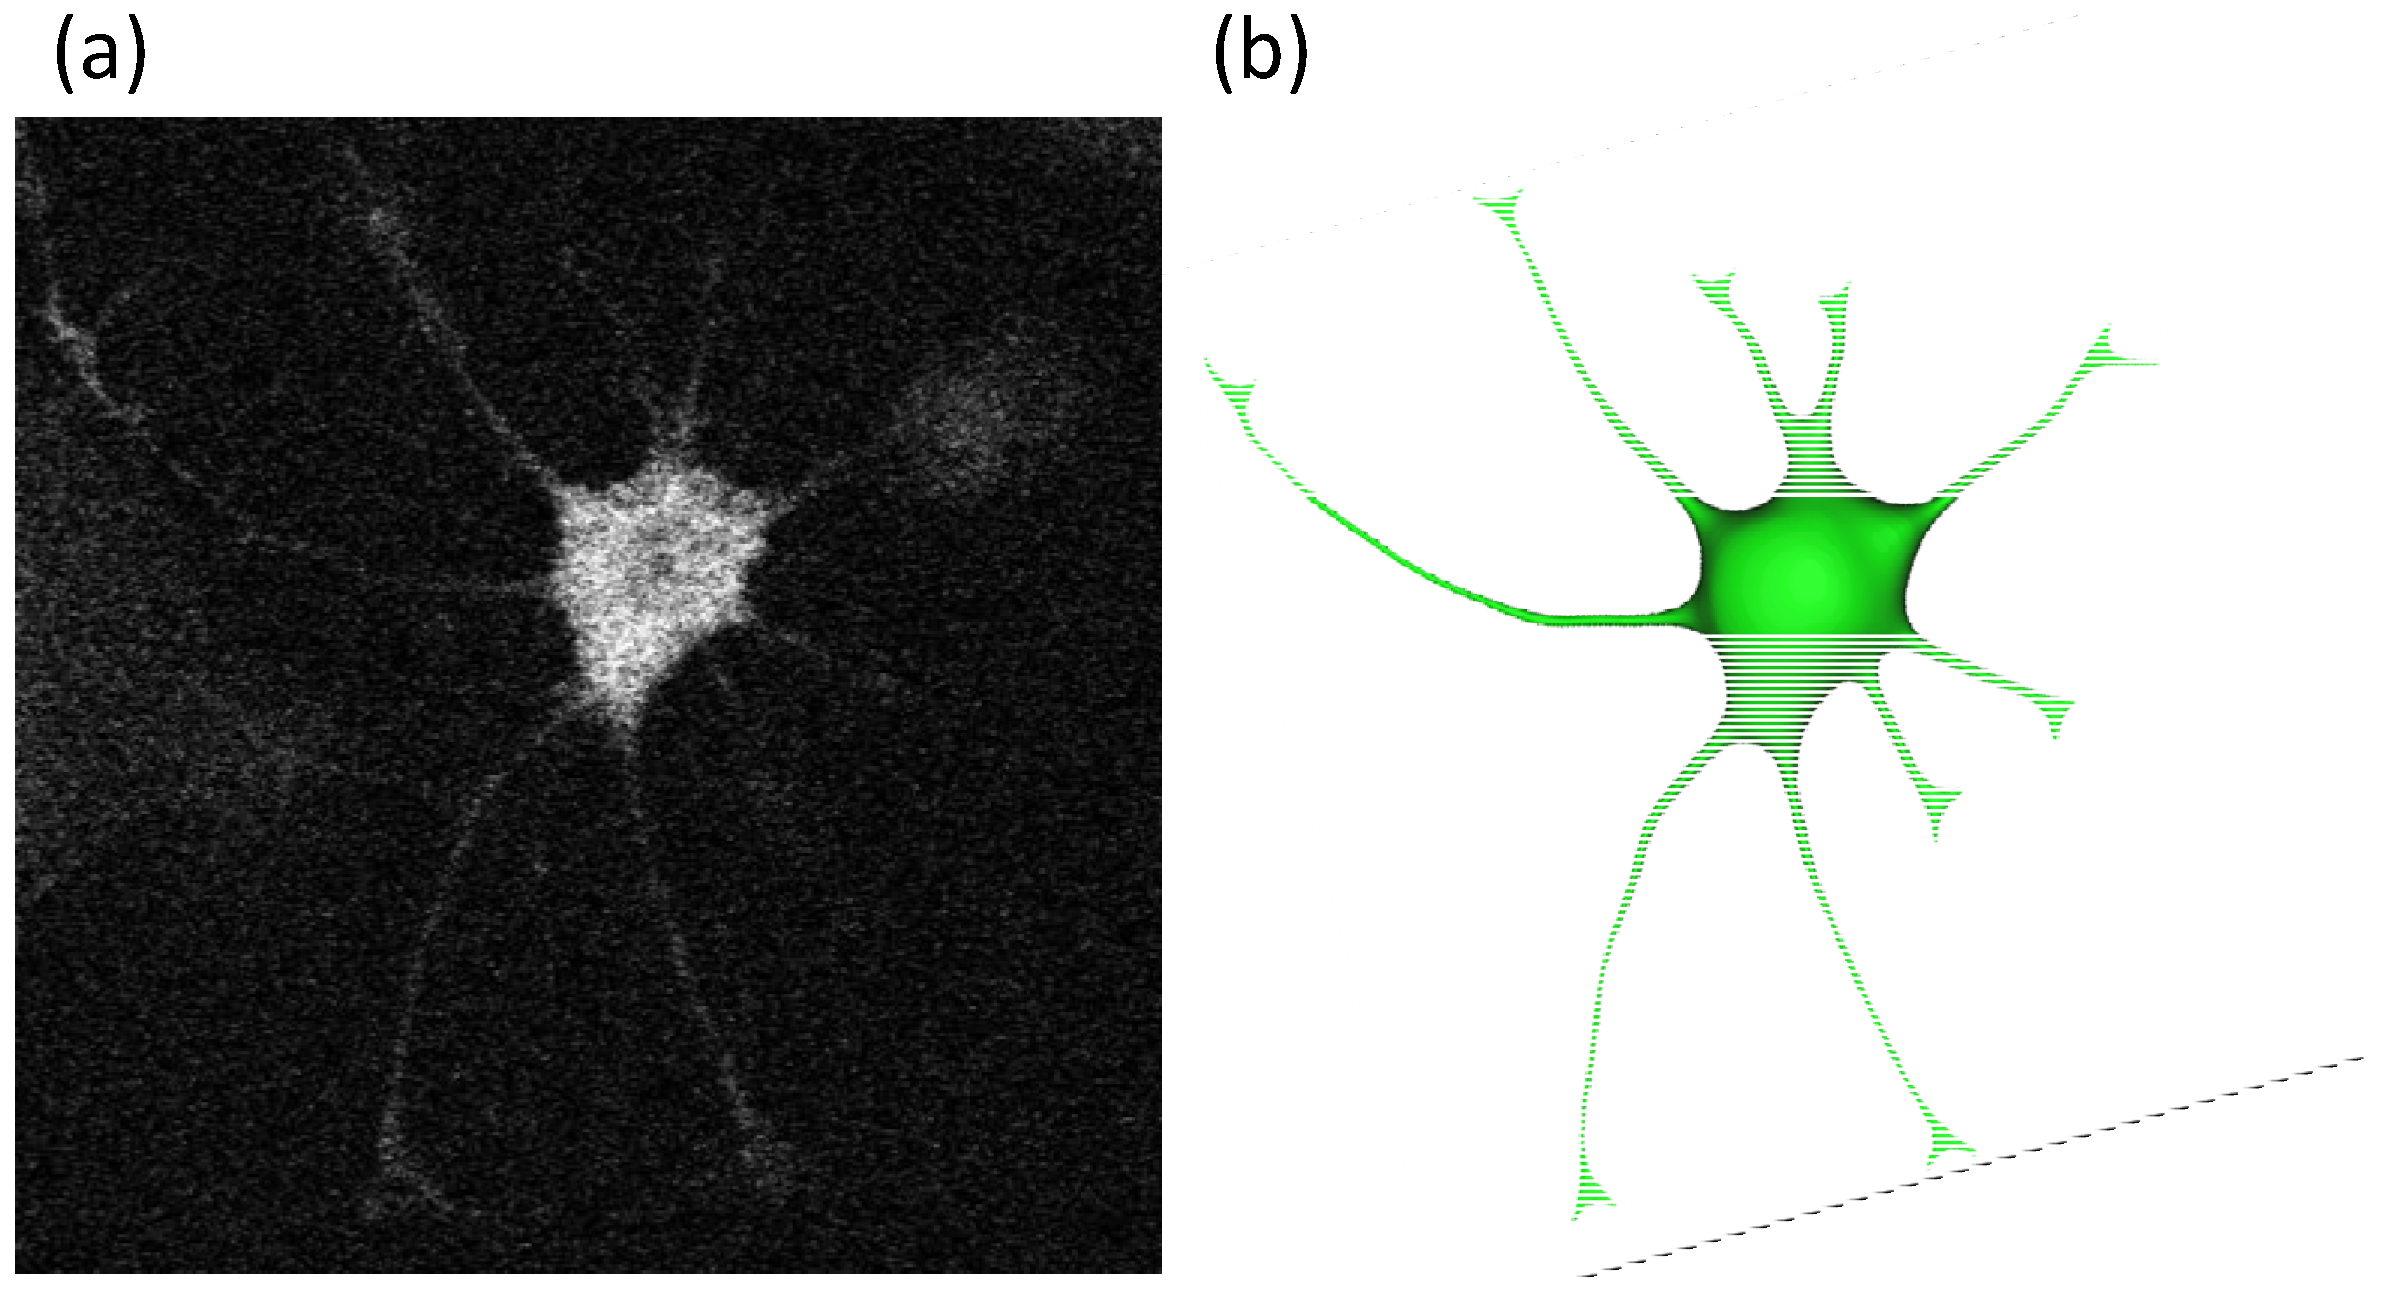
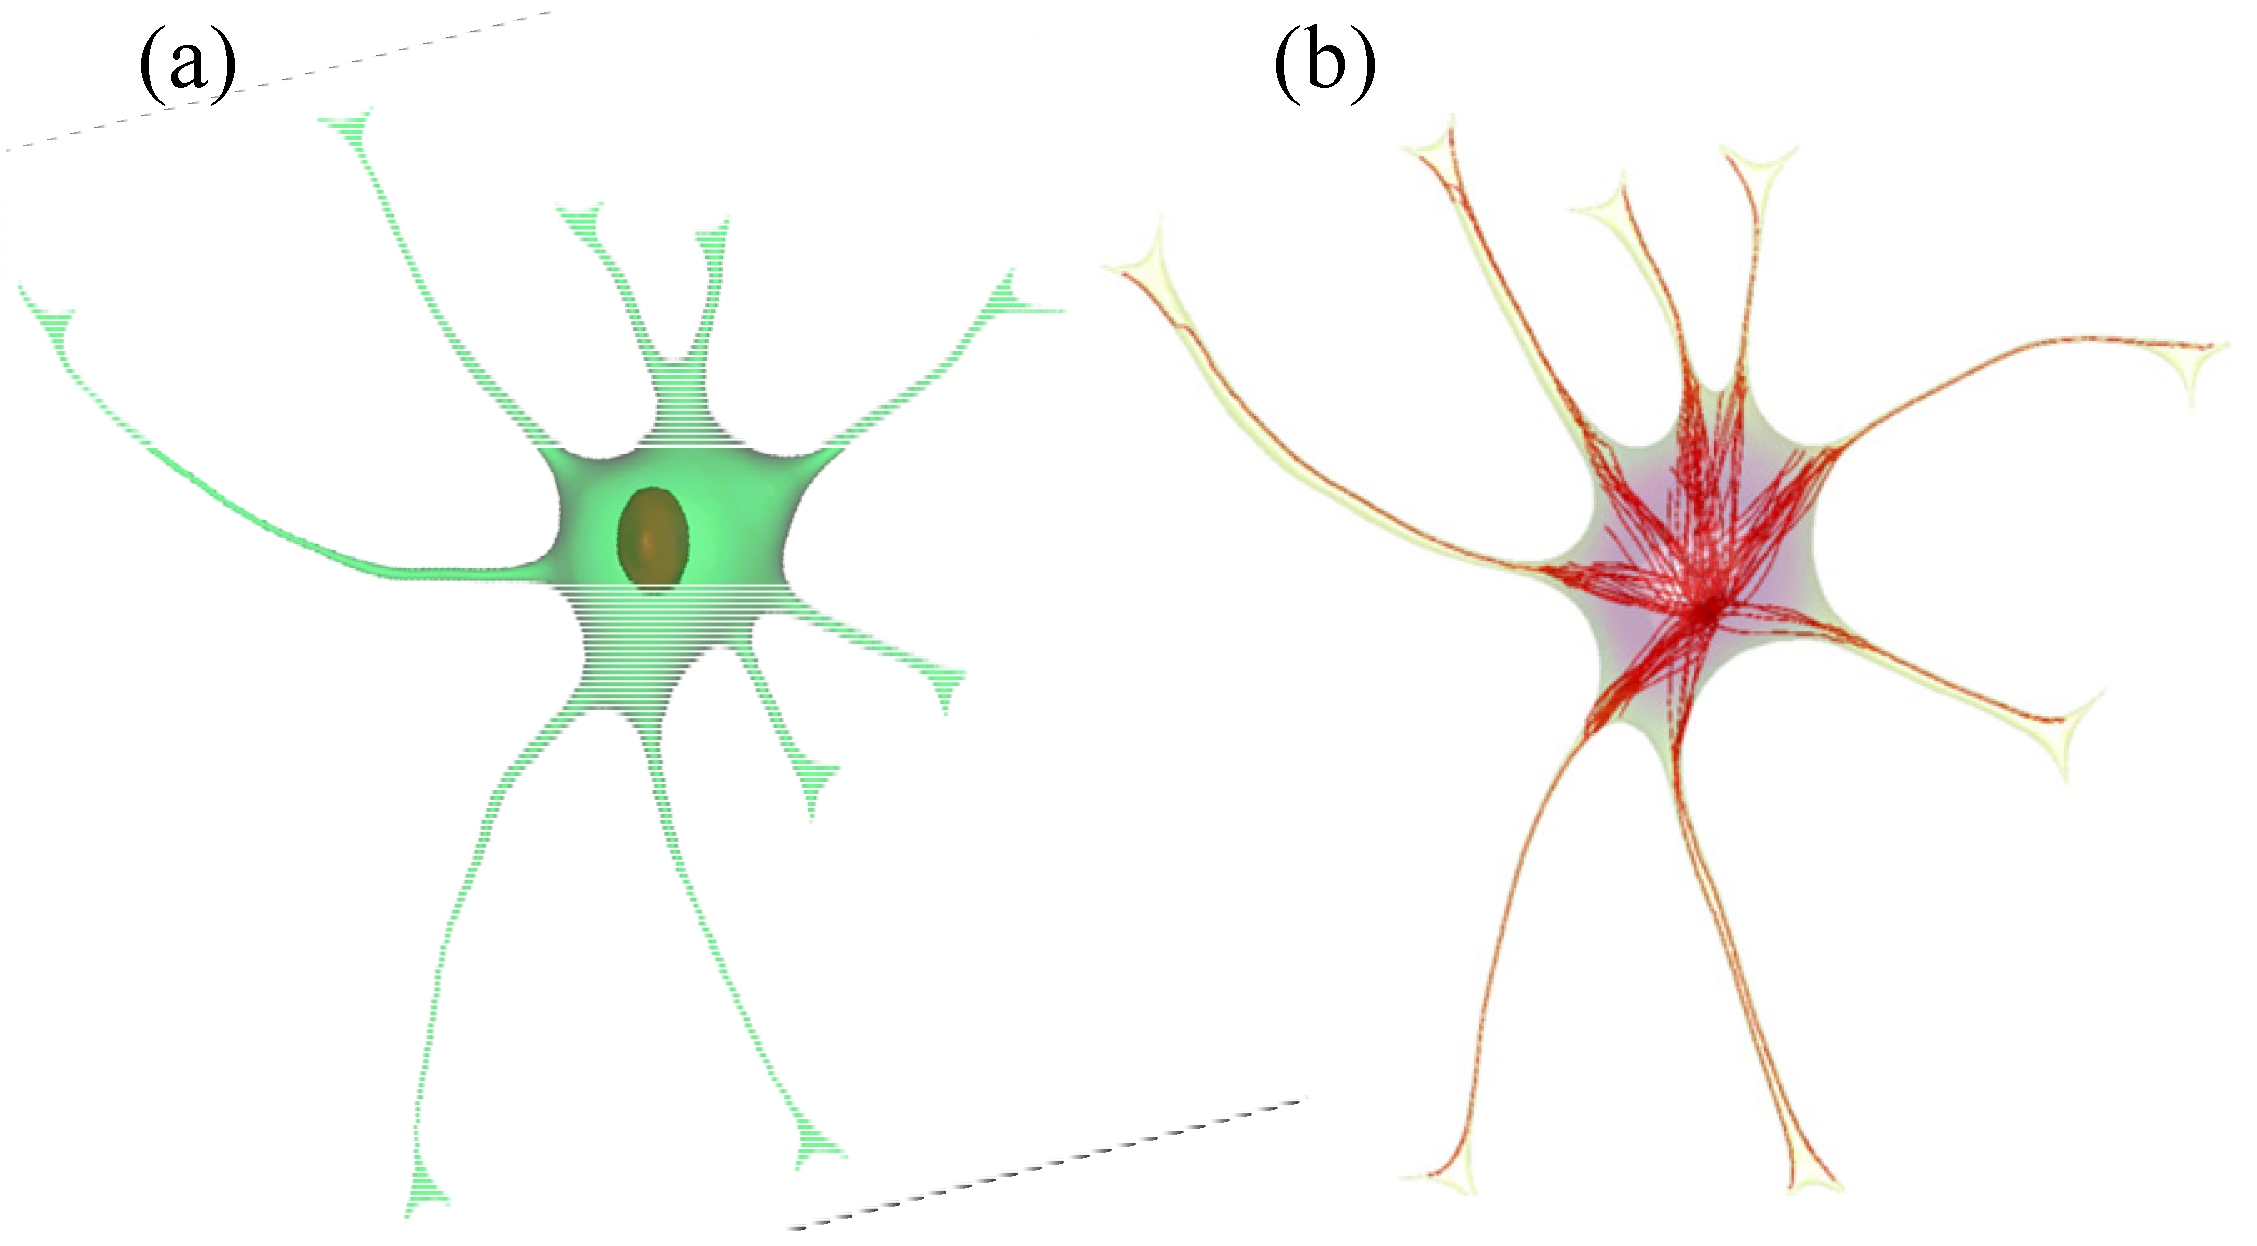
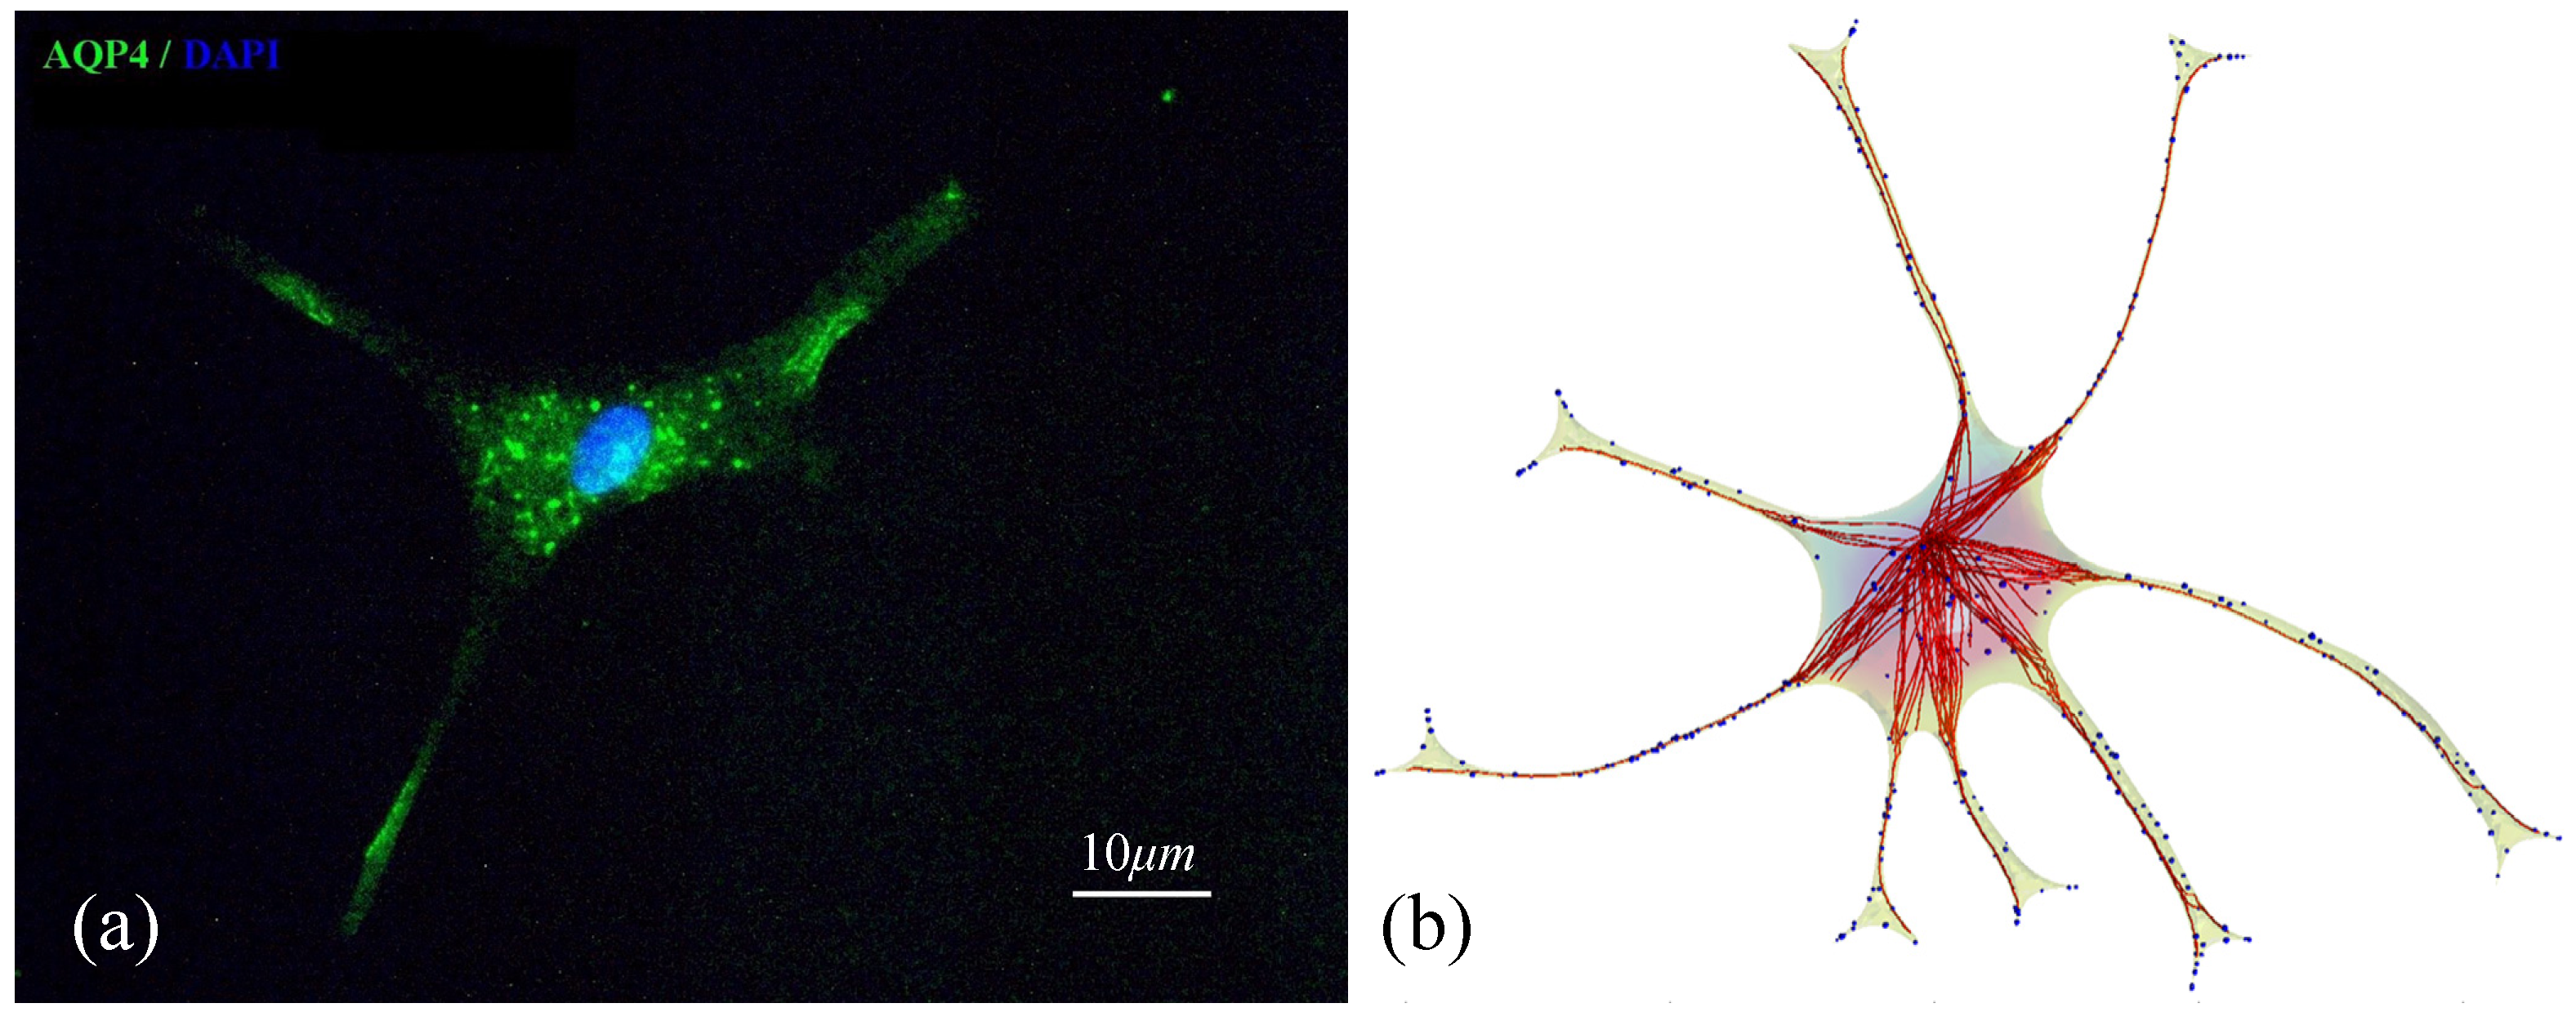
2.2. Geometry Reconstruction of the Astrocyte Model

Cultured primary astrocytes were loaded with calcein-AM and a single stellate astrocyte was scanned with confocal microscopy using a BioRad microscope (Biorad, Hercules, CA, USA) with a Z-plane resolution of 0.5 microns. The model was then reconstructed from the stack of confocal images using an image reconstruction software, MIMICS (Materialize, Leuven, Belgium), as shown in Figure 1. The reconstructed model containing the astrocyte soma, processes and nucleus was discretized into tetrahedral volumes for computer simulations. The volume mesh with intracellular compartments is generated with Ansys ICEM-CFD.
Figure 1. Reconstruction of a single astrocyte cell in 3d. A series of confocal microscopic images (a) were reconstructed to build the 3d model of a single astrocyte (b). The computational mesh of the stellate astrocyte has 11,390 tetrahedron volume elements.
Processes 02 00218 g001

2.3. Implementation of Cell Compartments

To complete the cell model, intracellular compartments and cell organelles including the nucleus, endoplasmic reticula (ER), Golgi apparatus (GA), and microtubules (MTs) were added. These cell compartments were integrated with the volumetric mesh of the astrocyte body. The nucleus surrounded by the ER was placed with mesh tools offered by Mimics as in Figure 2a and MTs originating from the centrosome and terminating at the cellular membrane were generated using an artificial growth algorithm as shown in Figure 2b. All microtubules start at the microtubule organizing center (MTOC) and terminate mainly at the endfeet of the astrocytic processes.
Figure 2. Implementation of nucleus (a) and microtubules (b) into the reconstructed 3d cell model.
Processes 02 00218 g002
For the growth of the microtubule cytoskeleton, we developed the smooth and shortest path finding algorithm, which aims at finding the smoothest and the shortest path in the presence of obstacles. This algorithm begins with a random directional growth of MT segment from the MTOC to the neighboring mesh. Then, it uses the directional information from the target vector, A(t), which is a unit vector connecting a current point to the selected end point. To keep the smooth curvature, it also takes the information of the tangent vector, T(t), from the current growing point. In each growth step, the next point will be determined by the summation vector, D(t), of both vectors with a small variation generated by a random vector.
Processes 02 00218 i001
Processes 02 00218 i002
The pseudocode for implementing Smooth and Shortest path finding algorithm to model the microtubular cytoskeleton is described as follows:
  • Step 1. Select a starting mesh of MT growth (the MTOC) and a target mesh located at the endfoot.
  • Step 2. Generate the first growth step with a random direction, with the length of the segment equal to the distance to the connecting mesh.
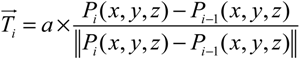
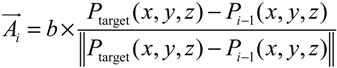
  • Step 3. Grow a segment to the neighboring mesh adjusting its direction and length with the information of tangent vector and target vector (direction to the final destination).
  • Step 4. Repeat step 3 until it encounters the boundary of the endfoot process.
  • Step 5. If the growth does not encounter the boundary of an endfoot process, the growth will be terminated and a new MT growth will start from step 1. Otherwise, the MT segment grows into the process which contains a target mesh selected in step 1.
  • Step 6. Grow a segment to the neighboring mesh adjusting its direction and length with the information of tangent vector, target vector, and distance to the normal surface.
  • Step 7. Repeat step 6 until it comes into contact with the endfoot boundary.
  • Step 8.Upon reaching a member of the mesh at the endfoot boundary, the smooth and shortest path finding algorithm will stop and finalize the trajectory to the target mesh selected in step 1.
  • Step 9. The defined end criterion for the total number of MTs will terminate the algorithm.
At each growth step, the position can be recorded as the mesh id number or as the absolute position. Each step of growth will have a slight directional and longitudinal variation to avoid running into an obstacle or the boundary of the cell. The combined consideration for path smoothness using the tangent vector and for shorter path using the distance to the closest surface from the current point will gradually modify the direction of growth.

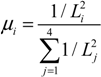
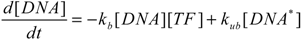
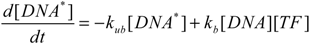
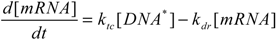
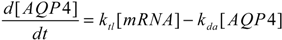
2.4. Stochastic Model and Simulation of Biochemical Kinetics and Transport

The synthesis of AQP4 water channels involves the transcription and translation mechanisms. In our mathematical model, the transcription and translation of AQP4 under normal conditions (steady state) will be established first. In addition, we will specifically explore the transcriptional upregulation of AQP4 in response to the inducer SFN. SFN stimulates transcriptional activation of the AQP4 gene [18]. This transcriptional activation of the AQP4 gene likely occurs through the nuclear translocation of the transcription factor Nrf2, and the binding of Nrf2 to the promoter regions containing the antioxidant-responsive element (ARE) motif of the gene [19]. As a result, the transcription of mRNA occurs with higher frequency when the concentration of Nrf2 in the nucleus is elevated compared to the basal transcription rate of the AQP4 gene. In our mathematical formulations, the Nrf2 bound gene turns into the “active” state and begins the transcription of AQP4 mRNA. The entire transcriptional and translational mechanism postulated in this model is shown in Figure 3. Note that there is still a basal amount of Nrf2 within the nucleus without SFN stimulation. However, SFN increases the amount of Nrf2 in the nucleus, as well as Nrf2-promoter binding. To reduce the complexity of the model, we omit concentrations of additional enzymes such as RNA polymerase or ribosomes, and lump their concentrations within the transcription and translation rates.
Figure 3. The modeling of AQP4 transcription and translation reaction mechanisms. Nrf2 activation by SFN treatment upregulates AQP4 expression in the astrocyte cell.
Processes 02 00218 g003
SFN administration increases Nrf2 translocation into nucleus and Nrf2 binding to the aquaporin 4 gene promoter. As a result, the transcription rate is increased until the level of nuclear Nrf2 returns to normal due to Nrf2 nuclear export. In this model, translation kinetics is assumed to be a first order reaction in respect to mRNA concentration and all degradation kinetics are set to follow first order reaction.
Gene transcription is a stochastic process and the levels of transcription show great variability between single cells in a population [33]. Transcriptional events involve only a small number of molecules, so that continuous kinetic models are invalid. Stochastic formulation of gene transcription can be represented in the form of chemical master equation (CME) [34,35,36,37] and it can be computationally simulated by the Gillespie algorithm [38] which considers only one scenario of each reaction event based on the Monte Carlo scheme. Using Gillespie algorithm with random sampling from Poisson distribution, we can track a discrete population of molecules undergoing discrete number of reaction and translocation events during a given time period.
In addition to transcriptional and translational reaction mechanisms, we also incorporate the transport phenomenon in the model. Two different transport mechanisms have been applied to describe movement in the cytoplasm; passive pure diffusion and active motor-protein driven convective transport. For the stochastic simulation of pure diffusion, we used fractional Gillespie multi-particle algorithm (fGMP) which is an approximation of the Gillespie method [38] with discrete time interval. This method is also based on the Gillespie multi-particle (GMP) method proposed by Rodriguez et al. [39], which is a discrete population-based spatial stochastic method to simulate biochemical networks.
An information flow diagram for the stochastic simulation of reactions and intracellular transport is shown in Figure 4. In each iteration, we compute (i) reaction events; (ii) microtubular transport; and (iii) random diffusion events. Gillespie algorithm gives the number of molecules reacted in each reaction. For the microtubular transport, we compute each molecule’s positional change along a microtubule for a given time period. Finally, the fractional Gillespie multi-particle method determines the number of molecules and directional change inside the cellular domain for the given time step.
i. Reaction events. In implementing reaction mechanisms, we incorporated reaction propensity functions to calculate an integer number of reaction events per each simulation time step, in which the propensity functions, a, are updated with the population of each species in the current state, j. These propensity functions are shown in Equations (3) to (5) for the synthesis of AQP4 and Equations (6) to (8) for the inactivation of the DNA or the degradation of the species. mRNA0 and AQP40 denote the degradation of each species in those propensity functions. Discrete numbers of all reaction events (R1–R6) are then sampled by Poisson distribution. The Poisson random number sampling is advantageous because it always gives rise to positive integers; however, it sometimes overestimates the total number of events when the simulation time step is too large. In this study, there are less than 15 events occurring for each individual species during 1 s, therefore Δt = 1 s provides reasonable time-step for the current system.
R1. a(τj,DNA*) = kb[DNA]j[TF]j
R2. aj,mRNA) = ktc[DNA*]j
R3. aj,AQP4) = ktl[mRNA]j
R4. aj,DNA) = kub[DNA*]j
R5. aj,mRNA0) = kdr[mRNA]j
R6. aj,AQP40 = kda[AQP4]j
Figure 4. Flowchart of the cell simulator.
Processes 02 00218 g004
Tau leaping method is an approximation method that leaps over many reaction events to approximate the exact stochastic simulation, while maintaining reasonable computing performance. Our discrete time approximation method uses a constant time interval for simulation, regardless of the number of events during each interval. The advantage of this method is that user-defined fixed time steps can be implemented. In discrete time approximation method, all events pertaining to the time interval are implemented before updating the values of the propensity function. The time step is adjusted according to the system complexity.
ii. Pure diffusion events. Assuming that the diffusivity of the molecules in the cell is homogeneous and isotropic, all diffusion probabilities are described with traveling times given in Equation (9), which are inversely proportional to the diffusion coefficient [39]. We assumed slow diffusion with, Ds = 0.125 μm2/s. It also depends on the mean distance to the neighboring subvolumes as expressed by the grid spacing parameter, λ, which has units length. d is the system dimensionality, where d = 3 in our current system.
Processes 02 00218 i003
The event times for all volumes in the cellular domain are initially computed and simulation follows the increasing order of the least traveling time, τmin. Accordingly, all volumes have directional diffusion depending on the ratio to the volume which has τmin. If the traveling time is shorter, the fraction of diffusing molecules is greater and vice versa. This fGMP method computes also fractional diffusion in a single volume proportional to the distances to the neighboring subvolumes from current tetrahedron volume with a normal distribution, N(μi,σ). μi is the probability obtained by calculating the Equation (10) with Li, the distance from current volume to neighboring subvolume i.
Processes 02 00218 i004
iii. Microtubular transport events. The active transport by motor proteins along the microtubule is composed of three steps: (i) association to the microtubules; (ii) dissociation from the microtubules; and (iii) convective transport along the microtubules. For the purpose of simplicity, we only consider anteriograde transport by kinesin in the positive direction to the cell membrane. The association rate constant of the motor-protein with the microtubules is high in comparison to the dissociation constant. Transport of AQP4 alongside microtubules was interpreted with convective movement with the speed of 0.4–0.6 μm/s [40,41,42]. The directional transport along the microtubule is modeled deterministically whereas the association and dissociation reaction events are modeled stochastically.
In order to integrate the spatial coordinates of the cytoskeletal network and that of the cellular subvolumes where diffusion and reactions occur, these two meshes exchange coordinate information in our cell simulator. One mesh serves as the domain for diffusion and reaction, and the other mesh serves to compute convective transport along the microtubules. In our algorithm, the mesh for the convective transport contains the microtubule structural identity and shares the mesh information with the volumetric cell mesh such as sub-volume id and absolute geometric information of all microtubule tracks. Therefore, a molecule associated with the microtubule track is allowed to propagate along the microtubule, updating its position along the microtubule. When the dissociation from the microtubule occurs, it communicates with the cell mesh to move that vesicle into that neighboring sub-volume.

2.5. Comparison with Deterministic Kinetic Model

To better characterize intracellular dynamics, the stochastic simulation for AQP4 synthesis was compared to a deterministic model. Averages of cell states obtained from repeated stochastic simulations were used for the side-by-side comparison with the continuous simulation results. The mathematical model for the intracellular kinetics using ordinary differential equations is described in Equations (11) to (14)
Processes 02 00218 i005
Processes 02 00218 i006
Processes 02 00218 i007
Processes 02 00218 i008
where kb denotes DNA activation, kub for reverse inactivation, ktc for transcription, and ktl for translation. kdr and kda are degradation rates of mRNA and AQP4, respectively. DNA* stands for the activated state of the aquaporin 4 gene due to the binding of Nrf2 at the promoter region.
The kinetic rates of our steady state model are determined from published AQP4 protein half-life. Since data on the stabilities of AQP4 transcripts are not available, we employ averaged properties of mRNA transcripts measured from more than four thousand mammalian genes [43]. In this model, we used relative expression levels obtained from our western blot data to compare the concentrations between initial steady state and SFN-induced dynamic state.
We performed two sets of experiments in astrocyte cell culture; (i) the first set was used to determine the kinetic parameters for Nrf2 nuclear translocation in response to SFN treatment and (ii) the second set served as a validation of AQP4 upregulation caused by SFN treatment using western blotting. The model was used to analyze the status of gene activation, and the kinetics of transcription. The experimental results of Nrf2 translocation and AQP4 protein levels after SFN exposure are presented in Sections 0 and 0, respectively. In addition, the detailed description of experimental procedures can be found in appendices A and B.

3. Results and Discussion

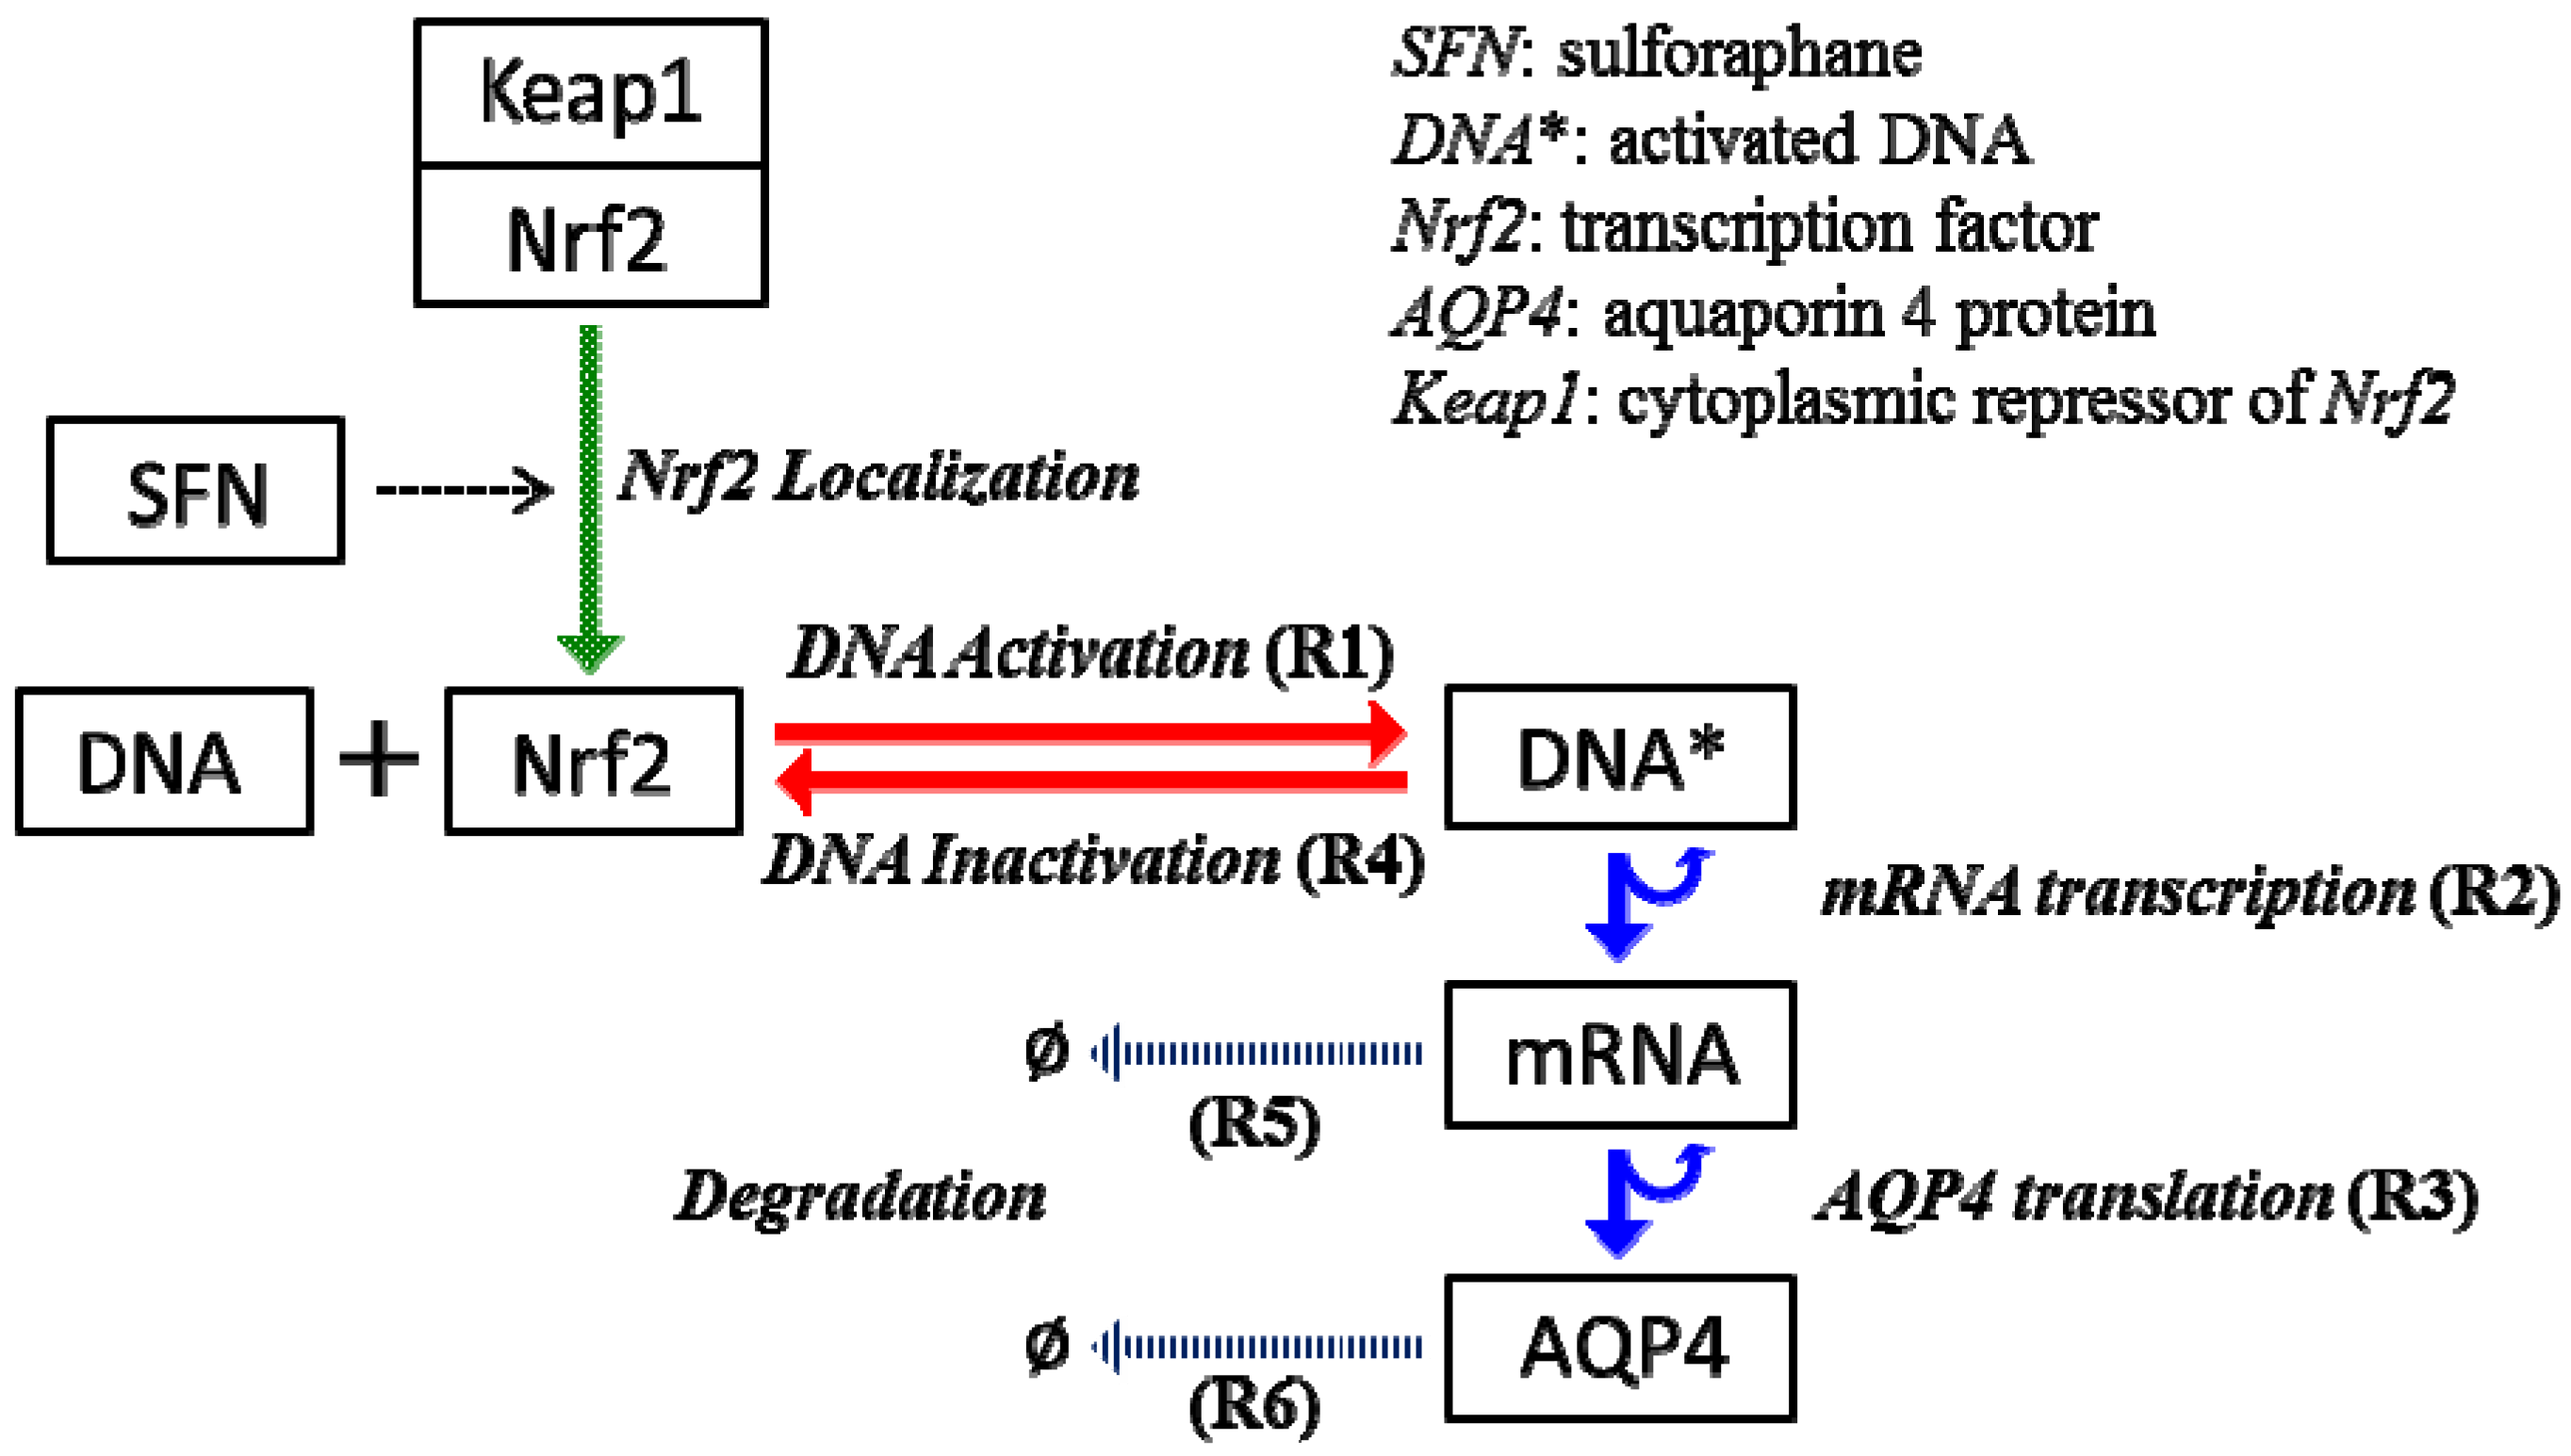
3.1. Kinetic Rates for the Steady State System

The steady state of the system describing AQP4 synthesis and transport was matched with existing data. AQP4 proteins have a known half-life of 24 h in the cell [44], providing information about its degradation kinetics. The precise number of transcripts and AQP4 proteins per cell is not known, so only relative expression levels can be matched. For this case study, we ensure that the number of AQP4 mRNA and proteins per cell falls within the range of four thousand genes measured in mammalian cells [43].
Kinetic parameters shown in Equations (11) to (14) were determined to arrive at physiological AQP4 protein and transcript levels. These levels agree with known data that on average approximately 2 copies of mRNA are synthesized per hour and 900 proteins from each mRNA are translated per hour [43]. SFN treatment increased mRNA transcription to 8 copies per hour. The degradation rate of AQP4 is set to have a 24 h half-life and its corresponding AQP4 mRNA is assumed to have a half-life of ~4.8 h due to the fact that on average mRNAs are 5 times less stable than the corresponding proteins [43]. This information is converted to kinetic rate constants as in Table 2. These kinetic rates are derived based on specific data on AQP4 along with data on general mammalian transcripts when AQP4-specific data is unavailable. The accuracy of the estimated kinetic rates is therefore constrained by data availability and it can be improved by using data on AQP4 transcripts instead of data on averaged mammalian transcripts. Using these rates, we obtained the number of AQP4 protein as 3.59 × 10⁵ at steady state.
Table 2. Kinetic rates of AQP4 synthesis.
ParametersValues (s−1)
Transcription rate with no SFN treatment5.55 × 10−4
Transcription rate with SFN treatment2.08 × 10−3
Translation rate0.25
Degradation rate of mRNA4.01 × 10−5
Degradation rate of AQP48.02 × 10−6

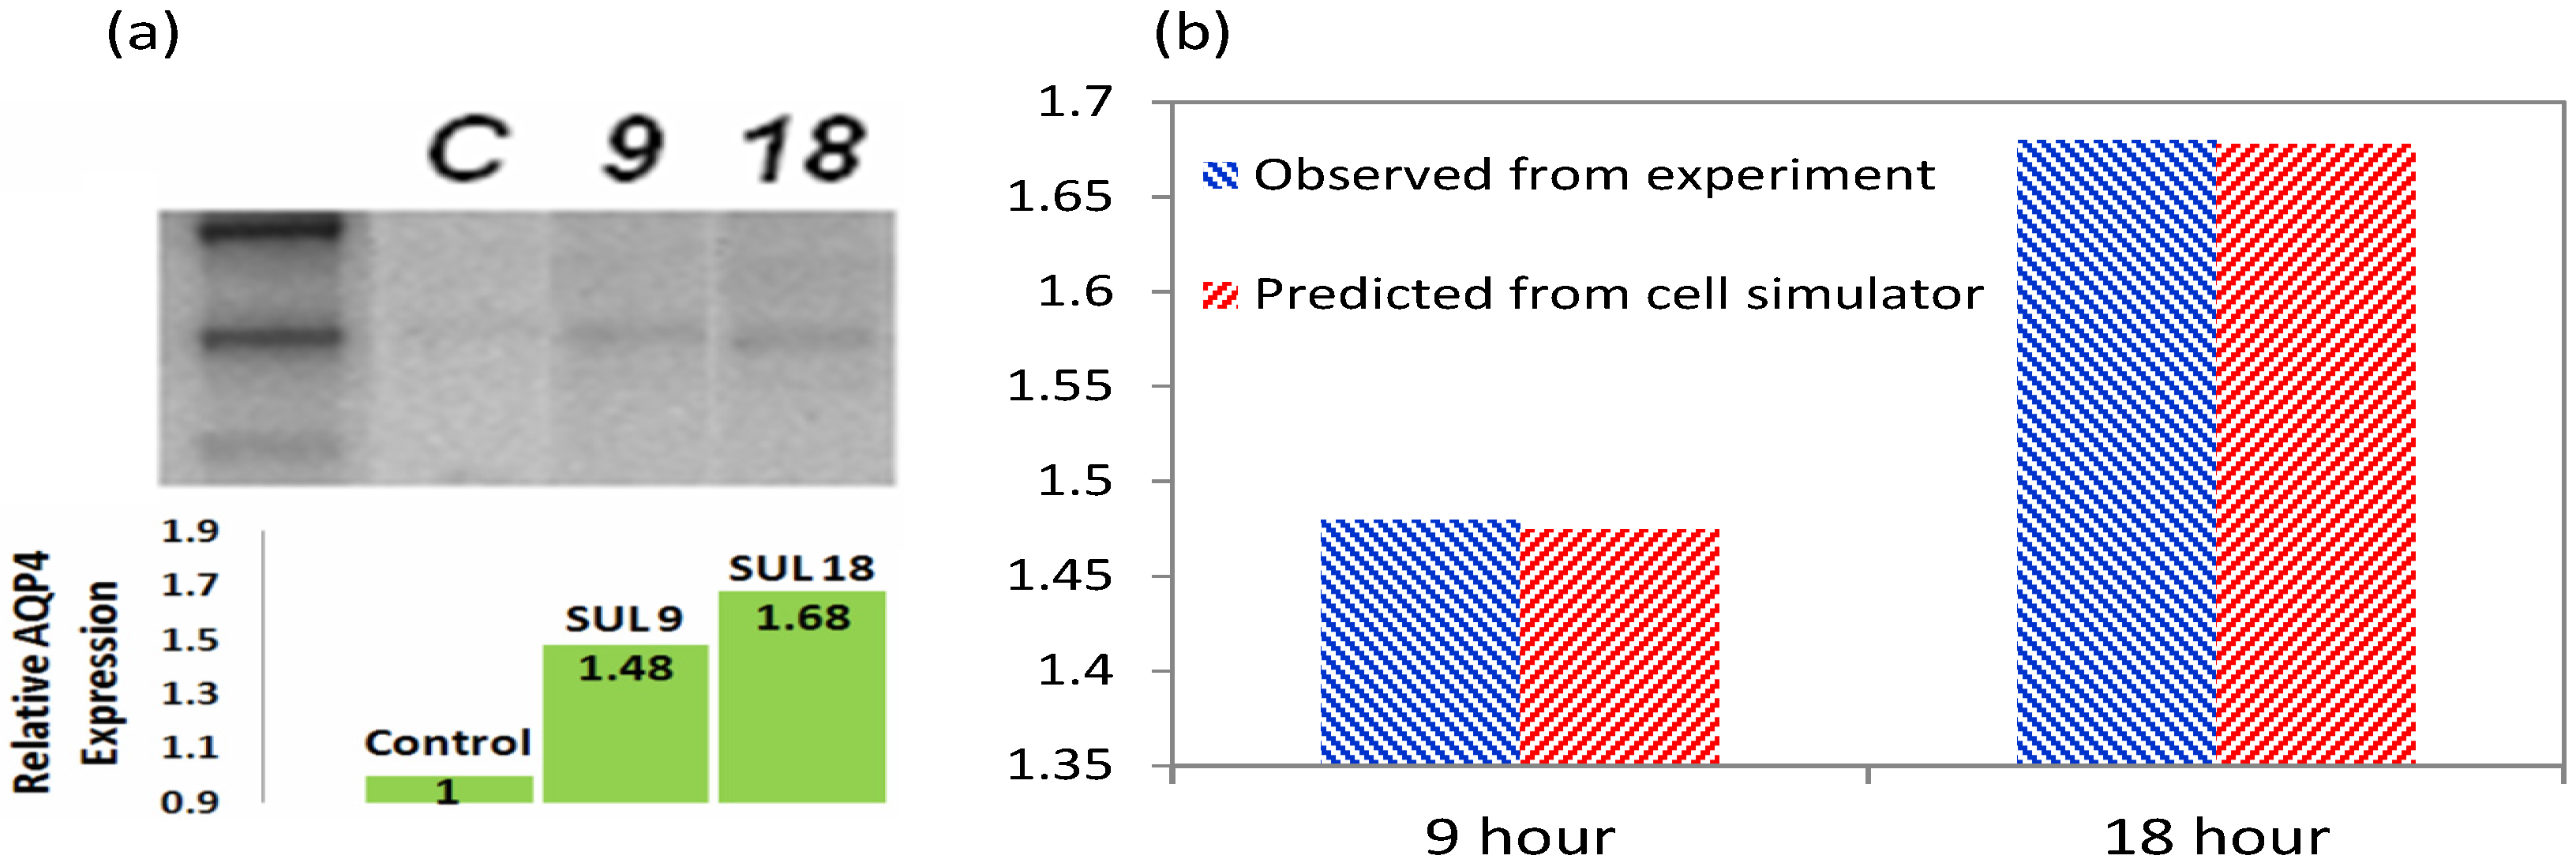
3.2. Increased Transcription upon Sulforaphane Stimulation

Upon sulforaphane (SFN) administration, the transcription factor Nrf2 becomes phosphorylated and translocates into the nucleus, and the transcription of the AQP4 gene is activated by Nrf2 in this model. The degree of induced gene activation in the cell model is derived from experimentally measured Nrf2 translocation in normal and SFN treated cells, see appendix for detailed procedures. Briefly, to determine the level of Nrf2 activation, levels of phosphorylated Nrf2 (pNrf2) within the nucleus were quantified with immunofluorescence images obtained under controlled staining and imaging conditions. After continuous SFN treatment, the fluorescence levels of pNrf2 increased by about 63% compared to control at 15 min, and returned to normal levels by the 9-h time point.
Our observation of rapid Nrf2 nuclear translocation is in agreement with findings by Jain et al. stating that Nrf2 translocation occurs as early as 15 min [45]. The time point of pNrf2 normalization after treatment is in agreement with observations by Jain et al. reporting that after nuclear translocation, Nrf2 starts to exit the nucleus between 1 and 4 h and achieves normal levels at 8 h [45]. Based on this experimental finding, the cell model is adjusted to generate a 63% increase in transcription, and dynamic changes of AQP4 transcripts and proteins are predicted and validated with western blot data.

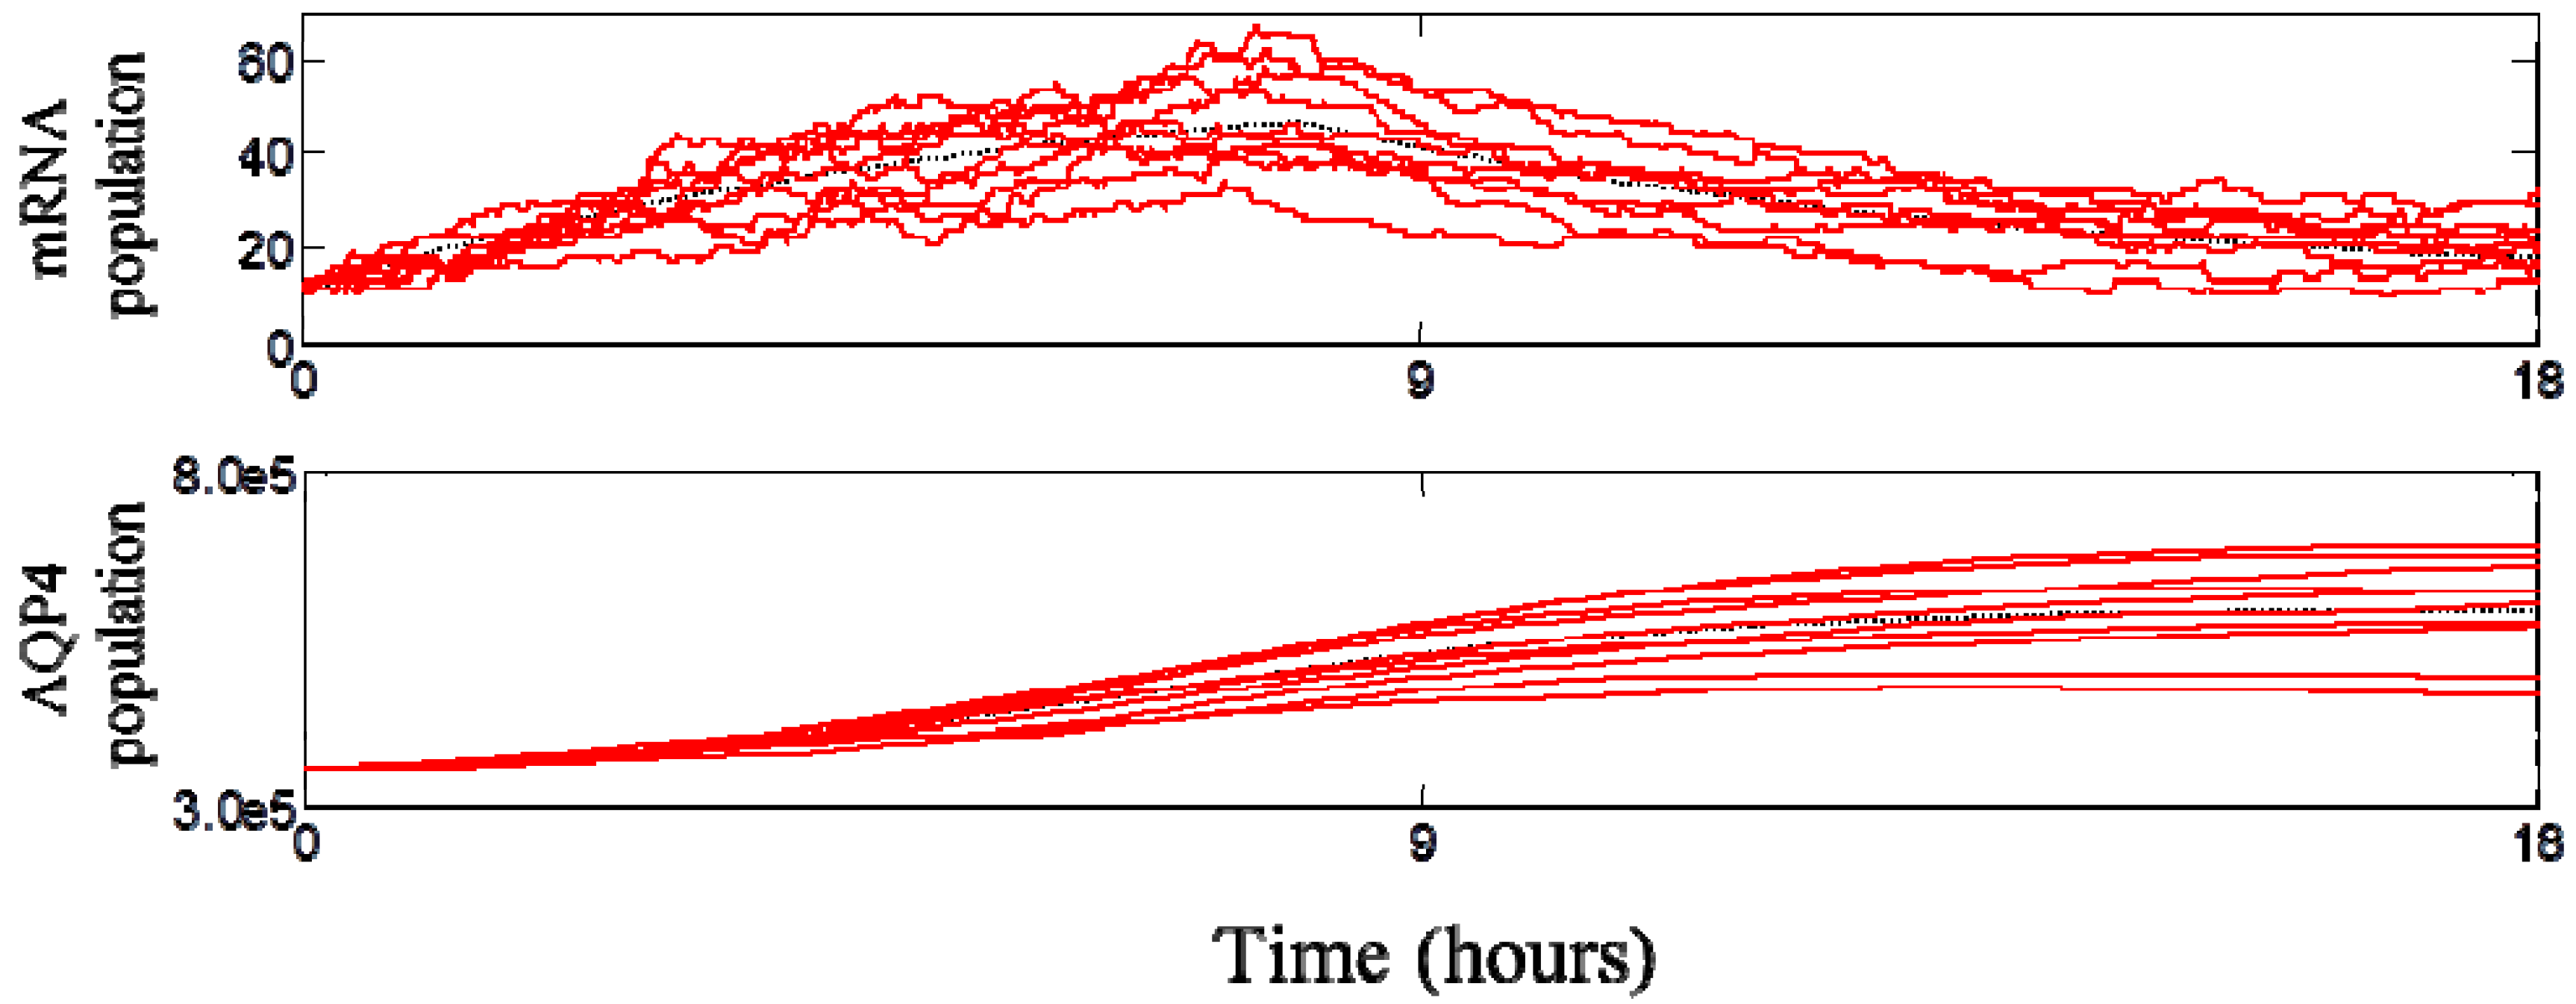
3.3. Dynamic Behavior of the System

The dynamics of the SFN-induced AQP4 upregulation is predicted with the cell simulator. A discrete event simulation was performed with the approximated Gillespie method, using a discretized time step of ∆t = 1 s. Stochastic simulations were repeated for 100 times and we confirmed that the average of 100 realizations converged to the deterministic simulation as shown in Figure 5.
Figure 5 shows that simulated AQP4 expression levels increased by 47.5% after 9 h and 68.0% after 18 h. The proportion of time that the aquaporin-4 gene is in the activated state rises after SFN treatment and returns to normal after 8 h due to the Nrf2 export out of the nucleus. Interestingly, even though the AQP4 protein has a sustained period of upregulation, we predict that the mRNA level reaches a peak around 8 h and begins to drop thereafter. Computational results show that the AQP4 protein level reaches its peak at 17 h and returns to normal level after 9 days. Even though the stochastic model generates absolute number of molecules as shown in Figure 5, the current study only uses the relative expression levels for experimental validation of the model since the absolute number of AQP4 channels per cell is not known.
Figure 5. Stochastic simulation results of AQP4 transcripts and proteins after sulforaphane exposure. Each red solid line represents one stochastic realization and dotted black line is the solution of the deterministic simulation. The upregulation of AQP4 normalized to control was 1.48 ± 0.11 at 9 h and 1.68 ± 0.20 at 18 h.
Processes 02 00218 g005

3.4. Spatial Translocation of Aquaporin 4

In brain astrocytes, AQP4 channels are highly expressed in the endfeet [46]. After the translation of the protein, AQP4 proteins are packed into vesicles and transported towards the endfeet via the cytoskeleton [47]. The modeling of the AQP4 packing mechanism into the vesicle is initiated by the generation of a random number from 1 to 50. Initially, the diffusivity of the vesicle is assumed to be zero, while the “packing” of AQP4 occurs. Once the number of AQP4 proteins reaches the selected random number, the vesicle now assumes a non-zero diffusivity and goes into diffusion followed by directed transport.
Finally, we demonstrate a qualitative comparison of the spatial AQP4 distribution in a single astrocyte cell with our simulated results as shown in Figure 6. Immunofluorescence image of a single astrocyte stained with anti-AQP4 antibody in Figure 6a shows AQP4-immunopositive vesicles inside the cell body as well as within astrocytic processes. Concentrated AQP4 immunoreactivity is observed in the endfeet processes. The simulated result of spatiotemporal intracellular trafficking of AQP4 in transport vesicles (blue spheres) on the microtubule cytoskeleton (red) of an astrocyte is shown in Figure 6b. In the cell simulator, AQP4 molecules are concentrated at the endfeet of the processes, in agreement with the physiological expression of AQP4. We compared the spatial distribution of AQP4 in our cell simulator with observed patterns of AQP4 expression as shown in Figure 6a.
However, the number of AQP4 containing vesicles or AQP4 tetramers concentrated at a single endfoot cannot be quantified with the immunofluorescence technique that was employed in this study due to limitations in resolution. In future studies, a quantitative validation of AQP4 spatial polarization at the astrocytic endfeet in the model could be performed with techniques such as freeze fracture electron microscopy [48] to quantify the number of AQP4 tetramers concentrated at a given endfoot membrane.
Figure 6. AQP4 trafficking in primary cultured astrocytes (a) and in the cell simulator (b). In (a), AQP4 proteins are seen in vesicles in the cell body as well as along astrocytic processes during their transport towards the endfeet. In (b), microtubules (red) and associated transport vesicles containing AQP4 (blue) in the reconstructed astrocyte cell are visualized.
Processes 02 00218 g006

3.5. Validation of the Model

Western blot (WB) was performed to quantify the upregulation of AQP4 by 13 µM of SFN. For SDS-PAGE gel electrophoresis, cell lysates were prepared after 9 and 18 h of continuous SFN exposure. The results show that AQP4 expression was 1.48 and 1.68 fold higher than control after 9 and 18 h of SFN exposure as shown in Figure 7. The data confirmed that SFN induces upregulation of AQP4 in astrocyte cells, in agreement with previous findings that SFN injection induces AQP4 upregulation in the brain. Zhao et al. found a 65% upregulation of AQP4 24 h after SFN administration in an in vivo model of traumatic brain injury [18].
The comparison between measurement and simulated AQP4 upregulation is shown in Figure 7b. A close agreement is observed between the measured AQP4 levels and simulations. By employing data on transcription factor translocation and the resultant change in protein levels, the model derives interesting insights on the frequency of “on” and “off” states of the gene, the dynamic increase and drop of its transcripts, and the intracellular trafficking of proteins during the SFN-induced upregulation.
Figure 7. Western blotting shows that SFN induced a 48% upregulation of AQP4 after 9 h of continuous exposure, and 68% upregulation after 18 h compared to control (a); Cell simulator results agree with measured expression levels of AQP4 (b).
Processes 02 00218 g007

4. Conclusions

Many different molecular biological assays and biochemical techniques can be used to investigate intracellular process encompassing events starting at gene activation to the final expression of its encoded protein. These datasets provide time profiles of gene activation, transcripts, or protein levels and its spatial distribution pattern in a cell or in a population of cells. In order to derive a complete understanding of the dynamics of protein expression in a particular system, however, it is difficult to quantitatively measure every species involved in the biogenesis of a protein at every step in a time-dependent fashion due to limitations in time and resources. Oftentimes, data on relative expression levels allows the postulation of transcription and translation dynamics of the system, but these hidden kinetics cannot be extracted without using quantitative tools. Furthermore, time-dependent protein localization in specific cellular domains observed by fluorescence microscopy can be incorporated to derive the kinetics of trafficking and expression, after the transcription and translation step. Our case study derived additional insights about the unknown aspects of the chosen system: gene activation status and dynamic transcript levels, based on experimental observations on the transcription factor translocation and the target protein upregulation.
The single cell simulator provides a platform for performing quantitative analysis of cellular events using and integrating biological data from various common molecular biology techniques. To simulate trafficking events, the microtubule cytoskeleton was generated by a novel growth algorithm. In addition, the event-based stochastic simulation technique allows the tracking of individual molecules at any point in time. The approximated Gillespie algorithm reduced the computational cost and captured the discrete and stochastic nature of transcriptional and translational events inside a single cell. Conversely, the average of repeated stochastic simulations is suitable for representing the behavior of an entire cell population. Finally, we used a deterministic model to validate the averaged trajectories from our stochastic computations with good agreement. The analysis of cellular events in silico incorporating experimental data acquired with various modalities can reveal hidden kinetics and facilitate the efficient design of future experiments in systems biology by making robust predictions of cellular response.

Nomenclature

kb
DNA activation rate
kub
DNA inactivation rate
ktc
mRNA transcription rate
ktl
AQP4 translation rate
kdr
mRNA decay rate
kda
AQP4 decay rate
DNA*
activated DNA molecule

Acknowledgments

The authors gratefully acknowledge Simon Alford for generating the images of primary astrocytes with confocal microscopy.

Conflicts of Interest

The authors declare no conflict of interest.

Appendix

A. Nuclear Translocation of Nrf2

Nrf2 is a putative TF of the AQP4 gene [18,19]. To see the activation level of Nrf2 by SFN, the nuclear translocation of Nrf2 phosphorylated at the serine 40 position (pNrf2) was quantified by immunofluorescence. It has been shown that the phosphorylation of Nrf2 at this site is required for Nrf2 translocation [49]. Cells grown in 12-well plates were treated with media containing 13 µM of SFN for 15 min, 30 min, 1.5, 3, 9, and 18 h. Since SFN was dissolved in DMSO prior to dilution in media, cells treated with DMSO-vehicle for these time points were used as controls. At the end of the exposure period, cells were fixed in 4% paraformaldehyde, permeabilized with acetone, and blocked in 1% bovine serum albumin. Primary antibody specific for Nrf2 phosphorylated at serine 40 site was purchased from Biorbyt and primary antibody incubation was carried out overnight. On the next day, samples were incubated with secondary anti-rabbit antibody conjugated to Alexa594 (Santa Cruz Biotechnology, Santa Cruz, CA, USA) and subsequently stained with DAPI. Samples were imaged with Zeiss AxioScope fluorescence microscope (Carl Zeiss Microscopy, Göttingen, Germany). For the purpose of quantifying fluorescence intensity inside the nuclear region, all parameters were held constant during the staining procedure and fluorescence images were acquired with a fixed exposure time. The fluorescence intensity of pNrf2 inside the nucleus was quantified with ImageJ [50], and the mean intensity was derived by averaging 20 cells per treatment group.

B. Quantification of AQP4 Expression

Rat primary cortical astrocytes were purchased from Lonza. Cells were grown at 37 degrees Celsius with 5% CO2. Astrocyte growth media (Gibco, Madison, WI, USA) contains 10% FBS supplemented with 1% penicillin/streptomycin and 1:500 amphotericin B. Growth media was changed twice a week and cells were passaged when confluent.
To quantify AQP4 upregulation by SFN, cell lysates were prepared by lysing with RIPA buffer after 9 h and 18 h of continuous SFN treatment at 13 µM. Bradford assay was performed to ensure equal loading of proteins. SDS-PAGE gel electrophoresis was performed on a TetraCell Mini system (BioRad, Hercules, CA, USA) using AnykD polyacrylamide gels (Biorad, Hercules, CA, USA). After transfer and blocking in bovine serum albumin, membrane was incubated with mouse anti-AQP4 primary antibody (Abcam, Cambridge, MA, USA) overnight. On the next day, secondary antibody (anti-mouse tagged with HRP) was applied for 1.5 h followed by washing steps. Membrane was imaged with BioRad Chemiluminescence detection system (BioRad, Hercules, CA, USA). Large molecular weight aggregates were excluded from the quantitative analysis. Densitometry was performed with Image J [50].

C. Determination of Diffusivity

Diffusion of GFP-tagged fusion proteins inside distinct cellular compartments (ER, Golgi, cytoplasm) have been measured, and there is a wide range of diffusion rates depending on the size of the molecule and the specific cellular compartment. For example, diffusion of GFP (which is very small in size) inside the cytoplasm is 25 µm2/s [51]. On the other hand, diffusion of GFP-tagged E-cadherin on the plasma membrane is 0.03–0.04 µm2/s [52]. Inside the nucleoplasm, diffusion of GFP fusion proteins has the diffusivity of 0.24–0.53 µm2/s [53]. For simplicity, we have implemented a diffusion coefficient D = 0.125 µm2/s in our model, which is a reasonable estimate for computing the diffusion of molecules with a larger size.

References

  1. Wacker, I.; Kaether, C.; Kromer, A.; Migala, A.; Almers, W.; Gerdes, H.H. Microtubule-dependent transport of secretory vesicles visualized in real time with a GFP-tagged secretory protein. J. Cell Sci. 1997, 110, 1453–1463. [Google Scholar]
  2. Balla, T.; Varnai, P. Visualizing cellular phosphoinositide pools with GFP-fused protein-modules. Sci. STKE 2002, 2002, pl3. [Google Scholar]
  3. Cui, B.X.; Wu, C.B.; Chen, L.; Ramirez, A.; Bearer, E.L.; Li, W.P.; Mobley, W.C.; Chu, S. One at a time, live tracking of NGF axonal transport using quantum dots. Proc. Natl. Acad. Sci. USA 2007, 104, 13666–13671. [Google Scholar]
  4. Dahan, M.; Levi, S.; Luccardini, C.; Rostaing, P.; Riveau, B.; Triller, A. Diffusion dynamics of glycine receptors revealed by single-quantum dot tracking. Science 2003, 302, 442–445. [Google Scholar] [CrossRef]
  5. Howarth, M.; Takao, K.; Hayashi, Y.; Ting, A.Y. Targeting quantum dots to surface proteins in living cells with biotin ligase. Proc. Natl. Acad. Sci. USA 2005, 102, 7583–7588. [Google Scholar] [CrossRef]
  6. Courty, S.; Luccardini, C.; Bellaiche, Y.; Cappello, G.; Dahan, M. Tracking individual kinesin motors in living cells using single quantum-dot imaging. Nano Lett. 2006, 6, 1491–1495. [Google Scholar] [CrossRef]
  7. Seitz, A.; Surrey, T. Processive movement of single kinesins on crowded microtubules visualized using quantum dots. EMBO J. 2006, 25, 267–277. [Google Scholar] [CrossRef]
  8. Schwartz, A.L. Cell biology of intracellular protein trafficking. Annu. Rev. Immunol. 1990, 8, 195–229. [Google Scholar] [CrossRef]
  9. Klann, M. Development of a Stochastic Multi-scale Simulation Method for the Analysis of Spatiotemporal Dynamics in Cellular Transport and Signaling Processes. Ph.D. Thesis, University of Stuttgart, Stuttgart, Germany, 2011. [Google Scholar]
  10. Klann, M.T.; Lapin, A.; Reuss, M. Stochastic simulation of signal transduction: Impact of the cellular architecture on diffusion. Biophys. J. 2009, 96, 5122–5129. [Google Scholar] [CrossRef]
  11. Verkman, A.S. Aquaporins at a glance. J. Cell Sci. 2011, 124, 2107–2112. [Google Scholar] [CrossRef]
  12. Nielsen, S.; Nagelhus, E.A.; Amiry-Moghaddam, M.; Bourque, C.; Agre, P.; Ottersen, O.P. Specialized membrane domains for water transport in glial cells: High-resolution immunogold cytochemistry of aquaporin-4 in rat brain. J. Neurosci. 1997, 17, 171–180. [Google Scholar]
  13. Manley, G.T.; Fujimura, M.; Ma, T.; Noshita, N.; Filiz, F.; Bollen, A.W.; Chan, P.; Verkman, A.S. Aquaporin-4 deletion in mice reduces brain edema after acute water intoxication and ischemic stroke. Nat. Med. 2000, 6, 159–163. [Google Scholar] [CrossRef]
  14. Papadopoulos, M.C.; Manley, G.T.; Krishna, S.; Verkman, A.S. Aquaporin-4 facilitates reabsorption of excess fluid in vasogenic brain edema. FASEB. J. 2004, 18, 1291–1293. [Google Scholar]
  15. Zhao, H.D.; Zhang, F.; Shen, G.; Li, Y.B.; Li, Y.H.; Jing, H.R.; Ma, L.F.; Yao, J.H.; Tian, X.F. Sulforaphane protects liver injury induced by intestinal ischemia reperfusion through Nrf2-ARE pathway. World J. Gastroenterol. 2010, 16, 3002–3010. [Google Scholar] [CrossRef]
  16. Thimmulappa, R.K.; Mai, K.H.; Srisuma, S.; Kensler, T.W.; Yamamato, M.; Biswal, S. Identification of Nrf2-regulated genes induced by the chemopreventive agent sulforaphane by oligonucleotide microarray. Cancer Res. 2002, 62, 5196–5203. [Google Scholar]
  17. Kraft, A.D.; Johnson, D.A.; Johnson, J.A. Nuclear factor e2-related factor 2-dependent antioxidant response element activation by tert-butylhydroquinone and sulforaphane occurring preferentially in astrocytes conditions neurons against oxidative insult. J. Neurosci. 2004, 24, 1101–1112. [Google Scholar] [CrossRef]
  18. Zhao, J.; Moore, A.N.; Clifton, G.L.; Dash, P.K. Sulforaphane enhances aquaporin-4 expression and decreases cerebral edema following traumatic brain injury. J. Neurosci. Res. 2005, 82, 499–506. [Google Scholar]
  19. Umenishi, F.; Verkman, A.S. Isolation and functional analysis of alternative promoters in the human aquaporin-4 water channel gene. Genomics 1998, 50, 373–377. [Google Scholar] [CrossRef]
  20. Yenkie, K.M.; Diwekar, U.; Linninger, A.A.; Kim, S. A New Method for Parameter Estimation in Stochastic Differential Equations. In Proceedings of the AICHE Annual Meeting, San Fracisco, CA, USA, 3–8 November 2013; p. 589.
  21. Hattne, J.; Fange, D.; Elf, J. Stochastic reaction-diffusion simulation with mesoRD. Bioinformatics 2005, 21, 2923–2924. [Google Scholar] [CrossRef]
  22. Stiles, J.R.; Van Helden, D.; Bartol, T.M.; Salpeter, E.E.; Salpeter, M.M. Miniature endplate current rise times <100 mu s from improved dual recordings can be modeled with passive acetylcholine diffusion from a synaptic vesicle. Proc. Natl. Acad. Sci. USA 1996, 93, 5747–5752. [Google Scholar] [CrossRef]
  23. Loew, L.M.; Schaff, J.C. The virtual cell: A software environment for computational cell biology. Trends Biotechnol. 2001, 19, 401–406. [Google Scholar] [CrossRef]
  24. Tomita, M.; Hashimoto, K.; Takahashi, K.; Shimizu, T.S.; Matsuzaki, Y.; Miyoshi, F.; Saito, K.; Tanida, S.; Yugi, K.; Venter, J.C.; et al. E-cell: Software environment for whole-cell simulation. Bioinformatics 1999, 15, 72–84. [Google Scholar] [CrossRef]
  25. Birbaumer, M.; Schweitzer, F. Agent-based modeling of intracellular transport. Eur. Phys. J. B 2011, 82, 245–255. [Google Scholar] [CrossRef]
  26. De Heras Ciechomski, P.; Klann, M.; Mange, R.; Koeppl, H. From Biochemical Reaction Networks to 3D Dynamics in the Cell: The Zigcell3d Modeling, Simulation and Visualisation Framework. In Proceedings of the 2013 IEEE Symposium on Biological Data Visualization (BioVis), Atlanta, GA, USA, 13–14 October 2013; pp. 41–48.
  27. Raymond, G.M.; Butterworth, E.; Bassingthwaighte, J.B. Jsim: Free software package for teaching physiological modeling and research. FASEB J. 2003, 17, A390. [Google Scholar]
  28. Ander, M.; Beltrao, P.; Ventura, B.D.; Ferkinghoff-Borg, J.; Foglierini, M.; Lemerle, C.; Tomás-Oliveira, I.; Serrano, L. Smartcell, a framework to simulate cellular processes that combines stochastic approximation with diffusion and localisation: Analysis of simple networks. Syst. Biol. 2004. [Google Scholar] [CrossRef]
  29. Plimpton, S.J.; Slepoy, A. Chemcell: A Particle-Based Model of Protein Chemistry and Diffusion in Microbial Cells; Department of Energy: Albuquerque, NM, USA, 2003. [Google Scholar]
  30. Andrews, S.S.; Bray, D. Stochastic simulation of chemical reactions with spatial resolution and single molecule detail. Phys. Biol. 2004, 1, 137. [Google Scholar] [CrossRef]
  31. Boulianne, L.; Al Assaad, S.; Dumontier, M.; Gross, W.J. Gridcell: A stochastic particle-based biological system simulator. BMC Syst. Biol. 2008, 2, 66. [Google Scholar] [CrossRef]
  32. Le Novere, N.; Shimizu, T.S. Stochsim: Modelling of stochastic biomolecular processes. Bioinformatics 2001, 17, 575–576. [Google Scholar] [CrossRef]
  33. Arkin, A.; Ross, J.; McAdams, H.H. Stochastic kinetic analysis of developmental pathway bifurcation in phage λ-infected escherichia coli cells. Genetics 1998, 149, 1633–1648. [Google Scholar]
  34. Khanin, R.; Higham, D.J. Chemical master equation and langevin regimes for a gene transcription model. Theor. Comput. Sci. 2008, 408, 31–40. [Google Scholar] [CrossRef] [Green Version]
  35. Paulsson, J.; Berg, O.G.; Ehrenberg, M. Stochastic focusing: Fluctuation-enhanced sensitivity of intracellular regulation. Proc. Natl. Acad. Sci. USA 2000, 97, 7148–7153. [Google Scholar] [CrossRef]
  36. Isaacson, S.A.; Isaacson, D. Reaction-diffusion master equation, diffusion-limited reactions, and singular potentials. Phys. Rev. E 2009, 80, 066106. [Google Scholar] [CrossRef]
  37. Baras, F.; Mansour, M.M. Reaction-diffusion master equation: A comparison with microscopic simulations. Phys. Rev. E 1996, 54, 6139–6148. [Google Scholar] [CrossRef]
  38. Gillespie, D.T. Exact stochastic simulation of coupled chemical reactions. J. Phys. Chem. 1977, 81, 2340–2361. [Google Scholar] [CrossRef]
  39. Rodríguez, J.V.; Kaandorp, J.A.; Dobrzyński, M.; Blom, J.G. Spatial stochastic modelling of the phosphoenolpyruvate-dependent phosphotransferase (pts) pathway in Escherichia coli. Bioinformatics 2006, 22, 1895–1901. [Google Scholar] [CrossRef]
  40. Vale, R.D.; Reese, T.S.; Sheetz, M.P. Identification of a novel force-generating protein, kinesin, involved in microtubule-based motility. Cell 1985, 42, 39–50. [Google Scholar] [CrossRef]
  41. Steinberg, G.; Schliwa, M. Characterization of the biophysical and motility properties of kinesin from the fungus neurospora crassa. J. Biol. Chem. 1996, 271, 7516–7521. [Google Scholar] [CrossRef]
  42. Von Massow, A.; Mandelkow, E.M.; Mandelkow, E. Interaction between kinesin, microtubules, and microtubule-associated protein 2. Cell Motil. Cytoskeleton 1989, 14, 562–571. [Google Scholar] [CrossRef]
  43. Schwanhausser, B.; Busse, D.; Li, N.; Dittmar, G.; Schuchhardt, J.; Wolf, J.; Chen, W.; Selbach, M. Global quantification of mammalian gene expression control. Nature 2011, 473, 337–342. [Google Scholar] [CrossRef]
  44. Neely, J.D.; Amiry-Moghaddam, M.; Ottersen, O.P.; Froehner, S.C.; Agre, P.; Adams, M.E. Syntrophin-dependent expression and localization of aquaporin-4 water channel protein. Proc. Natl. Acad. Sci. USA 2001, 98, 14108–14113. [Google Scholar]
  45. Jain, A.K.; Bloom, D.A.; Jaiswal, A.K. Nuclear import and export signals in control of Nrf2. J. Biol. Chem. 2005, 280, 29158–29168. [Google Scholar] [CrossRef]
  46. Rash, J.E.; Yasumura, T.; Hudson, C.S.; Agre, P.; Nielsen, S. Direct immunogold labeling of aquaporin-4 in square arrays of astrocyte and ependymocyte plasma membranes in rat brain and spinal cord. Proc. Natl. Acad. Sci. USA 1998, 95, 11981–11986. [Google Scholar] [CrossRef]
  47. Rossi, A.; Baumgart, F.; van Hoek, A.N.; Verkman, A.S. Post-Golgi supramolecular assembly of aquaporin-4 in orthogonal arrays. Traffic 2012, 13, 43–53. [Google Scholar] [CrossRef]
  48. Furman, C.S.; Gorelick-Feldman, D.A.; Davidson, K.G.V.; Yasumura, T.; Neely, J.D.; Agre, P.; Rash, J.E. Aquaporin-4 square array assembly: Opposing actions of M1 and M23 isoforms. Proc. Natl. Acad. Sci. USA 2003, 100, 13609–13614. [Google Scholar] [CrossRef]
  49. Niture, S.K.; Jain, A.K.; Jaiswal, A.K. Antioxidant-induced modification of iNrf2 cysteine 151 and PKC-δ-mediated phosphorylation of Nrf2 serine 40 are both required for stabilization and nuclear translocation of Nrf2 and increased drug resistance. J. Cell Sci. 2009, 122, 4452–4464. [Google Scholar] [CrossRef]
  50. Rasband, W.S. Imagej; US National Institutes of Health: Bethesda, MA, USA, 1997. [Google Scholar]
  51. Swaminathan, R.; Hoang, C.P.; Verkman, A.S. Photobleaching recovery and anisotropy decay of green fluorescent protein GFP-s65t in solution and cells: Cytoplasmic viscosity probed by green fluorescent protein translational and rotational diffusion. Biophys. J. 1997, 72, 1900–1907. [Google Scholar] [CrossRef]
  52. Adams, C.L.; Chen, Y.-T.; Smith, S.J.; Nelson, W.J. Mechanisms of epithelial cell-cell adhesion and cell compaction revealed by high-resolution tracking of E-cadherin-green fluorescent protein. J. Cell Biol. 1998, 142, 1105–1119. [Google Scholar] [CrossRef]
  53. Phair, R.D.; Misteli, T. High mobility of proteins in the mammalian cell nucleus. Nature 2000, 404, 604–609. [Google Scholar] [CrossRef]

