Article

Absorption and Chemisorption of Small Levitated Single Bubbles in Aqueous Solutions

by
Alexander Tollkötter
and
Norbert Kockmann
*
TU Dortmund University, BCI, Equipment Design, Emil-Figge-Straße 68, D-44227 Dortmund, Germany
*
Author to whom correspondence should be addressed.
Processes 2014, 2(1), 200-215; https://doi.org/10.3390/pr2010200
Submission received: 30 November 2013 / Revised: 28 January 2014 / Accepted: 28 January 2014 / Published: 24 February 2014

Abstract

:
The absorption and chemisorption of small bubbles with N2 or CO2 were investigated experimentally in aqueous and alkaline solutions. Different bubble sizes were studied ranging from 0.1 to 2.5 mm in alkaline concentrations of 0.1 mM to 1 M NaOH. The experiments were conducted in a device consisting of a converging microchannel with a down flowing liquid. Levitation positions of single bubbles were optically characterized. A correlation was developed for the drag force coefficient, CD, including wall effects based on the force equilibrium. A linear decrease of bubble diameters was identified with and without chemical reaction, which is referred to as a rigid bubble surface area. Measured Sherwood numbers agree well with the literature values for the investigated Reynolds number range.

Graphical Abstract

1. Introduction

Multiphase reactions are of major importance in chemical engineering and in many cases limited by mass transfer and mixing. Chemical reactions at fluid interfaces often occur, including the first contact of the involved phases and the generation of lamellae, bubbles and droplets. A large specific interface of the phases intensifies chemical reactions between the phases. Stitt describes conventional technologies of multiphase equipment in a comprehensive review [1], including trickle bed reactors, stirred and bubble columns and jet loop reactors. The major purpose of the devices is to generate a large fluid interface, where the reaction can take place.
Microchannels can handle mixing sensitive chemical reactions, due to their excellent mixing conditions and superior mass transfer characteristics in a homogeneous liquid [2] or gaseous systems [3], as well as for heterogeneous gas-liquid-solid systems [4,5]. While homogeneous systems are basically understood [6], multiphase transport phenomena with chemical reactions in microchannels are still a wide field in research and design. Microreactors offer short diffusions lengths and good transport characteristics, but capillary forces gain importance on the micro-scale. The state-of-the-art of multiphase flow, transport and transformation are reviewed by Günther and Jensen [7], Doku et al. [8], Hessel et al. [9], as well as Kashid and Kiwi-Minsker [10] for chemical reactions in microreactors. Exothermic reactions in microchannels can be treated with increased safety [11]. Nevertheless, the proper description and understanding of bubble flow, transport processes and reaction kinetics are essential for the successful application of microstructured devices [12].
An essential part is the determination of the mass transfer of a single microbubble before transition to the complex flow of bubble swarms in microstructured devices. An important parameter here is the liquid-side mass transfer coefficient, kL, represented in dimensionless form as the Sherwood number, Sh. Mass transfer depends on the surface of dissolving gas bubbles [13]. The surface attains different shapes according to the bubble’s size and rising velocity [14]. Additionally, the inner motion of the bubble improves the mass transfer [15]. This motion is influenced by the bubble size itself and its surface contamination. Air bubbles in water with diameters smaller than 0.2 mm act as solid spheres without any motion, due to dominant surface tension, generally [14,16,17]. Contamination is affected by the liquid purity in terms of salt and ion concentration. High electrical conductivity or low resistance favors contamination. In water purified by an ion exchanger bubbles with diameters up to 1.6 mm showed a rigid behavior [18]. The constant decay of the bubble radius due to absorption was observed for several gases in tap water with a low solubility in this range of bubble sizes. A lower liquid saturation resulted in a higher rate [19]. In tap water, too, comparable values of diameter decay were found for air bubbles with diameters of 8 mm. Two different sections of decreasing radii instead were identified using clean water for several gases with a low solubility. This rate change was related to impurities in the water acting as surfactants and creating a stagnant cap at the bubble’s back, which hinders inner motions, due to Marangoni convection [20]. The absorption of highly soluble gas bubbles, especially carbon dioxide, was observed in different liquids and concentrations. For water, an initially high mass transfer coefficient was observed followed by a constant period of a reduced value. The change occurred in a bubble diameter range of 1.0 to 1.5 mm. This was also related to surface contamination and transition to a rigid bubble behavior [21]. Only one regime could be observed for diameters from 0.2 to 1.0 mm in contaminated water [22]. Bubbles with radii from 0.1 to 0.5 mm decrease faster in sodium hydroxide solutions with concentrations of 0.01 to 1 M by chemical reaction. Sherwood numbers were calculated and show 10% deviations from a non-equilibrium reaction model [23]. The reduction of linear radius decay with time at a larger diameter was related to a shrinking surface, due to contamination [24]. The relation between motion and bubble size is also affected by the bubble age. Hence, the exact transition point from a rigid to a mobile surface is not identified clearly [20]. For low soluble gases, this point appeared after minutes, which exceeds the residence time of most classical devices, such as stripping columns. Two approaches are established to capture bubbles and to increase the observation time: a rotary chamber [18] or using a conical tube with down flowing liquid [20].
In this paper, a device is presented to capture and levitate bubbles with diameters of 0.1 to 2.5 mm by downward flow in a conical tube. A drag force model, including wall effects, is developed to determine the rising velocity of the bubble. Hence, levitation positions were studied in more detail. Further absorption and chemisorption of N2 and CO2 bubbles were analyzed in various liquids to investigate the mass transfer concerning the difference between a mobile and a rigid bubble surface.

2. Theory

2.1. Bubble Rising Velocity and Drag Models

In liquids, several forces act on bubbles determining their rising velocity and position in the flow field. A differentiation between vertical and horizontal forces is possible. Bubbles behave as solid particles when a rigid surface and, consequently, no-slip boundary condition on their surface exist [15]. Non-uniform shear stresses cause solid particles to move away from the middle of the channel, due to different velocities on each bubble side. Wall interaction induces solid particle movement toward the middle of the channel. The balance of both forces results in an equilibrium radius, req, mainly dependent on size, which lets larger solid particles stay closer to the center line. This radius represents the distance between the solid particle center and the central axis [25].
Regarding the vertical direction, the drag force consists of a pressure and a friction part. Friction originates from the viscous forces of the surrounding liquid and dominates for small Reynolds numbers. The pressure part becomes more important for flow detachment from the bubble and resultant eddies, due to the higher velocities. Both parts are combined using the drag force coefficient, CD [26]. Furthermore, buoyancy force gives a vertical force balance, written as:
Processes 02 00200 i001
or in non-dimensional form:
Processes 02 00200 i002
Here, ρ1 and ρg are liquid and gas densities, u the liquid velocity, Ab the bubble surface normal to the flow, g the gravitational acceleration, db the bubble diameter and Re the Reynolds number. Ellipsoids are described by their main diameters, a and b, due to the arrangement to the flow, also known as Feret diameters. The diameter of a volume-equivalent sphere, de, is then calculated by Equation (3). For low aspect ratios, the deviation from an ideal sphere is negligible [20].
Processes 02 00200 i003
Many correlations describe drag coefficients for different condition in various devices. Beside the Stokes range for very small Re, bubbles and solid particles behave differently [15]. Most of these correlations are only valid for an infinite flow field. Two approaches consider wall effects with an additional correction factor, K. The first one was developed for particles [26]. For both, all constants are summed up to constants Ki.
Processes 02 00200 i004
Here, CD, is the drag force coefficient for an infinite flow field. Some empirical correlations modeling Ki are listed in [26,27]. Most of these correlations have the same form as a division of two polynomials, where the denominator has a higher order. Each polynomial depends on the ratio of bubble diameter to channel width λ.

2.2. Mass Transfer of Single Bubbles

When gas and liquid are in contact, mass transport occurs over the interface between the phases driven by concentration gradients. Transfer from the gas to the liquid is termed absorption and depends mainly on the liquid’s loading of the gas component. Generally, the gas-side resistance is several orders of magnitude lower than the one on the liquid side. Hence, the first one is neglected in most cases. The general equation for mass transfer from a bubble to a liquid is expressed as follows:
Processes 02 00200 i005
Here, n is the amount of a substance, kL the liquid side mass transfer coefficient, A the contact surface and c0 and cl the mole concentrations at the gas-liquid interface and in the liquid bulk. If cl is negligibly small, Equation (5) can be transformed into the following using the ideal gas and Henry’s law.
Processes 02 00200 i006
H is the Henry constant, pb and Vb the pressure and volume of the gas bubble, R the universal gas constant and T the temperature in K. The Henry constant for electrolyte solutions is calculated with Equation (7) [28].
Processes 02 00200 i007
Here, Hw is the Henry constant for water calculated by the method given in [29], h the contribution referring to positive and negative ions and to the gas and z the valence electrons. Differentiation of Equation (6) gives (corresponding to [30]):
Processes 02 00200 i008
If the bubble volume, Vb, of a sphere and the bubble surface, A, are inserted into Equation (8), it can be rewritten using the definition of Sh to:
Processes 02 00200 i009
Here, D is the diffusion coefficient calculated by the method given in [31]. Other physical properties were drawn from [32]. The bubble’s internal pressure consists of atmospheric pressure, hydrostatic pressure and surface tension pressure according to Equation (10).
pb = patm + ρl gh + 4σ / db
Here, patm is the atmospheric pressure, h the height of the water head and σ the surface tension. If bubbles are levitated at the same position and the fluid properties stay constant, pressure change in the bubble depends only on variation of db. In the range of diameters from 2.0 to 0.05 mm, the surface tension pressure change can be calculated to differences of 58 mbar for a water/air-system and is therefore negligibly small. This result is valid for all aqueous solutions in this work. Hence, Equation (9) can be written as follows:
Processes 02 00200 i010
In a more general form, Sh is only a function of Re, in which Equation (11) can be transformed to:
Sh = C1 Re
With:
Processes 02 00200 i011
Sh for bubbles with mobile surfaces can be calculated according to Higbie’s theory as follows:
Sh = 1.13 Re1/2 Sc1/2
or, for bubbles with a rigid surface, after Froessling [13] with:
Sh = 0.6 Re1/2 Sc1/3
Here, Sc is the Schmidt number as the ratio of v and D.
If a chemical reaction is superimposed, the absorption changes to chemisorption. Chemisorption proceeds more quickly, generally, regarding a steeper concentration gradient at the phase boundary. The enhancement factor, E, classifies the acceleration of the absorption and is therefore defined as the ratio of chemisorption to the absorption rate.
Processes 02 00200 i012

3. Experimental Methods

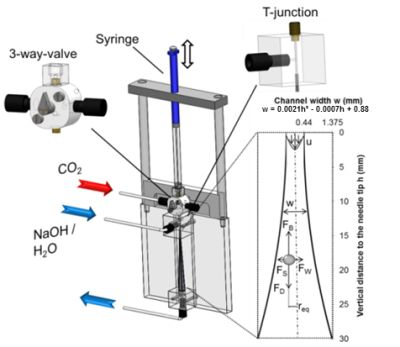
3.1. Apparatus and Procedure

Experiments were performed in an in-house build device consisting of a glass channel with an expanding quadratic cross-section, as shown in Figure 1. The channel is vertically positioned between two polyacrylic cubes, with the smaller cross-section facing toward the top. This cross-section has an inner width of 0.88 mm, while the larger cross-section at the bottom has a width of 3.0 mm. A correlation of channel width over height was measured and is given in Figure 1 for later calculation of the mean velocity. The bottom cube is connected to a three-way valve with standard Teflon tubing and fittings, which were used as the connection type of choice, generally. The top polyacrylic cube contains an inner T-junction. One side is connected to a three-way valve similar to the bottom valve. A stainless steel needle with an outer diameter of 0.4 mm is placed in the middle of the glass channel to generate bubbles with a diameter from 0.1 to 2.5 mm. The needle itself is connected to a micro three-way valve, which is connected to the gas bottle on one side and to a 50 µL syringe series 800 from Hamilton Messtechnik GmbH, Germany, on the other side. This valve has an inner volume of 16 µL only to improve the bubble generation with the syringe. The other three-way valves are used to control the flow direction. Syringe pumps (HLL200, Landgraf Laborsysteme HLL GmbH, Germany) feed the liquid flow in a range from 0.5 to 10 mL/min. Syringe pumps are connected to check valves for filling and delivery. Glass flasks with three connections are used as liquid reservoirs. Two of them are used for the liquid flow, while one is connected to the gas line or vacuum pump. Water and alkaline solutions of different concentrations and purities are used in terms of pH value (C3010 and SK20T probe, Consort bvba, Belgium) and electrical conductivity (741 probe with the conductivity meter SevenEasy S30, Mettler­Toledo GmbH, Germany). Tap water (0.0034 MΩcm), deionized water (0.34 MΩcm) and Merck Millipore (Merck KGaA, Germany) treated water (5.0 MΩcm) are used. Sodium hydroxide is purchased from Merck KGaA, Germany. Nitrogen (5.0, 99.999% pure) and carbon dioxide (technical grade, 99.5% pure; 4.5, 99.995% pure) from Messer Group GmbH, Germany, as well as pressurized air are investigated in the set-up. An Advance ICD (10×)–(160×) transmitted-light microscope from Bresser GmbH, Germany, is used for visualization with a length scale mounted next to the glass channel. A D7000 digital camera from Nikon GmbH, Germany, with an AF Nikkor 24–85 mm f/2.8-4D IF macro-objective and a MotionXtra NR4 Speed 2 high-speed camera from ImagingSolutions GmbH, Germany, are connected to the microscope for documentation.
Figure 1. Drawing of the experimental device with details of one polyacrylic cube, the microvalve and a sketch of the inside of the glass channel with all the forces acting on the bubble.
Processes 02 00200 g001
All glass flasks are rigorously cleaned with acetone and Millipore water several times. Afterwards, they are dried using nitrogen and filled with the studied liquid. Conductivity is measured directly in the flasks and at the end of the experimental set-up to ensure the removal of all surfactants.
For degassing a vacuum of 80 mbar absolute pressure is applied to the flasks for thirty minutes while being stirred in an ultrasonic bath. Temperature is held constant at 20 °C. The liquid is circulated through the experimental set-up during the entire investigation. Pre-saturated solution is generated with an alternated operation of degassing and pressurization with the desired gas. The gas side of the set-up is purged for 10 min to ensure that the same gas quality in the syringe is as in the bottle. Then, the microliter syringe is filled with gas.
Deionized water and air are used to study the drag force coefficient. Bubbles are injected into the liquid. A bubble is generated at the needle tip, while pressing the syringe. The bubble detachment is controlled by the flow rate and, hence, by the momentum force of the liquid. The bubble position after levitation is recorded with the digital camera. Several bubble diameters and flow rates are studied in combination. Limitations exist, because of the channel dimensions. Too high of a flow rate flushes the bubbles out of the channel, while too small of a flow rate lets the bubbles rise back to the needle tip. Because of this, a narrow range of Re was studied for each λ. For absorption experiments, bubble growth at the tip is shortened to rapidly ensure steady flow around the whole bubble surface. Therefore, higher flow rates are used, resulting in only small bubbles for these experiments. The absorption of larger diameters and bubble age are studied by generating bubbles in a saturated solution and switching afterwards to a degassed solution.

3.2. Bubble Diameter Determination with ImageJ

The recorded images are analyzed using the software tool, ImageJ (Wayne Rasband, National Institutes of Health, USA, 2012). At the beginning of each experiment, a reference value is measured from the analyzed image with the length scale next to the glass channel. Furthermore, bubble-wall and bubble-needle tip distances are determined. Afterwards, the image is transformed to binary data according to a set threshold, while all irrelevant details are filtered. The Feret diameters of the bubbles are measured and transferred into a size using the reference distance. An equivalent diameter is calculated with Equation (3). The transformation into a binary picture removes 5 pixel of the bubble diameter at the maximum and only 2 as an average. This results in a maximal total error of 10% for the smallest and 0.1% for the largest bubbles, with a typical pixel size of approximately 2 µm.

4. Results and Discussion

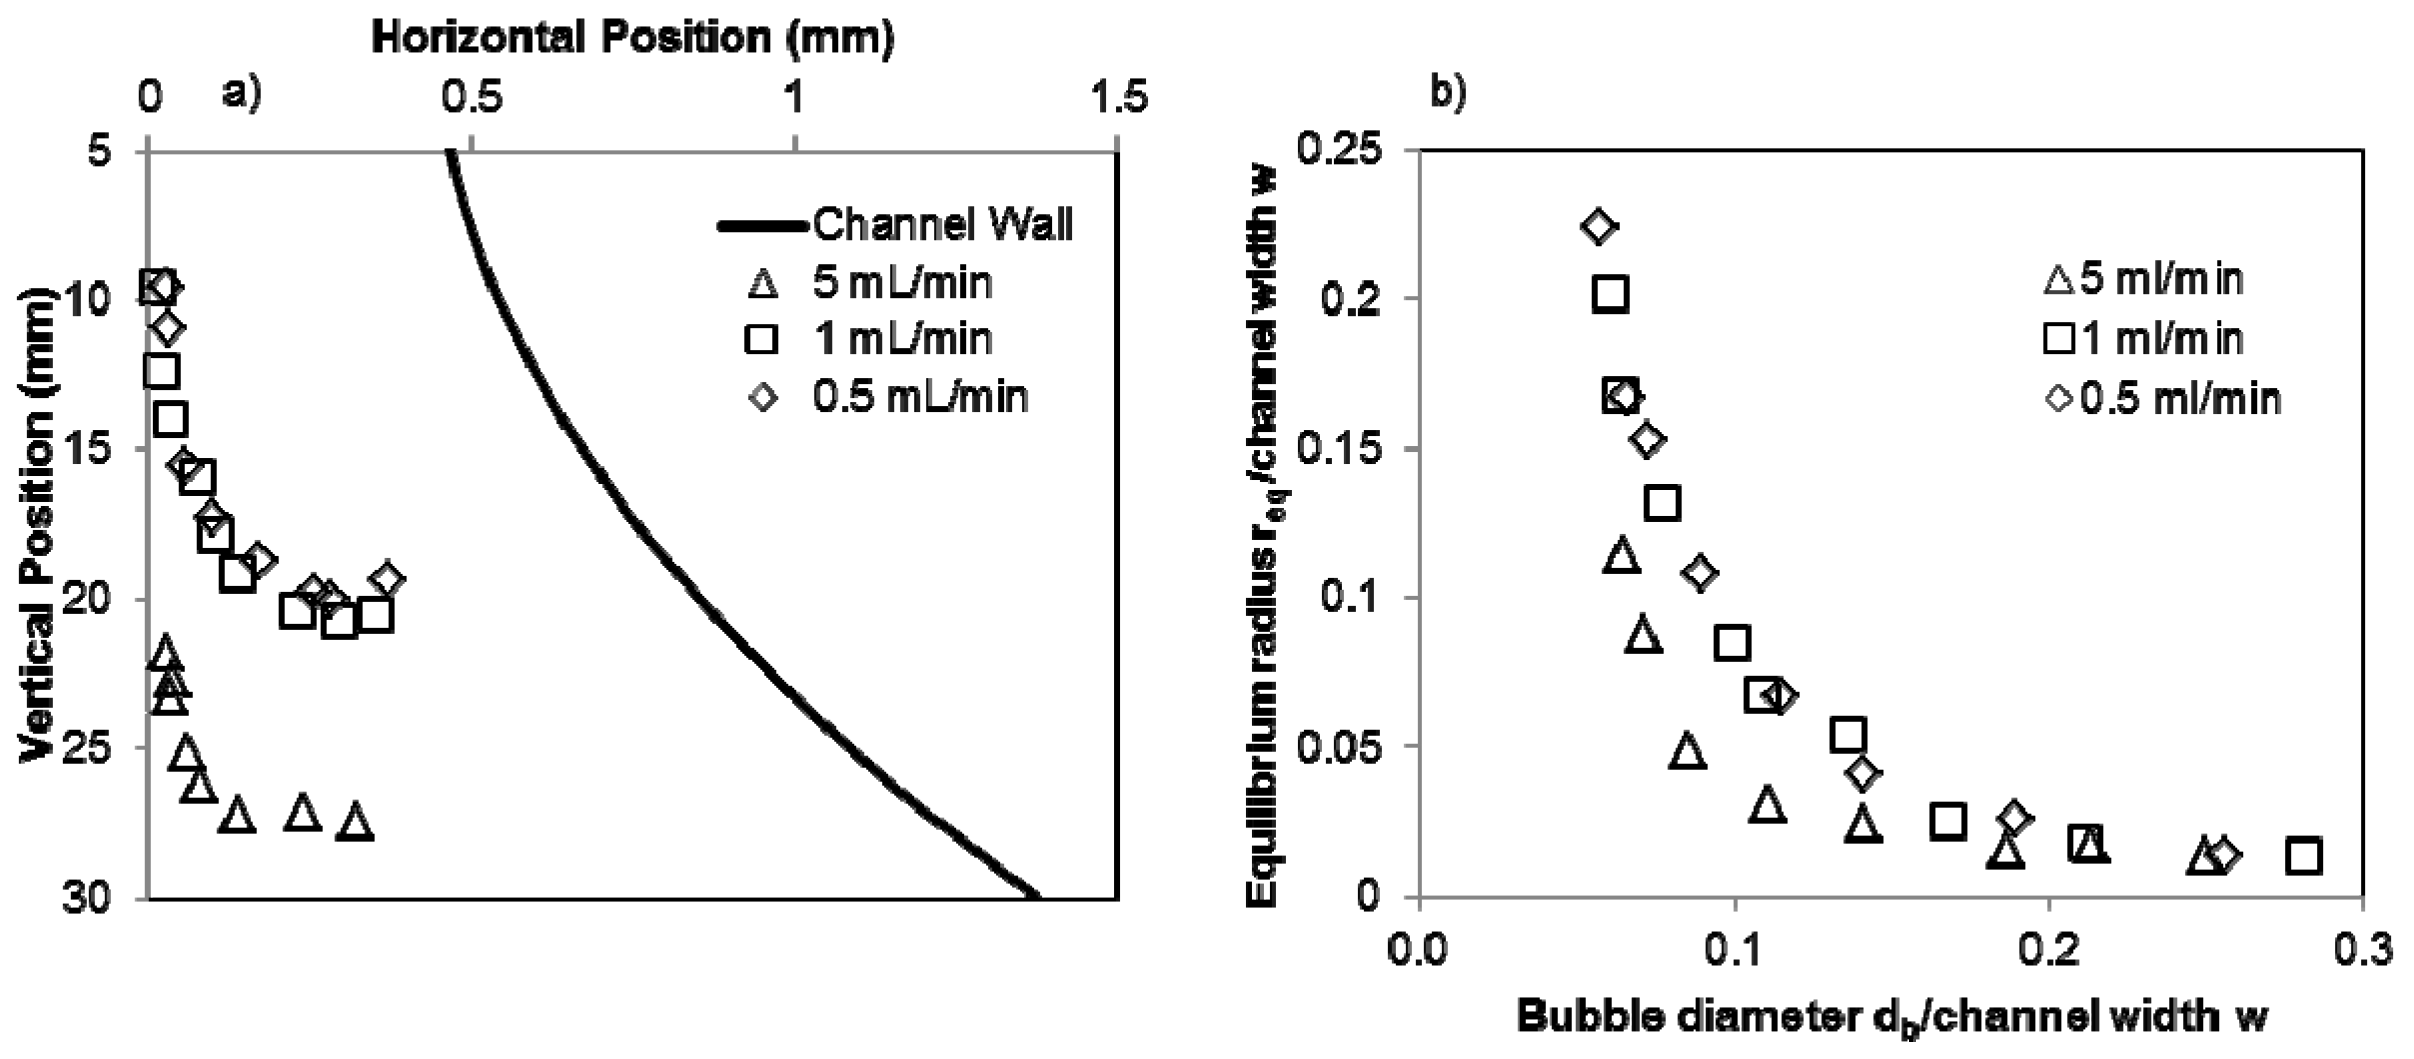
4.1. Levitation Position

Levitation was observed for air bubbles of the same diameter for different volumetric flow rates, due to the diverging channel width and wall interaction. The same tendency is valid vice versa. Figure 2a shows the horizontal levitation positions over the vertical positions of decreasing bubble diameters for different volumetric flow rates. The vertical position is measured in the flow direction and shown in the diagram, too. The displayed points represent the bubble center. Additionally, the inner wall of the glass channel is shown. The stabilizing position of the bubble moves downward for smaller bubbles, generally, as a consequence of the reduced buoyancy forces. In addition, the radius, req, of the equilibrium position increases, as seen in Figure 2b. Higher flow rates imply the same tendency regarding larger drag forces. Bubbles stay in the middle of the channel for λ > 0.5. Differences to this central position are identified for smaller ratios in an increasing manner; thus, each equilibrium radius is larger for smaller bubbles. This general trend corresponds with the solid particles studied in [33]; even equilibrium radii are notably smaller here.
Figure 2. (a) The horizontal levitation position with the vertical levitation position of the bubbles; (b) The non-dimensional equilibrium radius with the non-dimensional bubble diameter for the levitated bubbles.
Processes 02 00200 g002

4.2. Modeling Drag Force Coefficient CD

If wall effects are neglected and a uniform velocity profile is assumed, Re is calculated with bubble rising speed or flow velocity in the stagnation point. In this work, acceleration of the liquid flow around a bubble is higher with increasing λ, due to the growing blockage of the cross-section by the bubble. Here, an average difference between mean velocities of 30% occurs in the stagnation point and the center point of the bubble. Furthermore, the flow velocity changes in the radial direction, due to the small channel dimensions. The calculated drag force coefficients with simplified velocity integration over the bubble surface similar to [26] differ from those using the mean velocity in the stagnation point in the same order. Deviations for drag force coefficients are less than 1% by the mean velocity at the center of the bubble considering the cross-section blockage. For that reason, reference velocities are calculated from the known volume flow rates and the free cross-section at the bubble’s midpoint height as a simplified modeling approach similar to [34].
Figure 3d shows drag force coefficients calculated by Equation (2) as points based on experimental results. Different values for the same Reynolds numbers occur because of wall effects. In contrast to a free rising bubble, not just one curve is applicable for the drag force coefficient. Higher ratios of λ increase the coefficient and lead the curves away from the axis, as is shown by [26], too. The comparison of the given correlations show the high deviations of the drag force coefficients in infinite flow fields. According to both approaches, including wall effects, Mei’s equation [15] is valid for CD∞ and offers the best results in the investigated bubble range. Constants KI and KII are calculated by the least-squares method. Figure 3a,b shows the determined values and their correlations. An exponential and a double-linear approach are used as the best-fitting curves for each constant. The intersection points of the straight lines are λ = 0.62 and λ = 0.648. The walls have to be considered for req < 2db [35], which is equivalent to λ larger than 0.2. No elongation of the bubbles was observed for these λ values. Therefore, larger constants and, hence, drag force coefficients are shown for higher values of λ, but further investigations have to clarify this observation. Deviations are smaller than 0.5% for all four fits, so similar results are given using either the exponential or linear modeling. In Figure 3c, good conformity is shown for the experimental results and the two modeling approaches according to Equation 4 for three λ exemplarily. The second approach multiplying KII with CD∞ approximates the calculated drag force coefficients even better. Thus, in Figure 3d, five modeled drag force coefficient curves with this approach are shown additionally to the experimental results mentioned before. The maximum deviations are lower than 8% for each λ in total, which involves an accurate correlation.
Figure 3. (a,b) Constants KI and KII with λ; (c) Calculated and correlated drag coefficients CD with Re for three λ values; (d) Calculated and correlated drag coefficients CD with Re for λ values from 0.1 to 0.9.
Processes 02 00200 g003

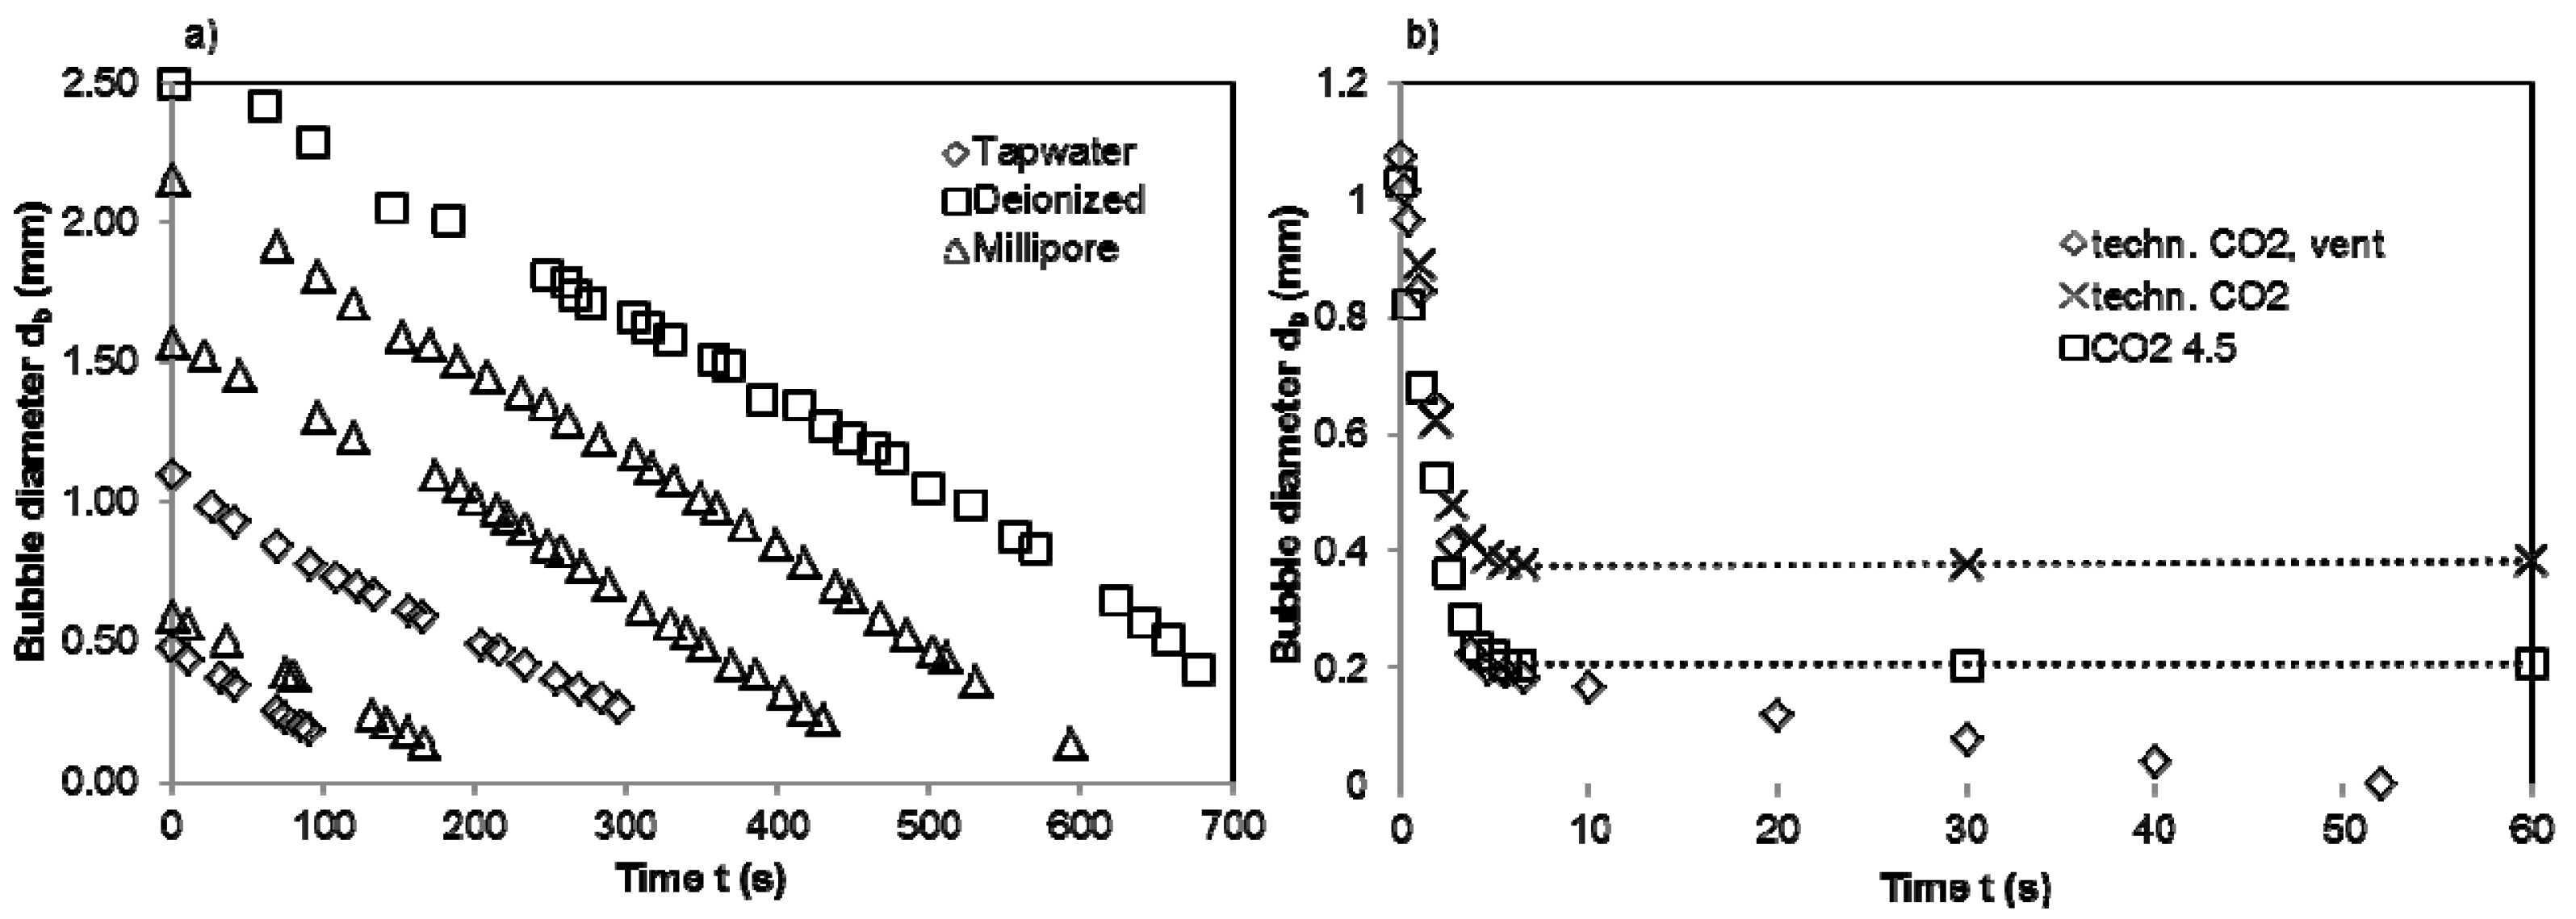
4.3. Absorption of N2 and CO2

Figure 4 shows the decreasing bubble diameters, due to the absorption of single nitrogen bubbles in degassed water of different purities. Bubble diameters decrease linearly independent of the starting diameters. The lines have a constant, nearly identical negative slope of 0.003 ± 0.0002 mm/s for all water purities considering the measuring inaccuracy. This indicates a similar dissolving speed of all bubble diameters and water purities. The determined value is comparable to that given in [19] and the second regime in [20], which was explained by a rigid bubble surface. Two different regimes are not identified in this work, even for the same range of bubble diameters as was observed by Vasconcelos et al. [20]. The accelerated absorption in their first regime was referred to as a mobile bubble surface. No water specifications were given by the authors. It can be assumed that very pure water was used, because the mobile surfaces were only observed by Duineveld [16]. Concerning our own experimental results, a generally immobilized bubble surface can be extended to water with an electrical resistance of 5.0 MΩ·cm and bubble diameters of 2.0 mm.
Figure 4b shows the decreasing bubble diameters, due to the absorption of carbon dioxide of different gas qualities in saturated and degassed deionized water. Bubble diameters stay constant after a rapid decrease from the start for saturated water. The final diameter has a distinct smaller value for a gas quality of 4.5 (>99.995 vol%) compared to the technical grade carbon dioxide. Both curves have an approximately identical slope; hence, the decrease refers to the absorption of carbon dioxide only. The calculated bubble diameter based on the impurities in the gas bottle and the start diameters corresponds to smaller values, as were observed in the experiments. In each bubble, the partial pressures of other gases are very low, since the purity of carbon dioxide is very high. The dissolved gases, mainly nitrogen, in the liquid diffuse into the gas bubble [20] and enlarge its volume. This desorption explains the larger diameter compared to the calculated values assuming only the gas feed composition. The bubble diameter still decreases, due to the higher absorption rate of carbon dioxide. A constant value is reached with a concentration equilibrium of saturated solution and identical partial pressures of the impurities in the bubble.
Figure 4. (a) The nitrogen bubble diameter with time in water of different purities; (b) The carbon dioxide bubble diameter with time. Technical (techn.) grade and quality 4.5.
Processes 02 00200 g004
In degassed deionized water, two regimes are identified. The first regime is nearly identical to the absorption of carbon dioxide in untreated water. The second regime is consistent with the absorption of nitrogen shown in Figure 4a, which confirms the explanation above. Calculation of the transition point of both regimes shows similar deviations concerning the gas composition in the gas bottle and the diffusion of dissolved gases in the liquid. During degassing, the vacuum pump reaches approximately 80 mbar absolute pressure, hence, the rest of the impurities stay in the solution and diffuse into the bubble.
The absorption of carbon dioxide 4.5 in degassed pure water was studied according to the experiments with nitrogen, too. For each starting diameter, similar curves were determined. The absorption of carbon dioxide occurs rapidly followed by a slower absorption of nitrogen. In each case, the bubbles disappear completely. For small start diameters, the transition point is located at a diameter below 0.2 mm, which means a constant diameter decrease below the transition point from the rigid to the mobile surface in the purest water. Absorption in tap water shows the same tendency. Schulze and Schlünder [21] observed two regimes of carbon dioxide absorption in different pre-saturated aqueous solutions. The transition point was located at diameters between 1.0 and 1.5 mm. They explained the two regimes by the bubble surface condition change. The measured diameter decreasing rate in their first regime has a value of approximately 0.3 mm/s. This is similar to the rate measured in this work. No gas or water qualities are given by the authors. Therefore, it cannot be verified if the two regimes belong to a surface condition change or to gas qualities, as discussed before. Takemura and Yabe [22] also observed two linear regimes, which were explained by a mobile and a rigid bubble surface. The value of their first regime is slightly larger than the value given by [21] and from this work. The authors observed this value for the first 0.15 s. The bubble formation enhances the initial mass transfer [36], which might be a reason for these differences, due to the fact that Takemura and Yabe used a pipe with a bubble generator at the bottom. Their second regime deviates notably from Schulze’s and the values observed in this work. Finally, no consistent absorption rate exists for carbon dioxide in water. Since absorption shows a similar dependency as nitrogen, mentioned above, it is concluded that a rigid bubble surface occurs generally for water qualities lower than 5 MΩ·cm.

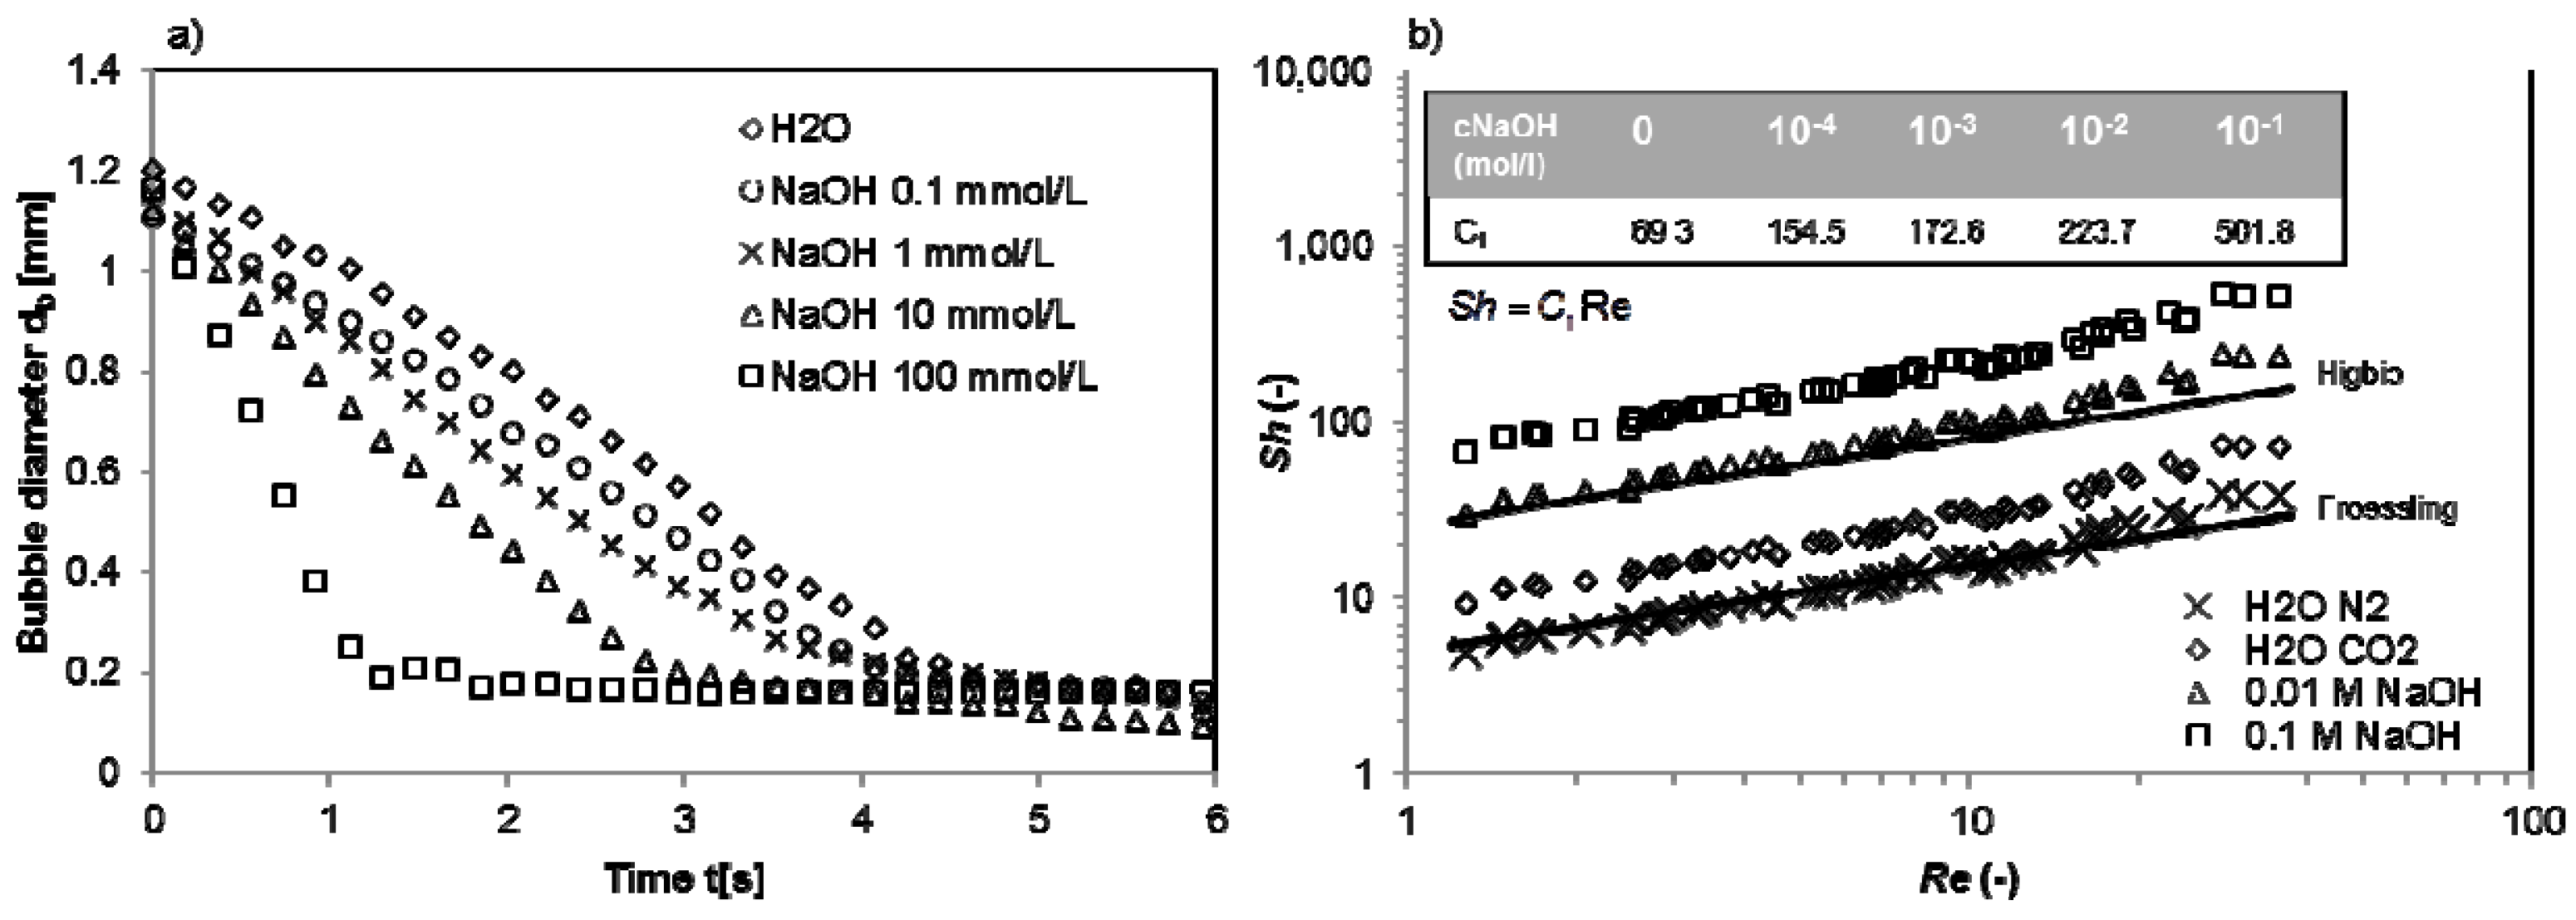
4.4. Chemisorption of CO2

Chemisorption of carbon dioxide was studied in alkaline solutions, too. Figure 5a shows the bubble diameter change over time. One curve of the absorption in water is also included. All curves show similar trends in terms of two regimes. Higher concentrations of alkaline solutions result in steeper slopes of the curves. For 1 M NaOH, the second regime was reached after less than 1 s. The chemisorption of carbon dioxide was too quick to adequately document this behavior. High variations were measured between single experiments in the range of −1.0 to −1.4 mm/s. The absorption rate is the same for NaOH with a concentration of 0.1 mmol/L and water, due to the very low concentration. Both lines run parallel considering a larger starting diameter of the bubble in water.
Figure 5. (a) The carbon dioxide bubble diameter with time in sodium hydroxide solutions of different concentrations; (b) The mass transfer coefficient depending on the flow rate and the bubble diameter, represented by Sh and Re.
Processes 02 00200 g005
In Figure 5b, the Sherwood numbers are shown for different alkaline solutions and water according to Equation (12). The calculated values of C1 are presented in the figure, too. For comparison, Equation (14) and Equation (15) of Higbie and Froessling are also given. Sh values for N2 in water align to the Froessling curves with only a low deviation. Sh values of CO2 in water are located between Higbie and Froessling with a minor tendency to Froessling’s equation. This confirms the observation of a rigid surface area. Regarding Equation (11), the Sherwood numbers are calculated with several parameters dependent on the concentration. The diffusion coefficient, density and Henry constant vary only slightly up to a concentration of 1 M; hence, the Sherwood numbers and kL increase, due to the steeper bubble decrease. The determined values are in the same order as the values from Takemura and Matsumoto [23], even for a smaller range of Re. The differences in the Reynolds numbers are refer to the device used in their work, since the rising velocities of free bubbles and, hence, the Reynolds numbers are larger due to a smaller drag force coefficient compared to this work. Madhavi et al. [24] determined E as a function of time in the range from 13 to 19 for 1 M NaOH. E can be calculated with kL assuming a negligible concentration in the bulk and an identical surface and concentration in the bubble. The ratio of the mass transfer coefficient with chemisorption to the one without depends on the bubble diameter decrease. For a value of −1.0 mm/s, E is determined to be 13, and for a value of −1.4 mm/s, E is 18, which corresponds to the data of Madhavi et al. very well.

5. Conclusions

Gas bubble flow without and with chemical reactions was investigated for the system of N2/CO2 in aqueous and alkaline solutions. Different bubble sizes ranging from 0.1 to 2.5 mm and concentrations from 0.1 mM to 1 M NaOH were studied. The experiments were conducted in a novel device consisting of a converging microchannel according to the design of Vasconcelos et al. [20] to increase the observation time of single bubbles. The device is more than one order of magnitude smaller compared to existing devices. Therefore, the inner volume of the complete set-up only has a few milliliters, which make this set-up favorable for very costly substances. A special feature is an inserted needle into the smallest cross-section of the channel to generate single, very small bubbles.
The levitation positions of the air bubbles were optically characterized in saturated water. A displacement from the center axis occurred, which was larger for smaller bubbles, corresponding to solid particles. Drag force coefficients, including wall effects, were determined based on two modeling approaches by a curve fitting dependent on the ratio of the channel width to the bubble diameter. Model data and experimental data deviate less than 8% from each other.
The absorption of N2 showed a linear decreasing bubble diameter with time until complete extinction of the bubbles. The range of an immobilized bubble surface was enlarged in terms of water purity and bubble diameters. Absorption and chemisorption of CO2 bubbles showed two linear regimes of diameter decreases independent of the gas composition. The first regime was related to pure CO2 and the second regime to impurities in the initial gas, mainly N2. Larger concentrations of NaOH result in faster bubble decreases. Mass transfer coefficients represented by the Sherwood numbers in correlation with Reynolds numbers and the enhancement factor were calculated showing comparable values from the literature. Comparison of Sh with the Froessling equation indicates a rigid bubble surface area for N2 and CO2.
In summary, this study shows the successful implementation of the absorption and chemisorption processes of microbubbles for a new device with an internal volume smaller than 1 mL for studying mass transport phenomena. Furthermore, other phenomena at the interface of a two-phase system can be investigated with extremely short, up to very long necessary observation times.

Nomenclature

a
maximum Feret diameter, mm
A
surface area, m2
Ar
Archimedes number, −
b
minimum Feret diameter, mm
c
concentration, mol∙m−3
C1
constant, −
CD
drag force coefficient, −
d
diameter, mm
D
diffusion coefficient, m2∙s−1
E
enhancement factor, −
h
Henry constant model parameter, −
h
height, mm
H
Henry constant, bar∙m3∙mol−1
k
mass transfer coefficient, m∙s−1
K
drag force model constant, −
n
amount of substance, mol
p
pressure, barg (gauge)
r
radius, mm
R
universal gas constant, J∙mol−1∙K−1
Re
Reynolds number, −
Sc
Schmidt number, −
Sh
Sherwood number, −
t
time, s
T
temperature, K
u
channel flow velocity, m∙s−1
V
volume, m³
z
valence electrons, −

Greek symbols

λ
ratio of bubble diameter to channel width, −
ρ
density, kg∙m−3
σ
surface tension, N∙m−1
ν
kinematic viscosity, m2∙s−1

Variable index nomenclature

atm
atmosphere
b
bubble
D
drag
e
volume equivalent
eq
equilibrium
g
gas
l
liquid
L
liquid
w
water
0
gas-liquid interface
infinite flow field

Acknowledgments

We want to thank Matthias Beck, Martin Matuschek and Thomas Patzer for their valuable lab work and contribution to this article. Special thanks go to Roland Schröder for building the device.

Conflicts of Interest

The authors declare no conflict of interest.

References

  1. Stitt, E.H. Alternative multiphase reactors for fine chemicals—A world beyond stirred tanks? Chem. Eng. J. 2002, 90, 47–60. [Google Scholar]
  2. Schneider, M.-A.; Maeder, T.; Ryser, P.; Stoessel, F. A microreactor-based system for the study of fast exothermic reactions in liquid phase: Characterization of the system. Chem. Eng. J. 2004, 101, 241–250. [Google Scholar] [CrossRef]
  3. Stefanidis, G.D.; Vlachos, D.G.; Kaisare, N.S.; Maestri, M. Methane steam reforming at microscales: Operation strategies for variable power output at millisecond contact times. AIChE J. 2009, 55, 180–191. [Google Scholar] [CrossRef]
  4. Crespo-Quesada, M.; Grasemann, M.; Semagina, N.; Renken, A.; Kiwi-Minsker, L. Kinetics of the solvent-free hydrogenation of 2-methyl-3-butyn-2-ol over a structured Pd-based catalyst. Catal. Today 2009, 147, 247–254. [Google Scholar] [CrossRef]
  5. Grasemann, M.; Renken, A.; Kashid, M.N.; Kiwi-Minsker, L. A novel compact reactor for three-phase hydrogenations. Chem. Eng. Sci. 2010, 65, 364–371. [Google Scholar] [CrossRef]
  6. Kockmann, N.; Roberge, D.M. Harsh reaction conditions in continuous-flow microreactors for pharmaceutical production. Chem. Eng. Technol. 2009, 32, 1682–1694. [Google Scholar] [CrossRef]
  7. Günther, A.; Jensen, K.F. Multiphase microfluidics: From flow characteristics to chemical and materials synthesis. Lab Chip 2006, 6, 1487–1503. [Google Scholar] [CrossRef]
  8. Doku, G.N.; Verboom, W.; Reinhoudt, D.N.; van den Berg, A. On-microchip multiphase chemistry—A review of microreactor design principles and reagent contacting modes. Tetrahedron 2005, 61, 2733–2742. [Google Scholar] [CrossRef]
  9. Hessel, V.; Angeli, P.; Gavriilidis, A.; Löwe, H. Gas-liquid and gas-liquid-solid microstructured reactors: Contacting principles and applications. Ind. Eng. Chem. Res. 2005, 44, 9750–9769. [Google Scholar] [CrossRef]
  10. Kashid, M.N.; Kiwi-Minsker, L. Microstructured reactors for multiphase reactions: State of the art. Ind. Eng. Chem. Res. 2009, 48, 6465–6485. [Google Scholar] [CrossRef]
  11. Kockmann, N.; Gottsponer, M. Heat transfer limitations of gas-liquid exothermic reactions in microchannels. In Proceedings of the ASME 2010 8th International Conference on Nanochannels, Microchannels, and Minichannels Collocated with 3rd Joint US-European Fluids Engineering Summer Meeting, Montreal, QC, Canada, 1–5 August 2010; Paper No. FEDSM-ICNMM 2010–30389. pp. 193–199.
  12. Kockmann, N. Sicherheitsaspekte bei der Prozessentwicklung und Kleinmengenproduktion mit Mikroreaktoren. Chemie Ingenieur Technik 2012, 84, 715–726. [Google Scholar] [CrossRef]
  13. Lochiel, A.C.; Calderbank, P.H. Mass transfer in the continuous phase around axisymmetric bodies of revolution. Chem. Eng. Sci. 1964, 19, 471–484. [Google Scholar] [CrossRef]
  14. Peebles, F.N.; Garber, H.J. Studies of the motion of gas bubbles in liquids. Chem. Eng. Prog. 1953, 49, 88–97. [Google Scholar]
  15. Kulkarni, A.A.; Joshi, J.B. Bubble formation and bubble rise velocity in gas-liquid systems: A review. Ind. Eng. Chem. Res. 2005, 44, 5873–5931. [Google Scholar] [CrossRef]
  16. Duineveld, P.C. The rise velocity and shape of bubbles in pure water at high reynolds number. J. Fluid Mech. 1995, 292, 325–332. [Google Scholar] [CrossRef]
  17. Garner, F.H.; Hammerton, D. Circulation inside gas bubbles. Chem. Eng. Sci. 1954, 3, 1–11. [Google Scholar] [CrossRef]
  18. Peters, F.; Biermann, S. Streulichtuntersuchungen an einem kleinen, levitierten Bläschen. In Proceedings of the Fachtagung der Deutschen Gesellschaft für Laser-Anemometrie, Karlsruhe, Germany, 7–9 September 2004.
  19. Nüllig, M.; Peters, F. Diffusion of small gas bubbles into liquid studied by the rotary chamber technique. Chemie Ingenieur Technik 2013, 85, 1074–1079. [Google Scholar] [CrossRef]
  20. Vasconcelos, J.M.T.; Orvalho, S.P.; Alves, S.S. Gas-liquid mass transfer to single bubbles: Effect of surface contamination. AIChE J. 2002, 48, 1145–1154. [Google Scholar] [CrossRef]
  21. Schulze, G.; Schlünder, E.U. Absorption von einzelnen gasblasen in vorbeladenem wasser. Chemie Ingenieur Technik 1985, 57, 233–235. [Google Scholar] [CrossRef]
  22. Takemura, F.; Yabe, A. Rising speed and dissolution rate of carbon dioxide bubble in slightly contaminated water. J. Fluid Mech. 1999, 378, 319–334. [Google Scholar] [CrossRef]
  23. Takemura, F.; Matsumoto, Y. Dissolution rate of spherical carbon dioxide bubbles in strong alkaline solutions. Chem. Eng. Sci. 2000, 55, 3907–3917. [Google Scholar] [CrossRef]
  24. Madhavi, T.; Golder, A.K.; Samanta, A.N.; Ray, S. Studies on bubble dynamics with mass transfer. Chem. Eng. J. 2007, 128, 95–104. [Google Scholar] [CrossRef]
  25. Matulka, P. Partikelbewegung und Trennung in laminar durchströmten Rohren mit nachfolgender Strömungsaufweitung. Ph.D. Thesis 2013. [Google Scholar]
  26. Clift, R.; Grace, J.R.; Weber, M.E. Bubbles, Drops and Particles; Academic Press: New York, NY, USA, 1978. [Google Scholar]
  27. Wham, R.M.; Basaran, O.A.; Byers, C.H. Wall effects on flow past solid spheres at finite reynolds number. Ind. Eng. Chem. Res. 1996, 35, 864–874. [Google Scholar] [CrossRef]
  28. Danckwerts, P.V. Gas-Liquid Reactions; McGraw-Hill: New York, NY, USA, 1963. [Google Scholar]
  29. Carroll, J.J.; Slupsky, J.D.; Mather, A.E. The solubility of carbon dioxide in water at low pressure. J. Phys. Chem. Ref. Data 1991, 20, 1201–1209. [Google Scholar] [CrossRef]
  30. Calderbank, P.H.; Lochiel, A.C. Mass transfer coefficients, velocities and shapes of carbon dioxide bubbles in free rise through distilled water. Chem. Eng. Sci. 1964, 19, 485–503. [Google Scholar] [CrossRef]
  31. Vas Bhat, R.D.; Kuipers, J.A.M.; Versteeg, G.F. Mass transfer with complex chemical reactions in gas-liquid systems: Two-step reversible reactions with unit stoichiometric and kinetic orders. Chem. Eng. J. 2000, 76, 127–152. [Google Scholar] [CrossRef]
  32. Perry, R. Perry’s Chemical Engineers Handbook, 7th ed.; McGraw-Hill: New York, NY, USA, 1997. [Google Scholar]
  33. Matas, J.-P.; Morris, J.F.; Guazzelli, E. Lateral force on rigid sphere in large-inertia laminar pipe flow. J. Fluid Mech. 2009, 621, 59–67. [Google Scholar] [CrossRef]
  34. Haberman, W.L.; Sayre, R.M. Motion of rigid and fluid spheres in stationary and moving liquids inside cylindrical tubes. David Taylor Model Basin Report 1958, 1143. [Google Scholar]
  35. Büchner, E.-W. Experimentelle Untersuchung über Strömungskräfte auf ruhend und bewegten Kugeln in einer ebenen Poiseuille-Strömung. Ph.D. Thesis 1987. [Google Scholar]
  36. Sakai, M.; Kusakabe, K. Gas absorption during the burst of an individual bubble on the water surface. J. Chem. Eng. Jpn. 2004, 37, 1117–1121. [Google Scholar] [CrossRef]

