Article

Electro- or Turbo-Driven?—Analysis of Different Blast Processes of Blast Furnace

1
Department of Thermal Engineering, SEP Key Laboratory of Eco-Industry, Northeastern University, Shenyang 110819, Liaoning, China
2
Shandong Iron & Steel Co., Ltd. Jinan Company, Jinan 250101, Shandong, China
3
Department of Standard Information, Huadian Electric Power Research Institute, Hangzhou 310030, Zhejiang, China
*
Author to whom correspondence should be addressed.
Processes 2016, 4(3), 28; https://doi.org/10.3390/pr4030028
Submission received: 31 March 2016 / Revised: 20 August 2016 / Accepted: 23 August 2016 / Published: 29 August 2016

Abstract

:
There has always been a dispute about the energy efficiency and energy cost of electro-driven and turbo-driven blast furnace (BF) blast processes. In order to find where the problem lies, energy efficiency analysis models and energy cost analysis models of electro-driven and turbo-driven blast processes were established, and the differences between the two driving processes in terms of theoretical minimum steam consumption, energy efficiency and energy cost were studied. The results showed that the theoretical minimum steam consumption of a blast process depends on steam thermodynamic properties and is unrelated to drive mode and drive process. A certain overlapped interval between electro-driven and turbo-driven blast processes in terms of energy efficiency exists. The equation for calculating the standard coal coefficient of steam was proposed, and the relationship to judge strengths and weaknesses of the two driving modes in terms of energy efficiency and energy cost was established. Finally, two companies were selected for case study research. The results led to different conclusions because of the differences between energy media in terms of standard coal coefficient and unit price. To select the best driving mode, plant-running conditions and energy prices of the region of operation in addition to other relevant factors should all be taken into account.

1. Introduction

With the voices for energy saving, emission reduction and green manufacturing growing louder, a series of mature and emerging energy-saving technologies have been successively applied for industrial purposes. Among them, the waste heat recovery technology has gained popularity by virtue of its strengths, including low investment, high benefits, less emission, etc. [1,2]. There are mainly two utilization patterns of waste heat, i.e., thermal utilization and power utilization. The former refers to the utilization of waste heat as a heat source for heating or drying purposes, while the latter refers to the utilization of waste heat to generate electric energy or mechanical energy for working purposes. It is thus clear that the power utilization pattern can be further classified into two types. In the first type, the steam generated by waste heat is first used for electricity generation, and then the electricity generated is used as a power source to drive rotary equipment, so it is referred to as electro-driven (or electrically-driven or electric in short) mode [3,4]. The second type, the steam generated by waste heat, is directly used as a power source to drive the rotary equipment, and is thus referred to as turbo-driven (or steam turbine-driven or steam-driven in short) mode [5,6].
The steel industry commonly adopts the electro-driven mode. With enterprises working towards energy-saving technologies and the growth of waste heat recovery, the surplus of steam quality gradually increases [7,8]. Although electricity generation can consume steam partially, the steam surplus (especially in summer) became an urgent problem to be solved due to the restriction of the input and management of power-generating equipment (particularly power grids). With the development of control and manufacturing technologies, enterprises started researching steam as power to drive large-scale rotary equipment. Currently, some companies successfully use steam to drive blowers, compressors, or pumps. This will inevitably influence the companies’ energy efficiency and energy costs and will also affect the calculation of energy-consumption indexes.
Although many studies on turbo-driven [9,10,11,12] and electro-driven [13] modes exist, only a few of them focus on the comparison of these two technologies. Safaiya et al. [14] analyzed strengths and weaknesses of electro-driven and turbo-driven pumps in different ways (i.e., driving energy efficiency, working energy efficiency and operating cost), and embedded the two pumps respectively into a 12.5 MW steam-generating set cycle for experimental analysis. They concluded that turbo-driven pumps are superior to electro-driven ones. Astvatsaturova et al. [15] designed a turbo-driven turbine and evaluated its working efficiency. Shi [16] studied the energy utilization rates of electro-driven and turbo-driven modes in the chemical field, and concluded that the energy utilization rate of the turbo-driven mode is twice what the electro-driven mode is. Han et al. [17] considered the energy consumption analysis and operating cost as evaluation criteria, and concluded that the best choice is the turbo-driven blast mode if the companies do not consider combined cycle of power plant (CCPP) projects.
Only few researchers [17,18] compared the two driving modes. Therefore, in the present work, several steel companies were selected to be surveyed. Among turbo-driven equipment in steel enterprises, blast furnace (BF) blowers are the most used. The main purpose of this study is to explore the influence of these two driving modes on energy efficiency, energy consumption, and energy cost theoretically by comparing the energy efficiency and energy cost of electro-driven and turbo-driven BF blowers of selected steel companies. To indicate the extra degree of energy consumption, specific energy consumption theory [19] was employed in this work. Also, an equation was proposed to calculate the standard coal coefficient of steam.

2. Background

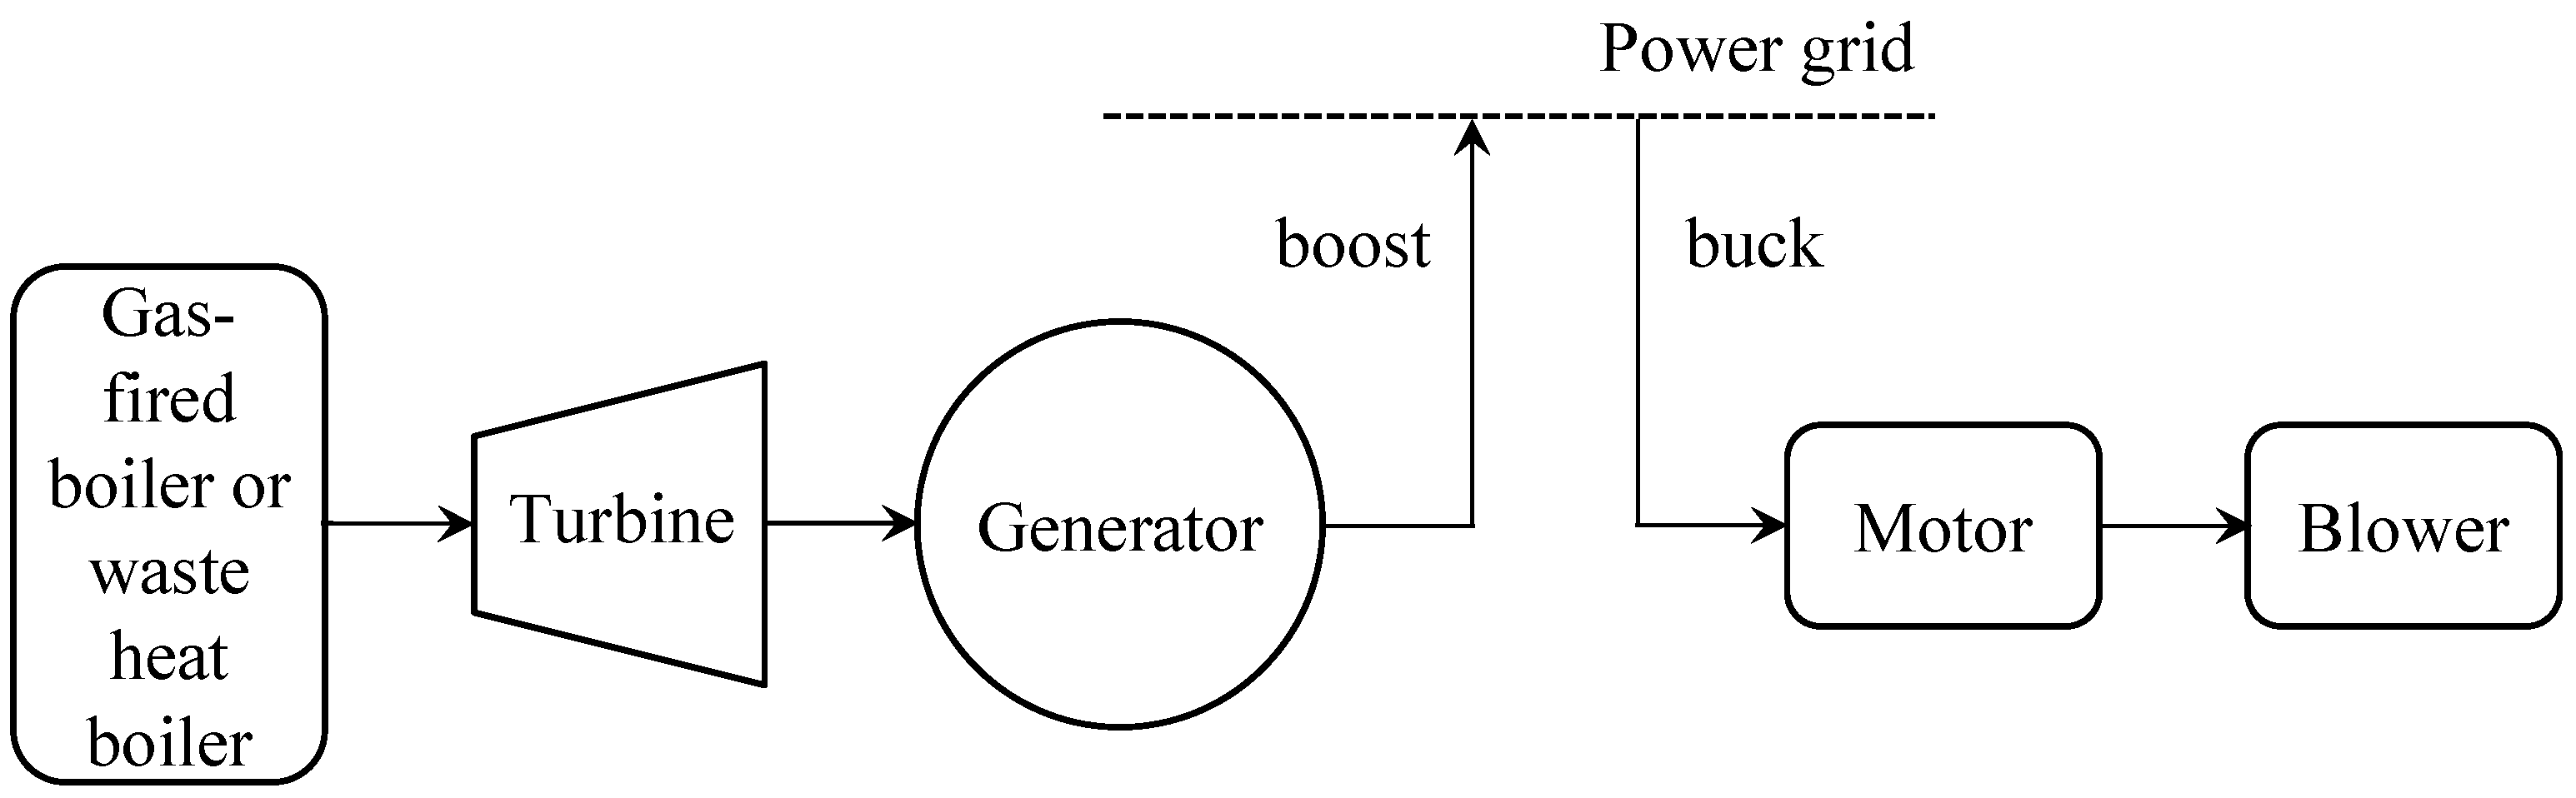
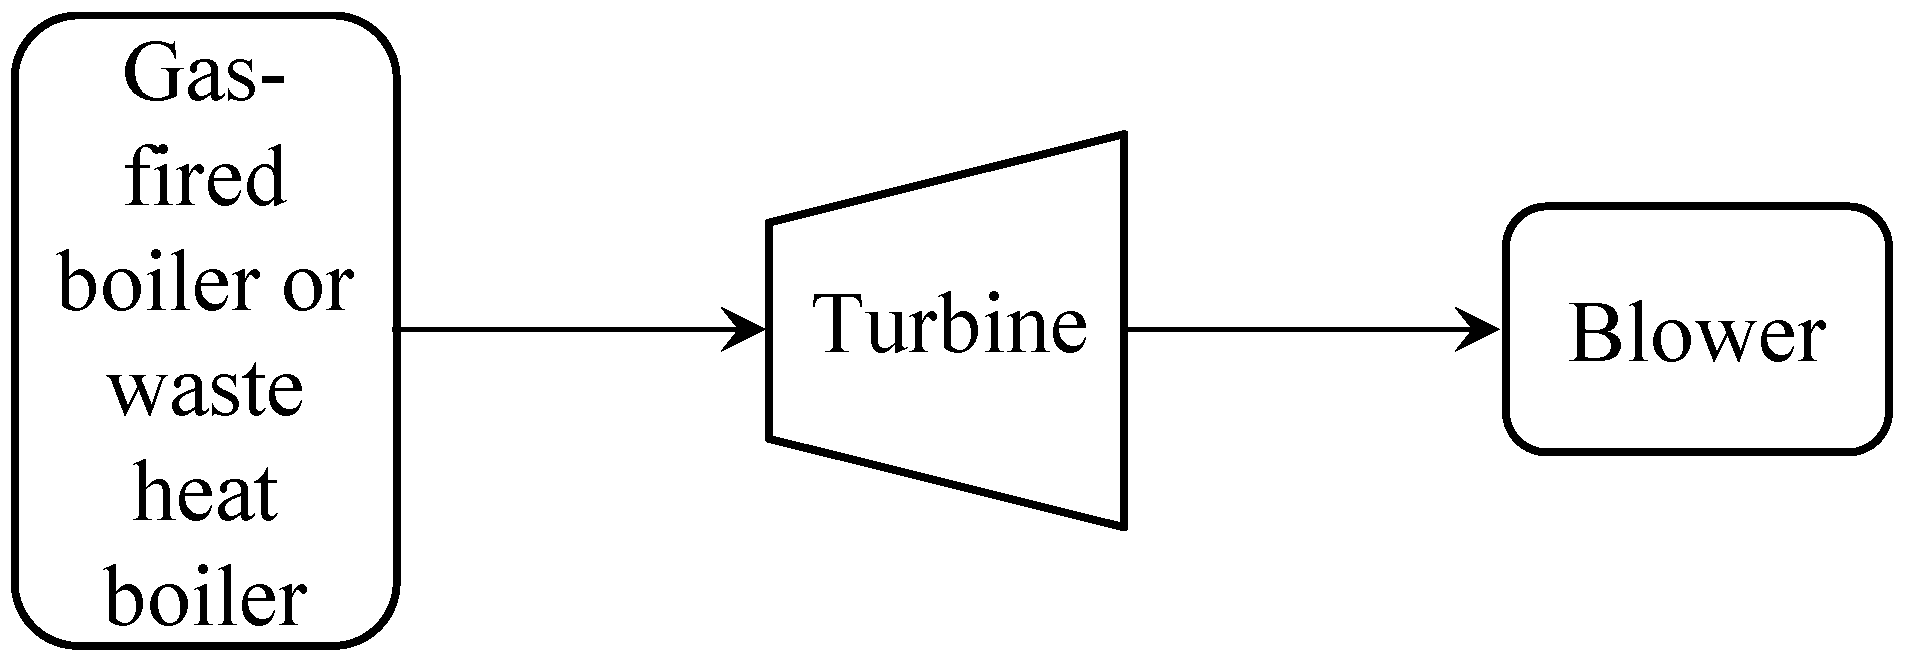
2.1. Description of Electro- and Turbo-Driven Blast Process

The blower is the “heart” of the blast furnace (BF). It not only supplies air to the BF to guarantee the oxygen needed for coke combustion and PCI (pulverized coal injection), but also provides enough air pressure to overcome the resistant loss of the air supply process and the stock column, and maintains a certain top pressure in the BF. Thus, the stable operation of the blower guarantees the long-term smooth and efficient operation of the BF [20].
According to the power source, the BF blast processes can be classified into two types: one in which the turbo-generated electricity is used as a power source to drive the blower (i.e., electro-driven blast mode), and one in which steam directly drives the blower (i.e., turbo-driven blast mode). Figure 1 shows the flow diagram of the electro-driven blast process. The boilers generate steam that drives the turbine to generate mechanical energy; then, the mechanical energy powers the generator to produce electricity; the generated electric energy flows to the motor through the grid and finally, after the buck-boost converter, the motor drives the BF blower.
Figure 2 shows the turbo-driven blast process flow. The steam generated by the boilers is adopted as the motive power to drive the turbine for mechanical energy generation, and the generated mechanical energy is directly used to drive the BF blower for working purposes.

2.2. Turbo-Driven Blast Processes Survey

To compare and evaluate the two driving modes, the authors investigated and surveyed in 2014 four steel companies located in China: SISCO, XBISCO, Xuanhua Steel, and Ansteel.
  • SISCO: The company used both of the two driving modes; the turbo-driven mode was used for the blasting of large BFs with the volume of 2700 m3 and 3200 m3, and the electro-driven mode was used for the blasting of small BFs with the volume of 420 m3, 450 m3, and 750 m3. When designing large BFs, considering the insufficient electricity supplied by SISCO itself and the stability of the steam pipe network, SISCO originally adopted the turbo-driven mode. After years of operating practice, the company observed that the turbo-driven blast process has many auxiliary processes and a high failure rate, which are reflected in high energy consumption and high costs of turbo-driven blast. Therefore, in addition to improving the stability of the power grid, the company plans to convert the turbo-driven blast process of its BFs into the electro-driven one.
  • XBISCO: The turbo-driven blast process was mainly used for BF blowers, air compressors in the oxygen-making plant and sintering drawing fans, while the electro-driven blast process is employed in all other cases. Among them, the steam generated by four 180 t/h boilers constituted the power source of four 40 MW BF blowers and two 10 MW sintering drawing fans; the steam generated by two 130 t/h boilers and one 220 t/h supplied two 20 MW air compressors in the oxygen plant. XBISCO believes that the turbo-driven blast process has low direct investment costs. For the entire company, if CCPP projects are not considered, the boilers will be indispensable, and adopting the turbo-driven blast process can save the cost of one generator set. In fact, the adoption of an electro-driven blast process to increase the plant capacity would require an additional substation, leading to an extremely high fixed cost. Moreover, it is worth noting that a turbo-driven blast process is very reliable if properly maintained. XBISCO plans to continue the adoption of the turbo-driven mode for its newly built Corex utility energy area, in which two 240 t/h boilers drive two 20 MW air compressors in the oxygen plant.
  • Xuanhua Steel: The company adopted the turbo-driven blast process on its four BFs in service (two 2500 m3 BFs, one 2000 m3 and one 1800 m3). Xuanhua Steel has two thermal workshops; the first workshop has two 160 t/h and a 180 t/h boilers that supply two 2500 m3 BF blowers; the second workshop has three 75 t/h, two 130 t/h and one 180 t/h boilers that supply a 2000 m3 BF and an 1800 m3 BF blower. Moreover, Xuanhua Steel also applied the turbo-driven blast technology to drive pumps and fans.
  • Ansteel: The company has currently eight BFs and ten blowers. Among them, there are three electro-driven blowers for three 3200 m3 BFs, and five 2580 m3 BFs for seven turbo-driven blowers (plus two as backup). At present, three turbo-driven blowers are too old and need to be revamped and converted. According to conducted technical and economic analysis, Ansteel considered the electro-driven blast technology the most cost-effective solution, and converted the old three turbo-driven blowers into two new 6500 m3/min electro-driven blowers.
The survey highlighted that there are different points of view with respect to the energy efficiency and energy cost of the two driving modes, and further analysis is required in order to identify the most cost-effective solution.

3. Analysis of Energy Efficiency of Blast Process

This study analyzes the energy efficiency and energy cost of electro-driven and turbo-driven BF blast processes; the influence of each driving mode was studied under the conditions of the same steam temperature, pressure and quantity.

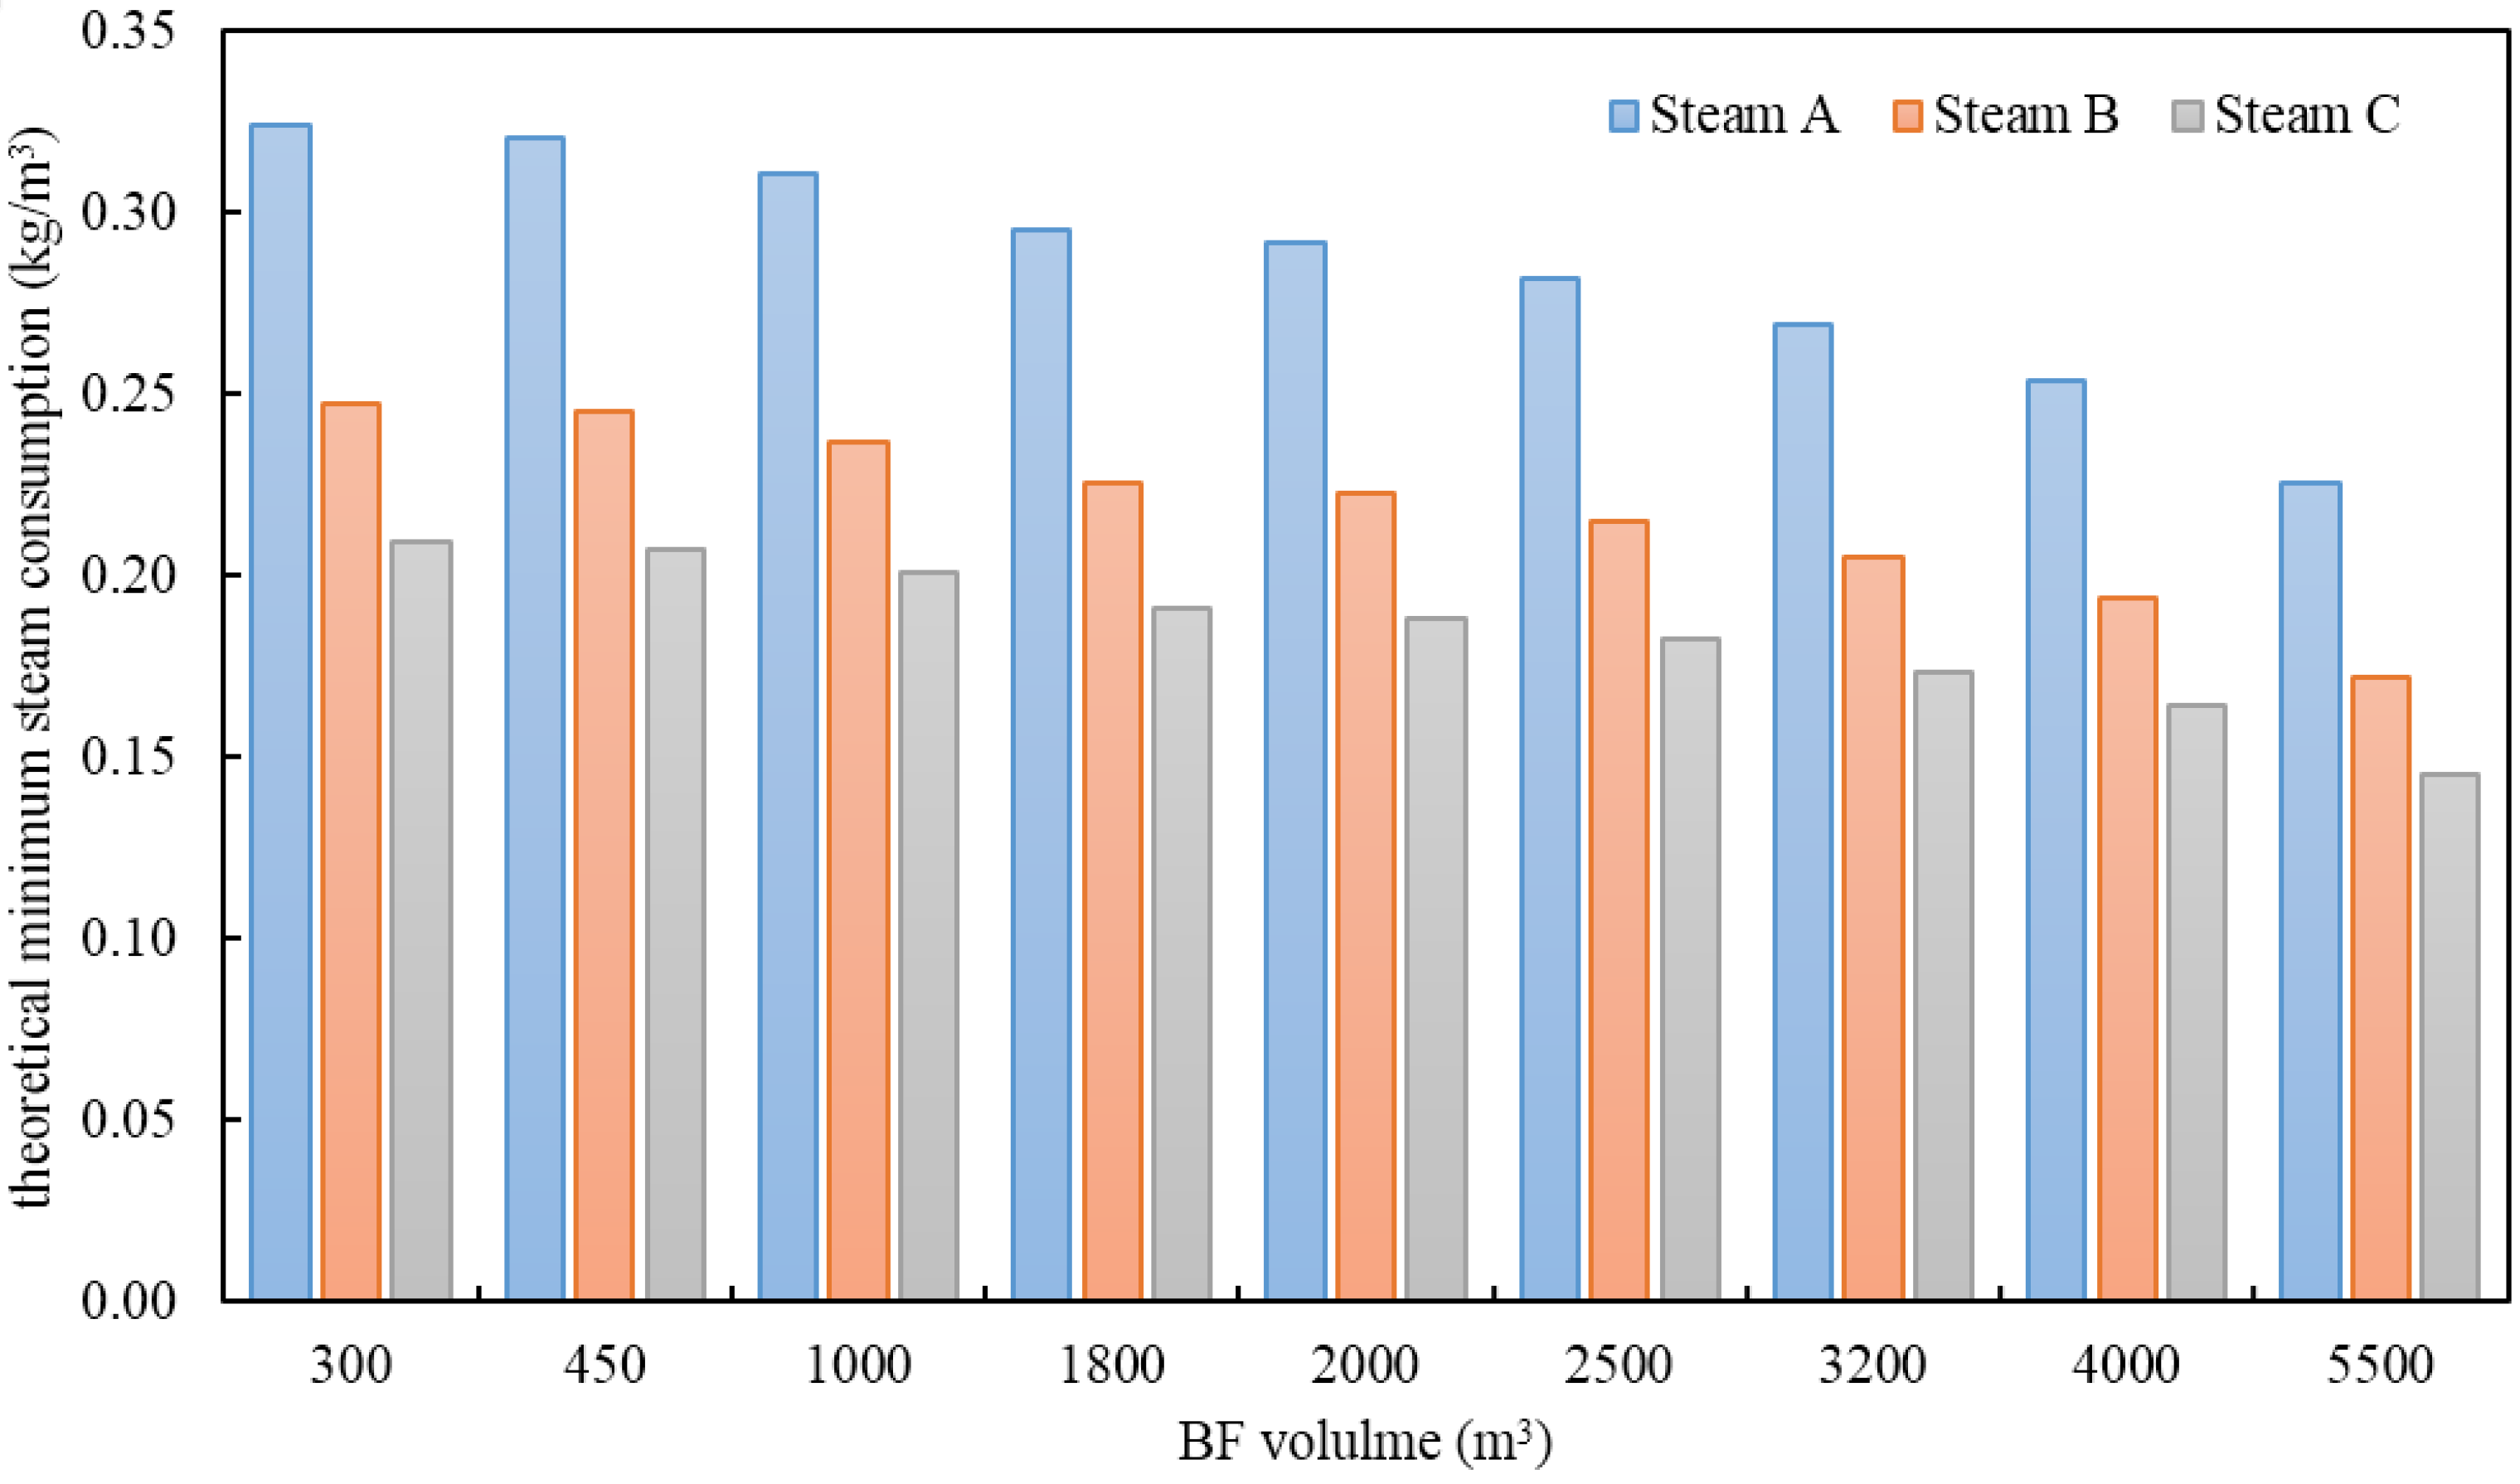
3.1. Theoretical Minimum Specific Steam Consumption of Blast Process

The specific energy consumption theory calculates the specific energy consumption of the products. The specific energy consumption of a blast process consists of two parts, i.e., the theoretical minimum steam consumption and the additional consumption incurred by the irreversibility of the process. According to the second law of thermodynamics, the theoretical minimum specific steam consumption needed by the blast process, or the specific steam consumption obtained where there is no exergy loss, can be calculated by
b min = e p / e s ,
where bmin is the theoretical minimum steam consumption of the BF blast process; es and ep are the specific exergies of steam and blast respectively.
Apparently, bmin only depends on the thermodynamic quality of air and steam. When the blower to be driven is given, bmin is the intrinsic property of the parameter-specific steam, which depends on the drive mode and the drive process. The specific exergy of the steam can be defined as the theoretical quantity of work into which 1 kg steam can be transformed at a certain pressure and temperature. To study the effect of steam parameters on steam consumption, three steam parameter states were selected as Table 1 shows. The specific exergy of the blast is related to BF volume. Figure 3 shows the theoretical minimum steam consumption under the parameter-specific steam corresponding to different BF volumes. Figure 3 highlights that, at fixed steam parameters, the higher the BF volume, the lower the theoretical minimum steam consumption of the blast process. This behavior is induced by different blast momentum demands of BFs with different volumes. For the BF with fixed volume, the higher the temperature and pressure of the steam, the lower the theoretical minimum steam consumption of the blast process because the steam with a higher quality has a higher working capacity. For a given BF, the theoretical minimum steam consumption of the blast process is only related to the quality of the steam, and does not concern the blower-driving mode.

3.2. Energy Efficiency of Blast System

According to Section 3.1, the electro-driven and turbo-driven blast processes theoretically consume the same steam quantity. However, due to additional consumption, their actual steam consumptions significantly differ. In an electro-driven blast process where the motor drives the blower, the buck-boost of the power distribution system and the motor are sources of energy loss that reduce the utilization rate of the thermal energy. However, given that the internal efficiency of a power plant turbine is higher than that of a blast turbine [21], the utilization rate can be improved.
In a turbo-driven blast process, the turbine directly drives the blower, avoiding energy losses caused by the buck-boost of the power distribution system and the motor. Therefore, the utilization rate of thermal energy improves; however, the internal efficiency of the blast turbine is lower than that of the power plant turbine [21], and the utilization rate is reduced. Thus, when calculating the energy efficiency of a BF blast process, the pipeline heat loss, buck-boost loss, and internal efficiency differences between varying types of turbines should also be considered.
According to Figure 1, the efficiency of the electro-driven blast process is
η = η l η q η f η z η u η w η d η p η e ,
where η l is the pipeline efficiency, η q is the turbine efficiency, η f is the generator efficiency, η z is the unit service power efficiency, η u is the efficiency of the boosting transformer of the power plant; η w is the grid efficiency; η d is the buck efficiency of the chief transformer of the user; η p is the power distribution efficiency, and η e is the motor drive efficiency.
According to Figure 2, the efficiency of the turbo-driven blast process can be expressed as
η = η l η q η e ,
where η l is the pipeline efficiency; η q is the turbine efficiency; η e is the turbine-drive efficiency.
The values of the physical variables in Equations (2) and (3) come from the statistical data of the surveyed companies; Table 2 lists the efficiency values.
Through substituting the efficiency values of Table 2 into Equations (2) and (3), the calculated upper-limit efficiency and lower-limit efficiency of the electro-driven blast process were 30.90% and 24.11%, respectively; the upper-limit efficiency and lower-limit efficiency of the turbo-driven blast process were 36.66% and 29.78%, respectively. It is thus clear that there is a certain overlapped interval between electro-driven and turbo-driven blast processes in terms of energy efficiency; moreover, the turbo-driven blast process has higher energy efficiency. In general, the upper-limit efficiency of the electro-driven blast process approximately equals the lower-limit efficiency of the turbo-driven blast process.
According to Figure 1, to convert electricity into a power source, the energy conversion from electricity generation to blower driving involves several sub-processes. They are conversion of thermal energy into mechanical energy, conversion of mechanical energy into electric energy, conversion of electric energy into mechanical energy again after transmission and distribution, and the use of mechanical energy as the power source to drive the blower. Thus, the electricity generation using steam depends on multiple energy conversions and requires many production installations and equipment that inevitably results in energy loss. The turbo-driven blast process shown in Figure 2 adopts the turbo-driven mode and can thus significantly simplify the energy conversion process, as it only converts thermal energy into mechanical energy and does not need the secondary electric energy conversion.
To highlight the differences between the two driving processes, the steam demands under the same blast volume were compared in Figure 4. Figure 4 shows the trends of the steam consumption by the two driving processes with the blast volume. When the blast volumes are the same, there is an overlapped interval between the two driving processes in terms of the range of consumed steam. However, in general, the amount of steam consumed by the turbo-driven blast process is lower than that consumed by the electro-driven process. When the steam parameters are equal, the higher the blast volume, the larger the steam quantity saved by the turbo-driven blast process relative to the electro-driven blast process. Note that there is a non-linear relationship between the quantity of steam consumption and the blast volume in Figure 4 because the blast volume per unit capacity of the BF is not a constant value but presents a progressive reduction pattern with the increase of its capacity.
The efficiency of various links of each driving process was valued as the mean value of the upper-limit efficiency and the lower-limit efficiency, i.e., the mean efficiency. Figure 5 illustrates the consumed steam by a 3200 m3 BF (blast volume 6000 m3/min) when blasting, in the two driving modes and under the three parameter-specific steam conditions. Irrespective of whether it is the electro-driven or turbo-driven blast process, with the increase of the temperature and pressure parameters of the steam, the consumed steam tends to reduce. By comparing the cases in which high-quality steam is used for electro-driven blast with the case in which low-quality steam directly drives the blast process, the consumed steam seems to be approximately equal.

4. Analysis of Energy Consumption per Ton of Steel

4.1. Calculation Method of Energy Consumption

For the energy consumption of steel companies, the energy consumed and energy-consumed media are generally classified into two types, i.e., fuel (like coal, oil, coal gas, metallurgical coke, etc.) and power (electricity, steam, compressed air, etc.). The supply of secondary energies or energy-consumed media depends on the consumption of relevant primary or secondary energies. Blast, steam, electricity and other energy media involved in the present paper all fall within the scope of power.
The analysis on energy consumption of steel companies inevitably requires the conversion and addition of various consumed energies [22], which thus involves two key factors influencing the energy consumption per ton of steel, i.e., the physical consumption and the standard coal coefficients [23] of various energies and energy-consumed media. Given that the physical quantities of energy consumed by blast processes have been discussed in Section 3, this section will mainly focus on the standard coal coefficients and their influence on the energy consumption per ton of steel.
To evaluate the overall energy consumption of an company, the quantities of various energies consumed must be converted into a uniform unit for consolidated calculation. Usually the fuel with lower heating value (LHV) of 29.3 MJ is referred to as 1 kg standard coal (1 kilogram coal equivalent, kgCE) [24,25]. According to different properties of the energies, the caloric values of energies can be classified into equivalent caloric value and equal caloric value. The equivalent caloric value refers to the total energy released when the energy changes into the environmental state, that is, the heat contained by the energy itself.
The equal caloric value refers to the quantity of primary energy consumed to obtain a measuring unit of a secondary energy and expressed in the form of caloric value, which is referred to as the equal caloric value of the secondary energy. In essence, the equal caloric value is a value which takes the energy conversion loss in the process of obtaining the secondary energy into account, in addition to the equivalent caloric value. When converting electricity into standard coal, the calculated results by equal caloric value and equivalent caloric value methods differ by three times. In fact, as a secondary energy, the electric energy consumed by end users (like a BF blast process) is electric energy itself, that is, the working capacity of electricity. Thus, when calculating energy consumption, the standard coal of electricity should be converted according to the equivalent caloric value method, that is, the standard coal coefficient of electricity is 0.1229 kgCE/kWh. In this way, the difference resulted from the level of electricity-generating coal consumption on the level of energy consumption by the blast process and other end users can be prevented and repeated, or missed energy consumption statistics can be also avoided.
Similarly, the standard coal coefficient of steam, as an important secondary energy, can also be calculated according to its working capacity under different temperatures and pressures (that is, the specific exergy of steam). This paper proposes the following formula for calculating the standard coal coefficient of steam under different temperatures and pressures:
x = 0.34 × 10 4 [ h h 0 T 0 ( s s 0 ) + R T 0 ln p p 0 ] ,
where
  • x—Standard coal coefficient of steam, kgCE/kg;
  • 0.34 × 10⁻⁴—Unit conversion coefficient of kJ and kgCE;
  • R—Gas constant;
  • H—Specific enthalpy of steam at temperature T and pressure p;
  • s—Specific entropy of steam at temperature T and pressure p;
  • h0—Specific enthalpy of steam at environmental temperature T0 and environmental pressure p0;
  • s0—Specific entropy of steam at environmental temperature T0 and environmental pressure p0.

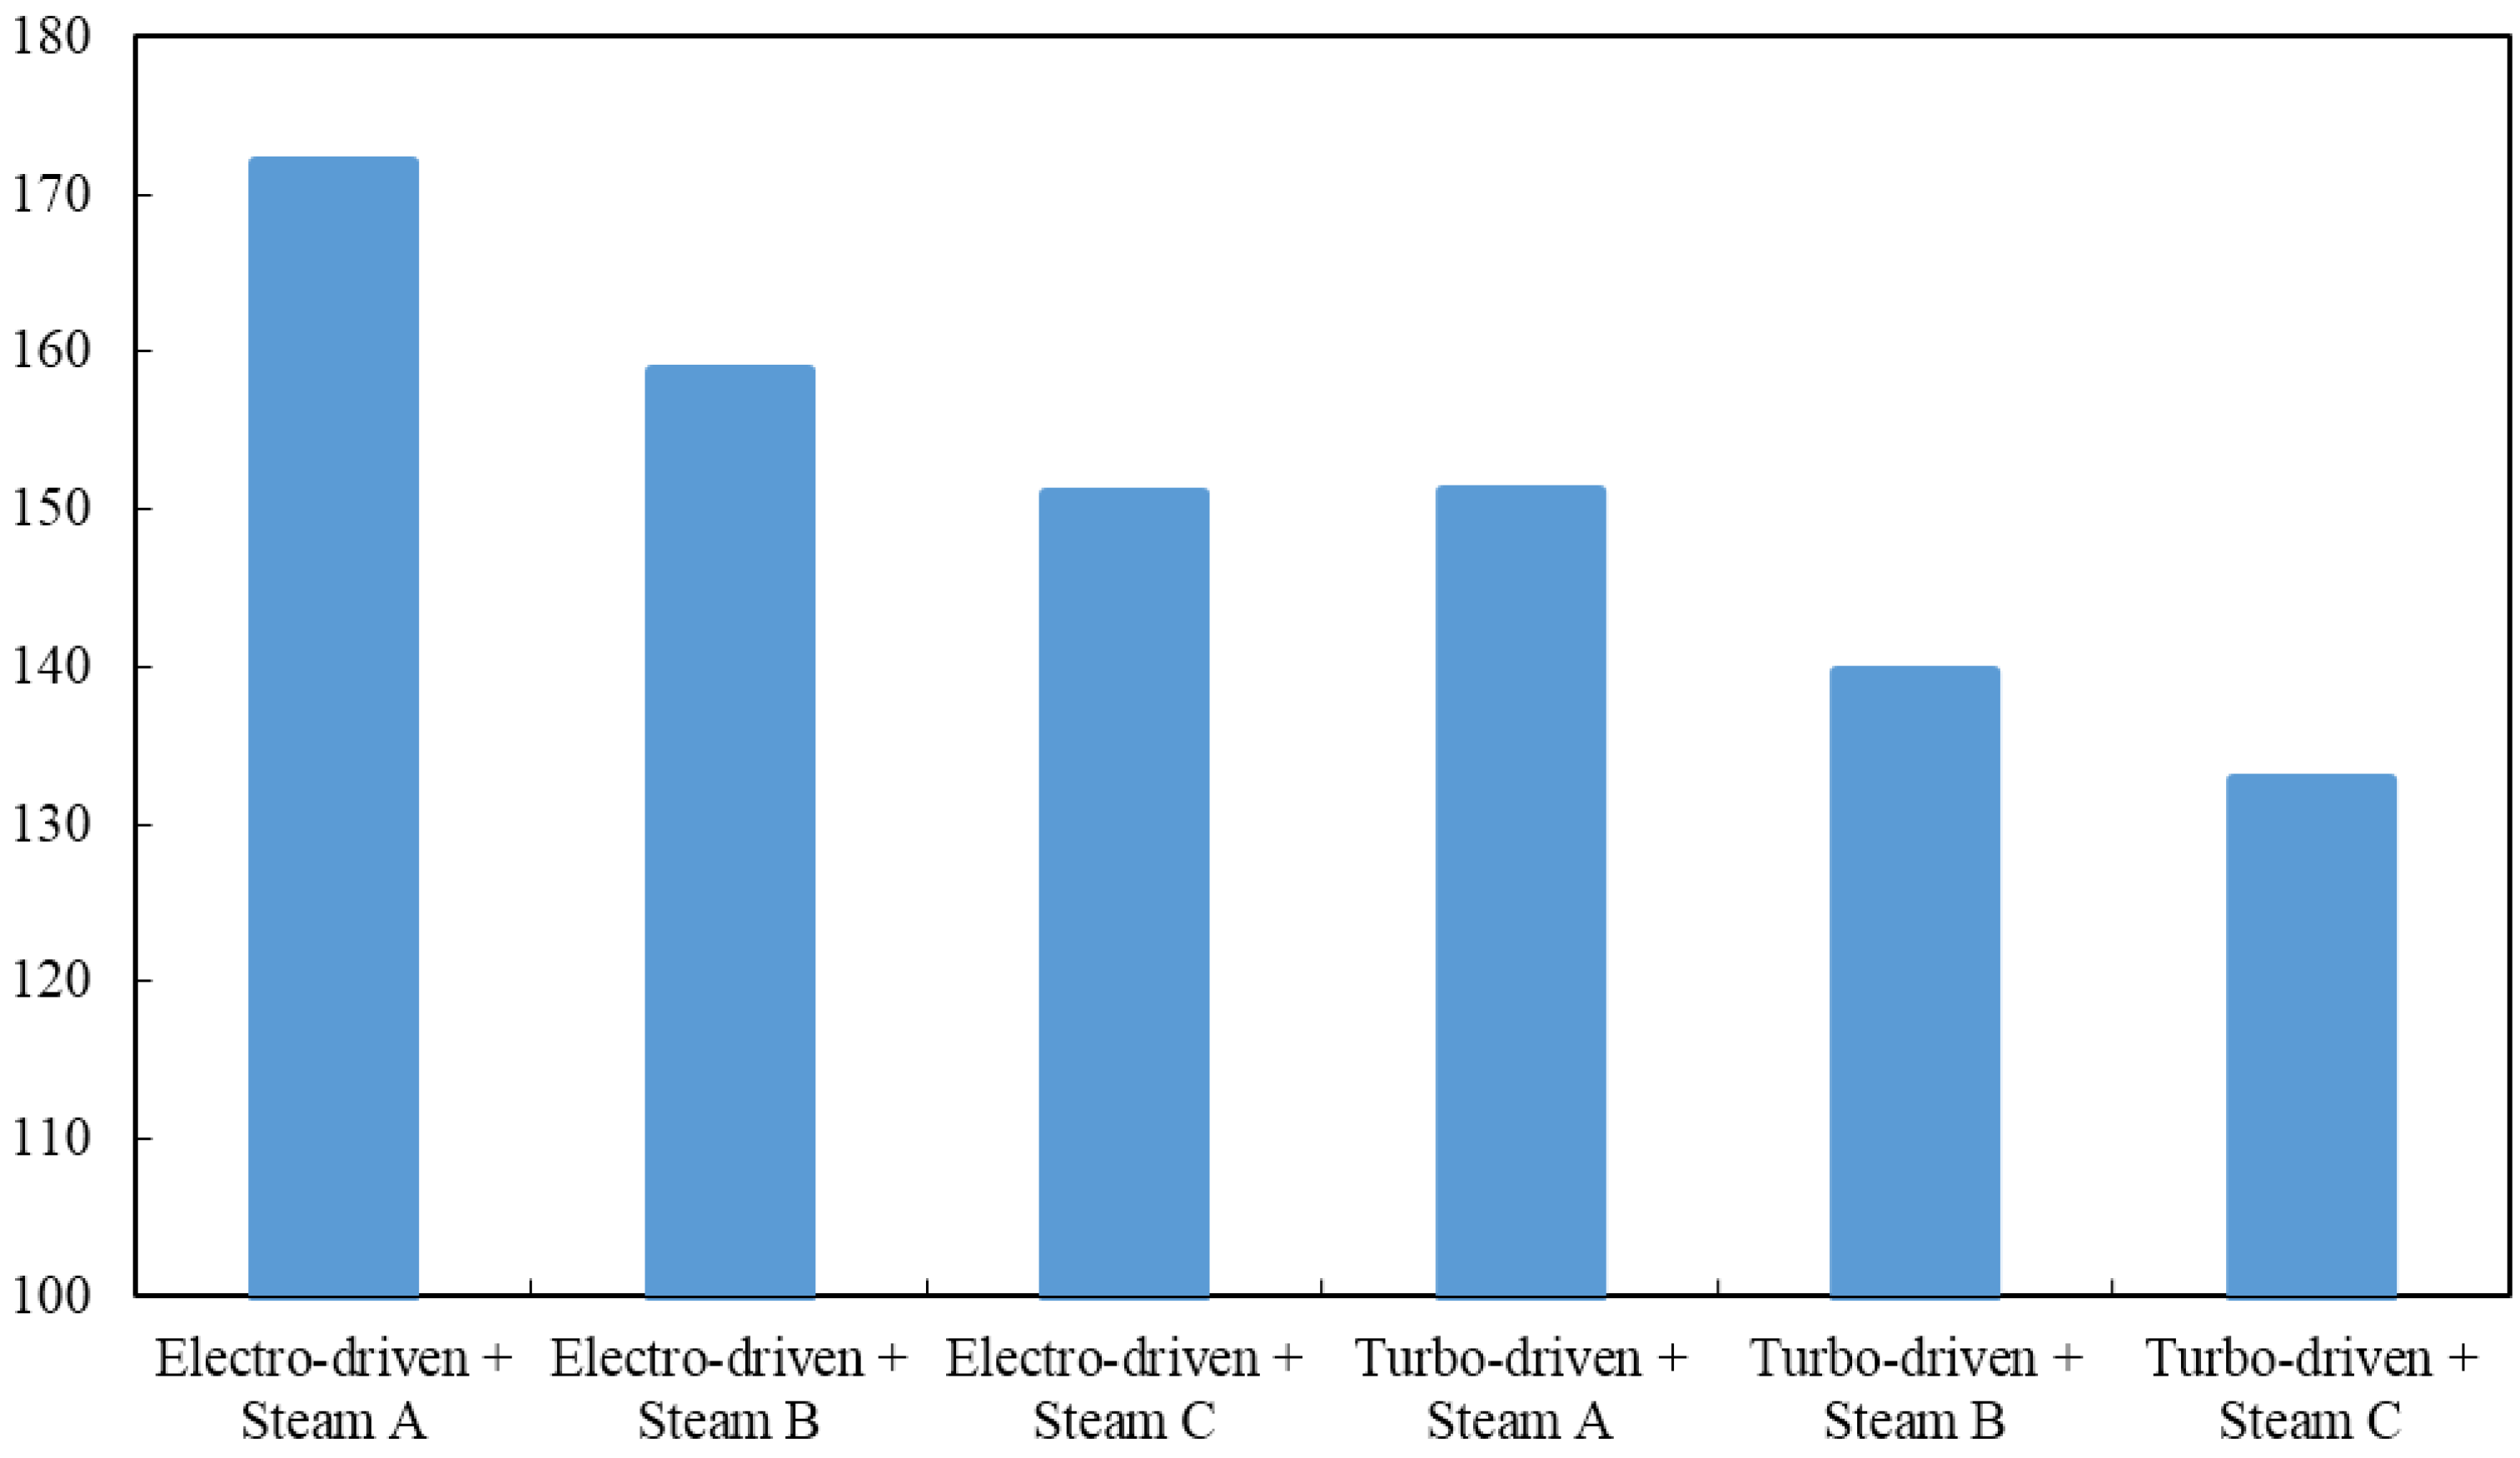
4.2. Influence of Driving Mode on Energy Consumption per Ton of Steel

The effect of blast processes on energy consumption per ton of steel of a company mainly shows three aspects: the change of energy consumption per ton of steel induced by the change of the physical consumption of steam or electricity; the change of energy consumption per ton of steel induced by the change of the standard coal coefficient value of steam or electricity; and the change of energy consumption per ton of steel induced by another energy medium saved (or unused) by the adopted driving mode. Thus, the energy consumption per ton of steel can be expressed by
E = E 0 + Δ E ,
where E represents the energy consumption per ton of steel, E0 represents the energy consumption per ton of steel after deducting the energy consumed by the blast process, and Δ E represents the energy consumption change per ton of steel induced by the introduced blast process. The variation Δ E can be calculated by
Δ E = E E ,
where E represents the energy consumption increment induced by the energy used to drive the blast process, and E represents the consumption decrement of another energy medium (electricity or steam) induced by its use (steam or electricity, respectively).
The energy consumption change per ton of steel induced by turbo-driven blast is
Δ E s = ( m x s n x e ) p HM ,
The energy consumption change per ton of steel induced f by electro-driven blast is
Δ E e = ( n x e m x s η e ) p HM ,
where
  • m—consumed steam by turbo-driven blast;
  • n—consumed steam by electro-driven blast;
  • xsstandard coal coefficient of steam;
  • xestandard coal coefficient of electricity;
  • pHMiron-to-steel ratio;
  • ηegenerating efficiency of steam.
Equations (7) and (8) give
Δ E s Δ E e = p HM [ m x s ( 1 + η e ) 2 n x e ] .

5. Analysis of Energy Cost

5.1. Energy Cost of Blast Process

The electricity powering the electro-driven blast main comes from self-generated or purchased electricity, and the corresponding energy costs are the cost of the steam and the purchasing price, respectively. The theoretical minimum energy cost of a blast process depends on the unit price of the supplying energy and on the theoretical minimum steam consumption of the driving process. The theoretical minimum steam consumption is only related to the thermodynamic quality of energy products and steam. Thus, the theoretical minimum energy cost of a blast process is a function of the thermophysical parameters of the energy used and its unit price, which is irrelevant to the driving mode and process.
The comparison of the actual energy costs of the two driving processes is given by
Δ c = m c s n c e ,
where cs and ce represent the unit prices of steam and electricity, respectively.
As from Equation (10), at a certain quantity of energy-medium consumption by each driving process, the energy cost is only related to the unit price of the energy type. Figure 6 compares the costs of the two driving processes at m = 0.2343 kg/m3 and n = 0.1008 kWh/m3. When the price lies on the straight line, the energy cost is the same; above the line, the energy cost of the turbo-driven blast process is low, while below the straight line is vice versa.

5.2. Influence of Driving Mode on Total Energy Cost per Ton of Steel

Similarly to energy consumption per ton of steel analyzed in Section 4.2, the energy cost change of a company induced by turbo-driven blast is
Δ C s = ( m c s n c e ) p HM .
The company’s energy cost variation induced by electro-driven blast is
Δ C e = ( n c e m c s η e ) p HM .
From Equations (11) and (12),
Δ C s Δ C e = p HM [ m c s ( 1 + η e ) 2 n c e ] .

6. Case Study

The actual data of Companies A and B were adopted for case studies.

6.1. Case 1: Company A

The BF #1 (2700 m3) and BF #2 (3200 m3) of Company A adopt the turbo-driven blast mode. Table 3 lists their blast steam consumptions.
The pressure and temperature of adopted steam were (8.83 ± 0.49) MPa and ( 535 ± 10 5 ) °C, respectively. The calculated specific enthalpy and specific entropy of BF blast steam at 8.83 MPa and 535 °C were 3475 kJ/kg and 6.78 kJ/kg, respectively. The price of the steam at this quality level was 0.20 Yuan/kg, and the purchase price of the electricity was 0.445 Yuan/kWh.
The standard coal coefficient of steam, xs, calculated according to Equation (4) was 0.0552 kgCE/kg. According to Table 3, the steam consumption by BF #1´s blast process was m = 473 kg/t. When adopting the electro-driven blast mode, the electricity consumption was n = 120 kWh/t. The self-generating efficiency was set as 24%; the standard coal coefficient of electricity, xe, was 0.1229 kgCE/kWh. The iron-to-steel ratio of BF #1 was 0.30; then, by substituting,
m n = 473 120 = 3.94 > 2 x e x s ( 1 + η e ) = 2 × 0.1229 0.0552 × ( 1 + 0.24 ) = 3.59 ,
c s c e = 0.200 0.445 = 0.45 > 2 n m ( 1 + η e ) = 2 × 120 473 ( 1 + 0.24 ) = 0.41 .
BF #1 showed low energy consumption per ton of steel and low energy cost for electro-driven blast. According to Equation (9), electro-driven blast could save 0.65 kgCE/t steel compared with turbo-driven blast; according to Equation (13), the saved energy cost was 3.15 Yuan/t steel.
Moreover, if the turbo-driven mode is continually adopted, the operation and maintenance management of the turbo-driven blast process must be strengthened to reduce steam losses and process failure rate. Only when blast steam consumption reduces below
m 2 n x e x s ( 1 + η e ) = 2 × 120 × 0.1229 0.0552 × ( 1 + 0.24 ) = 431   kg / t
will it be rational in terms of energy efficiency for BF #1 to adopt turbo-driven blast.
In these conditions as BF #1 continues to use the turbo-driven mode, economically, it will be necessary to reduce blast steam consumption or steam cost. Only when blast steam consumption reduces below
m 2 n c e c s ( 1 + η e ) = 2 × 120 × 0.445 0.200 × ( 1 + 0.24 ) = 431   kg / t
or when steam cost reduces below
c s 2 n c e m ( 1 + η e ) = 2 × 120 × 0.445 473 × ( 1 + 0.24 ) = 0.182   Yuan / kg
will it be convenient for BF #1 to adopt turbo-driven blast.
As for the BF #2 blast process, the consumed steam was m = 413 kg/t, and the iron-to-steel ratio was 0.46. Then
m n = 413 120 = 3.44 < 2 x e x s ( 1 + η e ) = 2 × 0.1229 0.0552 × ( 1 + 0.24 ) = 3.59 ,
c s c e = 0.200 0.445 = 0.45 < 2 n m ( 1 + η e ) = 2 × 120 413 ( 1 + 0.24 ) = 0.47 .
BF #2 showed both low energy consumption per ton of steel, and low energy cost for turbo-driven blast. According to Equation (9), the turbo-driven blast saved 0.65 kgCE/t steel compared with the electro-driven blast; according to Equation (13), ultimately saving 2.01 Yuan/t steel.

6.2. Case 2: Company B

Company B adopted the turbo-driven blast mode on three 2500 m3 BFs; Table 4 lists the blast steam consumption for each BF.
The pressure and temperature of adopted steam were 3.43 MPa and 435 °C, respectively, and the specific enthalpy and specific entropy of the steam were 3305 kJ/kg and 6.97 kJ/kg, respectively. The price of the steam was 0.13 Yuan/kg, and the purchase price of the electricity was 0.47 Yuan/kWh. The standard coal coefficient of steam, xs, calculated according to Equation (4), was 0.0477 kgCE/kg. According to Table 4, the steam consumption by BF blast process was m = 436 kg/t. Adopting the electro-driven blast mode, the consumed electricity was n = 120 kWh/t. The calculated self-generation efficiency was 24%. The standard coal coefficient of electricity, xe, was 0.1229 kgce/kWh; the iron-to-steel ratio of the three 2500 m3 BFs was 0.77. Then
m n = 436 120 = 3.63 < 2 x e x s ( 1 + η e ) = 2 × 0.1229 0.0477 × ( 1 + 0.24 ) = 4.15 ,
c s c e = 0.13 0.47 = 0.28 < 2 n m ( 1 + η e ) = 2 × 120 436 ( 1 + 0.24 ) = 0.44 .
The energy consumption per ton of steel and the energy cost of turbo-driven blast were both low. According to Equation (9), the energy saving of the turbo-driven blast compared with electro-driven blast was 2.85 kgce/t steel; according to Equation (13), the energy cost saving was 32.74 Yuan/t steel.

7. Conclusions and Recommendations

In this work, the energy efficiency and energy cost of electro-driven and turbo-driven BF blast processes were studied through survey research, theoretical analysis and case calculations, and the following conclusions can be drawn.
Four steel companies disagreed about the energy efficiency and energy cost of the two driving modes. Due to the differences among companies in terms of operational efficiency of equipment, standard coal coefficients, and unit prices of energy sources, different conclusions may be drawn.
The specific energy consumption of a blast process includes two parts: theoretical minimum steam consumption and additional steam consumption. The theoretical minimum steam consumption of a blast process is an intrinsic property of the parameter-specific steam that does not refer to the driving mode or driving process. For the fixed steam parameters, the higher the BF volume, the lower the theoretical minimum steam consumption of the blast process. For a fixed-volume BF, the higher the temperature and pressure parameters of the steam, the lower the theoretical minimum steam consumption of the blast process.
There is an overlap between electro-driven and turbo-driven processes in terms of energy efficiency, but the upper-limit efficiency of the electro-driven blast process is approximately equal to the lower-limit efficiency of the turbo-driven blast process. From the viewpoint of the energy utilization rate, the turbo-driven process is better than the electro-driven process. Regardless if it is the electro-driven or turbo-driven blast process, the steam consumption tends to decline with the increase of steam parameters (temperature and pressure).
Since current companies widely adopt electricity equivalent value to calculate energy consumption, the energy consumption of turbo-driven blast processes is higher than that of electro-driven blast processes. This is in contradiction with the conclusion regarding energy efficiency, and also contradicts the objective facts. This is due to the fact that equivalent caloric value is adopted for converting electricity into standard coal, but equal caloric value is adopted in the case of steam. Therefore, the present work suggests that when calculating the energy consumptions per ton of steel for the two driving modes, the standard coal coefficient of steam might be calculated according to its working capacity at different temperatures and pressures. The equation for calculating the standard coal coefficient of steam was proposed. Moreover, the equation for judging strengths and weaknesses of the two driving modes was also established in terms of energy efficiency from the perspective of energy consumption per ton of steel.
The theoretical minimum energy cost of a blast process depends on the unit price of purchased energy and the theoretical minimum steam consumption of the blast process. The energy costs of the two processes are related to the physical consumption of forms of energy and the unit prices of energies. At a given energy consumption of the two driving modes, the energy cost is related to the unit prices of energy media.
Finally, two case studies were compared. The results indicated that, for the BF #1 of Company A, the energy consumption per ton of steel and energy cost of electro-driven blast were low, while for the BF #2 of the same company and for the furnaces of Company B, the energy consumption and energy cost of turbo-driven blast were low. Therefore, to select the most performant driving mode, the working conditions of production, energy prices of the region where companies operate, and the economic requirements of the users should all be taken into account.

Acknowledgments

This work was supported by the Fundamental Research Funds for the Central Universities, China (N140203002), and the US-China (NSF-NSFC) Collaborative Project (21561122001).

Author Contributions

Wenqiang Sun designed the overall research; Yueqiang Zhao and Yunchun Wang implemented the steel company survey; Wenqiang Sun and Yueqiang Zhao analyzed the data; Wenqiang Sun wrote the paper.

Conflicts of Interest

The authors declare no conflict of interest.

Abbreviations

The following abbreviations are used in this manuscript:
BFblast furnace
CCPPcombined cycle of power plant
CEcoal equivalent

References

  1. Aghaali, H.; Ångström, H.E. A review of turbocompounding as a waste heat recovery system for internal combustion engines. Renew. Sustain. Energy Rev. 2015, 49, 813–824. [Google Scholar] [CrossRef]
  2. Li, W.; Zhao, J.; Fu, L.; Yuan, W.; Zheng, Z.; Li, Y. Energy efficiency analysis of condensed waste heat recovery ways in cogeneration plant. Energy Convers. Manag. 2015, 101, 616–625. [Google Scholar] [CrossRef]
  3. Van de Bor, D.M.; Ferreira, C.A.I.; Kiss, A.A. Low grade waste heat recovery using heat pumps and power cycles. Energy 2015, 89, 864–873. [Google Scholar] [CrossRef]
  4. Brücknera, S.; Liu, S.; Miró, L.; Radspieler, M.; Cabeza, L.F.; Lävemann, E. Industrial waste heat recovery technologies: An economic analysis of heat transformation technologies. Appl. Energy 2015, 151, 157–167. [Google Scholar] [CrossRef]
  5. Ajimotokan, H.A.; Sher, I. Thermodynamic performance simulation and design optimisation of trilateral-cycle engines for waste heat recovery-to-power generation. Appl. Energy 2015, 154, 26–34. [Google Scholar] [CrossRef]
  6. Remeli, M.F.; Kiatbodin, L.; Singh, B.; Verojporn, K.; Date, A.; Akbarzadeh, A. Power generation from waste heat using heat pipe and thermoelectric generator. Energy Procedia 2015, 75, 645–650. [Google Scholar] [CrossRef]
  7. Ma, G.; Cai, J.; Zhang, L.; Sun, W. Influence of steam recovery and consumption on energy consumption per ton of steel. Energy Procedia 2012, 14, 566–571. [Google Scholar] [CrossRef]
  8. Liu, Y.; Liu, Q.; Wang, W.; Zhao, J.; Leung, H. Data-driven based model for flow prediction of steam system in steel industry. Inf. Sci. 2012, 193, 104–114. [Google Scholar] [CrossRef]
  9. Niu, L.; Hou, Y.; Sun, W.; Chen, S. The measurement of thermodynamic performance in cryogenic two-phase turbo-expander. Cryogenics 2015, 70, 76–84. [Google Scholar] [CrossRef]
  10. Geng, P.; Yao, C.; Wang, Q.; Wei, L.; Liu, J.; Pan, W.; Han, G. Effect of DMDF on the PM emission from a turbo-charged diesel engine with DDOC and DPOC. Appl. Energy 2015, 148, 449–455. [Google Scholar] [CrossRef]
  11. Höfert, R. Variable speed turbo couplings used as pump drive in desalination plants. Desalination 1999, 125, 181–189. [Google Scholar] [CrossRef]
  12. Yan, J.; Shao, S.F.; Liu, J.P.; Zhang, Z. Experiment and analysis on performance of steam-driven jet injector for district-heating system. Appl. Therm. Eng. 2005, 25, 1153–1167. [Google Scholar] [CrossRef]
  13. Minav, T.A.; Laurila, L.I.E.; Pyrhönen, J.J. Analysis of electro-hydraulic lifting system’s energy efficiency with direct electric drive pump control. Autom. Constr. 2013, 30, 144–150. [Google Scholar] [CrossRef]
  14. Safaiy, M.R.; Maghmoumi, Y.; Karimipour, A. Economic Evaluation Utilization of Electro-Feed Water Pump and Turbo-Feed Water Pump and Compare Them in a 12.5-Megawatts Steam Unit Thermal Cycle and Provide the Optimum Solution. In Proceedings of the 4th International Meeting of Advances in Thermofluids, Melaka, Malaysia, 3–4 October 2011.
  15. Astvatsaturova, A.A.; Zorin, V.M.; Trukhnii, A.D. Assessment of steam work efficiency as applied to a turbine being designed. Therm. Eng. 2015, 1, 26–33. [Google Scholar] [CrossRef]
  16. Shi, Y.Z. Energy efficiency analyses of steam-driving and electricity-driving. Chem. Eng. Des. 1993, 3, 33–34. (In Chinese) [Google Scholar]
  17. Han, X.Y.; Ma, Q.T. Energy consumption and economic operation analysis of blast blowers under different driving modes. GM Metall. Mine Ind. 2014, 10, 72–75. (In Chinese) [Google Scholar]
  18. Ma, G.; Cai, J.; Xie, G. Performance analysis on different driving style of Ansteel blast furnace blower. Energy Metall. 2012, 3, 53–55. (In Chinese) [Google Scholar]
  19. Song, Z.P. Total energy system analysis of heating. Energy 2000, 25, 807–822. [Google Scholar] [CrossRef]
  20. How a Blast Furnace Works? Available online: https://www.steel.org/Making Steel/How Its Made/Processes/How a Blast Furnace Works.aspx (accessed on 1 April 2016).
  21. Liu, J.X. Energy saving analysis by comparing trubo-driven BF blast system with electro-driven one. Iron Steel Technol. 2008, 5, 53–54. (In Chinese) [Google Scholar]
  22. Sun, W.Q.; Cai, J.J.; Du, T.; Zhang, D.W. Specific energy consumption analysis model and its application in typical steel manufacturing process. J. Iron Steel Res. Int. 2010, 10, 33–37. [Google Scholar] [CrossRef]
  23. Zarnikau, J.; Guermouche, S.; Schmidt, P. Can different energy resources be added or compared? Energy 1996, 21, 483–491. [Google Scholar] [CrossRef]
  24. Zhang, G.G.; Sun, W.Q.; Cai, J.J. Research on Energy Consumption Index and Energy Conversion Coefficients for Iron and Steel Enterprise. In Proceedings of the Asia Steel Conference 2012, Beijing, China, 23–27 September 2012.
  25. General Principles for Calculation of the Comprehensive Energy Consumption. Available online: http://www.sac.gov.cn/SACSearch/search?channelid=97779&templet=gjcxjg_detail.jsp&searchword=STANDARD_CODE=%27GB/T%202589–2008%27&XZ=T (accessed on 1 April 2016).
Figure 1. Electro-driven blast process flow.
Processes 04 00028 g001
Figure 2. Turbo-driven blast process flow.
Processes 04 00028 g002
Figure 3. Theoretical minimum steam consumptions of BF blast processes.
Processes 04 00028 g003
Figure 4. Comparison of steam consumptions of electro- and turbo-driven BF blast processes.
Processes 04 00028 g004
Figure 5. Blast steam consumption (t/h) of a 3200 m3 BF under different steam parameters.
Processes 04 00028 g005
Figure 6. Comparison of energy costs of electro-driven and turbo-driven BF blast processes.
Processes 04 00028 g006
Table 1. Temperature and pressure of three types of steam.
SteamTemperature (°C)Pressure (MPa)
A3000.98
B4353.4
C5358.8
Table 2. Values ranges of each sub-process of BF blast processes.
Drive ModeVariables η l ( η l ) η q ( η q ) η f η z η u η w η d η p η e ( η e ) η ( η )
Electro-drivenUpper-limit efficiency (%)99.537.9098.594989997959930.90
Lower-limit efficiency (%)98.535.3498.092989897859724.11
Turbo-drivenUpper-limit efficiency (%)99.037.0310036.66
Lower-limit efficiency (%)97.030.7010029.78
Table 3. The actual steam consumption of BF blast process in Company A.
BFProductivityBlast Flow RateSteam Consumption
(t/d)(m3/min)(t/h)(kg/m3)(kg/t)
#1550056331140.3373473
#281008143139.40.2853413
Table 4. The actual steam consumption of each BF blast process in Company B.
ProductivityBlast Flow RateSteam Consumption
(t/d)(m3/min)(t/h)(kg/m3)(kg/t)
49504450900.3371436

