
Simultaneous Monitoring of the Effects of Multiple Ionic Strengths on Properties of Copolymeric Polyelectrolytes during Their Synthesis


1
Physics Dept., Tulane University, New Orleans, LA 70115, USA
2
Advanced Polymer Monitoring Technologies, Inc., 1078 S. Gayoso St., New Orleans, LA 70125, USA
*
Author to whom correspondence should be addressed.
Processes 2017, 5(2), 17; https://doi.org/10.3390/pr5020017
Submission received: 20 February 2017
/
Revised: 2 April 2017
/
Accepted: 7 April 2017
/
Published: 11 April 2017
(This article belongs to the Special Issue Water Soluble Polymers)
Abstract
:A new Automatic Continuous Online Monitoring of Polymerization reactions (ACOMP) system has been developed with multiple light scattering and viscosity detection stages in serial flow, where solution conditions are different at each stage. Solution conditions can include ionic strength (IS), pH, surfactants, concentration, and other factors. This allows behavior of a polymer under simultaneous, varying solution conditions to be monitored at each instant of its synthesis. The system can potentially be used for realtime formulation, where a solution formulation is built up additively in successive stages. It can also monitor the effect of solution conditions on stimuli responsive polymers, as their responsiveness changes during synthesis. In this first work, the new ACOMP system monitored light scattering and reduced viscosity properties of copolymeric polyelectrolytes under various IS during synthesis. Aqueous copolymerization of acrylamide (Am) and styrene sulfonate (SS) was used. Polyelectrolytes in solution expand as IS decreases, leading to increased intrinsic viscosity (η) and suppression of light scattering intensity due to electrostatically enhanced second and third virial coefficients, A2 and A3. At a fixed IS, the same effects occur if polyelectrolyte linear charge density (ξ) increases. This work presents polyelectrolyte response to a series of IS and changing ξ during chemical synthesis.
1. Background and Motivation
This work introduces a new version of the Automatic Continuous Online Monitoring of Polymerization reactions (ACOMP) system (“second generation ACOMP”) whose aim is to monitor the onset and evolution of stimuli responsive behavior, under multiple simultaneous solution conditions, during the synthesis of stimuli responsive polymers (SRP). SRP is a vast area of modern polymer science and engineering, aimed at producing polymers that can respond to such stimuli as temperature, radiation, and solution conditions such as pH, ionic strength, polymer concentration, presence of such agents as surfactants, nanoparticles, hydrophobic species, etc. The types of responses that can occur in response to these stimuli include coil/globule phase transitions, polymer coil expansion or shrinkage, micellization, aggregation, and other forms of spontaneous self-assembly.
These next-generation materials are expected to have applications in medicine, sensors, self-healing materials, and environmental remediation [1,2,3,4,5]. Hydrogels ofpoly(N-isopropylacrylamide), for example, have a lower critical solution temperature (LCST), near body temperature, which makes it a candidate for drug delivery applications in which the NIPAM-based polymer releases its medical payload when in contact with targeted tissues [6,7]. While SRP hold much promise, their synthesis is complex and must be tightly controlled. For example, self-assembly of SRP block copolymers into well-defined nanostructures occurs only over a narrow range of compositions, and this ability can be lost with errors in composition as low as two to five percent [8].
A major reason for the development of Second Generation ACOMP (SGA) is to not only monitor synthesis and the onset and evolution of stimuli responsiveness, but also to control the synthetic reactions. Much work in SRP research makes use of controlled radical and other living type reactions [9,10,11,12,13,14] nucleobase polymers [15,16], and information containing polymers [17,18].
1.1. Background on Solution Properties of Polyelectrolytes in Solution
In this first work with the new version of ACOMP a stimuli responsive copolymer produced by simple free radical copolymerization was chosen, rather than the more sophisticated living-type, “click”, postpolymer modifications and other routes under current research for producing stimuli responsive polymers.
While the physical properties of polyelectrolytes in solution still present some surprises and puzzles, certain general principles are well established, both experimentally and theoretically. For example, it is well known that the free energy of linear polyelectrolytes in solution is composed of an enthalpic term that expands the polymer coil due to mutual electrostatic repulsion among charge groups, and an entropic term that contracts the coil towards higher probability conformations. The net effect of the free energy balance is a polymer coil that is expanded with respect to a neutral polymer of otherwise identical properties. As the ionic strength of the supporting solution increases, the electrostatic repulsion among charges in the chain decreases and the coil shrinks, which can be measured in many ways, such as by a decrease in polymer reduced viscosity or by an increase in light scattering intensity due to decreased interchain repulsion and excluded volume, and correspondingly reduced second and third virial coefficients A2 and A3, respectively. Similarly, if the linear charge density (ξ) is increased at a fixed IS the coil will also expand. ξ can be changed by altering pH for a polybase or polyacid.
Persistence length is a central notion in the theory of polymer conformations and has been examined in detail [19]. The complex problem of excluded volume for polymers has likewise undergone extensive examination [20,21,22,23]. The details of the free energy and corresponding calculations of electrostatically enhanced excluded volume and persistence lengths have been treated theoretically and experimentally [24,25,26,27]. Similarly, the theory of counterion condensation has been developed and demonstrated experimentally [28,29,30,31]. In its simplest statement, counterion condensation predicts that when the repulsive electrostatic energy between charge groups on a polymer chain exceeds thermal energy kBT (where kB is Boltzmann’s constant), counterions will condense along the chain to lower linear charge density ξ until the repulsive energy is less than or equal to kBT. A recent ACOMP application succeeded in monitoring the cross-over from counterion condensation to non-condensation regimes during copolymer synthesis of anionic and neutral comonomers [32]. In this latter work the authors introduced the term “copolyelectrolyte” as an abbreviation for “copolymer polyelectrolyte”.
The current work deals with synthesis of copolyelectrolytes composed of neutral acrylamide (Am) and anionic styrene sulfonate (SS). The reactivity ratios introduced by Mayo and Lewis provide a convenient means of assessing mutual reactivity of comonomers [33]. Given two comonomers, A and B, the reactivity ratio rA is the ratio of the probability that A will react with another A upon encounter to the probability that A will react with B upon encounter. The reactivity ratio rB is defined similarly for comonomer B. If rA and rB are each zero, then a strictly alternating copolymer will be formed. If rA and rB are each infinite, then only homopolymers of A and of B will be produced when the two polymerize in the same reactor. If rA = rB = 1 then a statistical copolymer is formed whose instantaneous composition only depends on the molar concentrations of A and B, and their respective free radicals, at that instant.
The following approximate values were found using ACOMP for acrylamide and styrene sulfonate copolymerization; rAm = 0.18, rSS = 2.14 [34]. Since rSS >> rAm it is expected that chains formed early in the copolymerization will be rich in SS, and hence be highly charged. Furthermore, the SS should be consumed rapidly, leaving Am to homopolymerize later in the reaction, after the SS is used up. These trends are clearly seen in ACOMP data.
1.2. Background on ACOMP
ACOMP was first introduced in 1998 [35] and was recently reviewed in detail [36]. It has been used in many scenarios including free radical copolymerization [37,38], copolyelectolytes [39], branching reactions [40], emulsion [41] and inverse emulsion [42] reactions, in batch, semi-batch [43] and continuous reactors [44], for aqueous and organic solvents, for post-polymerization and derivitization reactions [45], and for the controlled radical polymerization routes nitroxide-mediated polymerization (NMP) [46], atom transfer radical polymerization (ATRP) [47], reversible addition fragmentation transfer polymerization (RAFT) [48], and ring opening metathesis polymerization (ROMP) [49]. Simultaneous monitoring of both polymer reaction characteristics and colloid size distributions (latex and monomer droplets) was also achieved in emulsion polymerization [41]. Recently, fully automatic feedback control of free radical polymerization was achieved [50]. The first system controlled was aqueous polymerization of Am. Current work includes simultaneous automatic feedback control of composition and molecular weight during free radical copolymerization, automatic production of multi-modal polymers, and extension of control to living type polymerization. The work presented here is cognate to the latter effort.
ACOMP relies on the continuous extraction, dilution, and conditioning of a small sample stream from the reactor on which measurements by various combinations of detectors are made. By combining simultaneous data from multiple detectors continuous monitoring of salient reaction characteristics can be made, such as kinetics, conversion of comonomers, composition drift, evolution of molecular mass and intrinsic viscosity, and detection of unusual phenomena, such as microgelation and runaway reactions. Typical detectors include light scattering, UV/visible spectrophotometry, viscometry, refractivity, and polarimetry. While ACOMP is not inherently a chromatographic method, its continuous stream can be used in automatic conjunction with gel permeation and other separation techniques, as has been demonstrated [51].
2. Second Generation ACOMP (SGA) for Monitoring the Synthesis of Stimuli Responsive Polymers under Varying Solution Conditions
The aims of this work are (1) to introduce the multi-stage serial flow SGA; (2) apply it to the monitoring of copolyelectrolyte synthesis in batch; (3) to qualitatively interpret the results within well understood concepts of polyelectrolyte behavior. It is beyond the scope of this work to develop a complete theoretical formulation for interpreting all the data, such as by electrostatic persistence length, excluded volume theory, and counterion condensation theories.
An earlier version of SGA allowed control of temperature in three detection stages, each stage with a light scattering and viscometer. This was used to study the effects on the lower critical solution temperature (LCST) of copolymerizing n-isopropyl acrylamide (NIPAM) with more hydrophilic comonomers [52,53].
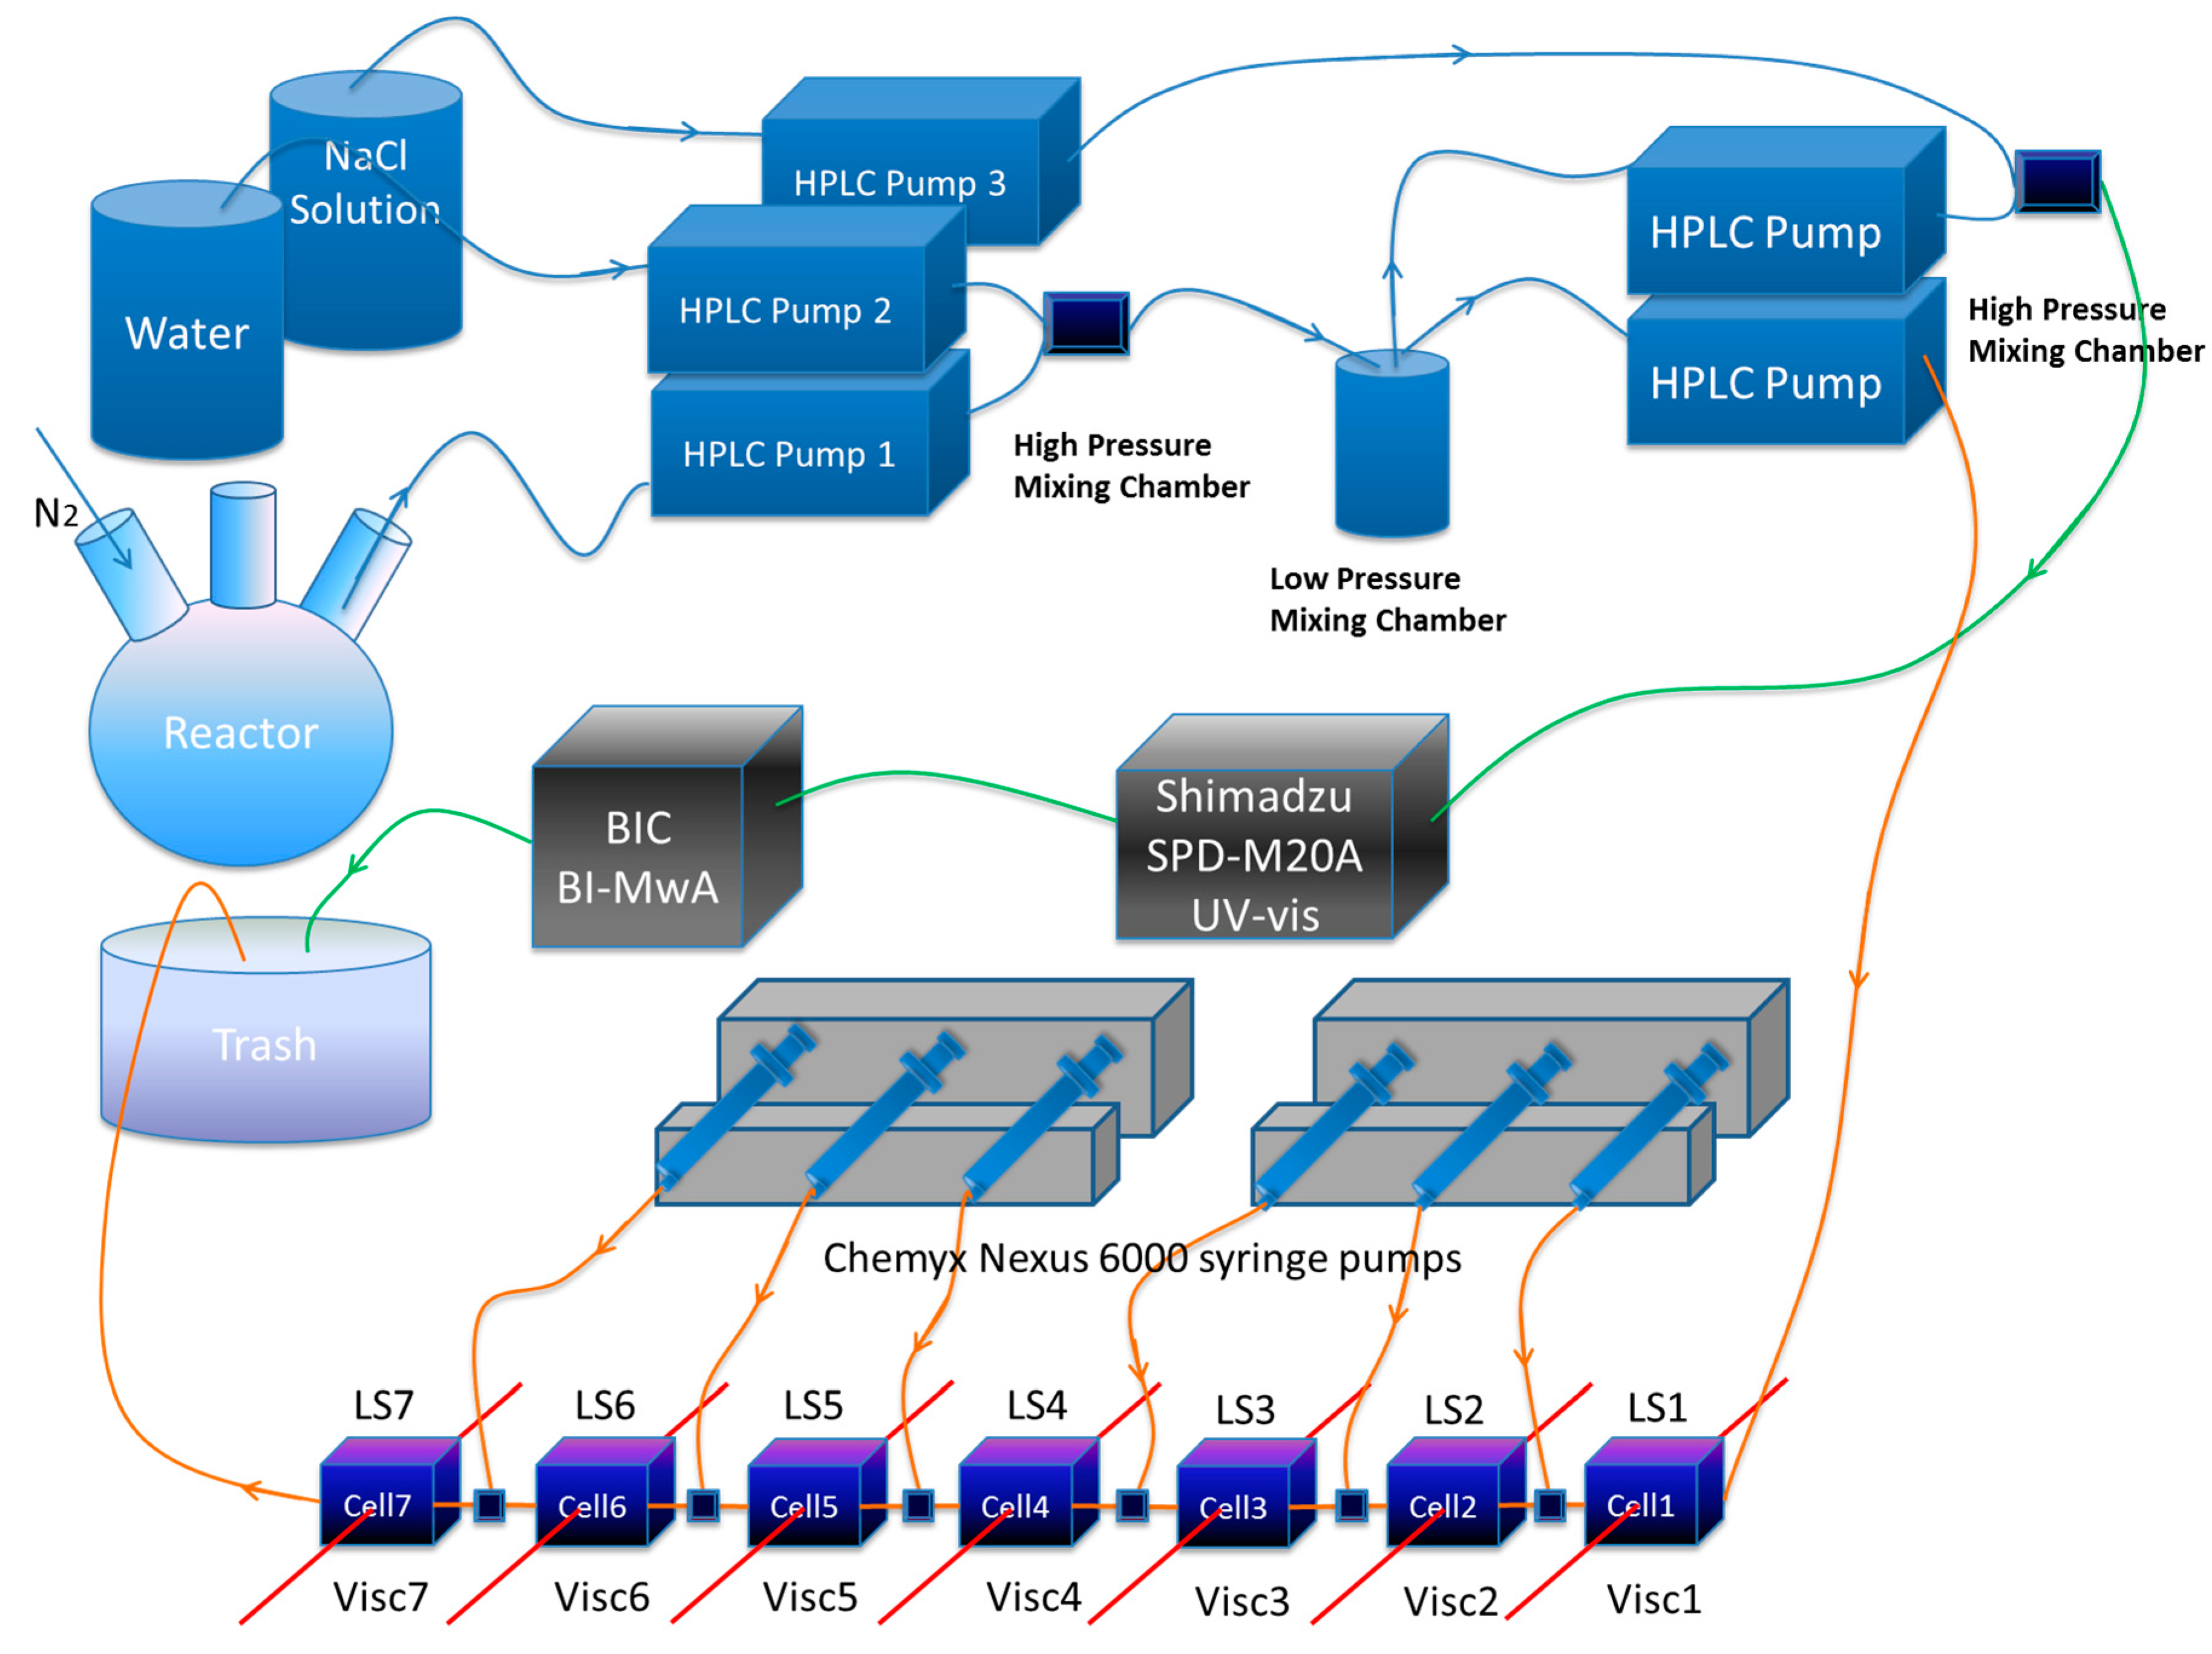
In this work the custom built SGA comprises (i) a system of pumps and a high pressure and a low pressure mixing chamber for continuously withdrawing and diluting reactor content at a low flow rate, typically 0.1 mL/min; (ii) up to seven detector stages in series, each with a custom built single capillary viscometer and a 90° custom built light scattering flow cell; (iii) a high pressure multi-head syringe pump that feeds concentrated NaCl solutions into each stage, thus increasing ionic strength (IS) from stage to stage; (iv) A separate, highly dilute stream at 150 mM NaCl from the low pressure mixing chamber is fed to a diode array UV spectrophotometer, covering the range 190–400 nm (Shimadzu SPD-M20A). From the UV detector, the stream flows through a seven angle light scattering unit (BI-MwA from Brookhaven Instruments Corp., New York, NY, USA); (v) Data from all the detectors are collected under various protocols and unified in realtime into a master file to allow cross-correlations and calculations using the different signals.
Hence, the SGA combines (i) the features of the original ACOMP to monitor copolymer weight average molecular weight and reduced viscosity, and cumulative and instantaneous copolymer composition with (ii) the ability to interrogate the polymer continuously during synthesis as to its light scattering and viscometric responses to a series of IS.
The SGA system is equipped with two Nexus 6000 high pressure syringe pumps (By Chemyx Inc., Stafford, TX, USA) which infuse NaCl solutions with different concentrations in each syringe into the serial flow, in order to change the ionic strength at each stage. To meet the operation/characterization under high pressure operation condition, stainless steel syringes (Harvard Apparatus, MA, USA) are used to hold the NaCl solutions for injection into the serial flow. The sample extraction and dilution system consists of four Shimadzu AD-VP HPLC pumps. A system diagram is shown in Scheme 1. Pump 1 extracts sample directly from the reactor, Pump 2 and Pump 3 are used for diluting sample with deionized water as a first dilution. A separate HPLC pump delivers this first stage dilution stream through the multi-stage serial dilution stage with the LS/viscometer detection pairs, where the IS is increased at each stage via the syringe pumps. A second dilution of the first stream occurs in a second high pressure mixing chamber producing a highly dilute sample at 150 mM IS, which is sent to a detection stage comprising a UV-vis (Shimadzu SPD-M20A, Kyoto, Japan) and BI-MwA (Brookhaven Instruments Corporation, New York, NY, USA). This highly dilute stream at 150 mM IS allows determination of Mw without interference from the large virial coefficient effects deliberately produced in the more highly concentrated, multi-stage IS detector train. All detectors were at room temperature.
Table 1 provides information on each reaction, including the amount of dilution in the first and second dilution stages. Table 2 shows the syringe pump reservoir strength of each stage, the IS of the serial flow at each stage, and the additional, small dilution that occurs in each stage.
Viscosity computations are based on Poisseuille flow of a liquid of viscosity η in a capillary of length L and radius R at a flow rate Q (cm3/s), for which the pressure drop ΔP across the capillary is
The dilute solution polynomial expansion for viscosity is used to interpret the viscometer data:
where ηs is the pure solvent viscosity, [η] is the intrinsic viscosity of the polymer, Cp is the polymer concentration (in g/cm3) and kH is a constant related to the hydrodynamic interactions between polymer chains, usually around 0.4 for neutral, coil polymers [54]. The intrinsic viscosity is the extrapolation to zero concentration and zero shear rate of the reduced viscosity ηr, which is defined according to Equation (2) by
In the second equality V(t) is the time dependent viscometer signal, Vs is the voltage of the pure solvent baseline, and V0 accounts for any voltage offset in the viscometer when the flow rate through it is Q = 0. This latter can be written as shown because the viscometer voltage output is directly proportional to ΔP. It is important to realize that because the denominator divides out by solvent baseline voltage, no calibration factor for the capillary viscometer is needed in order to determine ηr. The specific viscosity ηsp is another useful quantity computed by
The absolute excess Rayleigh ratio is determined from the raw light scattering voltages by
where V(t) is the scattering from the polymer solutions, Vs is the scattering from the pure solvent and Vd is the dark voltage of the detector when there is no incident light on the scattering sample. IR,toluene is the Rayleigh ratio for pure toluene at T = 25 °C, which is given for any wavelength by
IR measures the fraction of incident light scattered per cm of path through the scattering medium. IR is used for light scattering analysis using the usual Zimm approach [55]:
where K is an optical constant, given for vertically polarized incident light by
where n is the solvent index of refraction, λ is the vacuum wavelength of the incident light, dn/dc is the differential refractive index for the polymer in the chosen solvent, and q is the usual scattering wave-vector amplitude, q = (4πn/λ)sin(θ/2), where θ is the scattering angle.
In the limit as , and for polydisperse polymers this reduces to
where Mw is the weigh average molecular weight and A2 and A3 are complex averages of the virial coefficients.
The individually resolved concentrations of Am and SS can be used to compute the instantaneous mole fractions of Am and SS in a copolymer at any instant according to
3. Copolymerization
Sodium 4-vinylbenzenesulfonate and acrylamide were used as received from Sigma-Aldrich. The initiator, 2,2′-azobis(2-amidinopropane dihydrochloride (V-50), was from Wako Chemicals USA, Inc. For batch reactions A and B comonomers with molar ratio of 1:1 were fully dissolved in DI water, and the reactions were carried out in a thermostated three neck reactor under continuous N2 purge. The starting comonomers’ concentrations and reaction temperatures are listed in Table 1 for Reactions A, B, and C. Linear charge density ξ varies during synthesis due to the high composition drift of the copolymeric system; anionic styrene sulfonate (SS) and electrically neutral acrylamide (Am), which have widely separated reactivity ratios (rAm = 0.18, rSS = 2.14 in 0.1 M NaCl [39], and with similar high drift at other ionic strengths). The salt, the sodium form of styrene sulfonate remains ionized at the near-neutral pH of the reactor solution. There was no added NaCl in the reactor.
Although a salt is used here (SS) the use of the acid form, sulfonic acid, could lead to different behavior in the polymer, beyond the counterion condensation effect expected even for salts, since pKa for acids and bases in polymers is different than in their small molecule form. ACOMP has previously used both pH and conductivity probes in the reactor to follow changes in these quantities and would normally be used in such cases.
4. Results and Discussion
4.1. Typical Raw Data
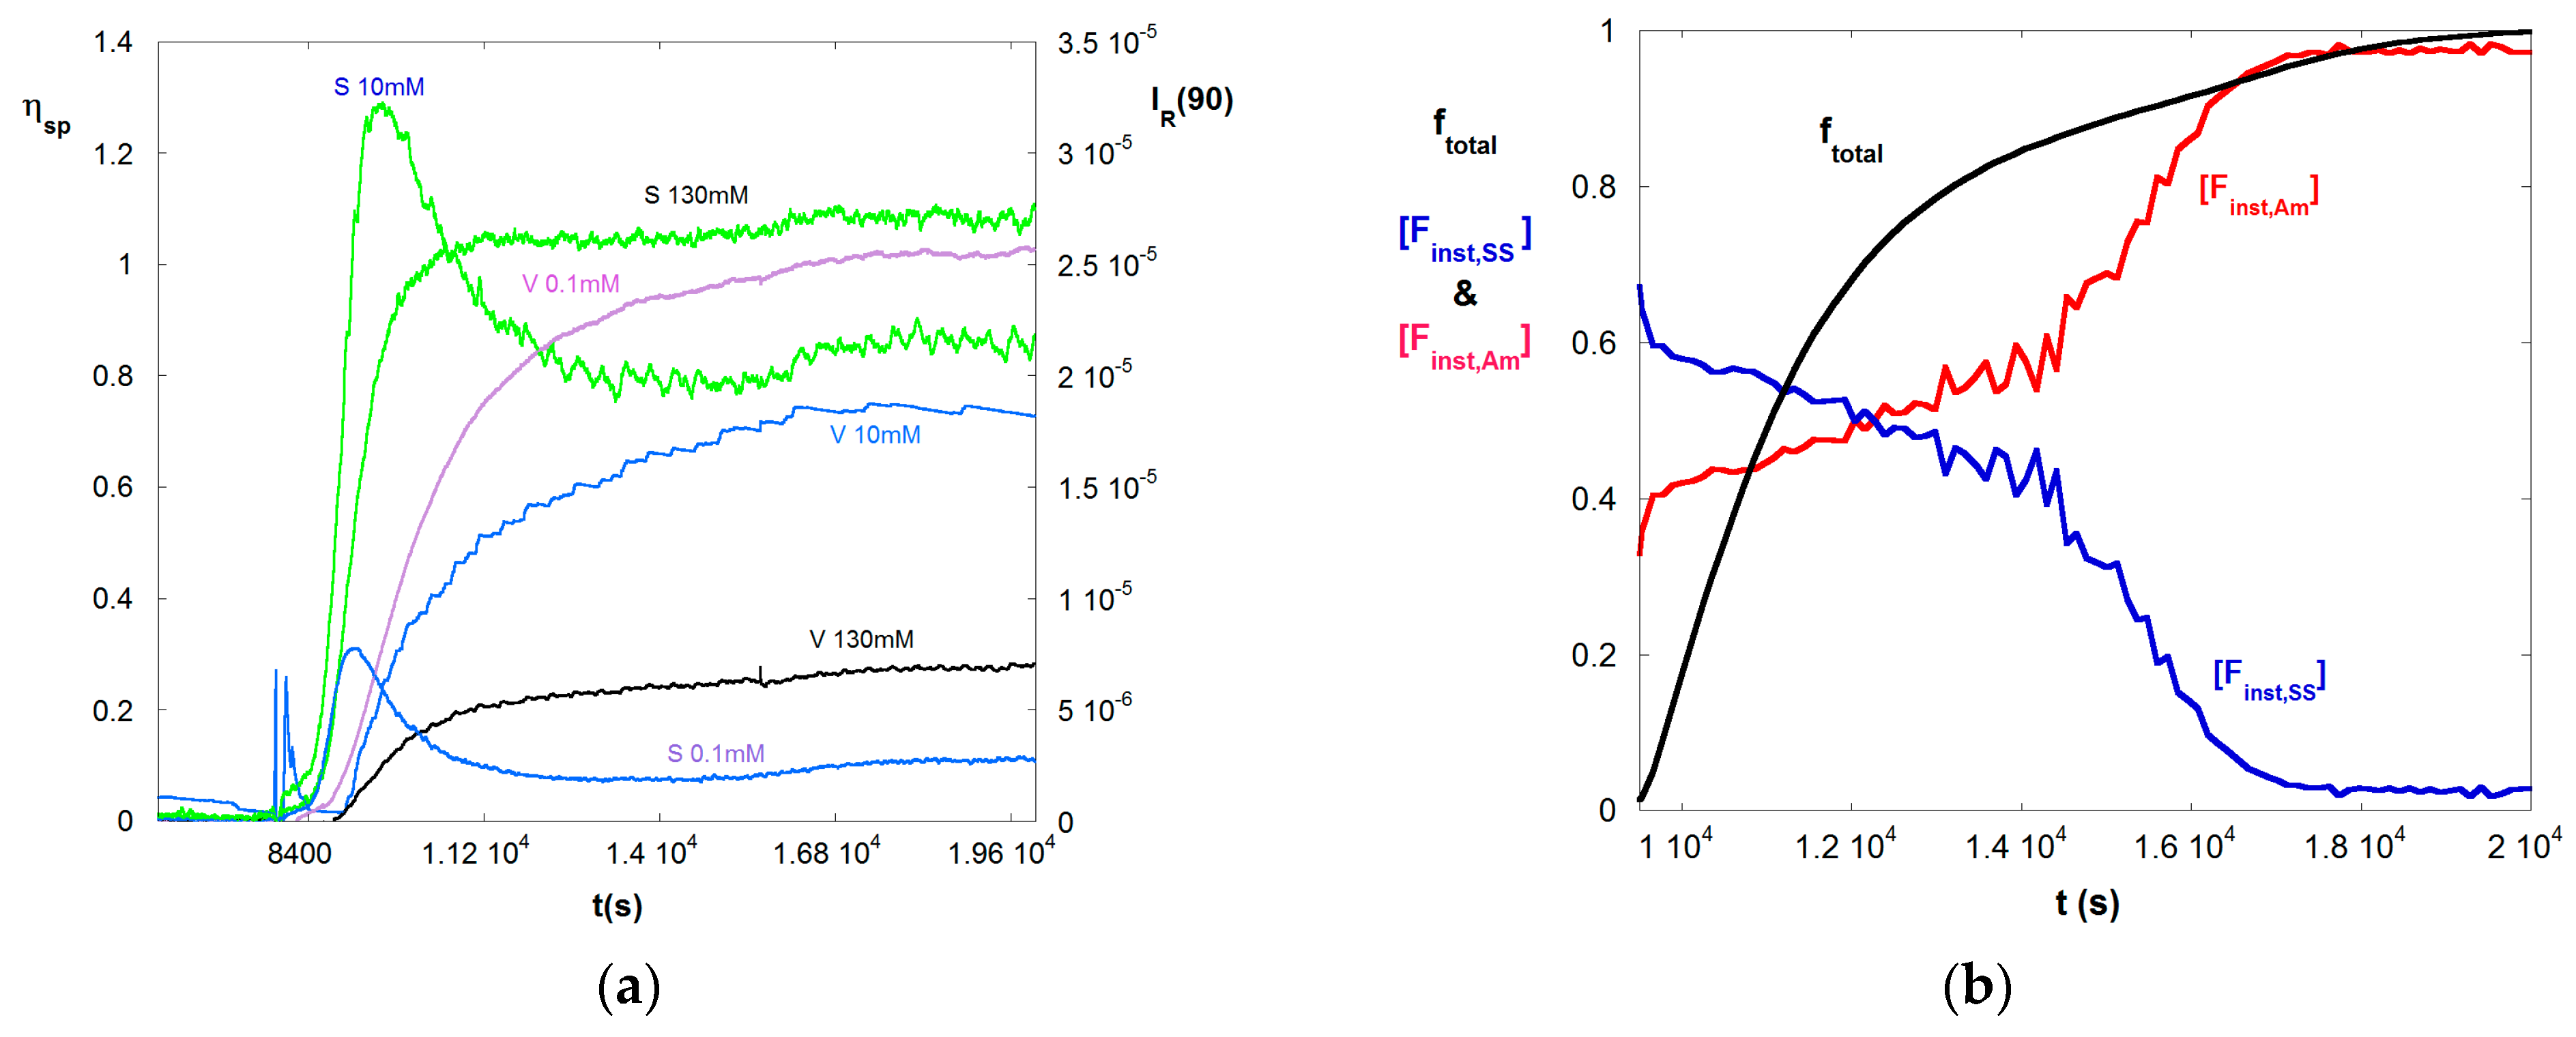
Figure 1a shows typical raw data for a 50/50 VB/Am copolymerization, where ηsp and IR are computed by Equations (4) and (5), respectively. The conditions are given in Table 1. The reaction began at 8000 s. The time scale of the reaction corresponds to earlier findings [39]. Only three IS of the seven measured are shown, in order to keep the figure legible. The trend for viscosity is as expected, namely as IS increases there is a dramatic drop in ηsp at any given instant, reflecting coil contraction as charges are electrostatically shielded. The light scattering (LS) at low IS, 0.1 mM, is highly suppressed. Also a maximum is reached as the reaction proceeds follow by a steady drop and subsequent small rise late in the reaction, starting at about 16,000 s. The maximum is due to the effect of A3, seen in Equation (9), as the concentration builds. A similar shape and effect is seen at 10 mM, except the overall magnitude of the LS is well above that for 0.1 mM, due to significantly reduced A2 and A3. At 130 mM the A3 effect is completely suppressed and LS increases monotonically as the reaction proceeds. At 130 mM the solution is about 10% more dilute than at 10 mM. The slight rise in LS for 0.1 mM starting at 16,000 s, is also seen for 10 mM and 130 mM LS. This is due to the fact that the high reactivity ratio of SS leads to its complete consumption at about 16,000 s, leaving only Am, which produces more massive homopolymer chains than the copolymer chains. The trend can also be seen in the viscosity data, although less pronounced.
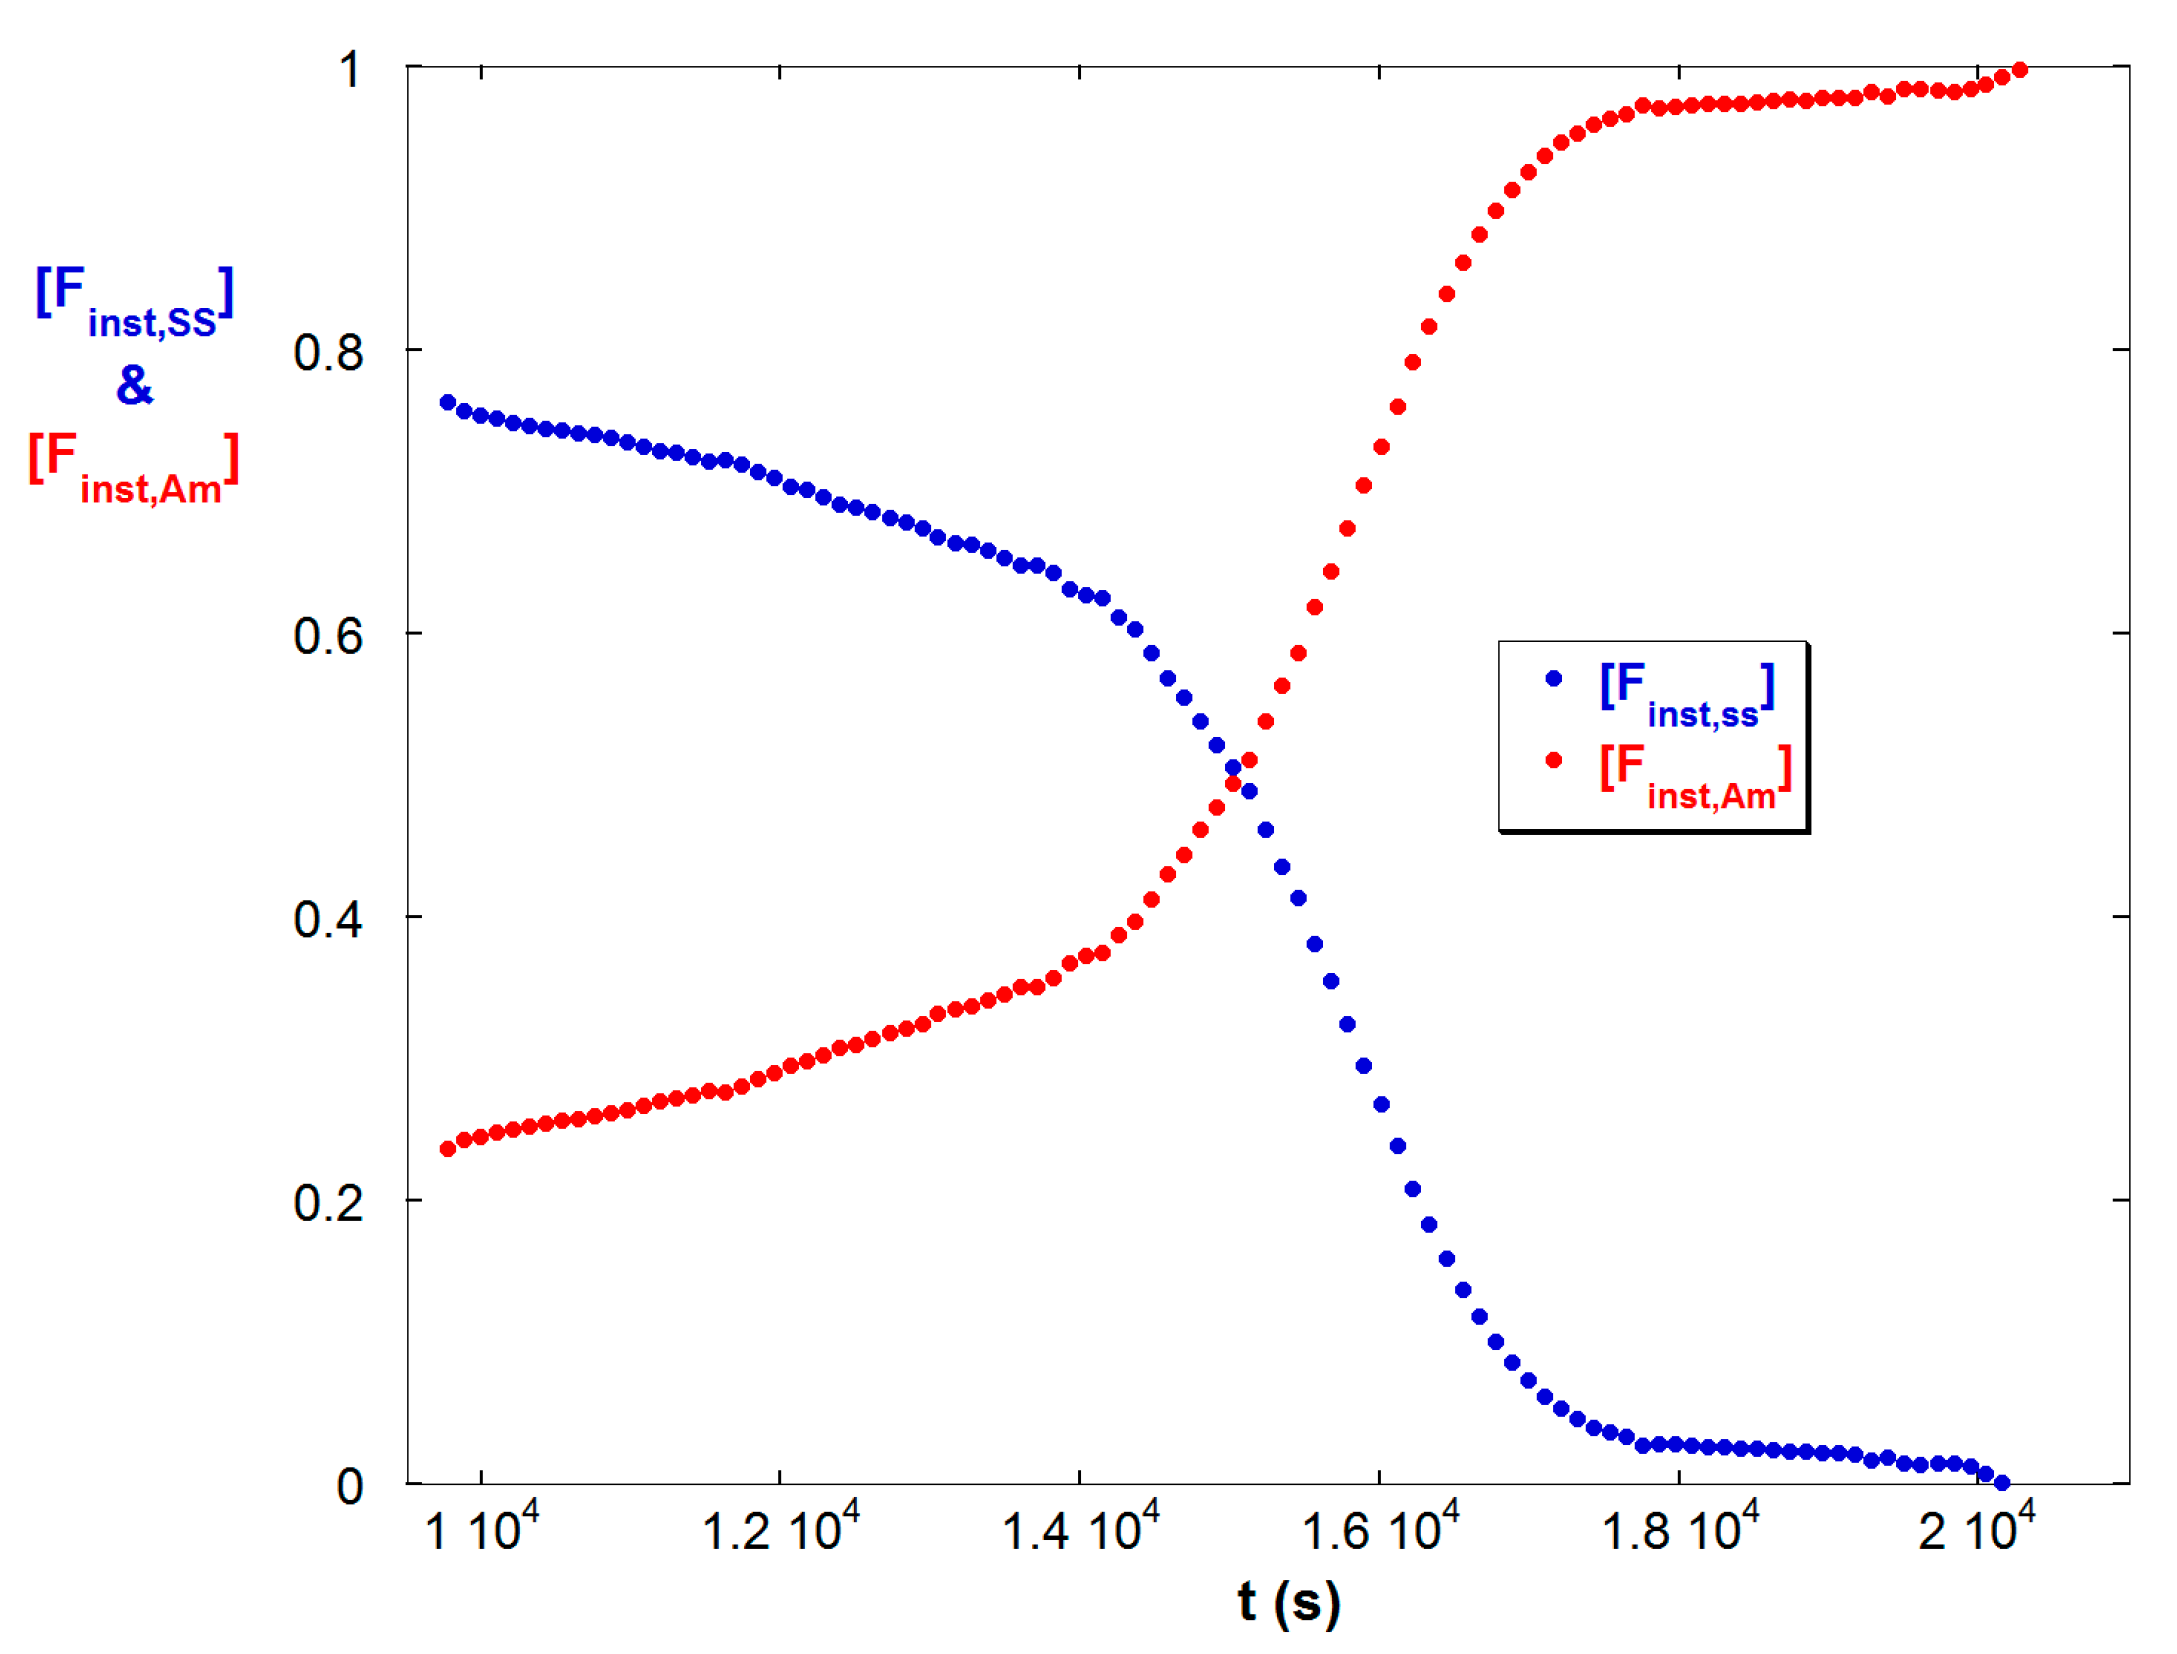
Figure 1b shows the total fractional polymer conversion ftotal, and the instantaneous molar fractions of Am and SS in copolymers produced at a given instant, [Finst,Am] and [Finst,SS], according to Equations (10a,b). This shows that SS is consumed more rapidly, due to its higher reactivity ratio, leaving chains with decreasing fraction of SS as the reaction progresses.
4.2. SGA Data Analysis
Figure 2 shows Kc/IR vs. Cp for Reaction A up to 15,000 s. Cp is the polymer concentration in the detector train. Also shown are quadratic fits, which yield A2, and A3 for each, according to Equation (9). In these fits Mw was determined by linear extrapolation at low Cp to be 67,000 g/mol ±5% and showed low drift through the early and mid-stages of the reaction. It was held constant in the quadratic fit, leaving A2 and A3 as the fit variables. Figure 3 shows these latter values obtained from the quadratic fits.
Figure 3 shows A2 and A3 vs. IS from these determinations. While both A2 and A3 follow the same expected decreasing trend vs. IS, they do not overlap using the double-y scale of Figure 3. Nonetheless, the representation which brings them into rough parity is two orders of magnitude in A3 for each order of magnitude in A2, which is reminiscent of the relationship between A2 and A3 that Boltzmann found for hard spheres [56].
While charged, random coil polymers, which the Am/SS resemble, are not expected at all to follow hard sphere behavior the approximate scaling in Equation (11) for the data in Figure 3 is nonetheless suggestive of an underlying relationship between the two and three body interactions of the different morphologies.
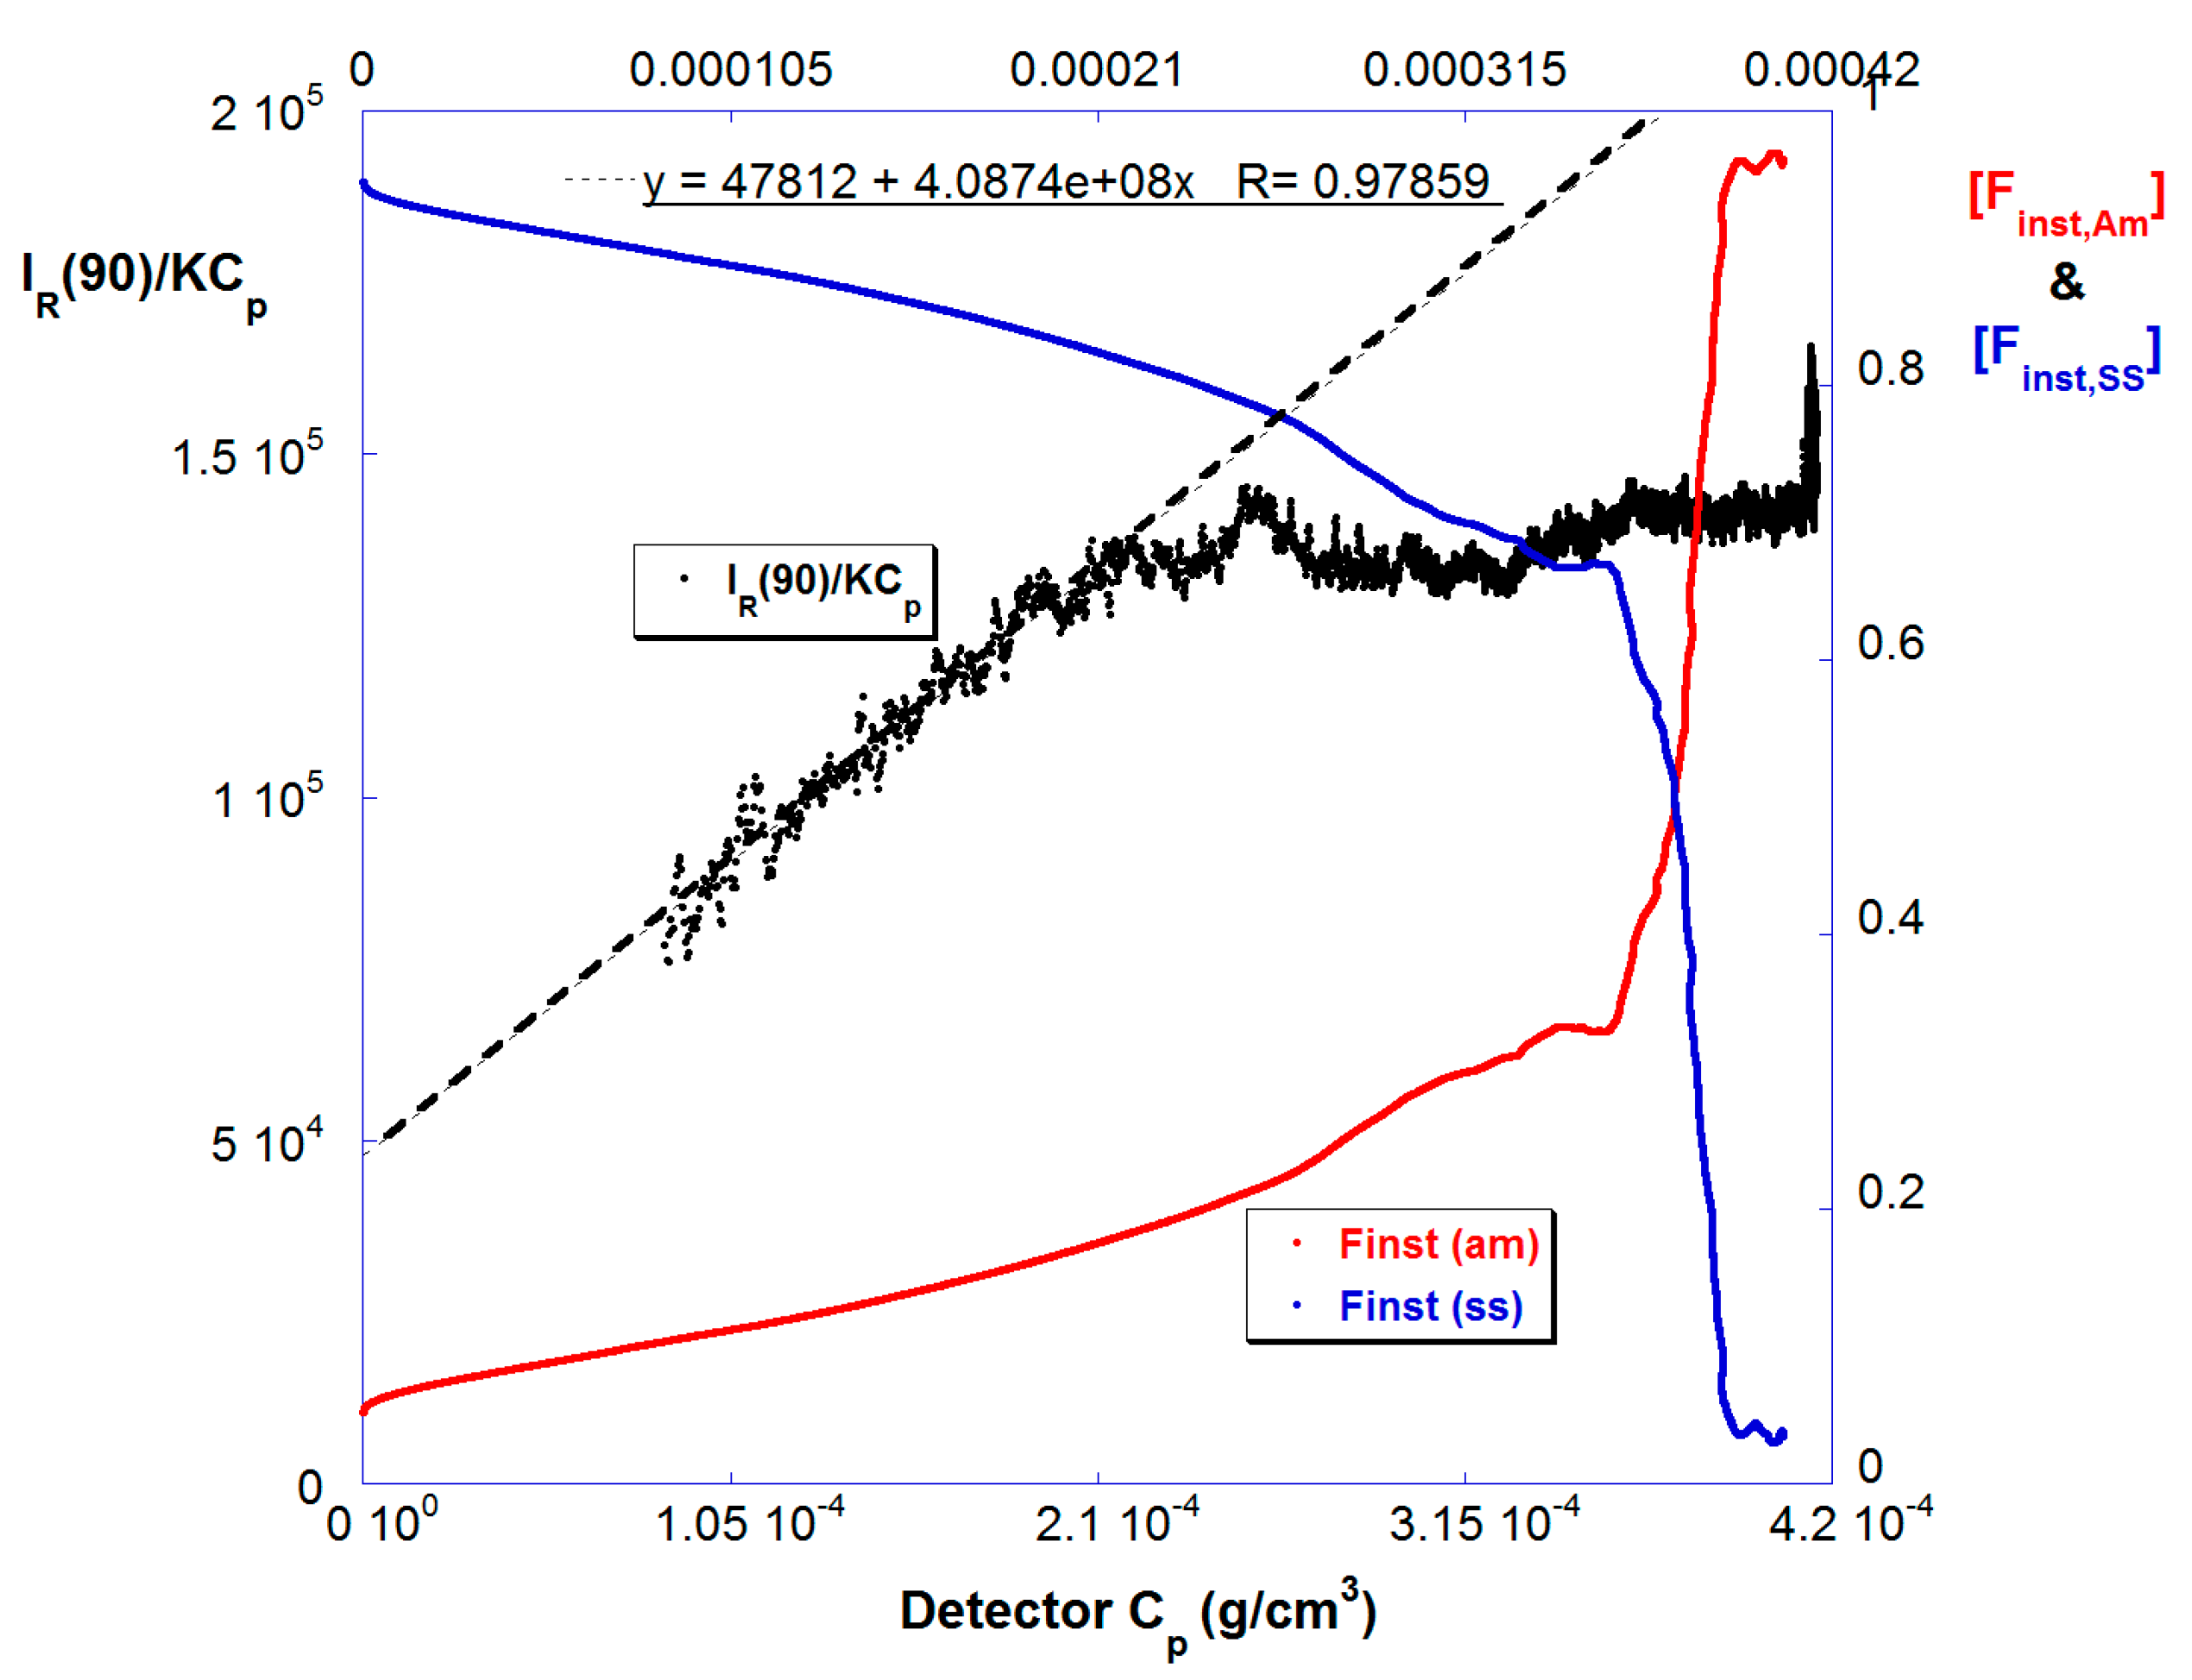
Figure 4 shows [Finst,Am] and [Finst,SS] vs. Cp in the highly dilute, last stage detector train for reaction B. [Finst,SS] decreases as the reaction proceeds, similar to Figure 1b, which is shown in the time domain. Also shown is IR(90)/KCp vs. Cp. Because these data are gathered in the highly diluted last stage, and under an ionic strength of 150 mM, this is a good approximation to the weight average molar mass Mw. Although there was a MALS detector in the highly dilute last stage, there was no measurable angular dependence over the Mw range produced so IR(90) is used for the Mw determination. Mw starts at around 5 × 10⁴ g/mol and increases linearly until 50% conversion by mass, during the period that [Finst,SS] falls gradually, at which point it levels off, and then increases again as the SS is fully consumed in the last 10% of conversion.
Figure 5 shows IR(90) vs. Cp in the more concentrated SGA train, for reaction B in Table 1, where Cp is the concentration of copolymer in the SGA detector train. Again, the effect of A2 and A3 is seen as IR(90) acquires first a negative second derivative and then a maximum.
Figure 6 shows ηr vs. Cp in the dilute train for reaction B at five different ionic strengths. The expected trend is found that at any point in the polymerization reaction ηr decreases with increasing IS. The inset shows the final values of ηr, showing nearly a factor of four drop in ηr from low to high IS.
4.3. Contrasting Viscosity Behavior in a Low to High ξ Reaction with a High to Low ξ Reaction
As seen in the batch reactions above, the high reactivity ratio of SS compared to Am results in rapid consumption of SS, which means the copolymer proceeds from high negative ξ which decreases to ξ = 0 once the pure polyacrylamide stage is reached during the latter portion of the reaction. A means of starting with ξ = 0 and increasing ξ = 0 during the reaction is to start with pure Am and feed in a stock of SS (a semi-batch reaction). The semi-batch reaction (reaction C) started with pure Am, had a constant flow of SS into the reactor, and ended with almost 100% SS. It was arranged so that the final polymer concentration was comparable to the final polymer concentration in the batch reaction. The molar masses are also comparable.
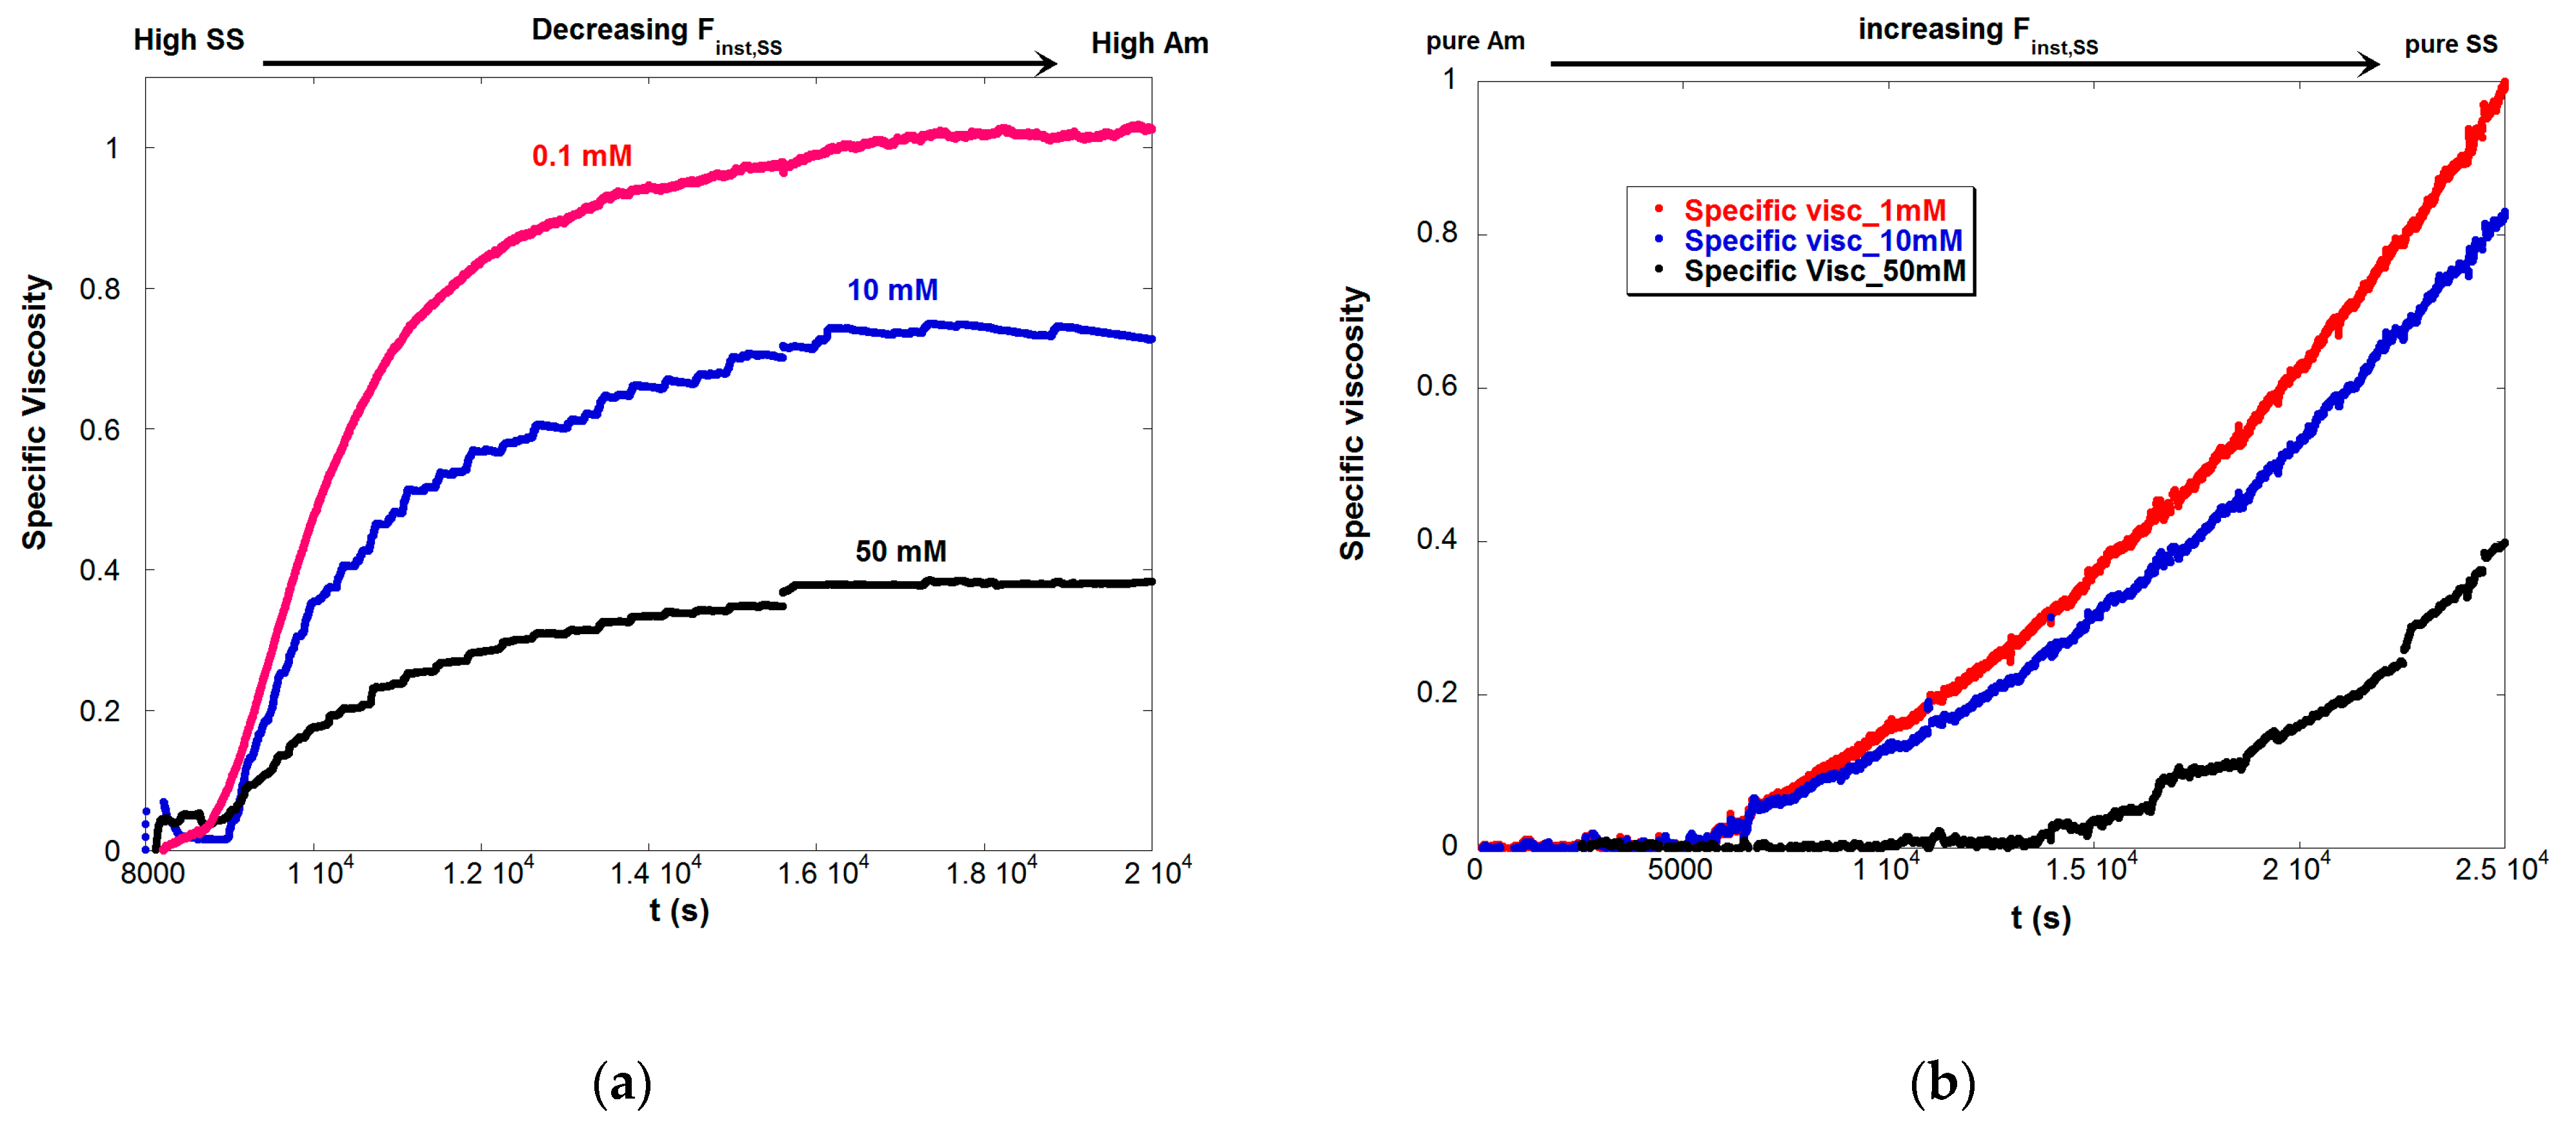
The specific viscosity for the batch reaction at three different IS is shown in Figure 7a. ηsp has a negative second derivative during the entire reaction at the three IS shown. This shows how the highly charged chains at the beginning of the reaction rapidly increase ηsp, but then the increase of ηsp slows down as the chains become less and less charged as [Finst,Am] increases.
In contrast Figure 7b shows a positive second derivative for ηsp as SS flows into the reactor. This shows how increasing ξ rapidly increases ηsp as [Finst,SS] increases. The increase in [Finst,SS] due to semi-batch operation of reaction C is shown in Figure 8, which can be contrasted with Figure 1b and Figure 4 to see the opposite trends in the batch reactions A and B.
5. Summary
A second generation ACOMP system (SGA) has been prototyped and introduced. It is capable of changing solution conditions in serial fashion on a flowing sample stream in up to seven different conditions. A detector stage, consisting of a viscometer and light scattering detector, is present in each successive sample condition, allowing the influence of several solution conditions to be monitored at each instant during the synthesis of polymers.
The first reaction used to demonstrate the capacity of the new system was the copolymerization of a neutral monomer (Am) with an anionic monomer (SS) in both batch and semi-batch processes. The difference in reactivity ratios led to high drift in composition towards chains richer in Am as reactions proceeded, corresponding to lower linear charge density ξ. The effects of up to seven different ionic strengths on reduced viscosity and the virial coefficients A2 and A3 were monitored for batch and semi-batch reactions. The A2 and A3 effects, monitored by light scattering, were pronounced at low IS, leading to maxima in scattering during the reaction which then subsided as the reaction progressed further. These strong interparticle effects were largely screened and minimized at high IS. The behavior of reduced viscosity followed the expected trend of decreasing with increasing IS at all points during the reaction. When a semi-batch reaction was run such that SS was increased, and hence also ξ, ηr increased with a positive second derivative in time, whereas a batch reaction with similar concentrations led to a negative second derivative in time due to ξ decreasing in time.
The SGA should be useful for reactions where stimuli responsive polymers are produced. These include living type copolymerization of block copolymers which exhibit an LCST, and those which can micellize and entrap substances, such as drugs. It may also be possible to develop formulations, since different agents can be added in the seven solution condition system.
It is noted that APMT, Inc. has implemented first generation ACOMP on industrial scale reactors. Hence, scale-up of SG-ACOMP is expected to follow a similar path. It is hoped that, as stimuli responsive polymers become a larger part of the polymer manufacturing sector, SG-ACOMP, or similar, can be integrated into plant design. Similarly, the active, automatic control of conventional polymer synthesis [50] is currently being adapted for living type reactions, on which the synthesis of many stimuli responsive polymers relies.
Acknowledgments
This work was supported by NSF EPS-1430280 and Louisiana Board of Regents.
Author Contributions
Aide Wu improved the instrumentation and carried out most of the experiments. Michael F. Drenski contributed to the design and build of the original SGA system and guided many of the improvements. Zifu Zhu helped build the original SGA system, together with Michael F. Drenski, and carried out the semi-batch reaction and reaction A in the work. Wayne F. Reed conceived the idea of SG-ACOMP and the multiple syringe pump approach to changing conditions in serial flow, and wrote most of this manuscript.
Conflicts of Interest
The authors declare no conflict of interest.
References
- Zhuang, J.; Gordon, M.R.; Ventura, J.; Li, L.; Thayumanavan, S. Multi-stimuli responsive macromolecules and their assemblies. Chem. Soc. Rev. 2013, 42, 7421–7435. [Google Scholar] [CrossRef] [PubMed]
- Jeong, B.; Gutowska, A. Lessons from nature: Stimuli-responsive polymers and their biomedical applications. Trends Biotechnol. 2002, 20, 305–311. [Google Scholar] [CrossRef]
- Nath, N.; Chilkoti, A. Creating “smart” surfaces using stimuli responsive polymers. Adv. Mater. 2002, 14, 1243–1247. [Google Scholar] [CrossRef]
- Liu, F.; Urban, M.W. Recent advances and challenges in designing stimuli-responsive polymers. Prog. Polym. Sci. 2010, 35, 3–23. [Google Scholar] [CrossRef]
- Galaev, I.; Mattiasson, B. Smart Polymers: Applications in Biotechnology and Biomedicine; CRC Press: Boca Raton, FL, USA, 2007. [Google Scholar]
- Chung, J.E.; Yokoyama, M.; Yamato, M.; Aoyagi, T.; Sakurai, Y.; Okano, T. Thermo-responsive drug delivery from polymeric micelles constructed using block copolymers of poly(n-isopropylacrylamide) and poly(butylmethacrylate). J. Control. Release 1999, 62, 115–127. [Google Scholar] [CrossRef]
- Zhang, J.; Peppas, N.A. Synthesis and characterization of pH-and temperature-sensitive poly(methacrylic acid)/poly(n-isopropylacrylamide) interpenetrating polymeric networks. Macromolecules 2000, 33, 102–107. [Google Scholar] [CrossRef]
- Jain, S.; Bates, F.S. On the origins of morphological complexity in block copolymer surfactants. Science 2003, 300, 460–464. [Google Scholar] [CrossRef] [PubMed]
- Matyjaszewski, K.; Sumerlin, B.S.; Tsarevsky, N.V.; Chiefari, J. Controlled Radical Polymerization; American Chemical Society: Washington, DC, USA, 2016. [Google Scholar]
- Ballard, N.; Mecerreyes, D.; Asua, J.M. Redox active compounds in controlled radical polymerization and dye-sensitized solar cells: Mutual solutions to disparate problems. Chem. A Eur. J. 2015, 21, 18516–18527. [Google Scholar] [CrossRef] [PubMed]
- Mastan, E.; Li, X.; Zhu, S. Modeling and theoretical development in controlled radical polymerization. Prog. Polym. Sci. 2015, 45, 71–101. [Google Scholar] [CrossRef]
- Chan, N.; Cunningham, M.F.; Hutchinson, R.A. Copper-mediated controlled radical polymerization in continuous flow processes: Synergy between polymer reaction engineering and innovative chemistry. J. Polym. Sci. Part A Polym. Chem. 2013, 51, 3081–3096. [Google Scholar] [CrossRef]
- Barner-Kowollik, C.; Delaittre, G.; Gruendling, T.; Paulöhrl, T. Elucidation of reaction mechanisms and polymer structure: Living/controlled radical polymerization. In Mass Spectrometry in Polymer Chemistry; Wiley-VCH Verlag GmbH & Co. KGaA: Weinheim, Germany, 2011; pp. 373–403. [Google Scholar]
- Flores, J.D.; Abel, B.A.; Smith, D.; McCormick, C.L. Stimuli-responsive polymers via controlled radical polymerization. In Monitoring Polymerization Reactions; John Wiley & Sons: New York, NY, USA, 2013; pp. 45–58. [Google Scholar]
- Hemp, S.T.; Long, T.E. DNA-inspired hierarchical polymer design: Electrostatics and hydrogen bonding in concert. Macromol. Biosci. 2012, 12, 29–39. [Google Scholar] [CrossRef] [PubMed]
- Cheng, S.; Zhang, M.; Dixit, N.; Moore, R.B.; Long, T.E. Nucleobase self-assembly in supramolecular adhesives. Macromolecules 2012, 45, 805–812. [Google Scholar] [CrossRef]
- Roy, R.K.; Meszynska, A.; Laure, C.; Charles, L.; Verchin, C.; Lutz, J.-F. Design and synthesis of digitally encoded polymers that can be decoded and erased. Nat. Commun. 2015, 6, 7237. [Google Scholar] [CrossRef] [PubMed]
- Lutz, J.-F.; Ouchi, M.; Liu, D.R.; Sawamoto, M. Sequence-controlled polymers. Science 2013, 341, 1238149. [Google Scholar] [CrossRef] [PubMed]
- Landau, L.D.; Lifshitz, E.M. Statistical Physics, 3rd ed.; Pergammon Press: Oxford, UK; New York, NY, USA, 1980. [Google Scholar]
- Flory, P.J. Principles of Polymer Chemistry; Cornell University Press: New York, NY, USA, 1953. [Google Scholar]
- Yamakawa, H. Modern Theory of Polymer Solutions; Harper & Row: New York, NY, USA, 1971. [Google Scholar]
- McMillan, W.G., Jr.; Mayer, J.E. The statistical thermodynamics of multicomponent systems. J. Chem. Phys. 1945, 13, 276–305. [Google Scholar] [CrossRef]
- Hansen, J.-P.; McDonald, I.R. Theory of Simple Liquids; Elsevier: Amsterdam, The Netherlands, 1990. [Google Scholar]
- Odijk, T. Polyelectrolytes near the rod limit. J. Polymer Sci. Polym. Phys. Ed. 1977, 15, 477–483. [Google Scholar] [CrossRef]
- Skolnick, J.; Fixman, M. Electrostatic persistence length of a wormlike polyelectrolyte. Macromolecules 1977, 10, 944–948. [Google Scholar] [CrossRef]
- Sorci, G.A.; Reed, W.F. Electrostatically enhanced second and third virial coefficients, viscosity, and interparticle correlations for linear polyelectrolytes. Macromolecules 2002, 35, 5218–5227. [Google Scholar] [CrossRef]
- Reed, W.; Ghosh, S.; Medjahdi, G.; Francois, J. Dependence of polyelectrolyte apparent persistence lengths, viscosity, and diffusion on ionic strength and linear charge density. Macromolecules 1991, 24, 6189–6198. [Google Scholar] [CrossRef]
- Manning, G.S. Limiting laws and counterion condensation in polyelectrolyte solutions II. Self-diffusion of the small ions. J. Chem. Phys. 1969, 51, 934–938. [Google Scholar] [CrossRef]
- Oosawa, F. Polyelectrolytes; Marcel Dekker Inc.: New York, NY, USA, 1971. [Google Scholar]
- Wilson, R.W.; Bloomfield, V.A. Counterion-induced condesation of deoxyribonucleic acid. A light-scattering study. Biochemistry 1979, 18, 2192–2196. [Google Scholar] [CrossRef] [PubMed]
- Hinderberger, D.; Spiess, H.W.; Jeschke, G. Dynamics, site binding, and distribution of counterions in polyelectrolyte solutions studied by electron paramagnetic resonance spectroscopy. J. Phys. Chem. B 2004, 108, 3698–3704. [Google Scholar] [CrossRef]
- Kreft, T.; Reed, W.F. Experimental observation of crossover from noncondensed to counterion condensed regimes during free radical polyelectrolyte copolymerization under high-composition drift conditions. J. Phys. Chem. B 2009, 113, 8303–8309. [Google Scholar] [CrossRef] [PubMed]
- Mayo, F.R.; Lewis, F.M. Copolymerization. I. A basis for comparing the behavior of monomers in copolymerization; the copolymerization of styrene and methyl methacrylate. J. Am. Chem. Soc. 1944, 66, 1594–1601. [Google Scholar] [CrossRef]
- Kreft, T.; Reed, W.F. Predictive control of average composition and molecular weight distributions in semibatch free radical copolymerization reactions. Macromolecules 2009, 42, 5558–5565. [Google Scholar] [CrossRef]
- Florenzano, F.H.; Strelitzki, R.; Reed, W.F. Absolute, on-line monitoring of molar mass during polymerization reactions. Macromolecules 1998, 31, 7226–7238. [Google Scholar] [CrossRef]
- Reed, W.F. Automated continuous online monitoring of polymerization reactions (acomp) and related techniques. In Encyclopedia of Analytical Chemistry; John Wiley & Sons, Ltd.: New York, NY, USA, 2006. [Google Scholar]
- Çatalgil-Giz, H.; Giz, A.; Alb, A.M.; Öncül Koç, A.; Reed, W.F. Online monitoring of composition, sequence length, and molecular weight distributions during free radical copolymerization, and subsequent determination of reactivity ratios. Macromolecules 2002, 35, 6557–6571. [Google Scholar] [CrossRef]
- Alb, A.M.; Enohnyaket, P.; Drenski, M.F.; Head, A.; Reed, A.W.; Reed, W.F. Online monitoring of copolymerization involving comonomers of similar spectral characteristics. Macromolecules 2006, 39, 5705–5713. [Google Scholar] [CrossRef]
- Alb, A.M.; Paril, A.; Catalfil-Giz, H.; Giz, A.; Reed, W.F. Evolution of composition, molar mass, and conductivity during the free radical copolymerization or polyelectrolytes. J. Phys. Chem. B 2007, 111, 8560–8566. [Google Scholar] [CrossRef] [PubMed]
- Farinato, R.S.; Calbick, J.; Sorci, G.A.; Florenzano, F.H.; Reed, W.F. Online monitoring of the final, divergent growth phase in the step-growth polymerization of polyamines. Macromolecules 2005, 38, 1148–1158. [Google Scholar] [CrossRef]
- Alb, A.M.; Reed, W.F. Simultaneous monitoring of polymer and particle characteristics during emulsion polymerization. Macromolecules 2008, 41, 2406–2414. [Google Scholar] [CrossRef]
- Alb, A.M.; Farinato, R.; Calbick, J.; Reed, W.F. Online monitoring of polymerization reactions in inverse emulsions. Langmuir 2006, 22, 831–840. [Google Scholar] [CrossRef] [PubMed]
- Kreft, T.; Reed, W.F. Predictive control and verification of conversion kinetics and polymer molecular weight in semi-batch free radical homopolymer reactions. Eur. Polym. J. 2009, 45, 2288–2303. [Google Scholar] [CrossRef]
- Grassl, B.; Reed, W.F. Online polymerization monitoring in a continuous reactor. Macromol. Chem. Phys. 2002, 203, 586–597. [Google Scholar] [CrossRef]
- Paril, A.; Alb, A.M.; Reed, W.F. Online monitoring of the evolution of polyelectrolyte characteristics during postpolymerization modification processes. Macromolecules 2007, 40, 4409–4413. [Google Scholar] [CrossRef]
- Mignard, E.; Leblanc, T.; Bertin, D.; Guerret, O.; Reed, W.F. Online monitoring of controlled radical polymerization: Nitroxide-mediated gradient copolymerization. Macromolecules 2004, 37, 966–975. [Google Scholar] [CrossRef]
- Mignard, E.; Lutz, J.-F.; Leblanc, T.; Matyjaszewski, K.; Guerret, O.; Reed, W.F. Kinetics and molar mass evolution during atom transfer radical polymerization of n-butyl acrylate using automatic continuous online monitoring. Macromolecules 2005, 38, 9556–9563. [Google Scholar] [CrossRef]
- Alb, A.M.; Serelis, A.K.; Reed, W.F. Kinetic trends in raft homopolymerization from online monitoring. Macromolecules 2008, 41, 332–338. [Google Scholar] [CrossRef]
- Alb, A.M.; Enohnyaket, P.; Craymer, J.F.; Eren, T.; Coughlin, E.B.; Reed, W.F. Online monitoring of ring-opening metathesis polymerization of cyclooctadiene and a functionalized norbornene. Macromolecules 2007, 40, 444–451. [Google Scholar] [CrossRef]
- McAfee, T.; Leonardi, N.; Montgomery, R.; Siqueira, J.; Zekoski, T.; Drenski, M.F.; Reed, W.F. Automatic control of polymer molecular weight during synthesis. Macromolecules 2016, 49, 7170–7183. [Google Scholar] [CrossRef]
- Alb, A.M.; Drenski, M.F.; Reed, W.F. Simultaneous continuous, nonchromatographic monitoring and discrete chromatographic monitoring of polymerization reactions. J. Appl. Polym. Sci. 2009, 113, 190–198. [Google Scholar] [CrossRef]
- McFaul, C.A.; Alb, A.M.; Drenski, M.F.; Reed, W.F. Simultaneous multiple sample light scattering detection of LCST during copolymer synthesis. Polymer 2011, 52, 4825–4833. [Google Scholar] [CrossRef]
- McFaul, C.A.; Drenski, M.F.; Reed, W.F. Online, continuous monitoring of the sensitivity of the LCST of nipam-Am copolymers to discrete and broad composition distributions. Polymer 2014, 55, 4899–4907. [Google Scholar] [CrossRef]
- Huggins, M.L. The viscosity of dilute solutions of long-chain molecules. J. Am. Chem. Soc. 1942, 64, 2716–2718. [Google Scholar] [CrossRef]
- Zimm, B.; Stein, R.; Doty, P. Polymer bull. 1 (1945) 90; bh zimm. J. Chem. Phys. 1948, 16, 1093. [Google Scholar] [CrossRef]
- Hansen, J.P.; McDonald, I.R. Theory of Simple Liquids; Acdamic Press: New York, NY, USA, 1986. [Google Scholar]
Scheme 1.
The Second Generation Automatic Continuous Online Monitoring of Polymerization reactions (SGA) instrumentation.
Scheme 1.
The Second Generation Automatic Continuous Online Monitoring of Polymerization reactions (SGA) instrumentation.

Figure 1.
(a) A selection of LS (S) and ηsp (V) data for 50/50 M/M copolymerization of Am and SS shown at three of the seven different IS available; 0.1 mM, 10 mM, and 130 mM for reaction A; (b) Total monomer conversion ftotal, and instantaneous mole fractions Finst,Am, and Finst,SS for reaction A.
Figure 1.
(a) A selection of LS (S) and ηsp (V) data for 50/50 M/M copolymerization of Am and SS shown at three of the seven different IS available; 0.1 mM, 10 mM, and 130 mM for reaction A; (b) Total monomer conversion ftotal, and instantaneous mole fractions Finst,Am, and Finst,SS for reaction A.

Figure 2.
KCp/IR(90) vs. Cp for reaction A, where Cp is the total polymer concentration in the detector train. Also shown are quadratic fits for A2 and A3 with fixed Mw = 67,000 g/mol in Equation (9).
Figure 2.
KCp/IR(90) vs. Cp for reaction A, where Cp is the total polymer concentration in the detector train. Also shown are quadratic fits for A2 and A3 with fixed Mw = 67,000 g/mol in Equation (9).
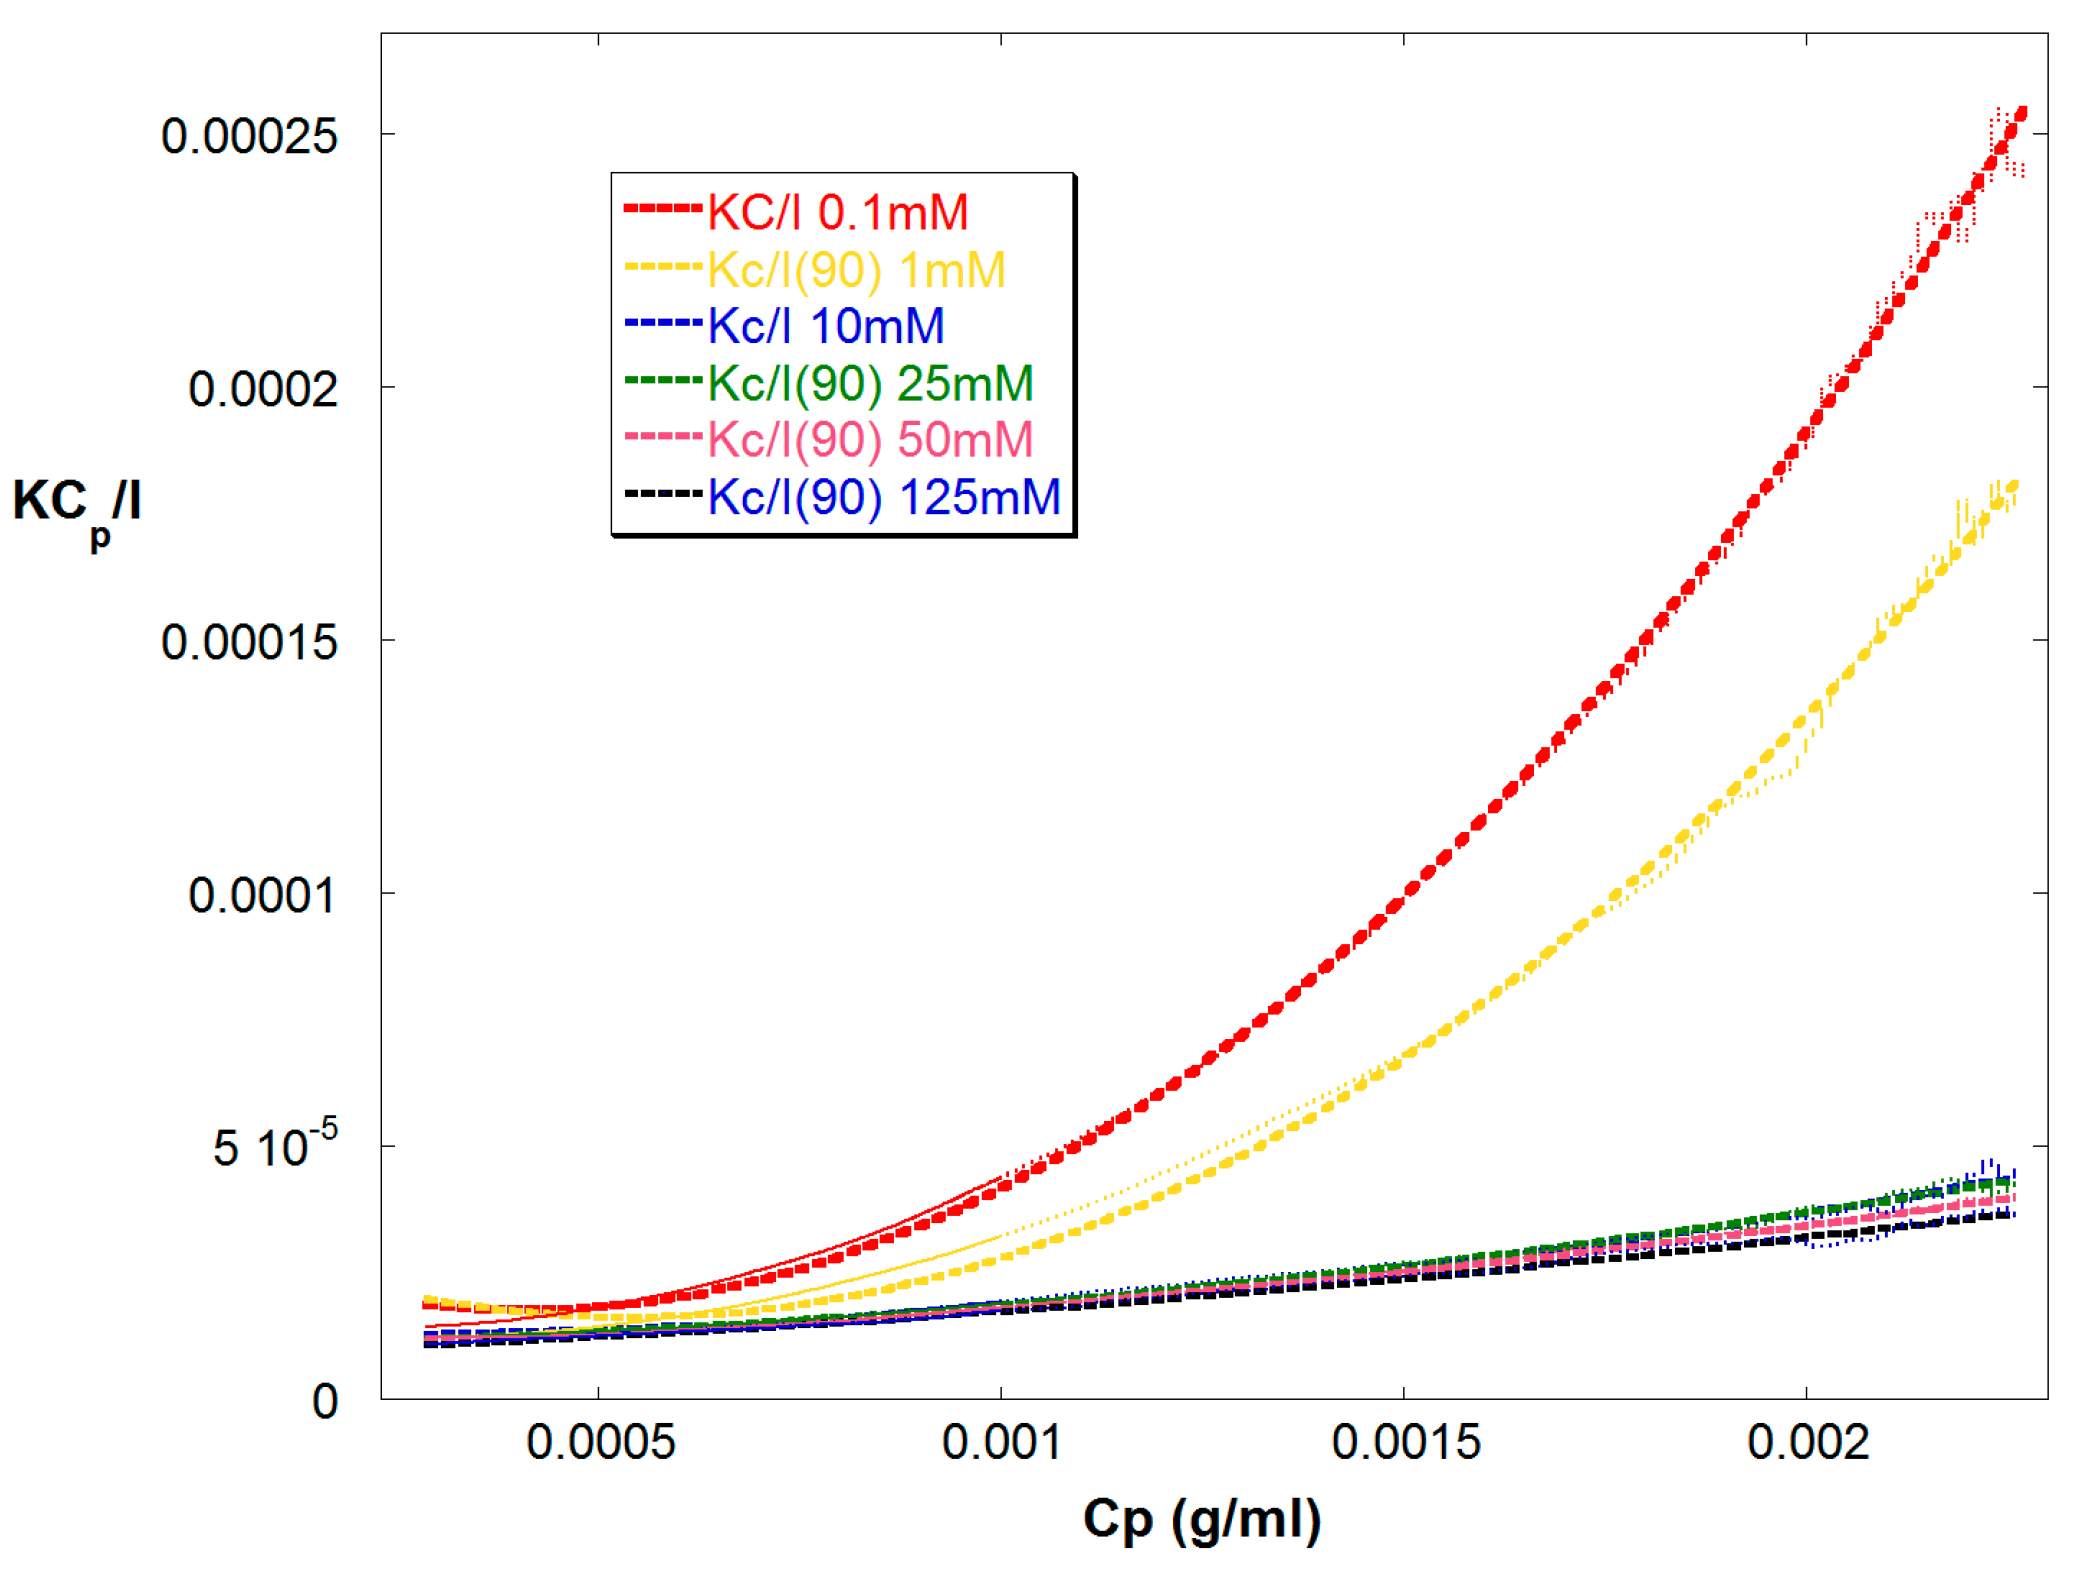
Figure 3.
A2 and A3 vs. IS, as determined from Figure 2. The A3 axis has two decades for each decade of the A2 axis, suggesting an approximate correspondence to the power law between A2 and A3 of Equation (11) for hard spheres.
Figure 3.
A2 and A3 vs. IS, as determined from Figure 2. The A3 axis has two decades for each decade of the A2 axis, suggesting an approximate correspondence to the power law between A2 and A3 of Equation (11) for hard spheres.
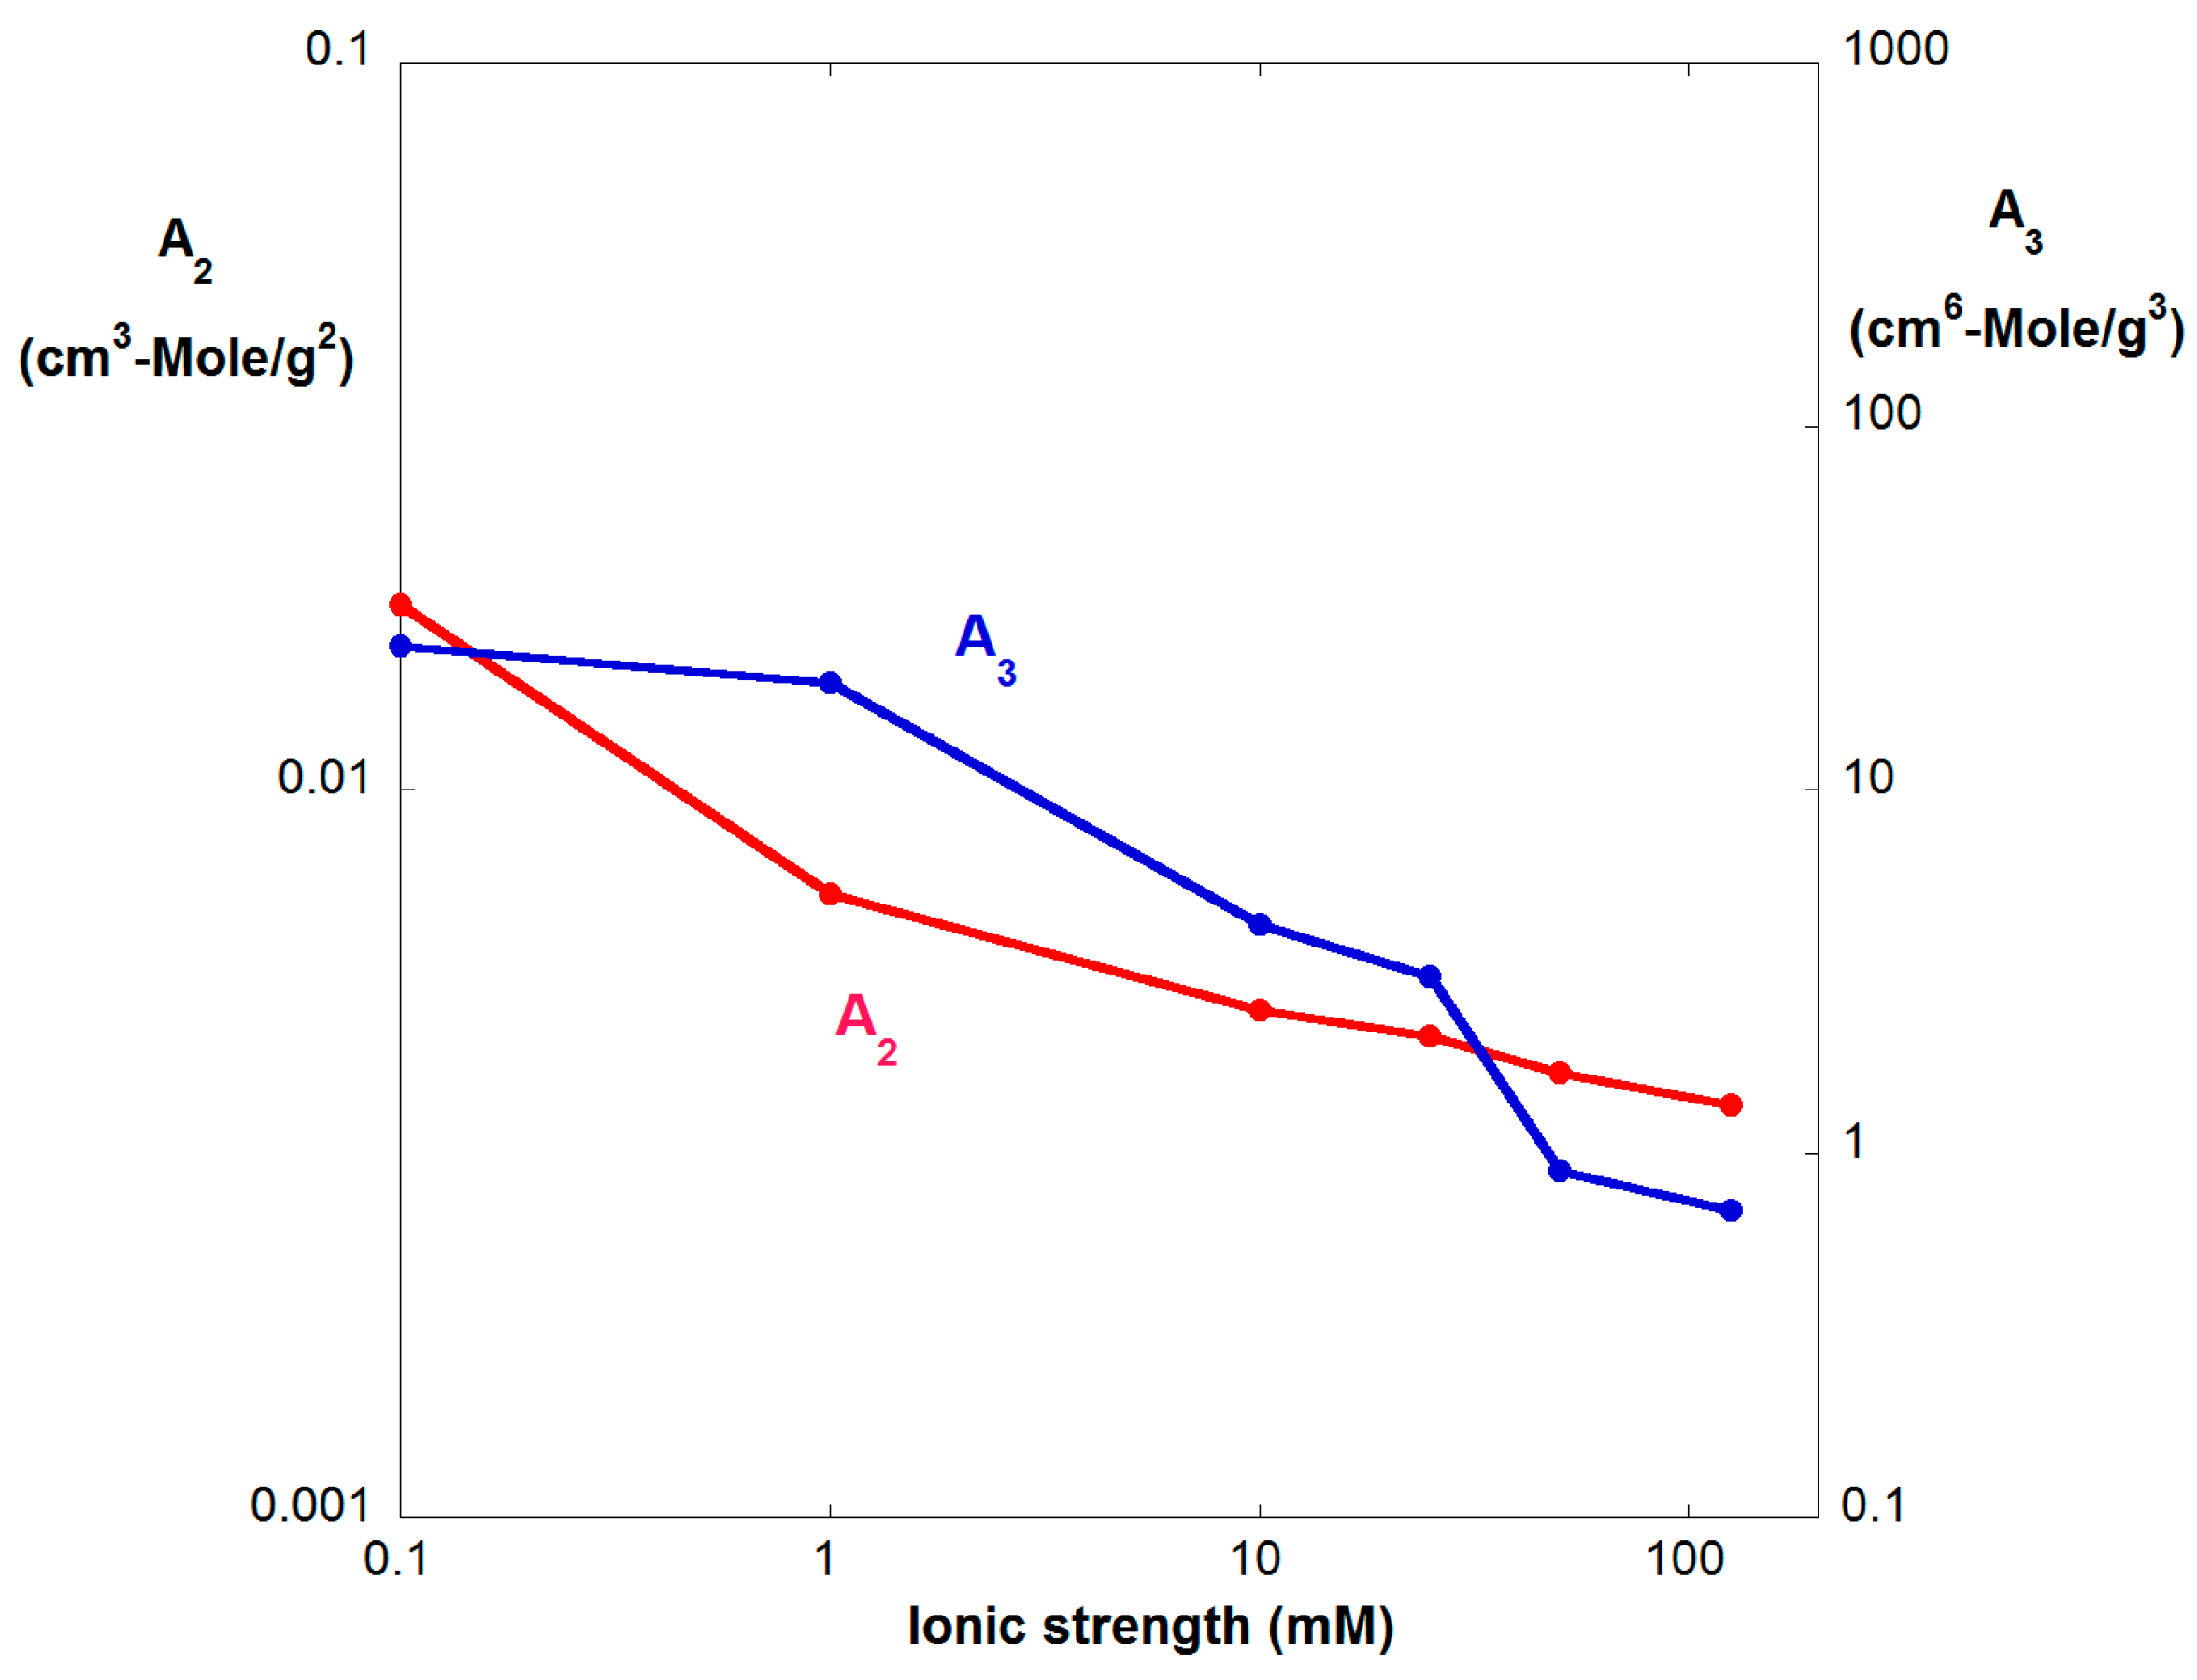
Figure 4.
The instantaneous comonomer compositions [Finst,SS] and [Finst,Am] (right hand axis) and effective Mw (left hand axis) for Reaction B.
Figure 4.
The instantaneous comonomer compositions [Finst,SS] and [Finst,Am] (right hand axis) and effective Mw (left hand axis) for Reaction B.

Figure 5.
IR(90) at various ionic strengths for reaction B.
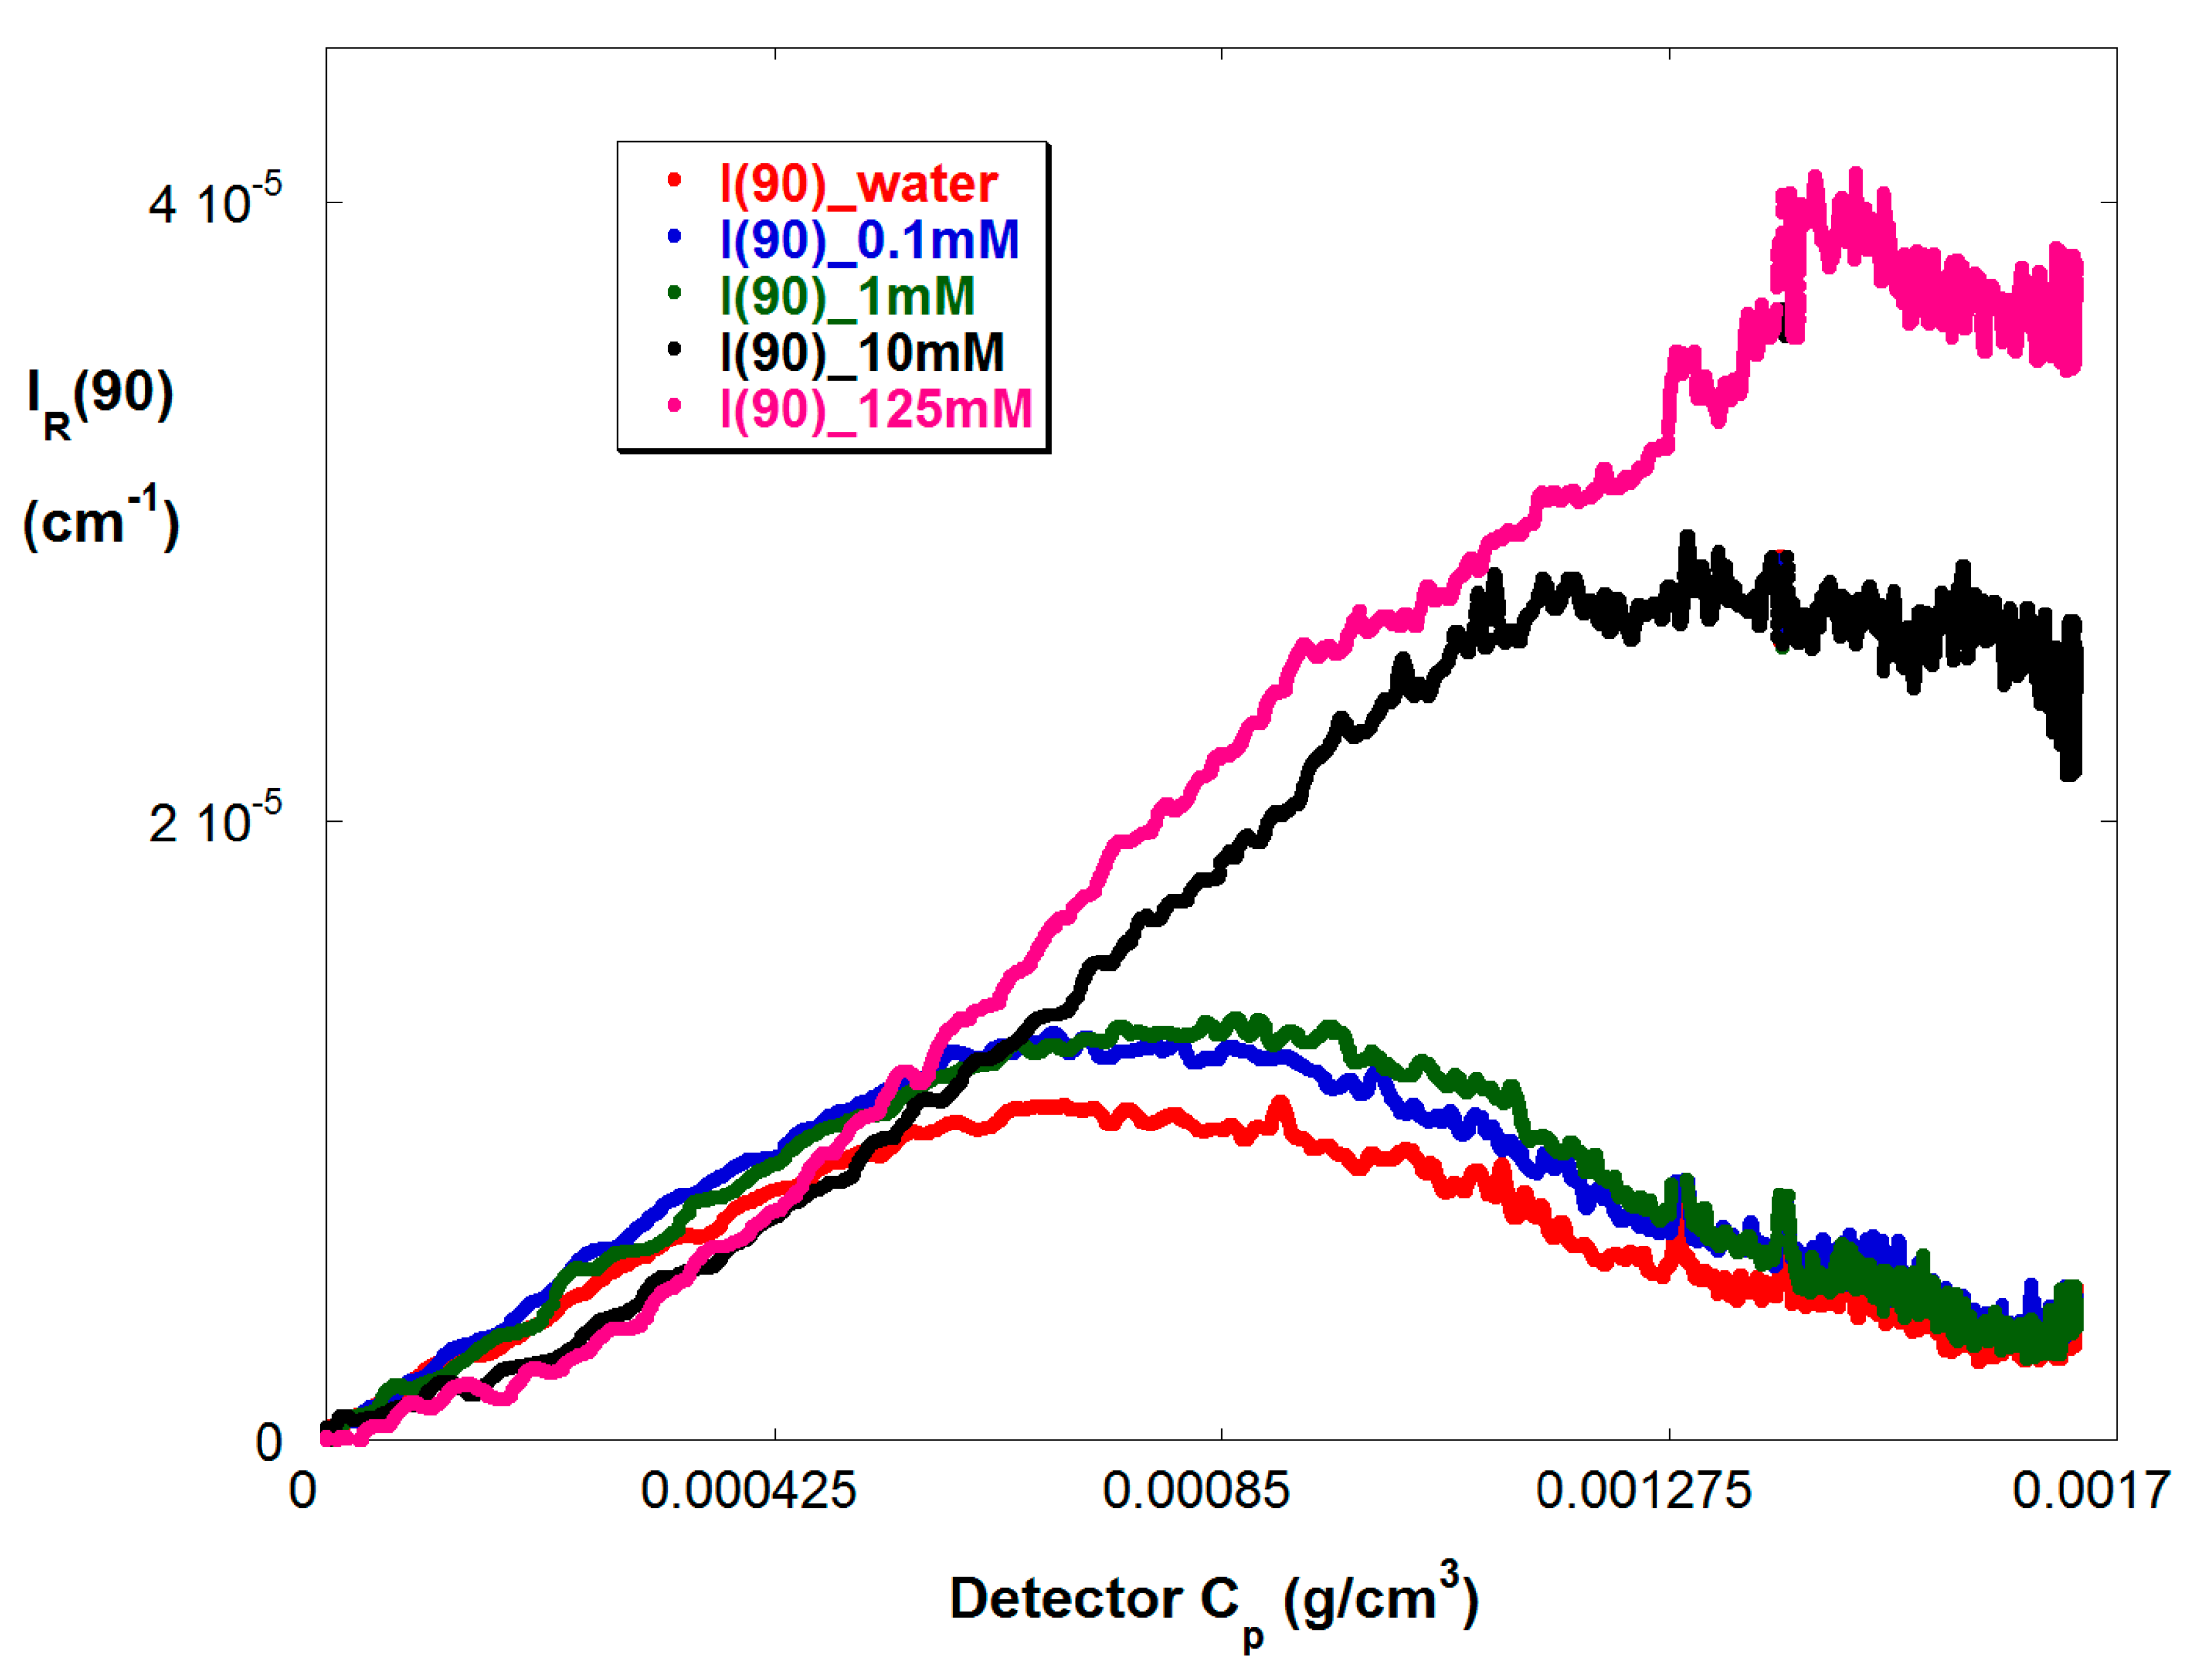
Figure 6.
ηr vs. Cp at the various IS for reaction B.
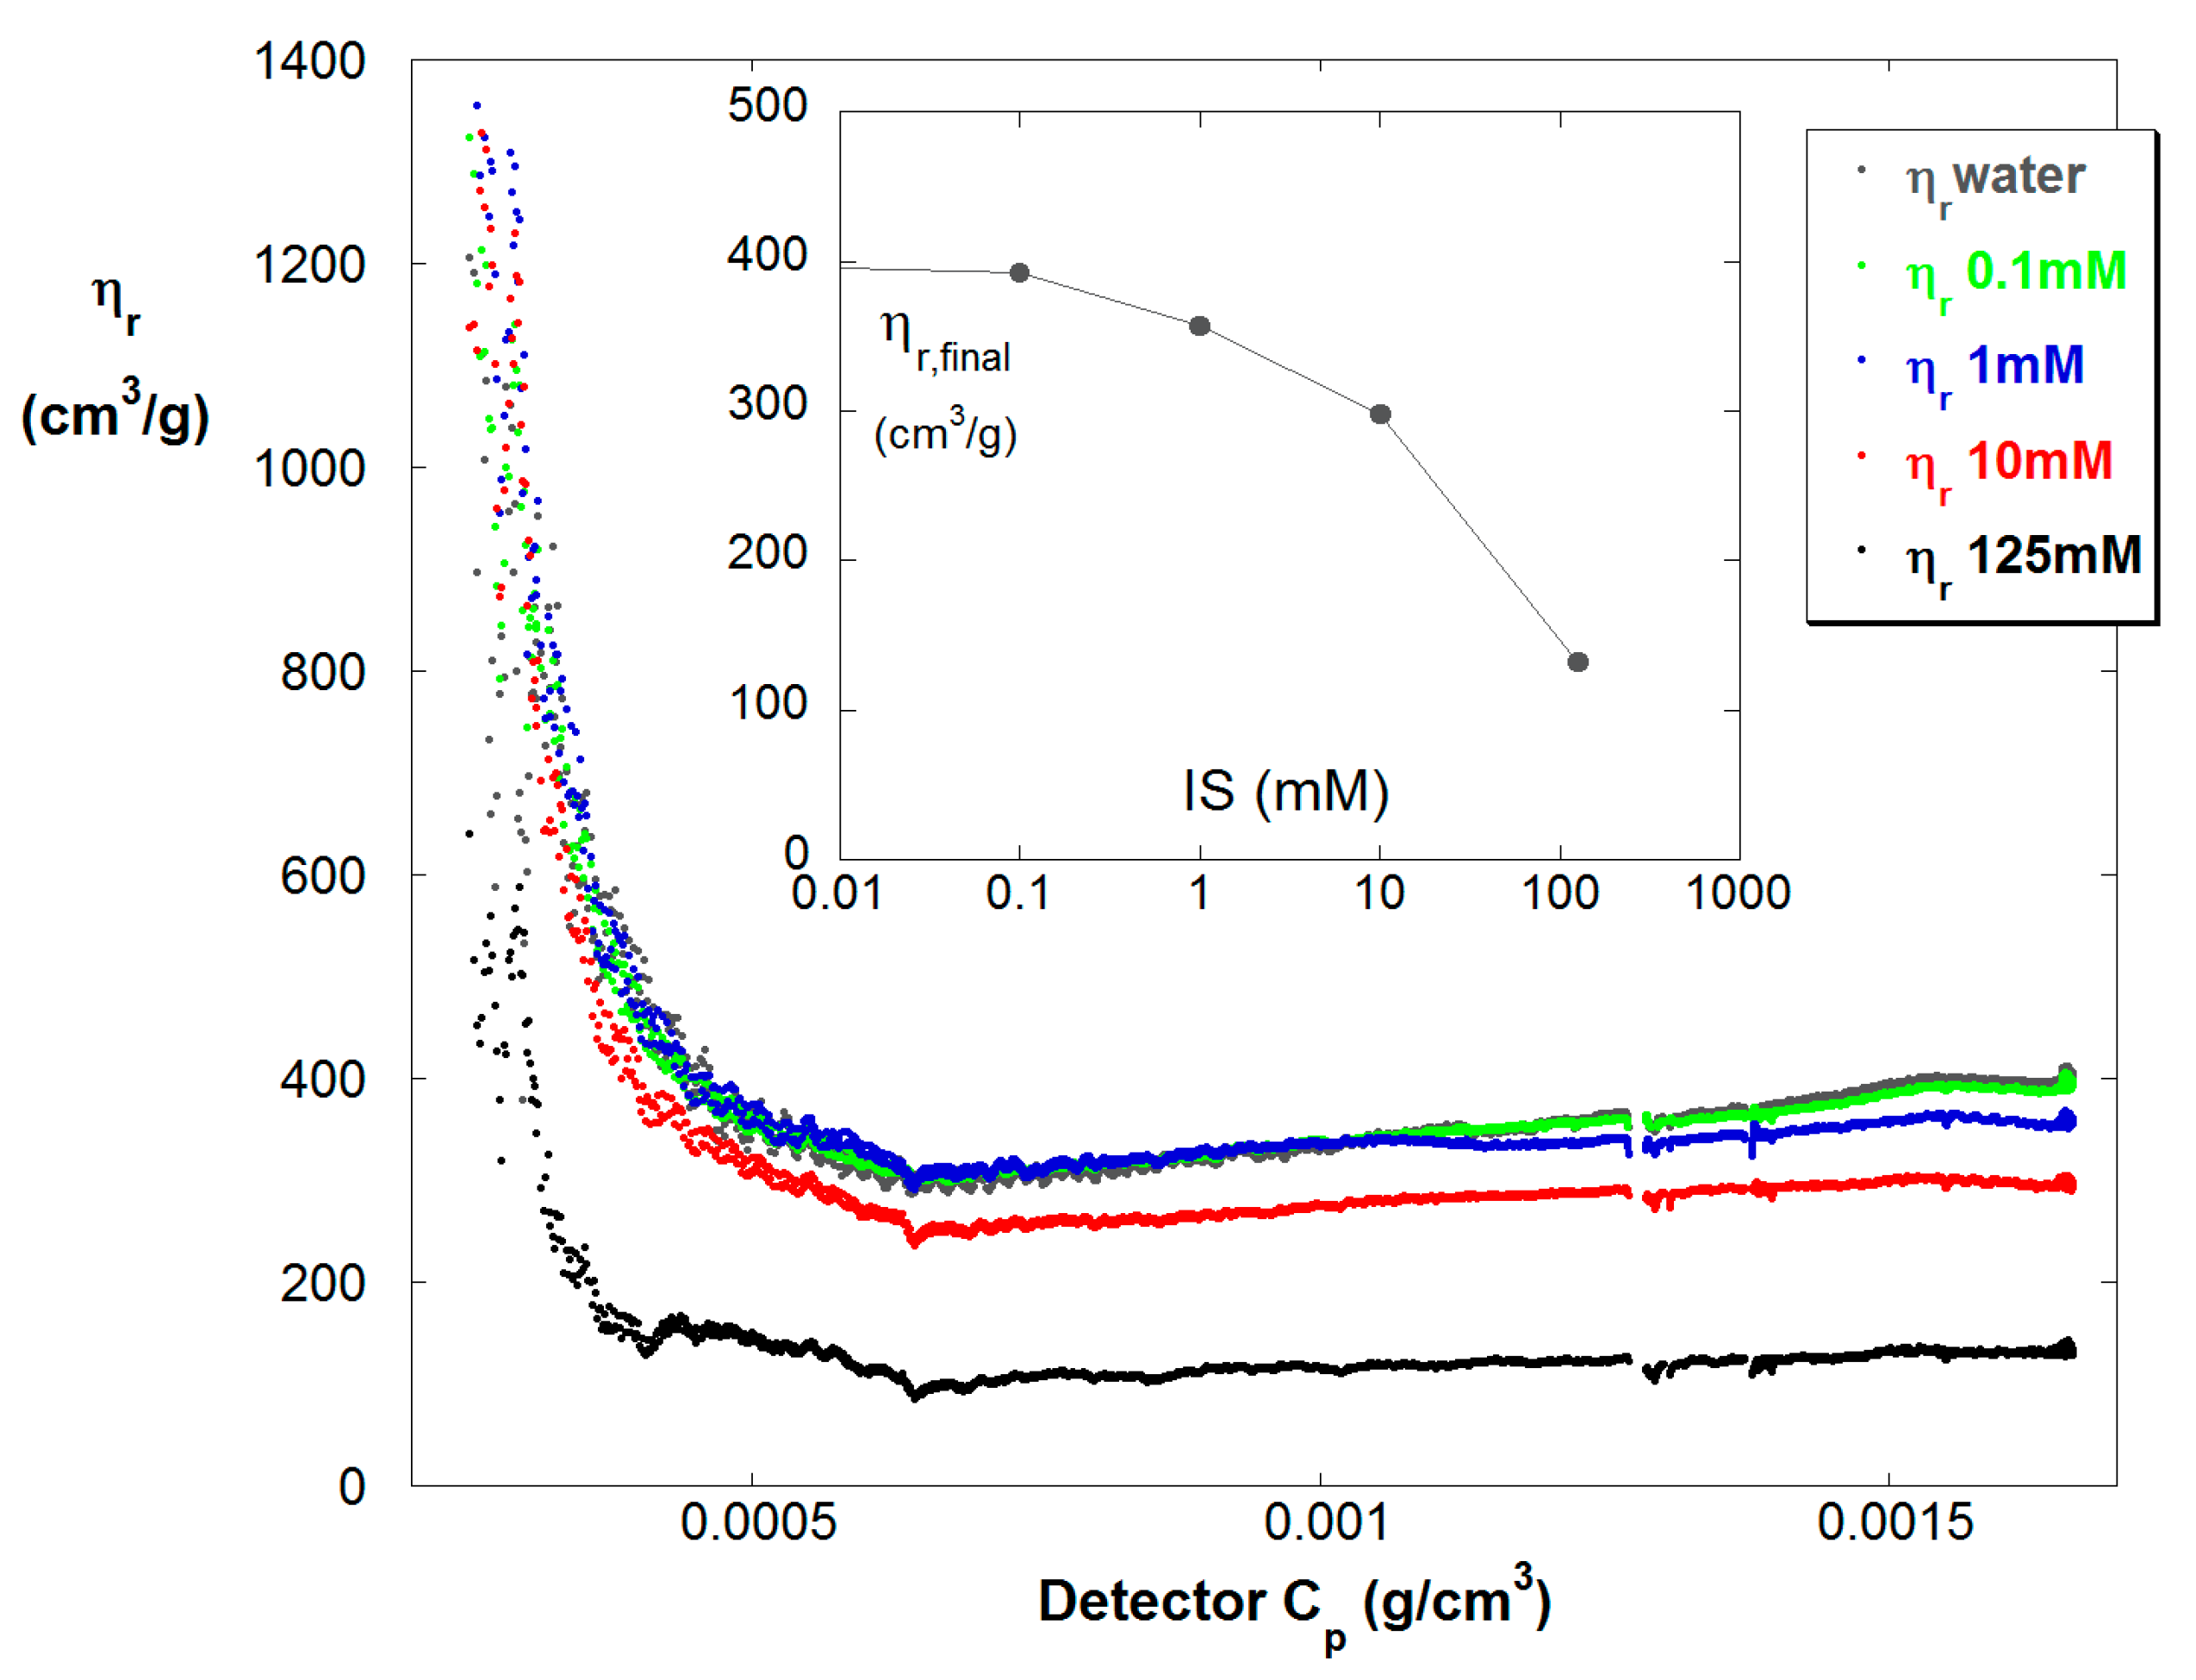
Figure 7.
(a) νsp vs. t for Reaction A, a batch reaction. The negative second derivative in time reflects the decreasing linear charge density (ξ) in the chains as the reaction proceeds. (b) The semi-batch Reaction C, has a positive second derivative in time, showing the effect of increasing ξ as the reaction proceeds. Both reactions ended with the same total polymer concentration.

Figure 8.
[Finst,SS] and [Fionst,Am] for the semi-batch reaction C. The trends are opposite those of batch reactions A and B.
Figure 8.
[Finst,SS] and [Fionst,Am] for the semi-batch reaction C. The trends are opposite those of batch reactions A and B.

Table 1.
The information for each of the three reactions.
| Reaction | Type | Am0 (g/cm3) | SSo (g/cm3) | Initiator (g/cm3) | Second Dilution | First Dilution | T (°C) | Figures |
|---|---|---|---|---|---|---|---|---|
| A | 50/50 batch | 12.9 × 10⁻³ | 37.5 × 10⁻³ | 2.73 × 10⁻³ | 50× | 10× | 65 | Figure 1a,b, Figure 2, Figure 3, Figure 7a |
| B | 50/50 batch | 10.3 × 10⁻³ | 32.5 × 10⁻³ | 5.00 × 10⁻⁴ | 105× | 15× | 60 | Figure 4a,b, Figure 5, Figure 6 |
| C | Semi-batch | 18.1 × 10⁻³ | 181 × 10−3 stock fed into reactor at 0.1 mL/min | 2.73 × 10⁻³ | 50× | 10× | 65 | Figure 7b |
Table 2.
The flow rates, dilution factors, and ionic strengths in the seven stage SGA detector train.
Table 2.
The flow rates, dilution factors, and ionic strengths in the seven stage SGA detector train.
| Reaction A | Reaction B | Reaction C (Semi-Batch) | |||||||
|---|---|---|---|---|---|---|---|---|---|
| Stage | [NaCl] * (mM) | IS (mM) | Dilution factor | [NaCl] * (mM) | IS (mM) | Dilution factor | [NaCl] * (mM) | IS (mM) | Dilution factor |
| 1 | 0 | 0 | 1 | 0 | 0 | 1 | 0 | 0 | 1 |
| 2 | 2 | 0.095 | 1.05 | 4 | 0.12 | 1.03125 | 2 | 0.095 | 1.05 |
| 3 | 20 | 1 | 1.10 | 40 | 1.3 | 1.0625 | 20 | 1 | 1.10 |
| 4 | 200 | 9.7 | 1.15 | 400 | 13 | 1.09375 | 200 | 9.7 | 1.15 |
| 5 | 1000 | 51 | 1.20 | 5000 | 151 | 1.125 | 1000 | 51 | 1.20 |
| 6 | 2000 | 129 | 1.25 | - | - | - | 2000 | 129 | 1.25 |
| 7 | 5000 | 316 | 1.30 | - | - | - | 5000 | 316 | 1.30 |
* Ionic strength (IS) of reservoir.
© 2017 by the authors. Licensee MDPI, Basel, Switzerland. This article is an open access article distributed under the terms and conditions of the Creative Commons Attribution (CC BY) license (http://creativecommons.org/licenses/by/4.0/).
Share and Cite
MDPI and ACS Style
Wu, A.; Zhu, Z.; Drenski, M.F.; Reed, W.F. Simultaneous Monitoring of the Effects of Multiple Ionic Strengths on Properties of Copolymeric Polyelectrolytes during Their Synthesis. Processes 2017, 5, 17. https://doi.org/10.3390/pr5020017
AMA Style
Wu A, Zhu Z, Drenski MF, Reed WF. Simultaneous Monitoring of the Effects of Multiple Ionic Strengths on Properties of Copolymeric Polyelectrolytes during Their Synthesis. Processes. 2017; 5(2):17. https://doi.org/10.3390/pr5020017
Chicago/Turabian StyleWu, Aide, Zifu Zhu, Michael F. Drenski, and Wayne F. Reed. 2017. "Simultaneous Monitoring of the Effects of Multiple Ionic Strengths on Properties of Copolymeric Polyelectrolytes during Their Synthesis" Processes 5, no. 2: 17. https://doi.org/10.3390/pr5020017
Note that from the first issue of 2016, this journal uses article numbers instead of page numbers. See further details here.