1. Introduction
The demand for natural derived products is still growing [
1,
2]. Among other purposes, they are used as food supplements, natural plant protection agents and pharmaceuticals. The field of phyto pharmaceuticals can roughly be divided into extract types and pure substances. Extract types are often applied for self-medication and to cure e.g., common colds or stomach trouble. The whole process usually consists of extraction, evaporation for solvent recycling, drying and formulation. No additional purification steps are needed or rather wanted and the whole complex extract is used. The pure substances instead are often highly effective active pharmaceutical ingredients that have to be prescribed and dosed by a physician. One example is the anti-cancer drug Paclitaxel
® which is produced by semi-synthesis from the precursor 10-deacetylbaccatin III, that is found in the needles of European yew (
Taxus baccata L.). Another substance is the anti-malaria agent artemisinin from annual mugwort (
Artemisia annua L.). These substances are extracted from the plant matrix and afterwards purified to pharma grade, typically by liquid-liquid extraction, chromatography, and a final crystallization [
3,
4,
5,
6]. They are commonly applied as a pure substance and the whole complexity of the crude plant extract is neither desired nor is it approved. In that case, the solid liquid extraction process should aim for maximized yield of the active substance. Extract purity is not that significant because of the downstream processing, which is needed anyway, and that has to be tailor-made for that specific product.
In this study, the systematic process design for extraction of artemisinin from mugwort is shown. A solvent-based percolation, as it is state of the art in industry, is assessed to the so called Pressurized Hot Water Extraction (PHWE). This specific method provides an alternative process design to avoid organic solvents. It is therefore well-suited for the extraction of natural products under kosher and halal constraints. Moreover, it showed high productivity for the extraction of an active pharmaceutical ingredient in a previous study [
7], has a wide range of applications [
8,
9], and commercial equipment is available [
10,
11].
Annual mugwort (
Artemisia annua L.) is an up to 2 m high annual plant, growing mainly in the moderate climatic zone. It belongs to the plant family of Asteraceae. The main active ingredient is artemisinin with a content ranging from 0.01 wt % to 1.5 wt % [
12]. Artemisinin shows a high efficacy against parasites of the species plasmodium that are responsible for malaria disease [
13,
14]. According to literature, artemisinin is located in the leaves and flowers but not in the stem and the roots of mugwort [
15]. Because artemisinin is toxic for the plant cells, it is located on the surface of the leaves in glandular trichomes. There, it serves as a natural protection against predators, fungi and other pathogens [
16].
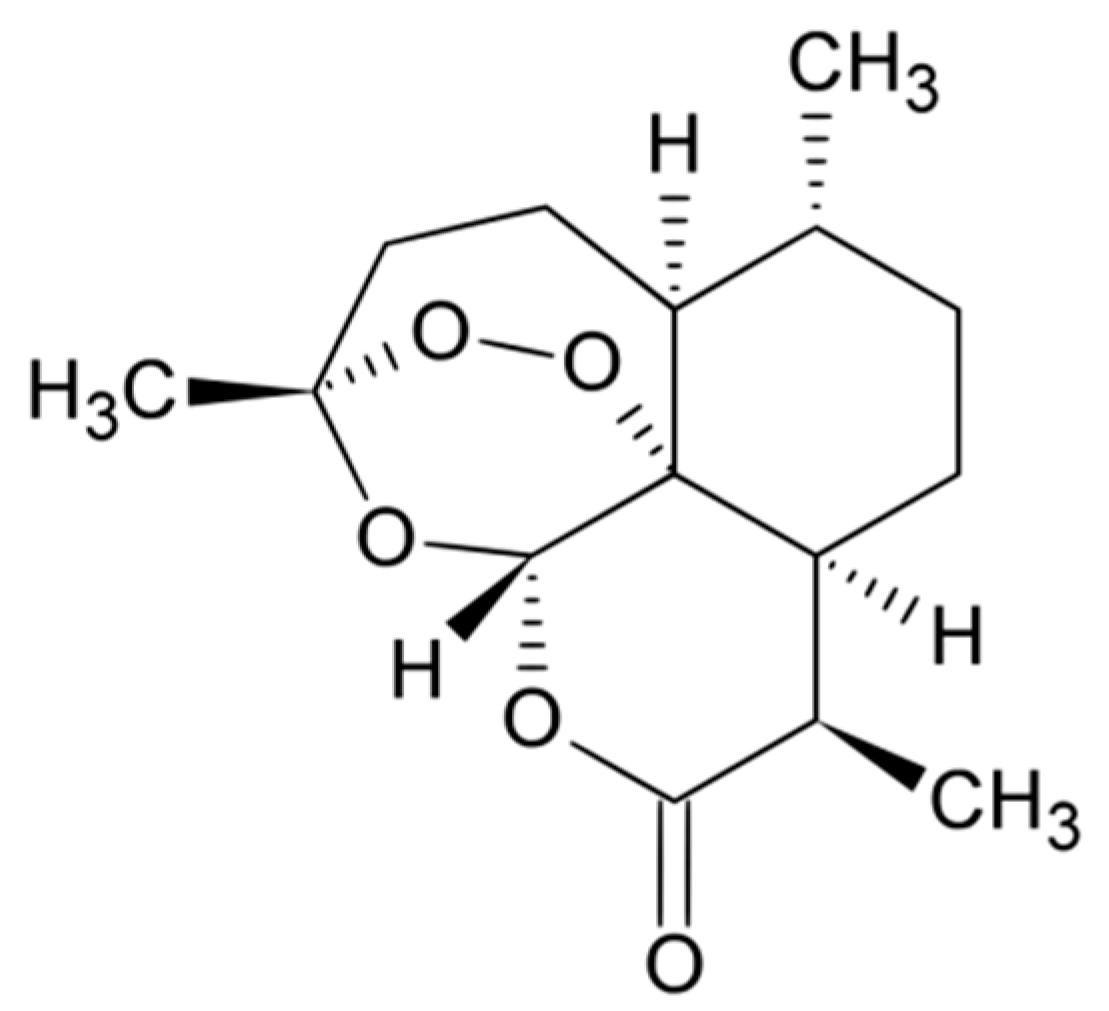
The sesquiterpene lactone artemisinin was first isolated by Tu Youyou, a Chinese scientist, who was awarded half of the 2015 Nobel Prize in Medicine for her discovery [
17]. The characteristic of the molecule, which is shown in
Figure 1, is the peroxide bridge which is believed to be responsible for the drug’s mechanism of action [
18].
There is a great variety of methods for the extraction of artemisinin from mugwort. In the following, a rough summary is given to illustrate the topic to the reader: In an already patented approach by Kumar et al., dry leaves are extracted with non-aqueous solvents such as ethanol, methanol, acetone, methylisobutyl, and hexane [
19]. Besides rather traditional techniques, artemisinin is an often chosen model system for new extraction processes and mass transport enhancing methods. Hao et al. describe the microwave-assisted extraction using different solvents such as ethanol, trichloromethane, and cyclohexane. The best results were obtained using
n-hexane, microwave radiation for 12 min and a solvent ratio of 11.3 (solvent/plant material). Moreover, they observed the best results when the plant material is ground to less than 0.125 mm. They compared their results to extraction using supercritical carbon dioxide, Soxhlet method, and maceration and concluded that their method gives the highest extraction rates [
20]. Briars et al. investigated the ultrasound-assisted extraction. They compared maceration and ultrasound-assisted maceration at three different temperature levels (25 °C, 35 °C, and 45 °C). They showed that the highest selectivity towards artemisinin is reached with US-assisted extraction using hexane at 25 °C thus saving energy costs [
21]. Another approach is demonstrated by Quispe-Condori et al. [
22], and Kohler et al. [
23]. Both groups extracted artemisinin successfully with supercritical carbon dioxide. Kohler et al. observed that the extraction can be optimized by applying flow rates of 2 mL/min for 20 min. The fluid consisted of carbon dioxide and 3% of methanol at 50 °C and 150 bar. By analyzing the shape of the extraction curves, they concluded, that the extraction is not limited by diffusion but by the elution process [
23]. Quispe-Condori et al. performed a complete factorial design to optimize the extraction. Their two best yields were obtained using pure carbon dioxide at 30 °C and 150 bar, and 50 °C and 300 bar. They compared their data with the extraction models by Sovová [
24] and Martinez [
25] and found a good agreement [
22]. Lapkin et al. did an explanatory summary of different methods and solvents for extracting artemisinin, such as ionic liquids or the hydrofluorocarbon HFC-134a. They showed that using HFC-134a or ionic liquids leads to a higher extraction efficiency compared to conventional solvents such as hexane. They also indicated that for the HFC-134a solvent an extraction equipment is already commercially available [
26]. Christen et al. reported the pressurized solvent extraction or accelerated solvent extraction. 100 mg of mugwort powder were extracted with ethanol and water in a temperature range from 25 °C to 100 °C under reflux. They observed increasing yield at elevated temperature and concluded that there must be a limitation due to solubility at room temperature [
12].
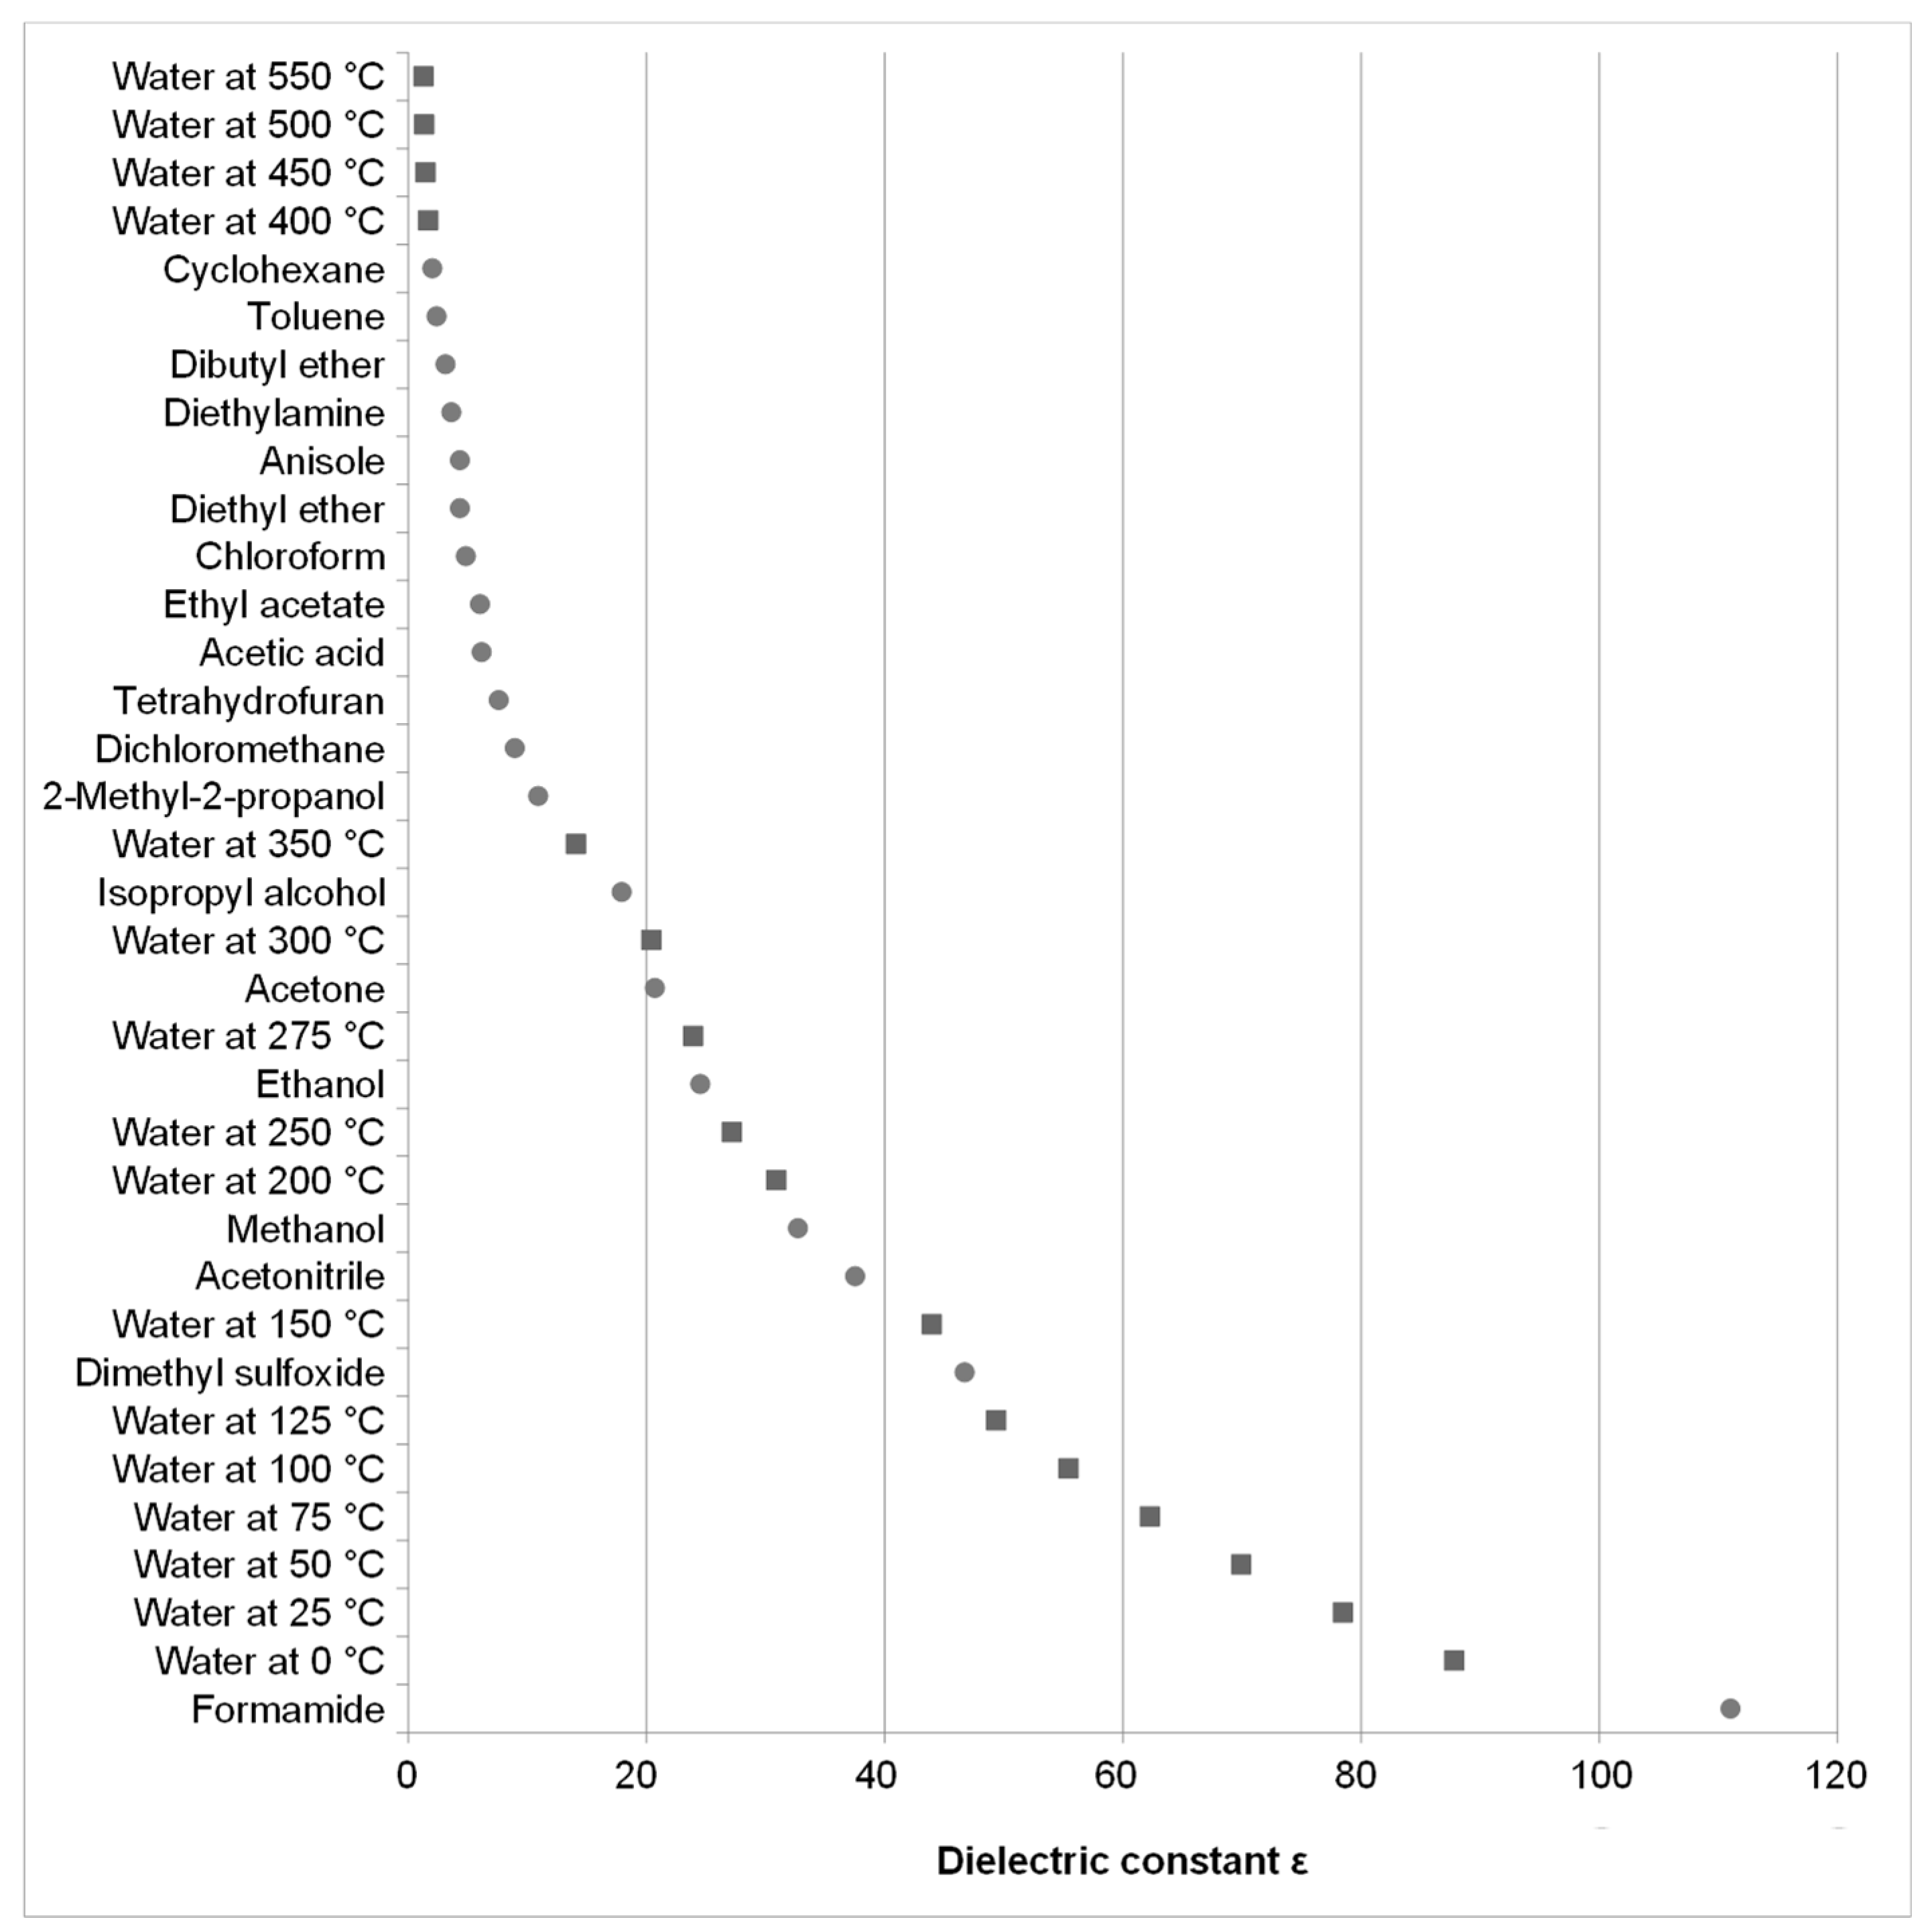
In this study, conventional percolation and the so called Pressurized Hot Water Extraction (PHWE) are investigated. In both methods, fresh solvent is pumped through a column filled with plant material. By that, a concentration gradient is maintained between the solvent and the plant material, therefore a complete leaching is possible. In PHWE, the enhanced solubility of active pharmaceutical ingredients relies on the changing polarity of water with rising temperature. This is expressed by the dielectric constant ε. Under ambient conditions ε of water has a value of roughly 80, decreasing to 34.8 at 200 °C, thus being close to the value of methanol (32.7) at ambient conditions [
8,
27]. The corresponding dielectric constant of various organic solvents under normal conditions and the data for water are given in
Figure 2.
The dielectric constant of water can be calculated by Equation (1) [
28].
, , A = +7.62571, B = +244.003, C = −140.569, D = +27.7841, E = −96.2805, F = +41.7907, G = −10.2099, H = −45.2059, I = +84.6395, K = −35.8644.
Besides the dielectric constant, some other parameters are affected by temperature increase. For example the pH, which is 7 at normal conditions, changes to a value of 5.5 at 250 °C. Some other highly temperature-sensitive parameters are the surface tension, self-diffusivity and viscosity [
8].
3. Process Modeling
For a competitive process design for plant based substances, maximum extraction yield is desirable. Thus, the most important extraction technique to achieve this aim is percolation. For process design and optimization, modeling and simulation was proven to be a beneficial approach [
1,
3,
4,
7,
29,
31]. Commonly, the extraction in percolation mode is described with various sub models which will be described in the following in detail.
The macroscopic mass transport in the bulk phase (solvent) is described by the so called distributed plug flow (DPF) model.
The model parameters are printed in bold and the model parameter determination pathway is depicted in the following:
The
axial dispersion coefficient Dax can be derived by deconvolution of tracer signals. An alternative method is applying correlations using the Péclet (Pe) and the Reynolds (Re) number. Both ways are good engineering practice e.g., in chromatography [
32,
33,
34].
The Reynolds number expresses the ratio of the specific inertia and viscous forces. The formula symbols are: u
z empty column velocity, d
P mean particle diameter, ρ
L solvent density, η solvent viscosity and ε void fraction.
For the calculation of the Reynolds number the empty column velocity and the void fraction of the packed bed must be known. The empty column velocity is derived from the mass balance:
is the volumetric flux, d
c the column diameter and L
c the column length.
The void fraction can be measured with tracer experiments as well where the retention time of the non-binding tracer is t
0.
With that data and the Péclet number D
ax can be calculated.
The
specific surface area in case of spherical particles can be derived as:
The
mass transfer coefficient through the laminar boundary layer surrounding the particle is calculated with correlations using the Sherwood (Sh) and Schmitt (Sc) number. The binary diffusion coefficient D
12 has to be derived from measurements.
To take thermal degradation during extraction with hot solvents into account, the DPF-model is extended with a degradation kinetics (Equation (12)). The order and the rate constant of the reaction can be measured by recycling the extract continuously while taking samples in appropriate time intervals.
In the porous matrix of the plant material Equation (13) is derived from Fick’s second law of diffusion. The effective diffusion coefficient must be determined by extraction experiments. The total loading of the plant material q with the specific target or side components can be measured by exhaustive percolation.
The relation of target and side components located in the porous structure of the plant material q and dissolved in the extraction agent c is rated by equilibrium curves such as Langmuir (14). For the parameter determination a multi-stage maceration is performed.
In recycling mode, Equation (15) is the mass balance for the storage vessel. V is the vessel’s volume,
the flux,
the concentration at the extraction column outlet and c
V the concentration of the target component inside the vessel itself.
The equation is needed, because in recycling mode the concentration c
L of the target component in the fluid entering the extraction column is not zero as is the case in the normal extraction mode. For batch extraction, Equation (15) is not taken into account because fresh solvent is applied [
7].
4. Results and Discussion
Extraction from Artemisia annua L. is the first step to gain pure artemisinin on an industrial scale. In order to satisfy the demand, an optimized process is needed. Moreover, an extraction process without the use of organic solvents might be of interest. In this study, water is investigated as a substitute for common organic solvents. Furthermore, the aim of this study is to demonstrate how a model-based approach for the process design of solid–liquid extraction is performed and to highlight the benefits.
4.1. Model-Based Optimization of the Conventional Solid–Liquid Extraction
For the model-based process optimization of the solid–liquid extraction, model parameters such as the equilibrium or the overall amount of artemisinin have to be determined. The equilibrium is specific for each solvent, thus one has to perform a solvent selection prior to the parameter determination.
4.1.1. Solvent Selection
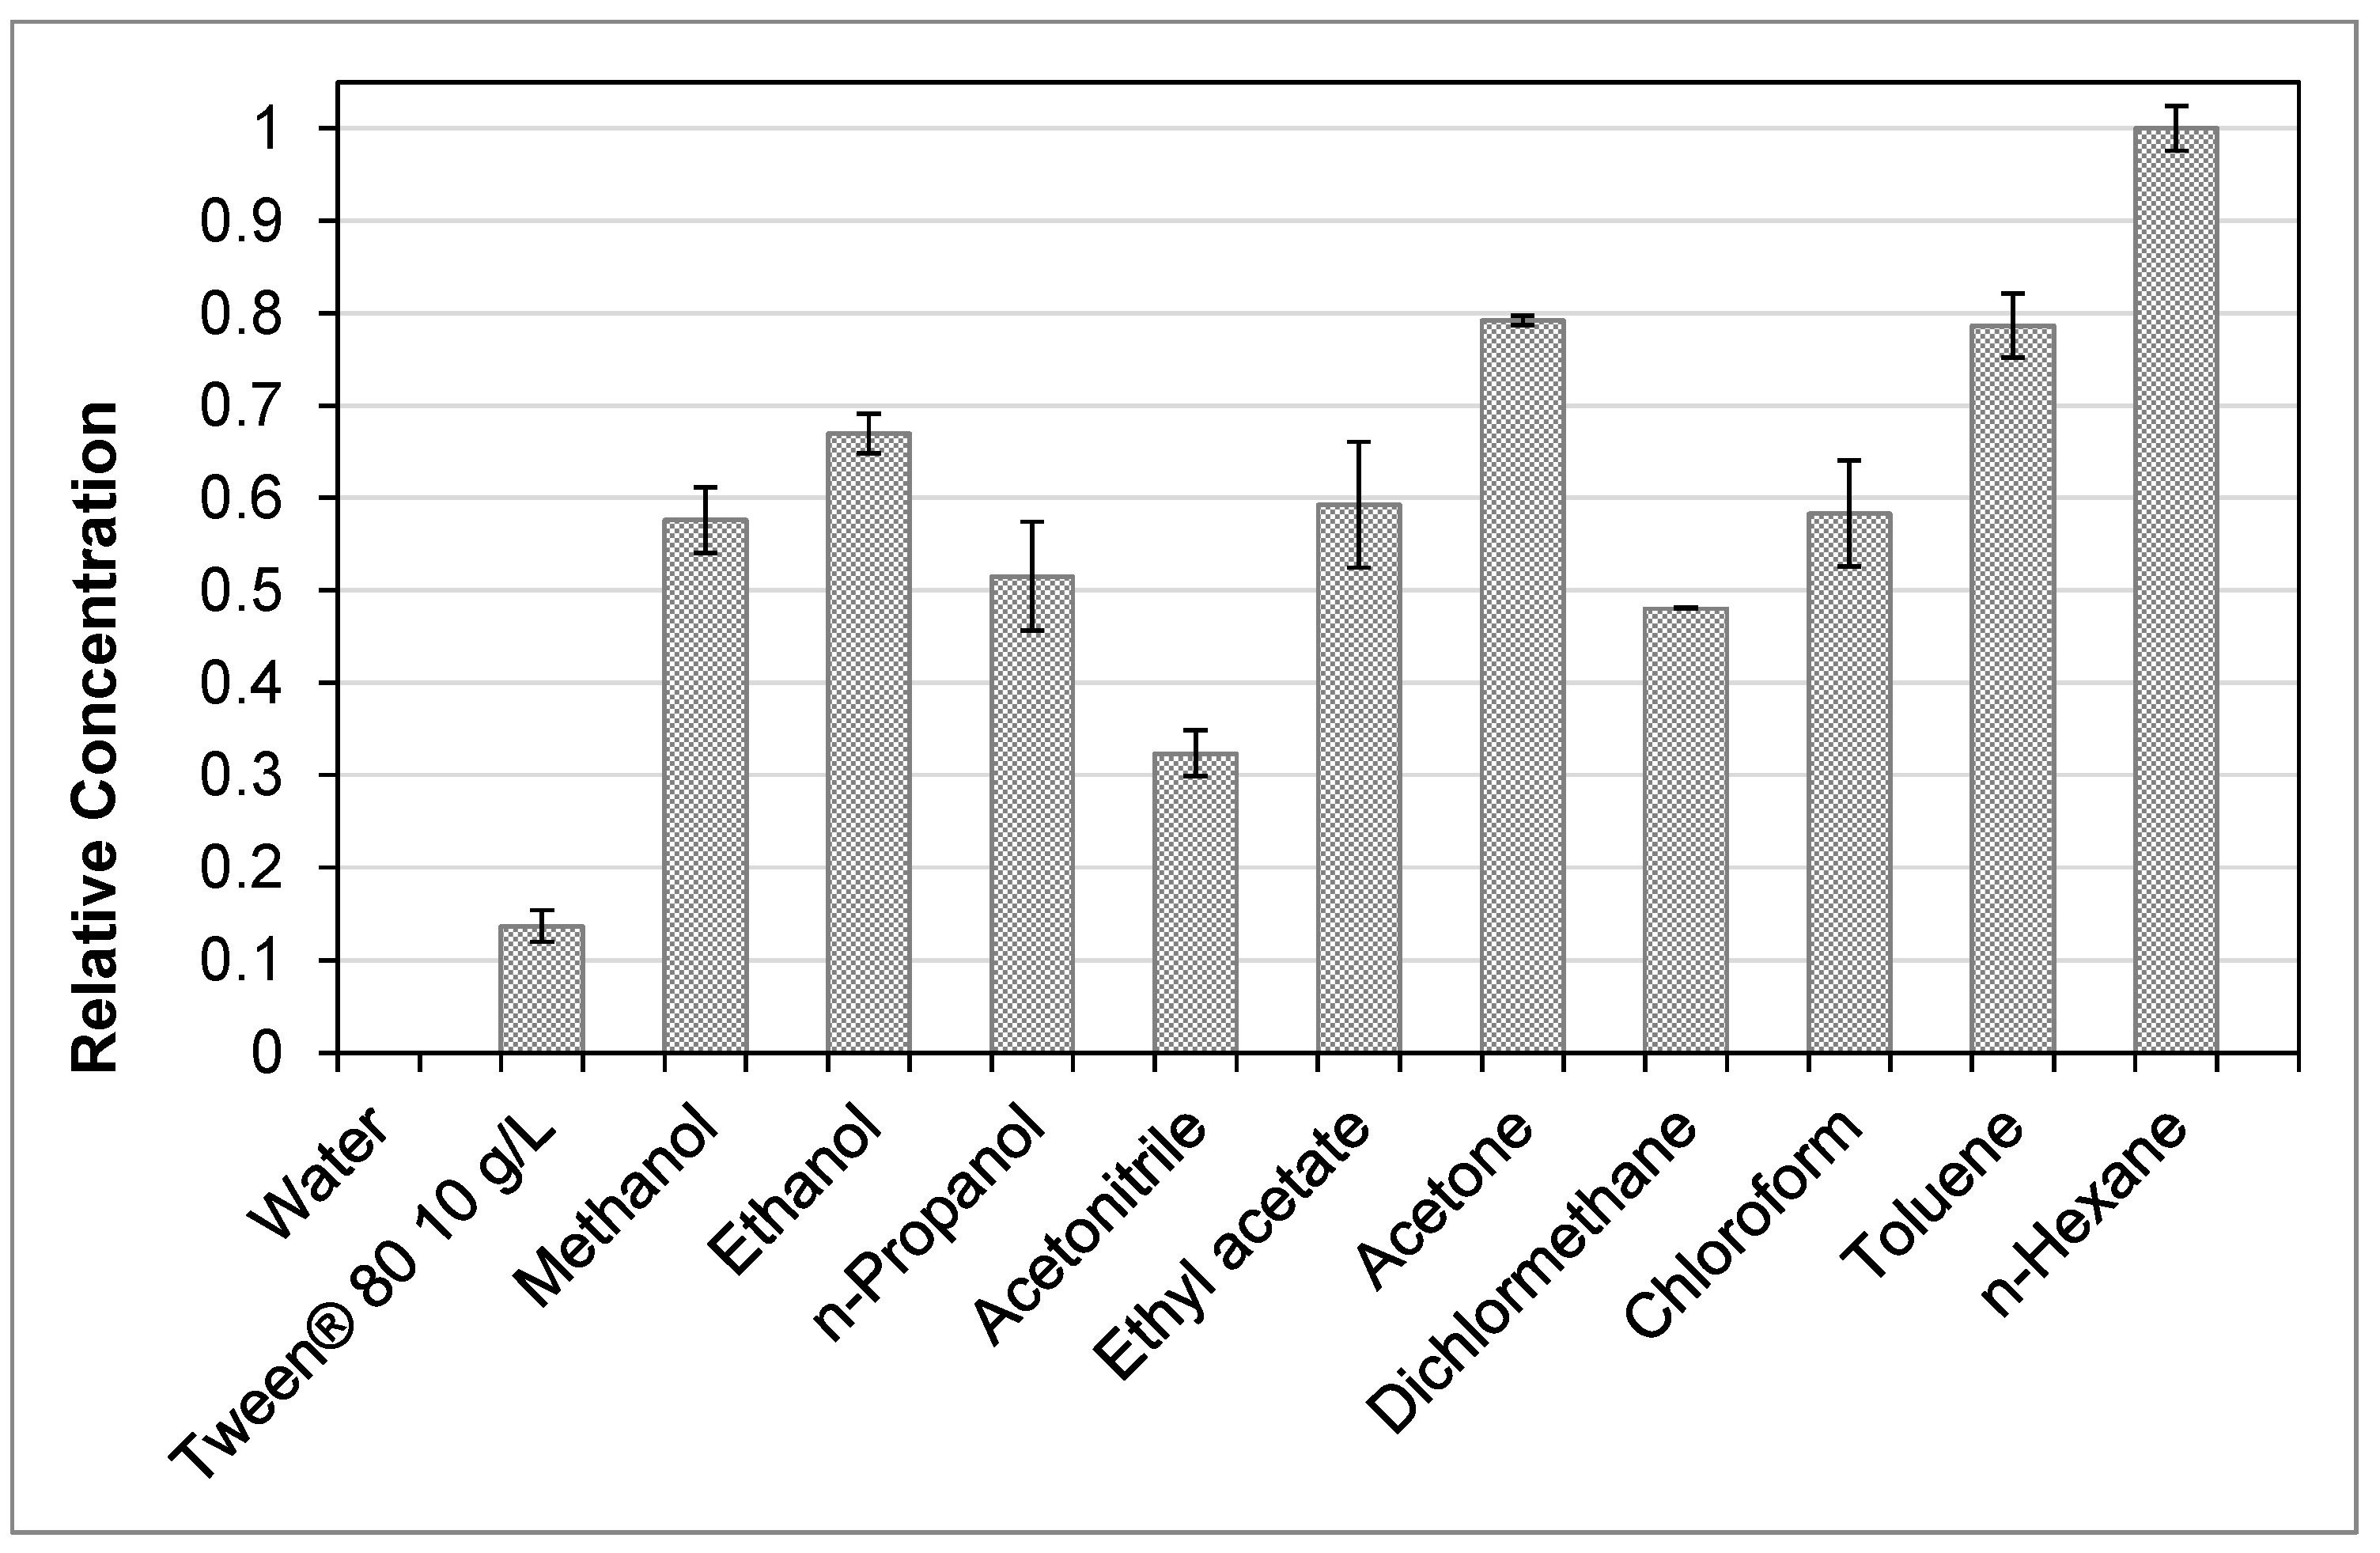
For an ideal process design the solvent choice is crucial. A well-chosen solvent should have a high capacity for the target molecule besides being cost effective, non-toxic and technically manageable. To find a suitable solvent, a screening was performed under ambient temperature. The results are presented in
Figure 5. Practically, no artemisinin was extracted in pure water under normal conditions. By adding 10 g/L of the surfactant Tween
® 80 (Merck
®, Darmstadt, Germany) a yield of approximately 12% compared to
n-hexane as best solvent is reached. Therefore, water with Tween
® 80 can be used for extraction, but wouldn’t be economically feasible due to additional costs and a high solvent viscosity. For the percolation in this study acetone is chosen as solvent. The capacity is about 80% compared to
n-hexane but it is less toxic [
35], according to the FDA’s Guidance for Industry and the boiling point is about 10 °C lower.
It is interesting, that the solvent screening follows no systematic rule: acetone and toluene have nearly the same capacity for artemisinin but acetone is a significantly more polar solvent than toluene. In the field of the polar-protic alcohols, the solubility of artemisinin rises from methanol to ethanol, which might be traced to the lengthened aliphatic carbon chain. The solubility declines again when propanol is used. Apparently, the elongated carbon chain has a negative effect at that size.
4.1.2. Overall Amount and Equilibrium
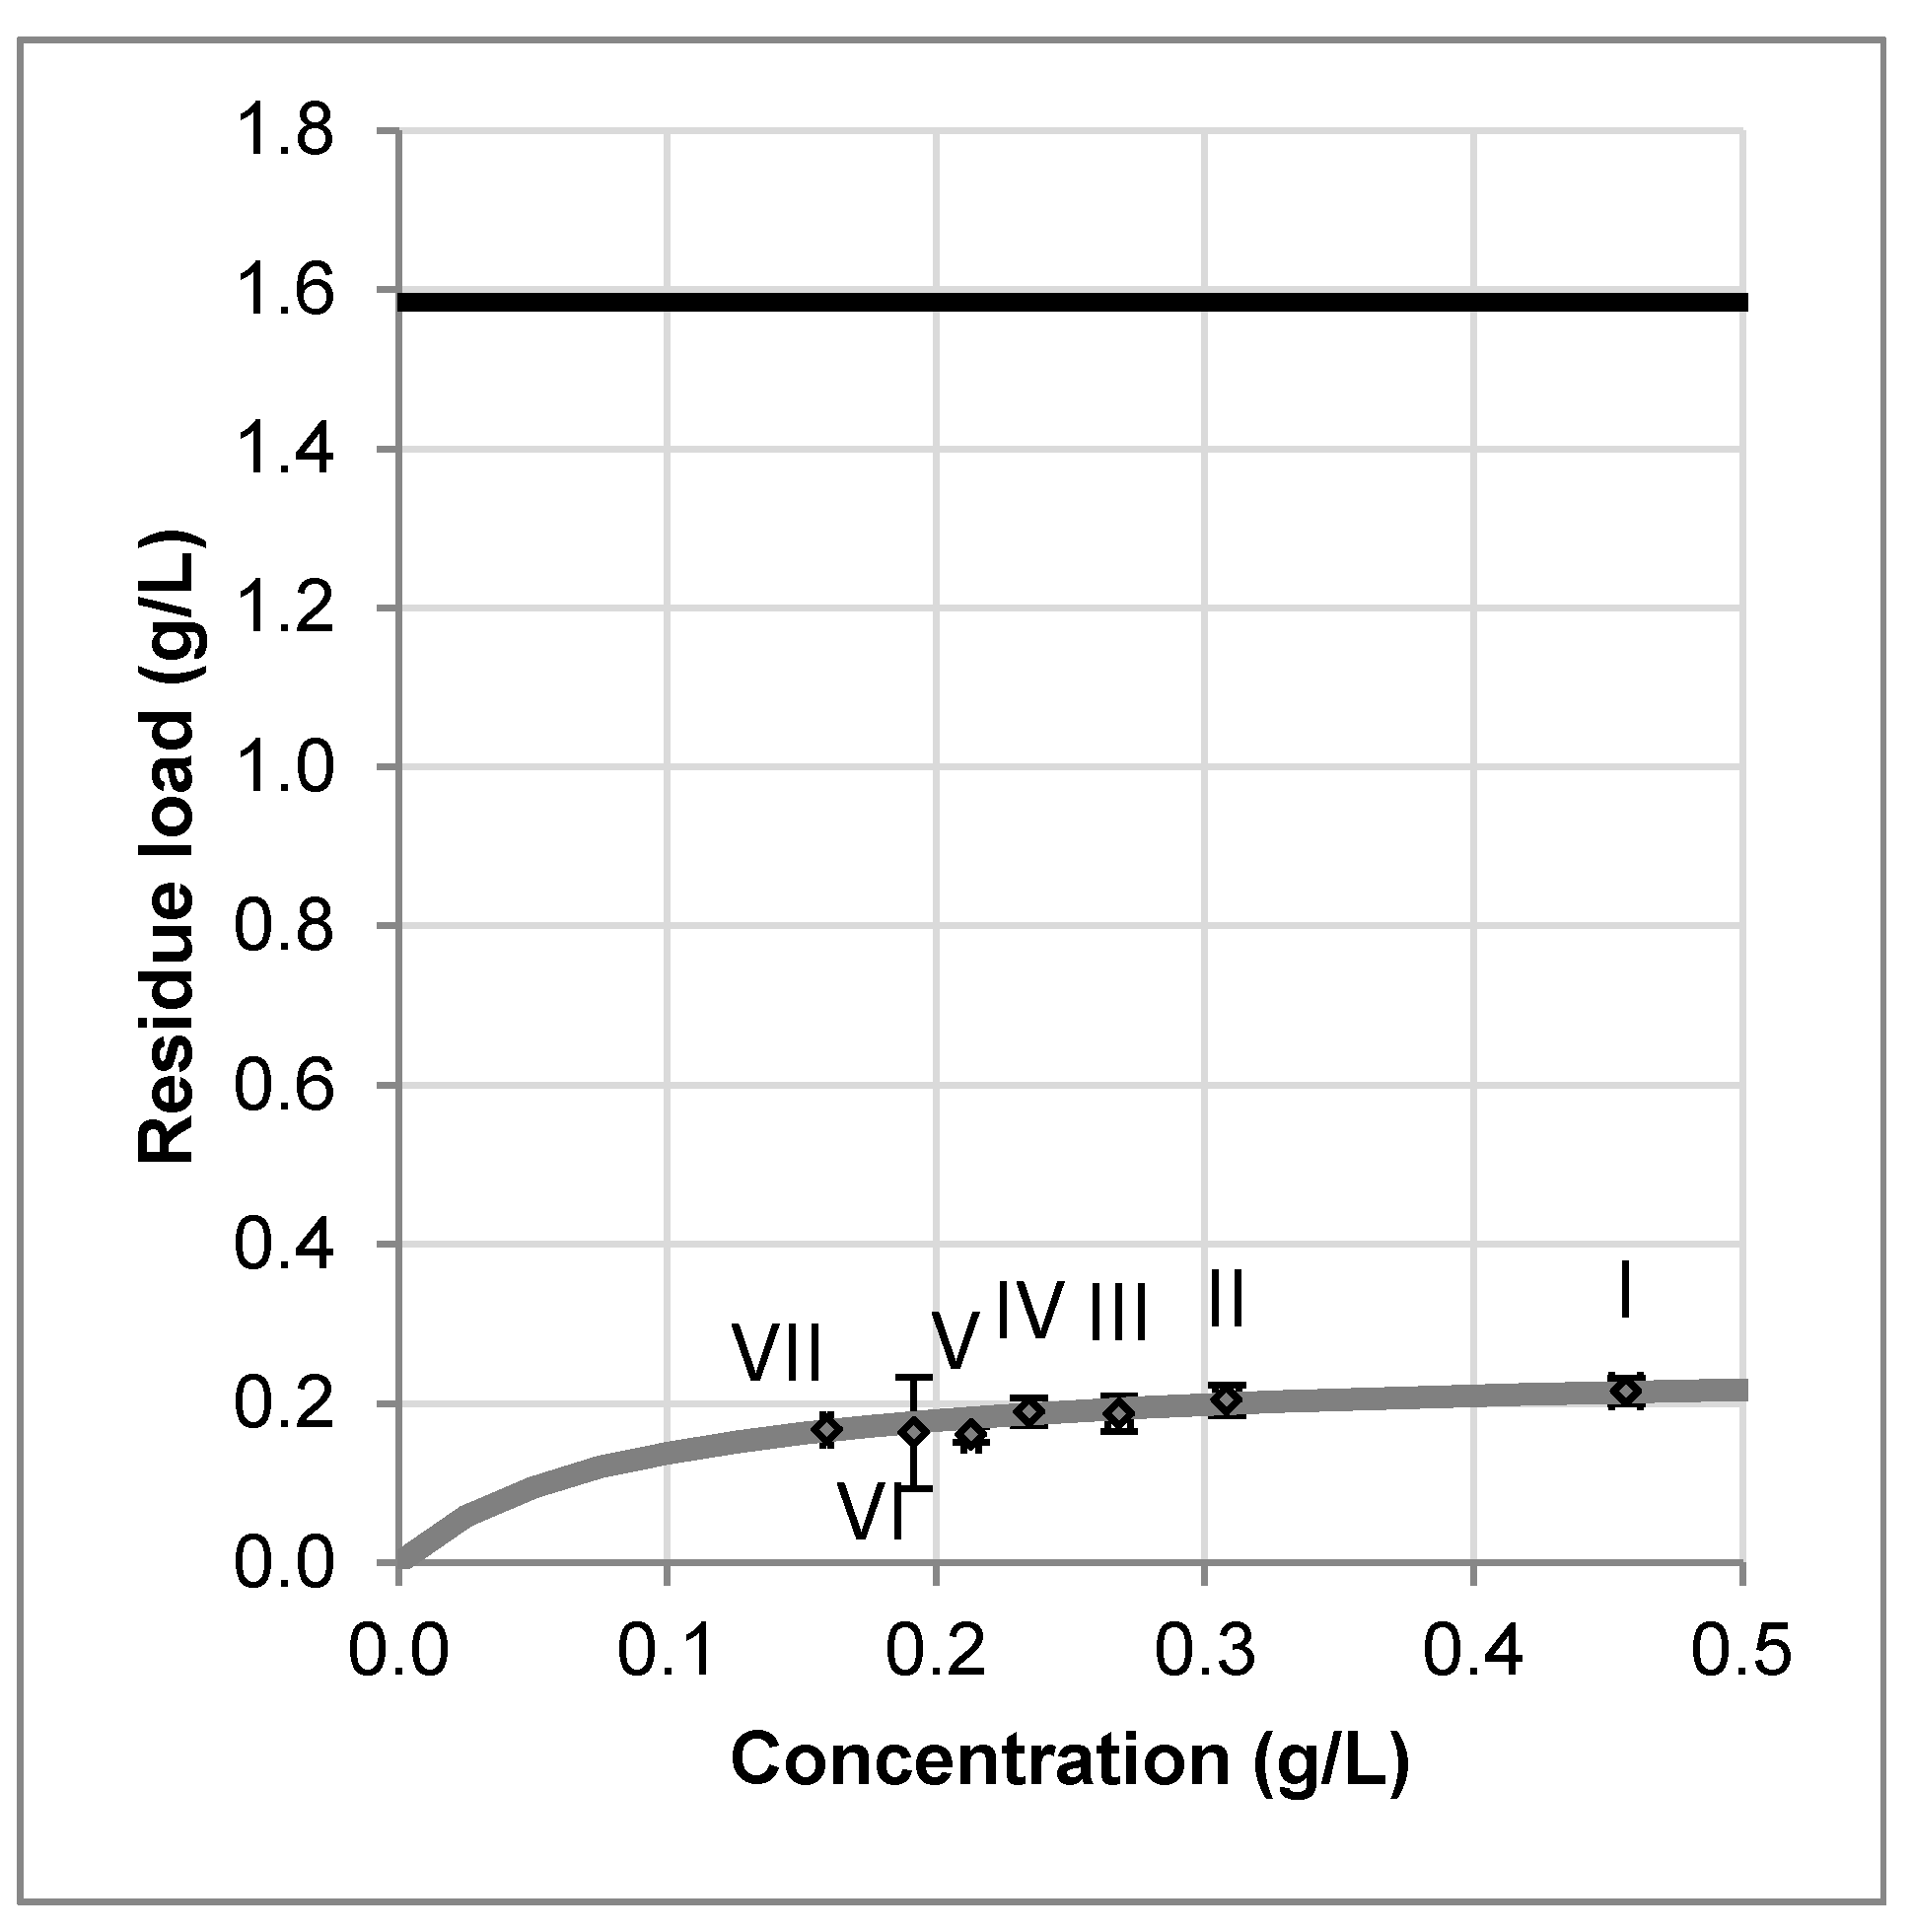
The overall amount of artemisinin in the plant material was measured by exhaustive percolation with acetone. It is 0.395 wt % ± 0.014 wt % related to dry mass. In the literature, values between 0.01 wt %–1.4 wt % are reported [
12]. The equilibrium relation of artemisinin between the solid and the liquid phase is measured by multistep maceration experiments. The results are shown in
Figure 6. The black line represents the overall amount.
Obviously, even few maceration steps lead to a high degree of leaching. The flat curve of the equilibrium line confirms acetone as suitable solvent. Otherwise, a low fluid concentration but a high residual loading of the plant material would have been observed. Because artemisinin is a product with high added value, a complete leaching is desirable. Therefore, percolation is chosen for this study [
3,
4,
6,
29].
4.2. Model-Based Optimization of the Pressurized Hot Water Extraction
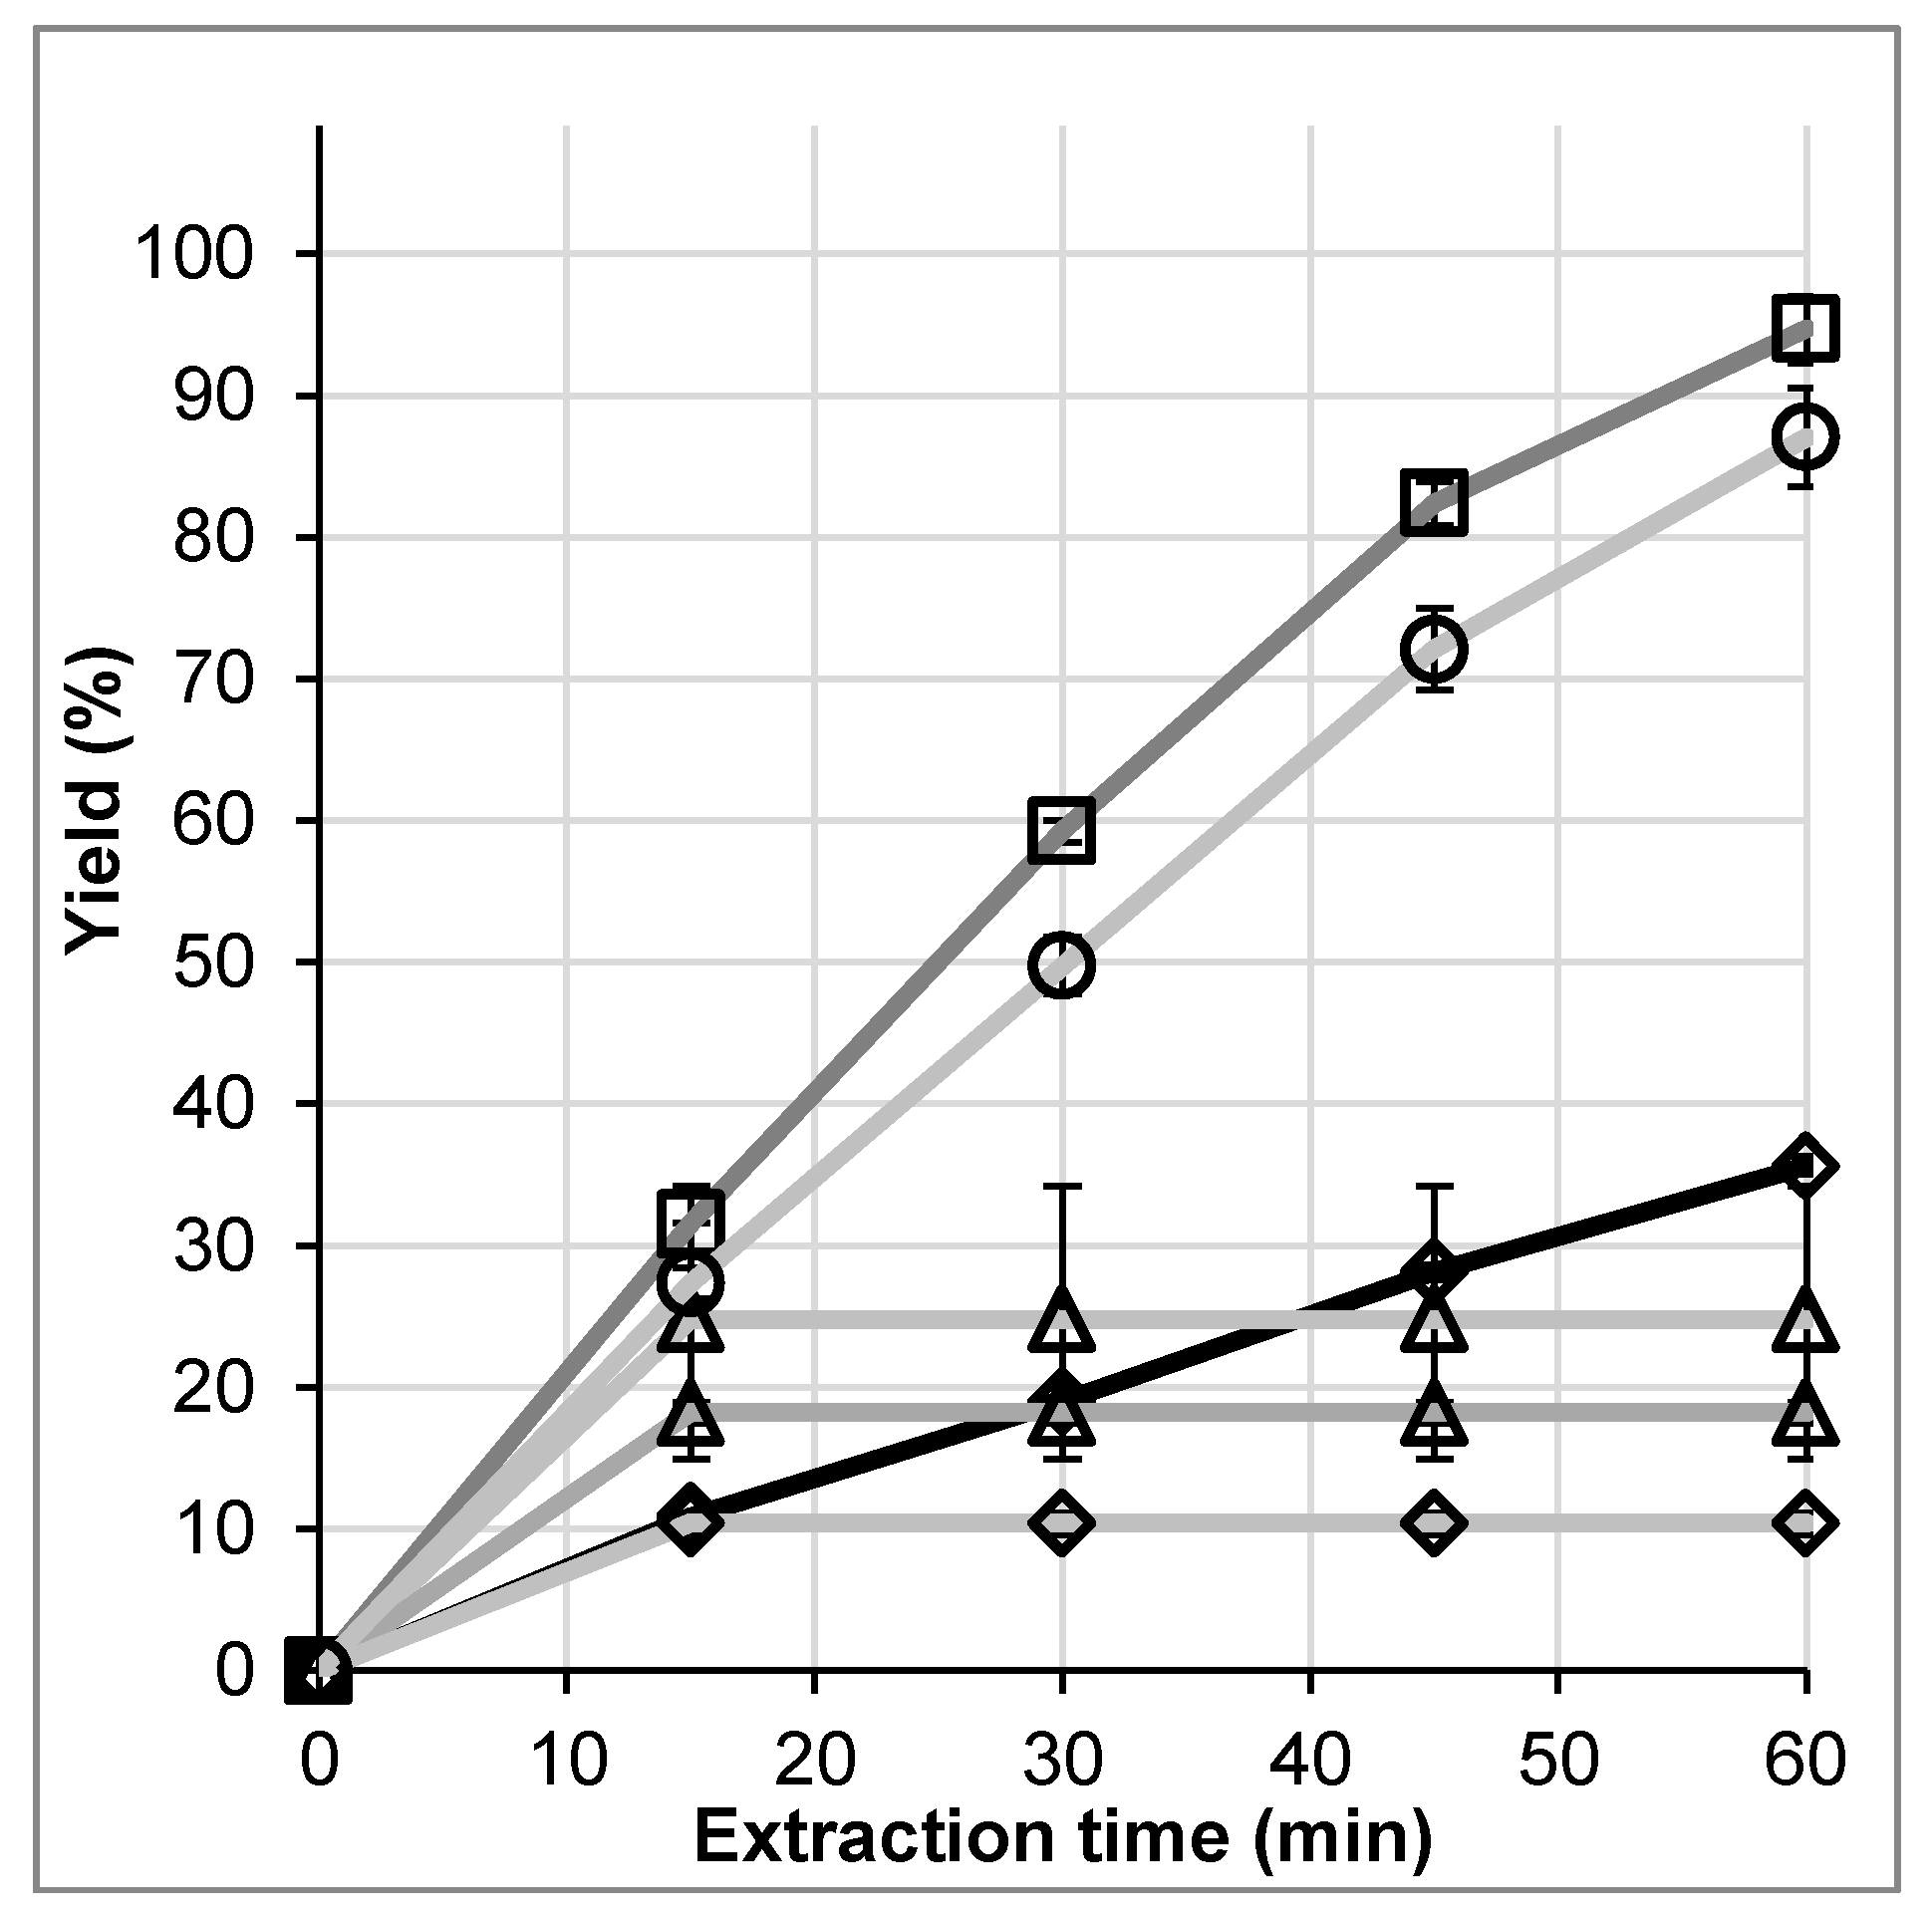
The first step in the process design for Pressurized Hot Water Extraction is to determine a suitable extraction temperature. According to the literature, artemisinin shows a relatively low stability towards higher temperatures [
14]. This was also found in our temperature screening, shown in
Figure 7. There, 2 g of ground mugwort were extracted at 1 mL/min, taking samples every 15 min. The pressure was kept constant at 15 bar, to achieve a maximum of comparability. A temperature of 80 °C leads to almost 100% yield after only 60 min of extraction. Higher temperatures such as 120 °C result in a significant loss of artemisinin probably due to decomposition, leading to a yield of only about 25%. Thus, a temperature of 80 °C is chosen for further investigations.
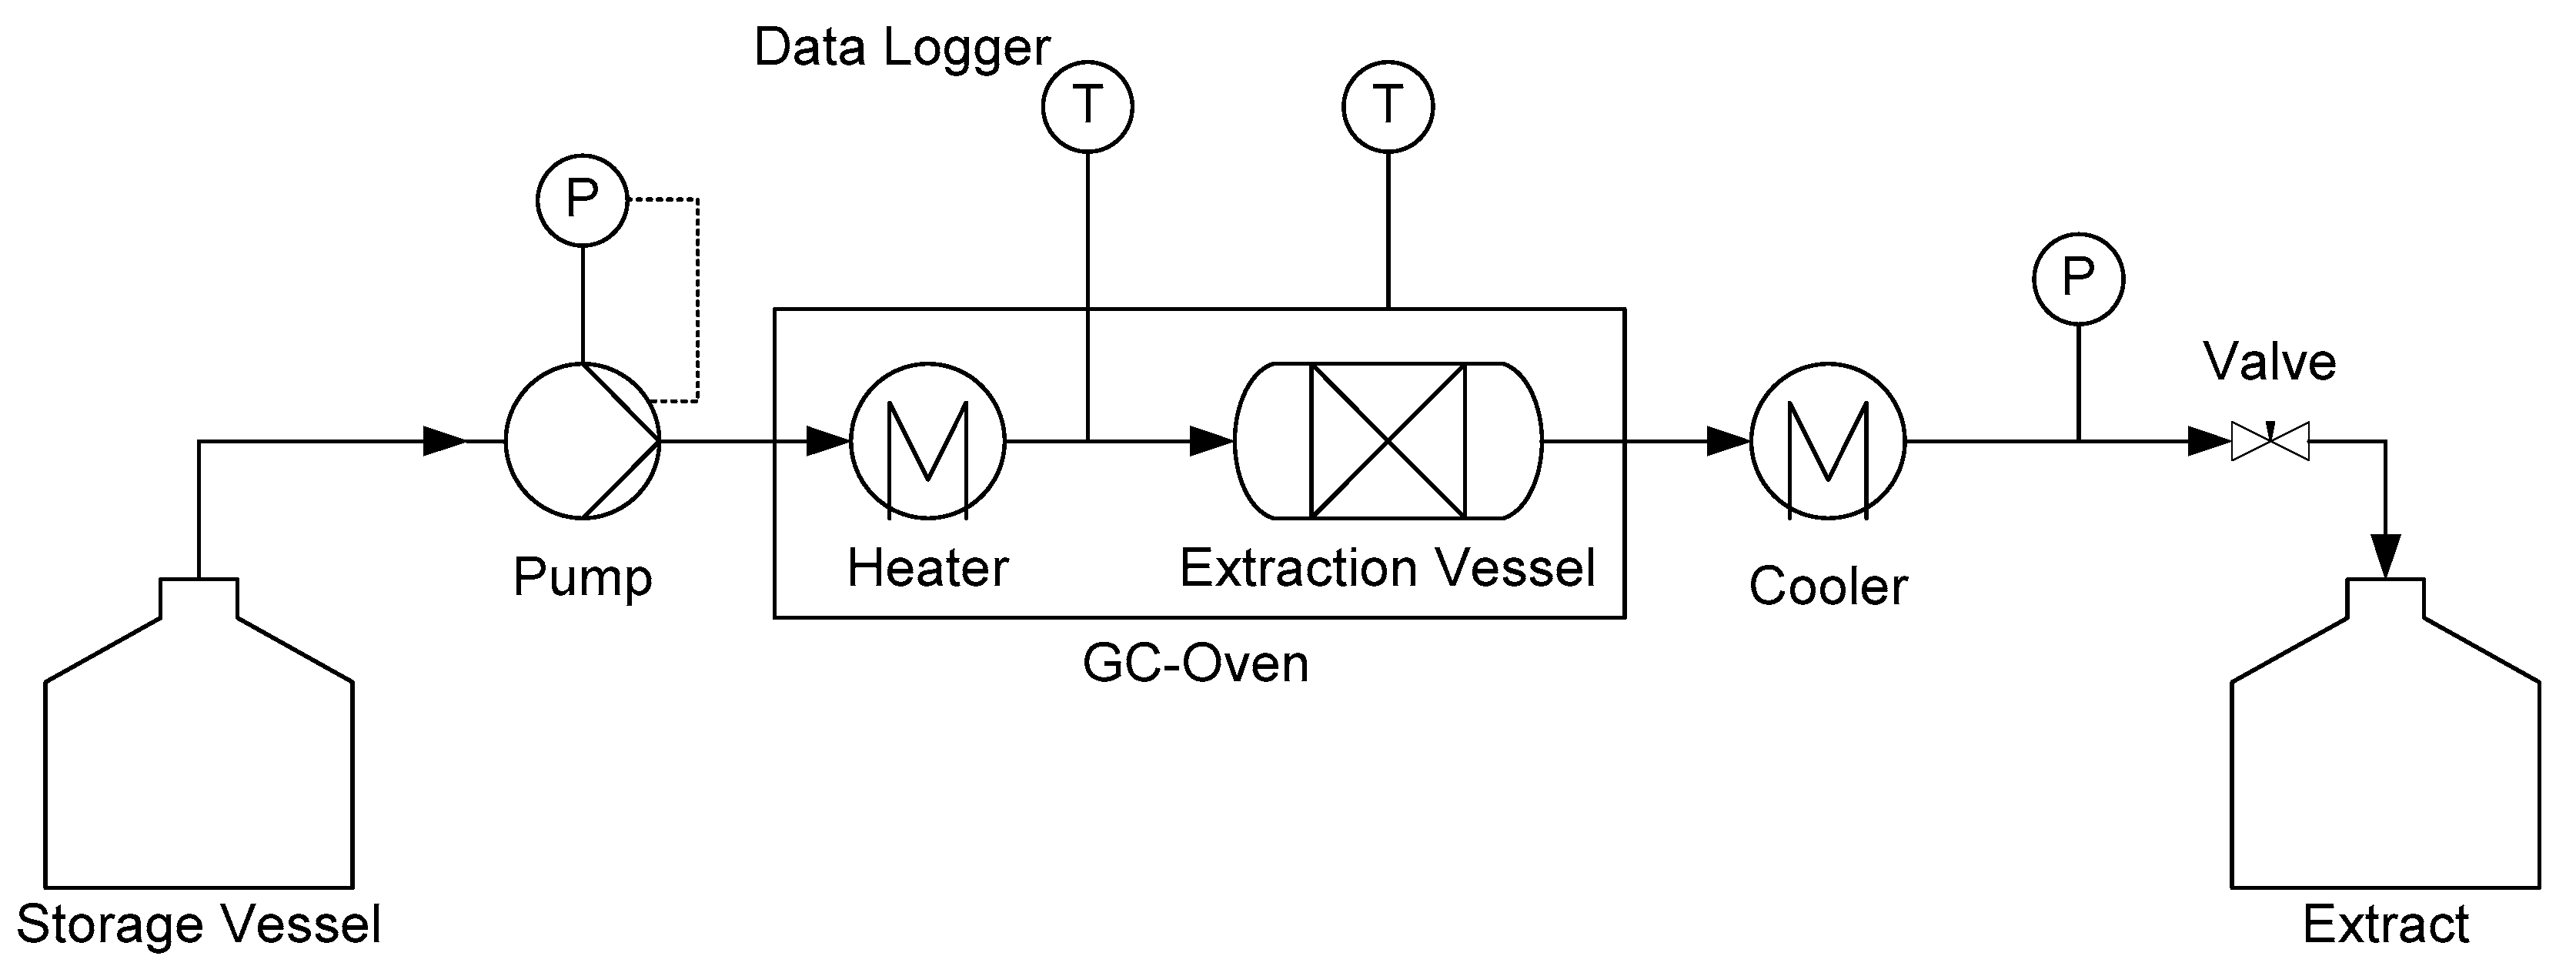
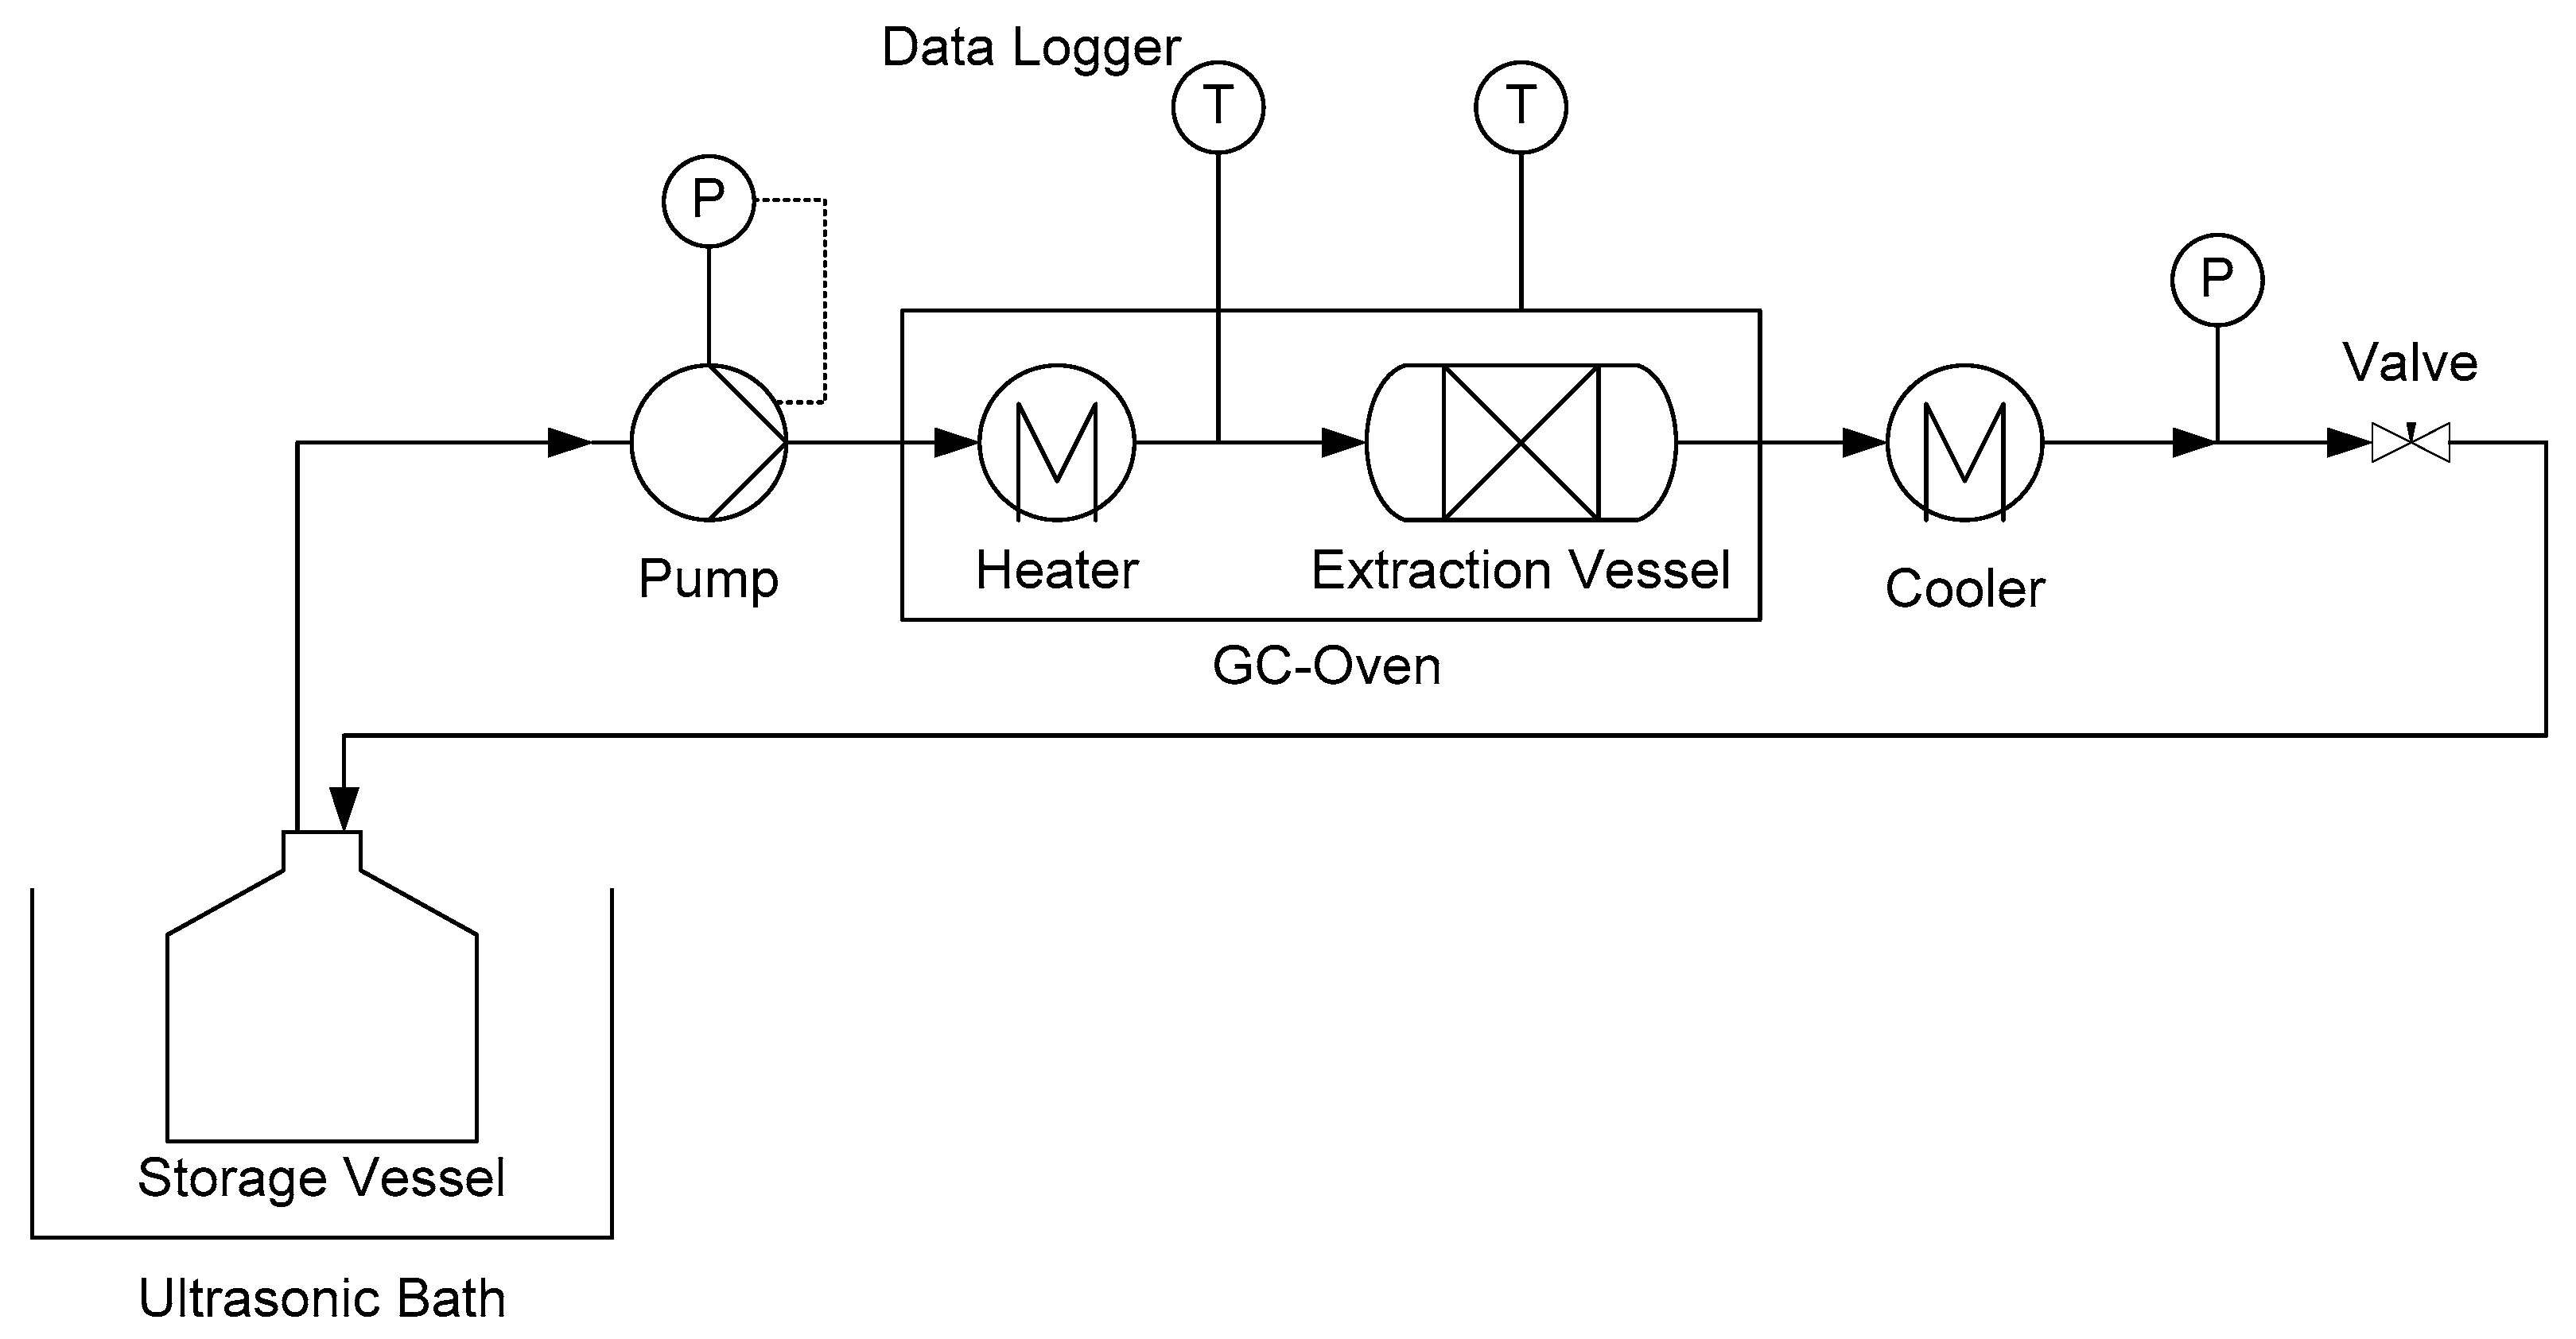
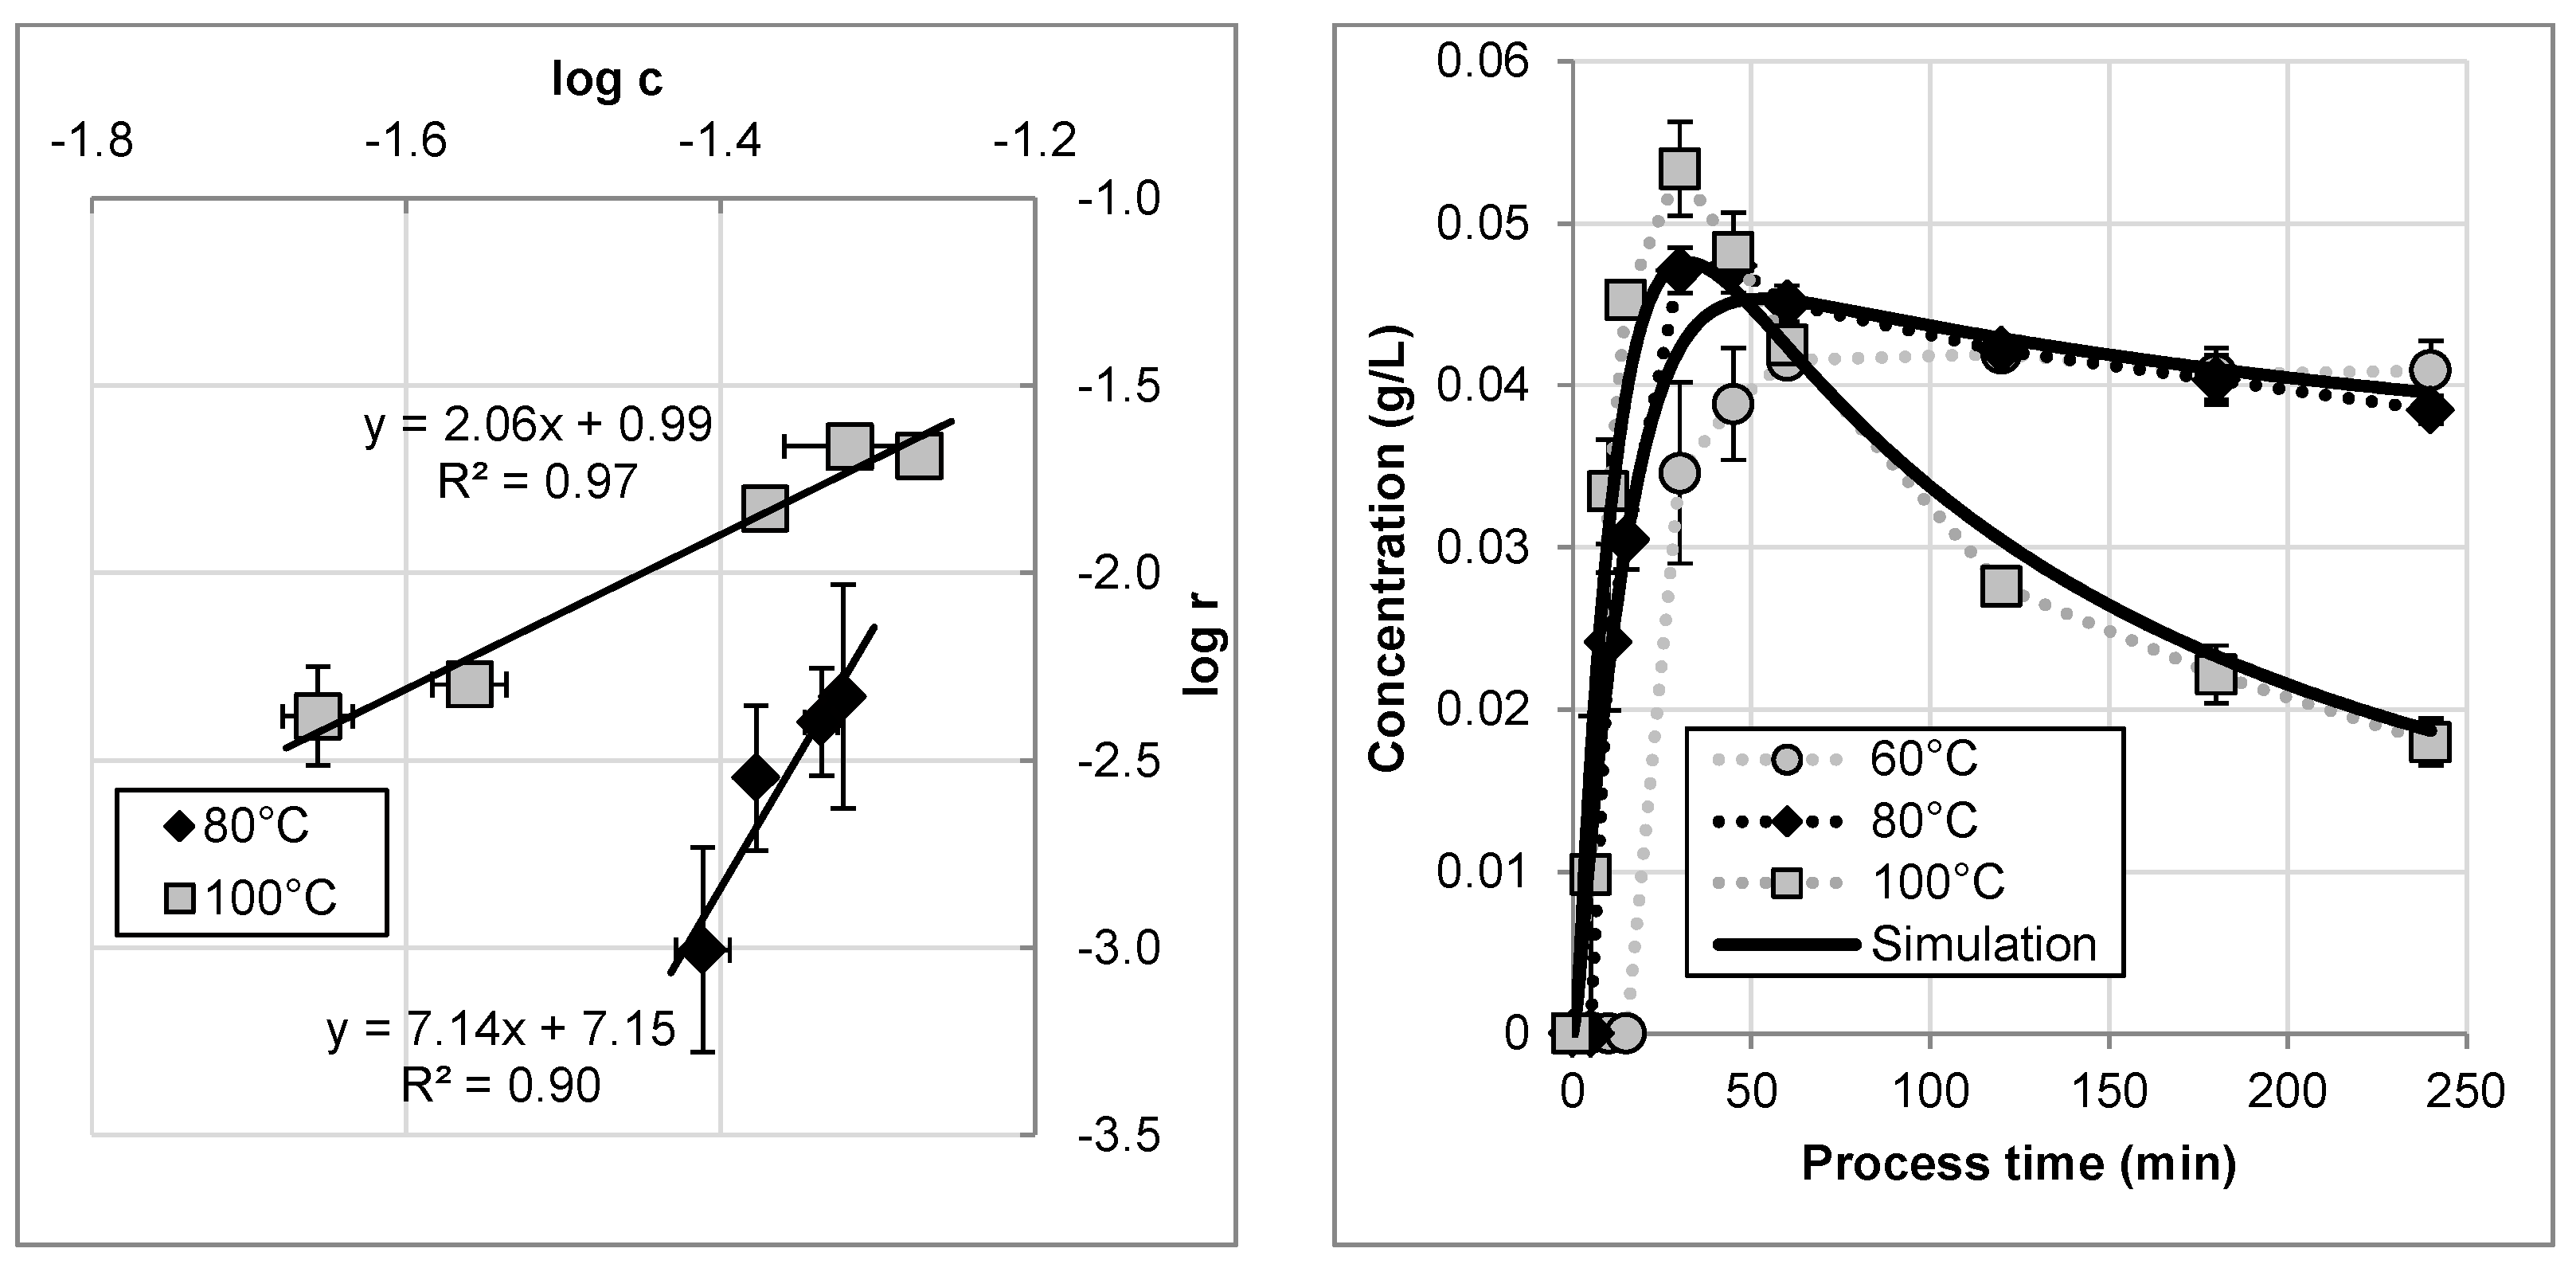
The degradation kinetics of artemisinin is further investigated by recycling the extract according to the flowsheet of
Figure 4 and our previous study [
7]. The linearized curves for 80 °C and 100 °C are shown in
Figure 8 left. The data fits a linear model which allows the determination of the rate constant and the order of reaction, according to Equation (16).
Since the samples were taken from the storage vessel, only a pseudo-kinetics is measured. To transfer the data to the real conditions present in the extraction tube, Equation (17) is used.
This equation is derived by the Damköhler number (DaI) shown in (18) assuming physical similarity between the thermal degradation that occurs in the extraction tube and the measured pseudo-kinetics in the vessel [
36].
For that, the Damköhler numbers of both reactions have the same value and the product can be replaced by the combined reaction rate coefficient of the vessel and of the tube, respectively. The reaction time represents the residence times and for each case. Because both regimes (extraction tube and the storage vessel) are switched in series, the residence times can be replaced by the individual volumes of the devices.
By linearization and conversion, the thermal degradation in the recycling mode can be simulated to verify the model parameter determination and the quality of data, as shown in
Figure 8 right. At 60 °C no degradation was observed but the productivity is not at an optimized level. Both, extraction at 80 °C and 100 °C in recycling mode can be simulated with the shown approach in a sufficient manner.
Due to thermal degradation, equilibrium measurements are not possible above 80 °C, because the system will not reach a steady state. Moreover, the extraction process cannot be limited by equilibrium because of the permanent thermal decomposition of the target molecule. Therefore the equilibrium is neglected for the modeling of PHWE, which was found to be a reasonable assumption [
7].
4.3. Comparison of Solid-Liquid Extraction and PHWE
The study indicates the great potential of using hot water for the extraction of artemisinin. A temperature of 80 °C showed the best results with regard to productivity and thermal degradation. Moreover, artemisinin can easily be extracted with acetone as a typical organic solvent. The dielectric constant of acetone is 20.7 [
27] whereas water has a value of 60.4 at 80 °C. This deviation does not allow a predictive choice of a suitable process temperature by matching the right dielectric constant of the organic solvent to be substituted with pressurized hot water. In the following part, some other differences and their technical consequences will be discussed in detail.
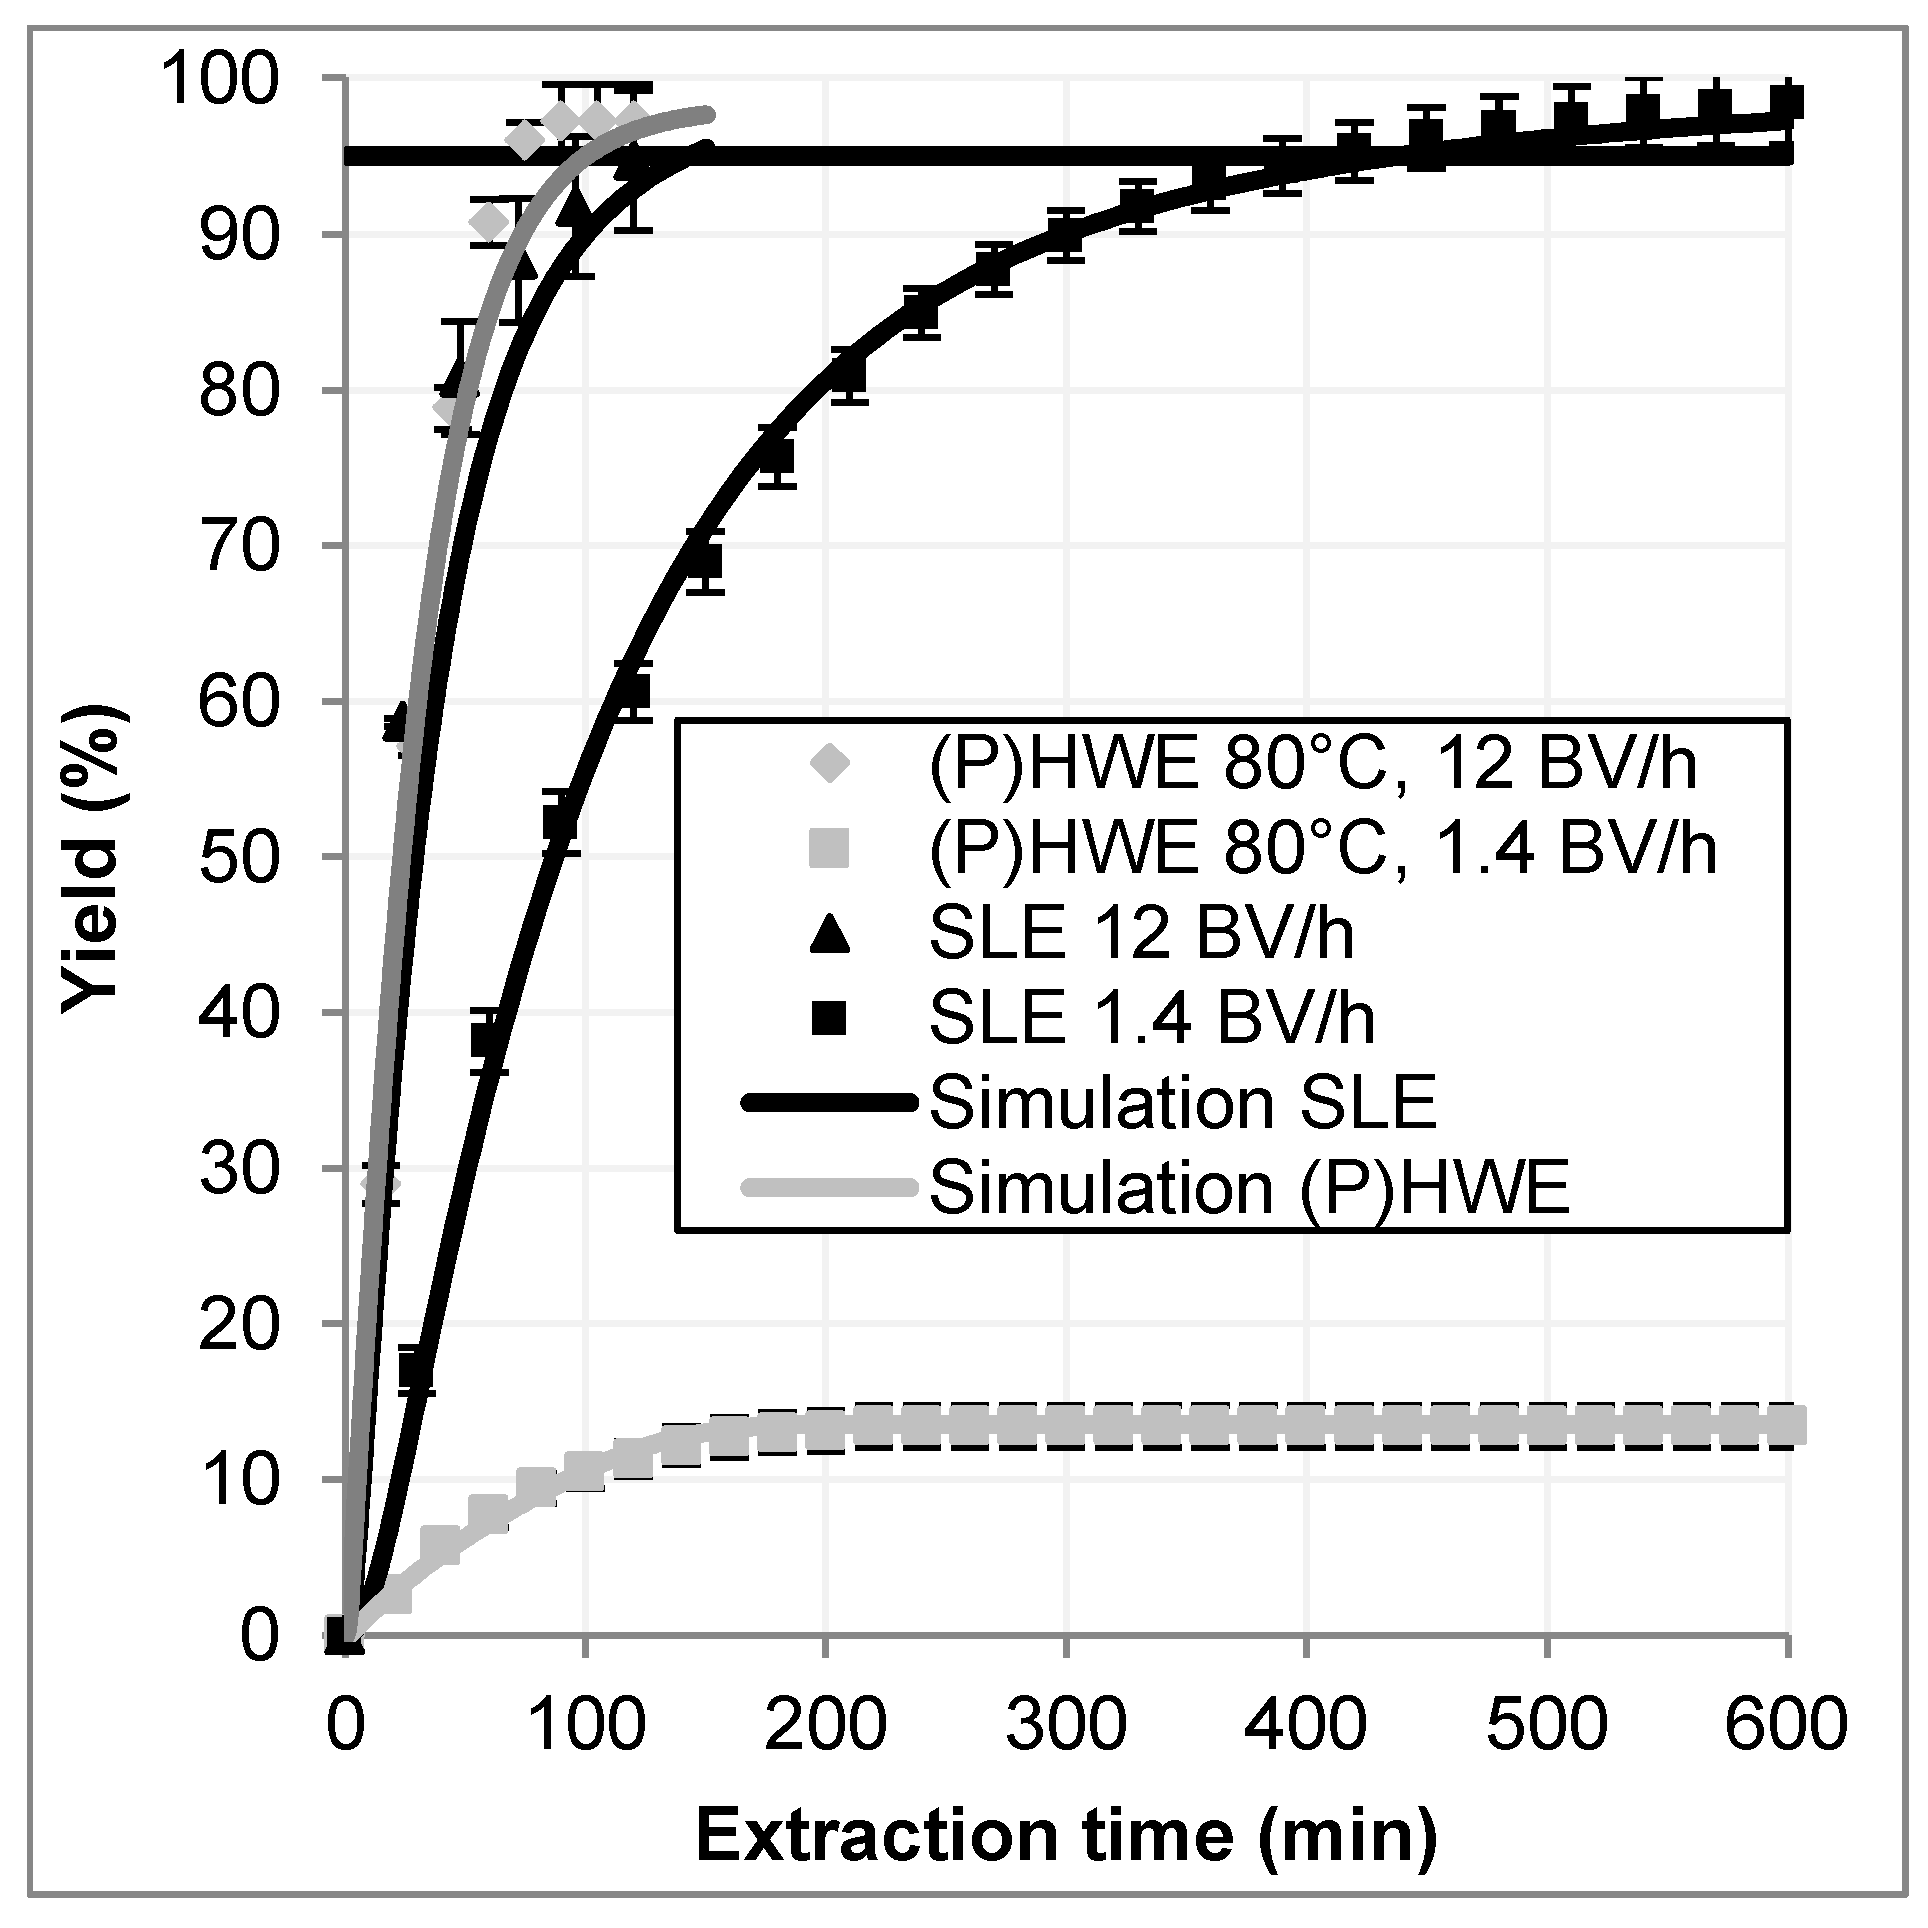
The differences between hot water extraction and conventional extraction (both in percolation mode) are shown in
Figure 9 as extraction curves. On the left side, extraction kinetics for hot water extraction and conventional extraction are plotted for a high and a slow normalized flow rate over the extraction time. The flow is given in bed volumes per hour, which are calculated by Equation (19).
is the solvent flow
and the volume of the plant material as packed bed in the column.
At high flow rates (12 BV/h), the hot water extraction reaches a yield of 95% (horizontal bar) after only 75 min of extraction time. A conventional percolation with a comparable flow rate reaches the same yield after 120 min. At a lower flow rate (1.4 BV/h) the solvent based extraction reaches a yield of 95% after 400 min. At the same time, the yield achieved in the hot water process has only a value of about 13%. Because of the long residence time due to a low flow rate, the high thermal impact leads to a decay of artemisinin thus reducing the yield significantly.
On the right side of
Figure 9 the same extraction curves are plotted against the solvent ratio. The hot water extraction with high flow rates reaches a yield of 95% at a solvent ratio of 15, in only 75 min of extraction time. This leads to a space-time yield of approximately 0.62 g/L/h. The space-time yield is calculated by Equation (20).
In the conventional percolation with a comparable flow rate, the same yield is reached after 120 min and a solvent ratio of 24 (STY = 0.33 g/L/h). This reflects the expectations, because on the one hand, the extraction process is not limited by the equilibrium as it was shown in
Section 4.1.2, on the other hand, the artemisinin is located in the glandular trichomes at the surface of the leaves [
16]. Thus, no diffusion limitation occurs and short residence times are sufficient for a complete leaching of the plant material. By applying only a low volume flow at the conventional percolation a yield of 95% is reached after 400 min at a solvent ratio of 10 (STY = 0.1 g/L/h). A comparable hot water extraction only reaches 13% yield due to thermal degradation.
Both techniques are suitable for the extraction of artemisinin. The solvent based process leads to a higher concentrated extract because of the lower solvent ratio by accepting a much longer process time and therefore a low productivity. The hot water process at those conditions will lead to the degradation of artemisinin, so for this extraction technique a high flow rate is needed. A temperature of 80 °C is by definition not a pressurized hot water extraction. For the process engineering implementation and design of this unit operation, this is not decisive. Moreover, within those conditions, the process can be realized without applying additional pressure.
This study showed a comparison of extreme process conditions (very high flowrate, very low flowrate). The operation parameters of an optimized process are somewhere in between these borders and an experimental optimization is rather time and resource intensive. With the shown approach of experimental model parameter determination in lab scale and the rigorous extraction model, these extrema can be simulated predictively, as shown in
Figure 10. As a consequence, an optimization
in-silico with such a physico-chemical process model is possible.
