Non-Viral Transfection of Human T Lymphocytes
by
 , ,
, ,
Simon A. B. Riedl
1, 
Patrick Kaiser
1,
Alexander Raup
1,2,
Christopher V. Synatschke
3,
Valérie Jérôme
1 and
Ruth Freitag
1,* 1
Process Biotechnology, University of Bayreuth, 95440 Bayreuth, Germany
2
Agap2—HIQ Consulting GmbH, 60323 Frankfurt am Main, Germany
3
Department Synthesis of Macromolecules, Max Planck Institute for Polymer Research, 55128 Mainz, Germany
*
Author to whom correspondence should be addressed.
Processes 2018, 6(10), 188; https://doi.org/10.3390/pr6100188
Submission received: 10 September 2018
/
Revised: 27 September 2018
/
Accepted: 9 October 2018
/
Published: 11 October 2018
(This article belongs to the Special Issue Transient Gene Expression for Rapid Protein and Virus-Vector Supply)
Abstract
:The genetic modification of human T lymphocytes with established non-viral methods is inefficient. Linear polyethylenimine (l-PEI), one of the most popular non-viral transfection agents for mammalian cells in general, only achieves transfection rates in the single digit percentage range for these cells. Here, a well-defined 24-armed poly(2-dimethylamino) ethyl methacrylate (PDMAEMA) nanostar (number average of the molecular weight: 755 kDa, polydispersity: <1.21) synthesized via atom transfer radical polymerization (ATRP) from a silsesquioxane initiator core is proposed as alternative. The agent is used to prepare polyplexes with plasmid DNA (pDNA). Under optimal conditions these polyplexes reproducibly transfect >80% of the cells from a human T-cell leukemia cell line (Jurkat cells) at viabilities close to 90%. The agent also promotes pDNA uptake when simply added to a mixture of cells and pDNA. This constitutes a particular promising approach for efficient transient transfection at large scale. Finally, preliminary experiments were carried out with primary T cells from two different donors. Results were again significantly better than for l-PEI, although further research into the response of individual T cells to the transfection agent will be necessary, before either method can be used to routinely transfect primary T lymphocytes.
1. Introduction
Genetically engineered primary human T lymphocytes (T cells) have their place in basic research and increasingly also in medical therapy [1]. A pertinent example is the generation of chimeric antigen receptor (CAR) T cells as basis for an FDA-approved adoptive cell therapy (ACT) to treat acute lymphoblastic leukemia (ALL) [2,3]. Primary T cells are isolated from the patient’s blood and are genetically modified to recognize the cancer cells. The T cells are then expanded and given back to the patient. In this case, the cells are permanently transfected, i.e., the recombinant DNA is stably integrated into the genome and passed on to the daughter cells during cell division (expansion). Alternatively, it has been proposed to first expand the T cells and then transfect them transiently. In this case, the DNA remains episomal, gene expression is transitory and will cease as the DNA is diluted during further cell division. Although not yet accepted by the regulatory authorities, transiently transfected cells are thought to show less cross reactivity and be less of a burden on the patient [4].
In nearly all cases of efficient T cell transfection discussed in the literature, viruses were used to transduce the cells. Although very efficient, viruses have some drawbacks, mostly related to their immunogenicity and a limitation in the amount of DNA to be transferred. Physical methods, such as electroporation, have been suggested as alternative [5]. However, electroporation requires prohibitory large numbers of cells, since survival is low, while important cellular functions may be perturbed [6,7]. Chemical transfection methods, such as lipofection or polyfection, which are standard alternatives for many mammalian cells, are less popular in the case of T cells, due to an extremely low efficiency. T cells have for instance, shown resistance to common lipofection reagents [8]. Gene transfer using polycations is also more difficult in the case of T cells. Several groups including our own have, e.g., shown that polyethylenimine (PEI), the current “gold standard” in non-viral chemical transfection using polycations, only reaches transfection efficiencies in the single digit range, which is much too low for most applications [9,10,11]. The reason for this inefficiency is not quite clear. However, in vitro transfection begins with an interaction of the polyplexes with the cellular membrane. It is thought that in the case of PEI, this interaction takes place primarily with negatively charged membrane proteins, such as sulfated proteoglycans [12,13,14,15]. Some studies with PEI indicate that these interactions are also decisive for polyplex internalization [16,17]. T cells and in particular some of their subpopulations, are known to have unusually high or low proteoglycan contents in their cellular membranes [18]. The same is true for the Jurkat cells [19], i.e., cells from a human leukemia cell line, which are commonly used as model cells for the T cells. A low proteoglycans content may therefore be partly responsible for a resistance to PEI as a transfection agent.
In the past, we have proposed poly-2-(dimethylamino)ethyl methacrylate (PDMAEMA) as an efficient transfection agent in a wide range of cell lines including some that are hardly transfectable with PEI [11] which have led us to speculate about a different uptake mechanism [20]. Well-defined, multi-armed nanostars based on the polycation poly-2-(dimethylamino)ethyl methacrylate (PDMAEMA) outperformed linear PEI (l-PEI) for the transfection of Jurkat cells. However, elevated transfection efficiencies (up to 50%) were linked to a low viability (≤40%) in these cases [11]. In the previous experiments, the PDMAEMA nanostars had been used in a manner similar to that proposed for PEI in standard transfection protocols. The plasmid DNA (pDNA) and a defined surplus of the polycation were mixed and incubated for polyplex formation. Afterwards, the polyplexes were added to the cells under static conditions (cells settled at the bottom of a Petri dish or well plate). After another incubation step, the cells were separated from the transfection cocktail through centrifugation and placed into fresh culture medium for recovery.
Debatably, electroporation and, in particular, nucleofection [21] are at present the most efficient non-viral methods for the genetic modification of T cells. Both call for the pre-mixing of the cells and the pDNA at high cell density (between 1 × 10⁷ cells mL−1 and 8 × 10⁷ cells mL−1) prior to the high voltage treatment [22]. Taking this into consideration, we argue that the chemical high cell density (HCD) transfection protocol developed 14 years ago by the group of Florian Wurm [23,24,25] for production cell lines like Chinese hamster ovary (CHO) and human embryonic kidney 293 (HEK293) cells, might also be suitable to transiently deliver pDNA into T cells, even though to the best of our knowledge it has never been tried for this purpose before. For HCD transfection, the pDNA is directly mixed into a highly concentrated cell suspension (≥2 × 10⁷ cells mL−1), followed by the addition of a polycation (PEI in most previous experiments), a short incubation and then a dilution of the transfection cocktail by at least an order of magnitude. The transfection agent is thus not removed, but simply diluted in this approach.
The present study summarizes the systematic optimization of nanostar-based transfection strategies for genetic engineering of human T cell, both at the research and at the therapeutic scale. Jurkat cells were used as model cells for human primary T cells in the development of the procedures, which were then applied in a preliminary proof-of-concept study to human primary T lymphocytes from two different donors.
2. Materials and Methods
2.1. Materials
If not otherwise indicated, we used Greiner bio-one (Greiner Bio-One International GmbH, Frickenhausen, Germany) as supplier for cell culture materials and Sigma-Aldrich for chemicals (Sigma-Aldrich, Taufkirchen, Germany). Linear PEI (l-PEI, 25 kDa) was from Polysciences (Polysciences Europe GmbH, Eppelheim, Germany). Trypan blue solution (0.4%) was from VWR (VWR International, Ismaning, Germany). Recombinant human interleukin 2 (rhIL-2) was from BD Biosciences (Becton Dickinson, Heidelberg, Germany). Fetal calf serum (FCS), l-glutamine, penicillin, and streptomycin were from Biochrom (Biochrom AG, Berlin, Germany). Dulbecco’s Phosphate-Buffered Saline without Ca2+ and Mg2+ (DPBS) was from Lonza (Lonza Group AG, Visp, Switzerland). Hepes-buffered glucose solution (HBG, 20 mM Hepes, 5 wt% glucose, pH 5.5) was prepared in house and sterilized by filtration (0.2 µm Minisart, regenerated Cellulose, Sartorius, Göttingen, Germany). Cell culture media R10 (Roswell Park Memorial Institute (RPMI) 1640 without glutamine, add 10 vol% fetal calf serum, 2 mM l-glutamine, 100 IU mL−1 penicillin and 100 µg mL−1 streptomycin) and Opti-MEM were from Biochrom AG (Berlin, Germany) and Thermo Fisher Scientific (Dreieich, Germany), respectively. LymphoGrow medium (LG, containing 2 mM l-glutamine and undisclosed amounts of antibiotics) was from Cytogen (Cytogen GmbH, Sinn, Germany). LG stimulates the growth of peripheral blood lymphocytes and contains also proprietary amounts of pre-tested fetal bovine serum (FBS) and phytohemaglutinin (PHA-P, ≤10 µg mL−1 mitogenic activity). For pre-equilibration, media were incubated for at least 1 h in a standard mammalian cell culture incubator (37 °C, 5% CO2, 95% humidity, Steri-Cult, Thermo Forma, Fisher Scientific GmbH, Schwerte, Germany). Blood was obtained from the Bavarian Red Cross.
2.2. Cells and Maintenance
The Jurkat cells (TIB-152, American Type Culture Collection (ATCC), human leukemia T cells, suspension cells) were maintained in R10, as recommended by the supplier; a seeding density of 1 × 10⁵ cells mL−1 was used during passaging and the maximal cell density was never allowed to exceed 3 × 10⁶ cells mL−1. Cells were cultivated at 37 °C in humidified 5% CO2 atmosphere.
Peripheral blood mononuclear cells (PBMCs) were isolated from the blood of healthy donors by Ficoll gradient centrifugation with a lymphocyte separation medium (LSM1077, PAA Laboratories, Pasching, Austria) according to the supplier’s instructions. The freshly isolated PBMCs were seeded at 2.5 × 10⁶ cells mL−1 in Lymphogrow (LG) medium in 75 cm2 T-flasks. After 24 h cultivation, the cell suspension was transferred to a new flask, to separate the PBMCs from adherent growing immune cells. PBMCs were cultivated for a further 24 h before transfection.
2.3. Plasmid
pEGFP-N1 (4.7 kb) encoding for the enhanced green fluorescent protein (EGFP) driven by the cytomegalovirus (CMV) immediate early promoter was from Clontech Laboratories, Inc. (Mountain View, CA, USA). The plasmid was amplified in E. coli (LB medium) using standard laboratory techniques. The EndoFree Plasmid Kit (Giga Prep/Maxi Prep) from QIAGEN (QIAGEN GmbH, Hilden, Germany) was used for purification (quality control: >80% supercoiled topology (agarose gel; 1% TAE) and A260/A280 ≥1.8). Purified plasmids were solubilized (1.7 mg mL−1) in sterile ultrapure-water (Sigma-Aldrich, Taufkirchen, Germany).
2.4. Transfection Agent
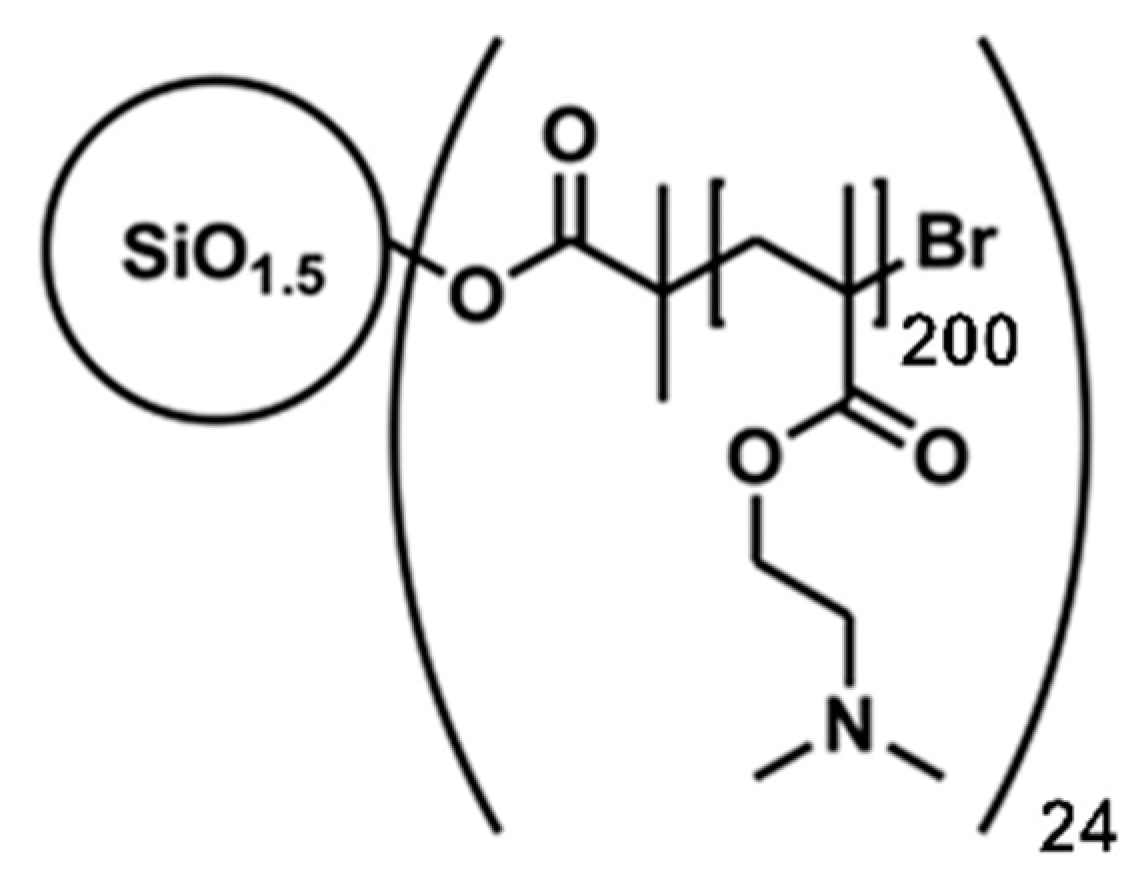
The transfection agent was a well-defined 24-armed PDMAEMA nanostar (number average of the molecular weight: 755 kDa, polydispersity: <1.21) synthesized as previously described [26] via atom transfer radical polymerization (ATRP) from a silsesquioxane initiator core. Each arm of the nanostar contained an average of 200 monomeric units, Scheme 1. A stock solution (1.82 mg mL−1) was prepared in sterile ultrapure PCR-water (Sigma-Aldrich).
2.5. Transfection of Jurkat Cells Using Polyplexes (6-Well Plate, Eppendorf Tube Formats)
According to the standard protocol, cells were harvested by centrifugation (200 g, 5 min) 24 h before transfection and seeded at 0.05 or 0.1 × 10⁶ cells mL−1 (living cell density) in fresh medium, as indicated. On the day of transfection, the cells (exponential growth phase, viability >90%) were again harvested by centrifugation, washed twice with DPBS and seeded at a density of 0.2 × 10⁶ cells mL−1 (living cell density) in 6-well or 2 mL Eppendorf tubes (1 mL of pre-equilibrated culture medium). The well plates were put back into the incubator for one hour. The Eppendorf tubes were stored on ice to reduce the metabolic activity of cells during the 1 h incubation.
In the meantime, polyplexes were prepared in a final volume of 50 (transfection in Eppendorf tubes) or 200 μL (transfection in 6-well plates) by first diluting the necessary volume of the pDNA stock solution in Hepes-buffered glucose solution (HBG), followed by the addition of sufficient amounts (in a single drop) of the polymer stock solution to achieve the indicated N/P ratio (ratio of polymer N to DNA P). The mixture was vortexed for 10 s and incubated for 20 min at room temperature (polyplex formation). Then, the indicated amount of Opti-MEM (1 mL for the 6-well plates, 0.15 mL or 0.45 mL for the Eppendorf tubes) was added, followed by vortexing and another 10 min incubation at room temperature. In case of a transfection in 6-well plates, the polyplex mixture was added drop-wise to the 1 mL of cell suspension in the wells and distributed by gentle rocking. After an incubation period of up to 4 h in the cell culture incubator, the supernatant was removed and replaced by 2 mL of fresh growth medium. In case of the transfections in the Eppendorf tubes, the cells were recovered by centrifugation (200 g, 5 min) and the supernatant was discarded. The cell pellet was dislocated by scratching prior to adding the polyplex/Opti-MEM mixture. Cells and polyplexes were gently mixed before the tube was placed upright in the cell culture incubator. After the indicated time span of incubation (15 min, 30 min, 90 min, 120 min, or 240 min), the cells were again recovered by centrifugation, the supernatant was discarded and the cell pellet was re-suspended in 2 mL R10 and transferred to a 6-well plate. Cells from all experiments were analyzed for viability (counterstaining with propidium iodide, PI) and transfection efficiency (% of green fluorescent protein (GFP) -positive cells) by flow cytometry 48 h post transfection.
2.6. High Cell Density Protocol for Transfection of Jurkat Cells
The high cell density (HCD) transfection protocol used here was based on a protocol originally proposed by Durocher et al. for HEK293 cells [27]. Briefly, cells were harvested by centrifugation (200 g, 5 min) 24 h prior to transfection and seeded at 1.0 × 10⁶ cells mL−1 (living cell density) in fresh culture medium. On the day of transfection, the cells (exponential growth, >90% viability) were again harvested by centrifugation, washed twice with DPBS and re-suspended at a density of 2 × 10⁷ cells mL−1 (living cell density) in a suitable amount of pre-equilibrated Opti-MEM. The cell suspension was then transferred into 2 mL Eppendorf tubes (0.25 mL, total: 5 × 10⁶ cells) or 50 mL Falcon tubes (5 mL, total: 1 × 10⁸ cells). The indicated amount of pDNA was added and the tubes were inverted several times for mixing. Then, a defined amount of the transfection agent was added to achieve the indicated N/P ratio and mixed in. The tubes were then fixed on a SB2 rotator unit (Stuart, Barloworld Scientific, Burlington, NJ, USA) placed in a 37 °C room and rotated at 20 rpm for 4 h. At the end of the incubation time, the cells were diluted (dilution factor: 20, unless indicated otherwise) in R10 and the suspensions transferred to either a 10 cm tissue culture dish (Eppendorf tube) or a 100 mL spinner flask (Falcon tube). For further scale up, 2 × 10⁹ cells were transferred into two 50 mL Falcon tubes (25 mL each, 4 × 10⁷ cells mL−1), pDNA and polymer were added sequentially as described above. Thereafter, the mixtures were immediately combined in a 100 mL spinner flask and placed for incubation in the cell culture incubator for 4 h (70 rpm, CELLSPIN stirrer, INTEGRA Biosciences AG, Biebertal, Germany). At the end of that time, the cells were diluted in R10 (dilution factor: 20) and transferred to a 1 L spinner flask for further cultivation of the cells. Cells from all experiments were again analyzed for viability (PI) and transfection efficiency (EGFP) by flow cytometry 48 h post transfection.
2.7. Transfection of Primary T Cells
After two days of cultivation of the PBMCs in LG medium, mainly CD3+ cells with blasted morphology (“activated T cells”) were obtained as determined by flow cytometry. Transfections were performed in Opti-MEM using polyplexes and HCD protocols both in Eppendorf tube format as described above, excluding the cell seeding step 24 h before transfection. For the polyplexes-based transfection (0.2 × 10⁶ cells, N/P 10, transfection volume 0.5 mL), two batches of polyplexes were prepared in parallel (experimental replicates) but added sequentially to the cells implicating that for the second replicate, polyplexes incubation at room temperature and storage of the cells on ice was somewhat longer (15 min to 20 min). After 90 min incubation with the polyplexes, the cells were recovered by centrifugation, the supernatant was discarded and the cell pellet was re-suspended in 2 mL LG medium supplemented with 11 ng mL−1 rhIL-2 to improve T cells proliferation [28] and transferred into 6-well plates. For HCD transfection, 5 × 10⁶ cells were incubated with 3 µg polymer per 106 cells for 4 h (N/P 10, 0.25 mL). Thereafter, the cells were diluted (dilution factor: 80) in LG medium supplemented with 11 ng mL−1 rhIL-2 and the suspension transferred into a 10 cm tissue culture dish. Cells from all experiments were again analyzed for viability (PI) and transfection efficiency (EGFP) by flow cytometry 48 h post transfection.
2.8. Analytics
Jurkat cell numbers and viabilities during passaging and seeding steps were evaluated by trypan blue exclusion assay with a hemocytometer (Neubauer Improved, VWR International, Ismaning, Germany). Cell number and viability of primary T cells were evaluated using the automated fluorescence cell counter Luna (Logos Biosystems, Gyeonggi-do, Korea). A 2 µL sample of cell culture was mixed with 18 µL Staining-Mix (Acridin Orange and Propidium iodide, proprietary concentrations, Logos Biosystems) and loaded into the chamber of a PhotonSlide (Logos Biosystems). Afterwards, the slide was inserted into the slide port of the counter and the cells were counted. If the cell concentration was above 5 × 10⁶ cells mL−1 the sample was diluted with DPBS (10-fold).
Zeta potentials and hydrodynamic radii of the polyplexes were determined using a Zetasizer Nano ZS (Malvern Instruments, Herrenberg, Germany). For zeta potential measurements polyplexes were produced in 200 µL HBG using 15 µg of pDNA and varying amounts of the nanostar stock solution to reach the indicated N/P ratio. Mixtures were vortexed for 10 s and incubated at room temperature for polyplex formation and maturation. After 20 min of incubation, the preparation was diluted with 1 mL Opti-MEM. The size of the polyplexes was determined by noninvasive back scattering in the same instrument utilizing a He–Ne laser (λ = 633 nm, max power = 5 mW). Hydrodynamic radii were followed for 20 min in HBG. Then, polyplexes were diluted 6-fold with Opti-MEM and further monitored. All incubations and measurements were performed at room temperature.
For the gel retardation assay, polyplexes were produced in 200 µL HBG using 15 µg of pDNA and varying amounts of the nanostar stock solution to reach the indicated N/P ratio. Mixtures were vortexed for 10 s and incubated at room temperature for polyplex formation and maturation. After 20 min of incubation, 20 µL 6X loading buffer (60% glycerol—10 mM Tris-HCl pH 7.6—60 mM EDTA—0.03% bromophenol blue) were added and 15 µL of these mixtures were analyzed in 1% (w/v) agarose gels with Tris-acetate-EDTA as running buffer (running time 90 min, applied voltage 90 V). Gels were stained with ethidium bromide (EtBr, 10 μg mL−1) and the DNA visualized under ultraviolet (UV) light (254 nm).
For phenotyping of the primary T lymphocytes, cell surface markers CD3 and CD25 were assessed by staining the cells with specific antibodies (mouse-anti human CD3-PE # 555340, mouse-anti human CD25-PE-Cy5, # 555433; both from BD Bioscience, Becton Dickinson, Heidelberg, Germany) according to the manufacturer’s instructions and analyzed by flow cytometry.
For flow cytometry (Cytomics FC500 equipped with a 488 nm argon-ion laser, Beckman Coulter, Krefeld, Germany), cells were recovered by centrifugation (200 g, 5 min) and re-suspended in 500 µL DPBS containing PI (1 µg mL−1). Forward scatter (FSC), side scatter (SSC), green fluorescence (EGFP, em 510 nm), and red fluorescence (PI, em 620 nm; PE, em 575 nm; PE-Cy5, em 655 nm) were recorded. Scatter properties (FSC/SSC) were used to select a region representing single, non-apoptotic cells, while disregarding dead cells, debris, and cellular aggregates. Cells “transfected” at N/P = 0, i.e., in the absence of the transfection agent, were used to set the measurement parameters. Histogram plots of the respective fluorescence intensities (log scale) were used to estimate the percentage of transfected cells and the expression level distribution according to: low producers (L): fluorescence intensity between 1 a u and 10 a u.; middle producers (M): fluorescence intensity between 10 a u and 100 a u.; high producers (H): fluorescence intensity >100 a u., in the non-apoptotic cell population. Dead cells, counterstained by PI, were evaluated in the total measured cell population. Flow cytometry data were evaluated using FlowJo software v 10.5.0 (Tree Star, Stanford University, Stanford, CA, USA, 2016).
2.9. Statistical Analyses
Group data are reported as mean ± standard deviation (SD). If not otherwise stated, n represents the number of independent experiments. Sigma Plot software (version 11.0, Systat software Inc., San Jose, CA, USA, 2008) was used for One-way ANOVA with Bonferoni multiple comparisons tests to determine whether data groups differed significantly from each other. Statistical significance was defined as p < 0.05.
3. Results and Discussion
3.1. Physicochemical Characterization of the Polyplexes
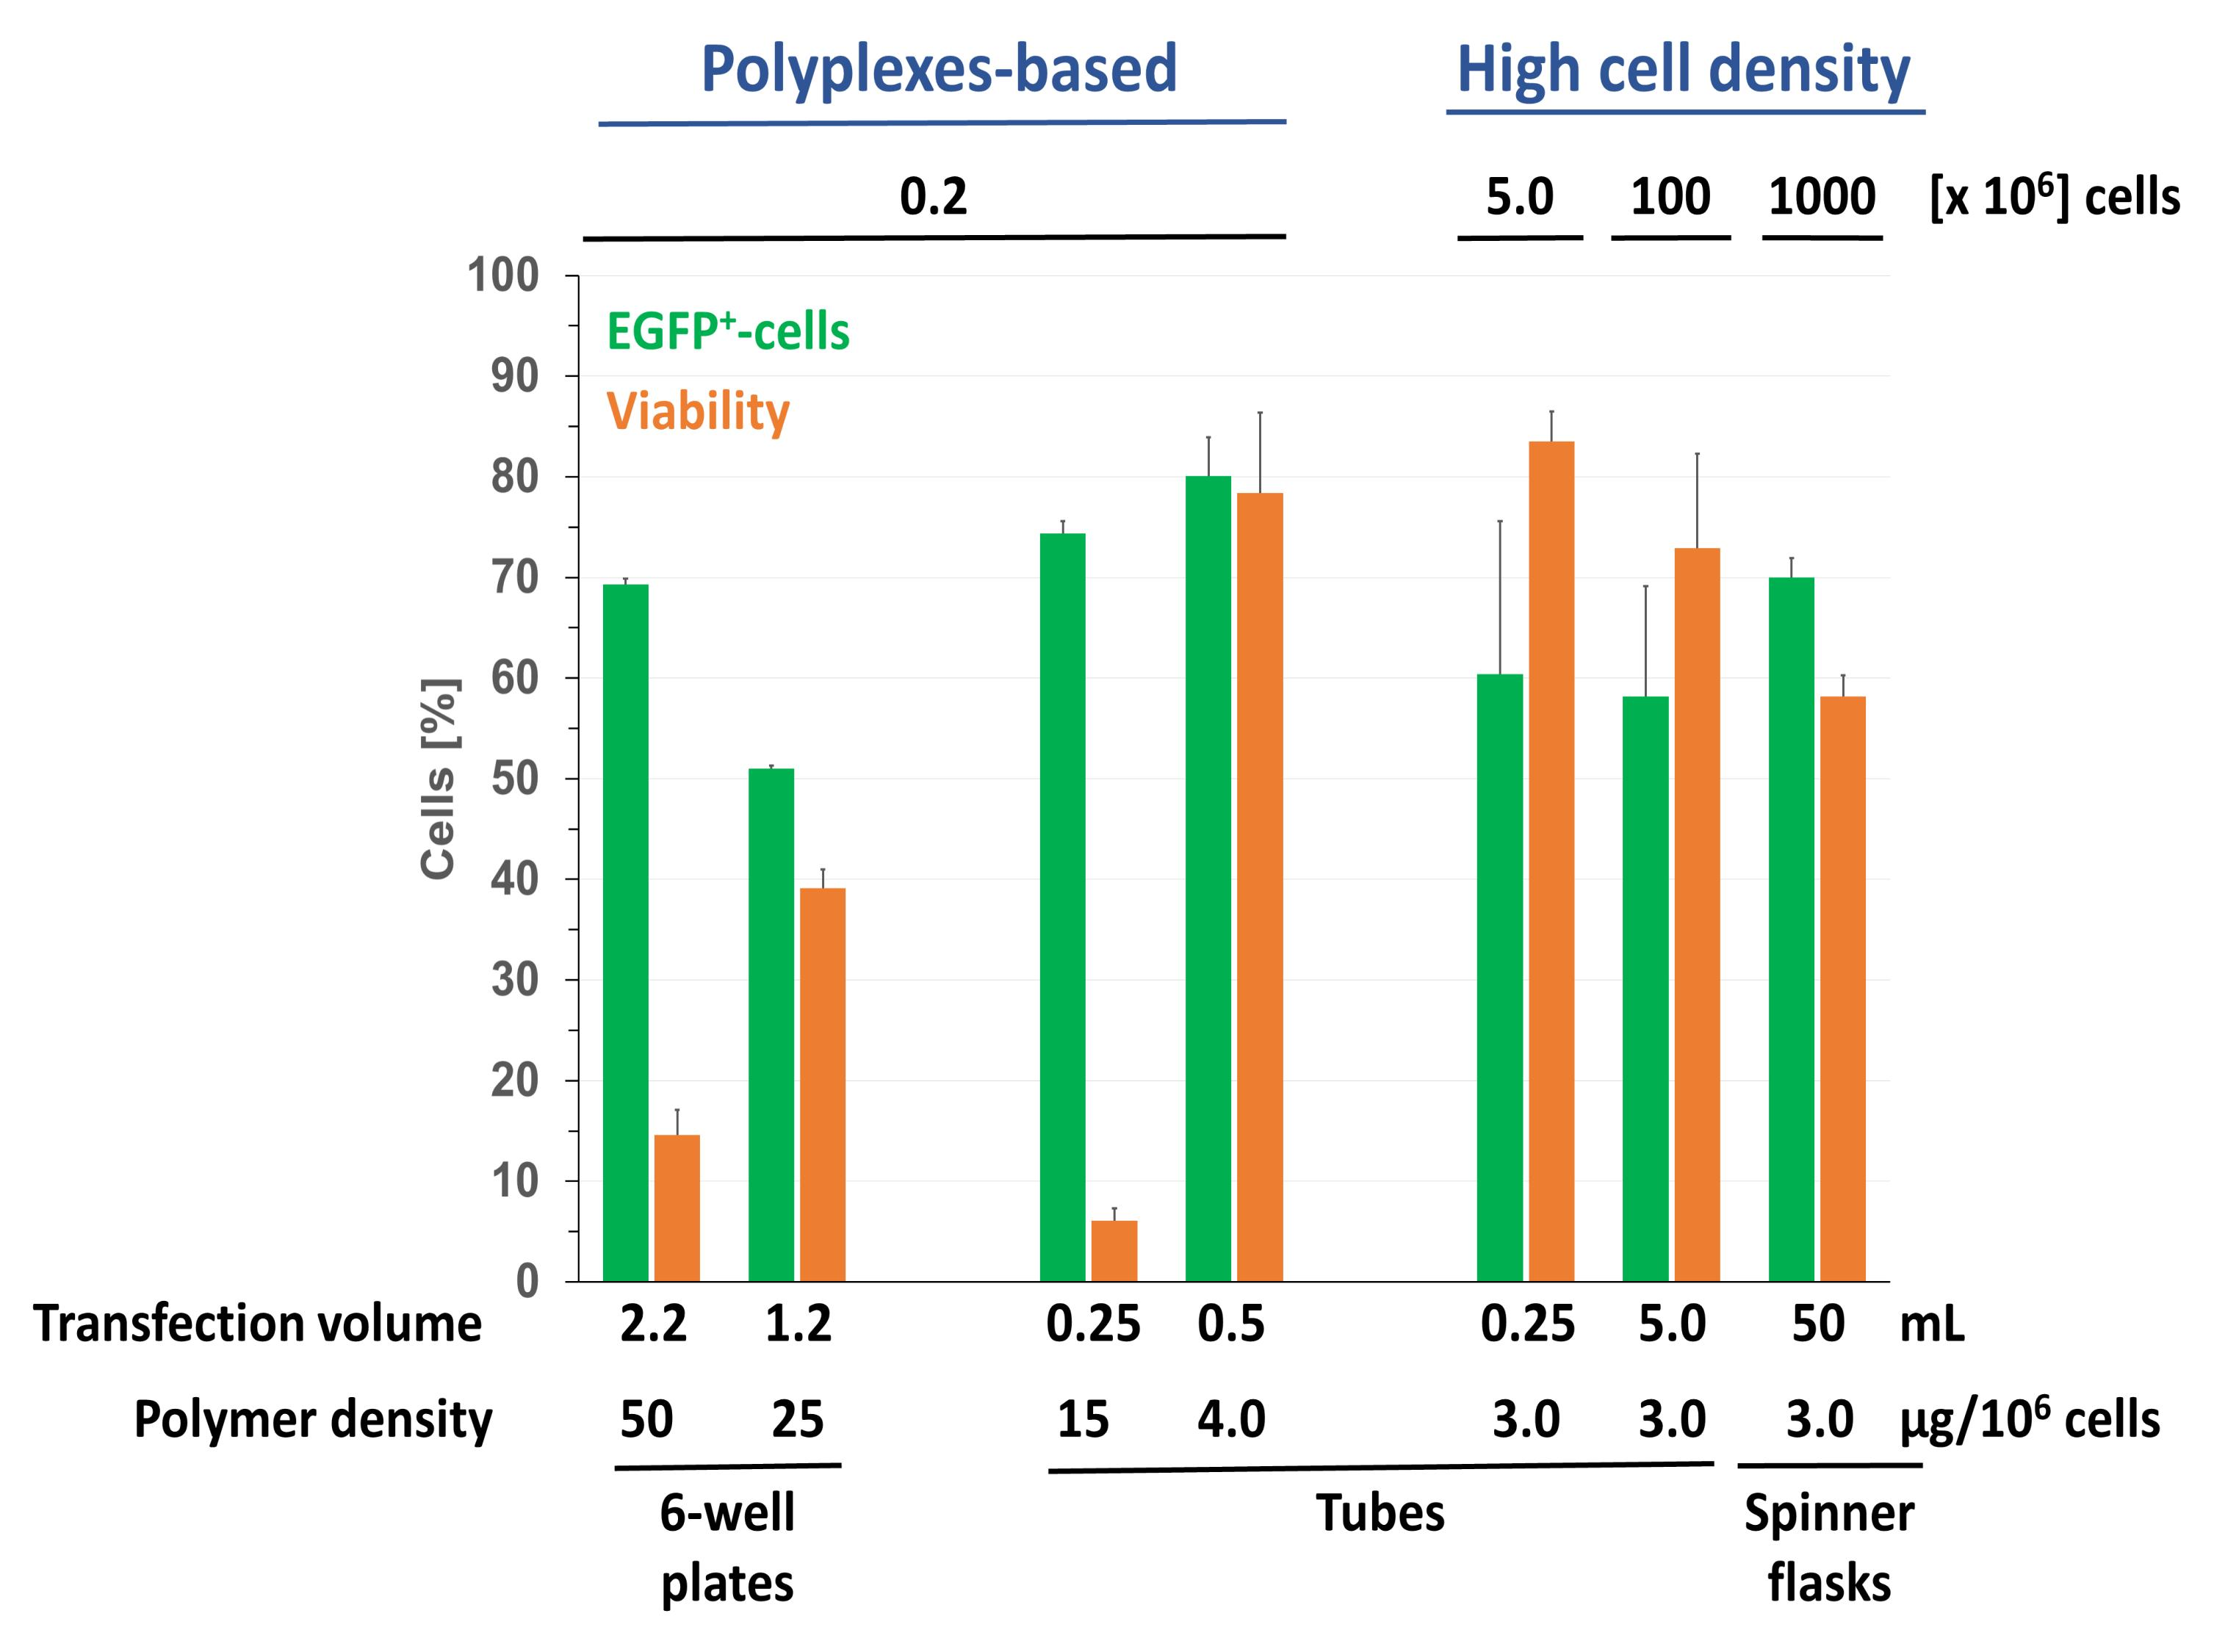
In the standard transfection protocol, polyplexes are initially formed between the pDNA and a surplus of the polycationic transfection agent, which are then added to the cells. A surplus of transfection agent is required to overcompensate the negative charge of the pDNA and give the polyplexes the positive net-charge required for attractive electrostatic interaction with the cellular membrane. In addition, the size (hydrodynamic radius) of the polyplexes should ideally range between 50 nm and 200 nm [29].
The zeta potential was measured for the polyplexes as a function of the N/P ratio (ratio of polymer N to DNA P), Table 1. Hepes-buffered glucose solution (HBG) was used as matrix for polyplex formation, because in our hands, this buffer originally proposed by Van Gaal et al. [30] had previously been more efficient in transfecting mammalian cells that the commonly used unbuffered 150 mM NaCl [31].
As expected, the zeta potential of the polyplexes increases with increasing N/P ratio. An N/P ratio of at least 5 is required for a full charge compensation of the DNA. When the N/P ratio is increased further, the zeta potential reaches a final value of +10 mV. As shown as example for N/P 20 in Figure 1, the hydrodynamic radius of the polyplexes changed little with incubation time. Moreover, with a value of 70.4 ± 4.5 nm the polyplexes should be well suited to transfect mammalian cells. This is different from the results shown for l-PEI polyplexes in HBG which initially was much smaller 33 nm and then increase to 130 nm after dilution [20].
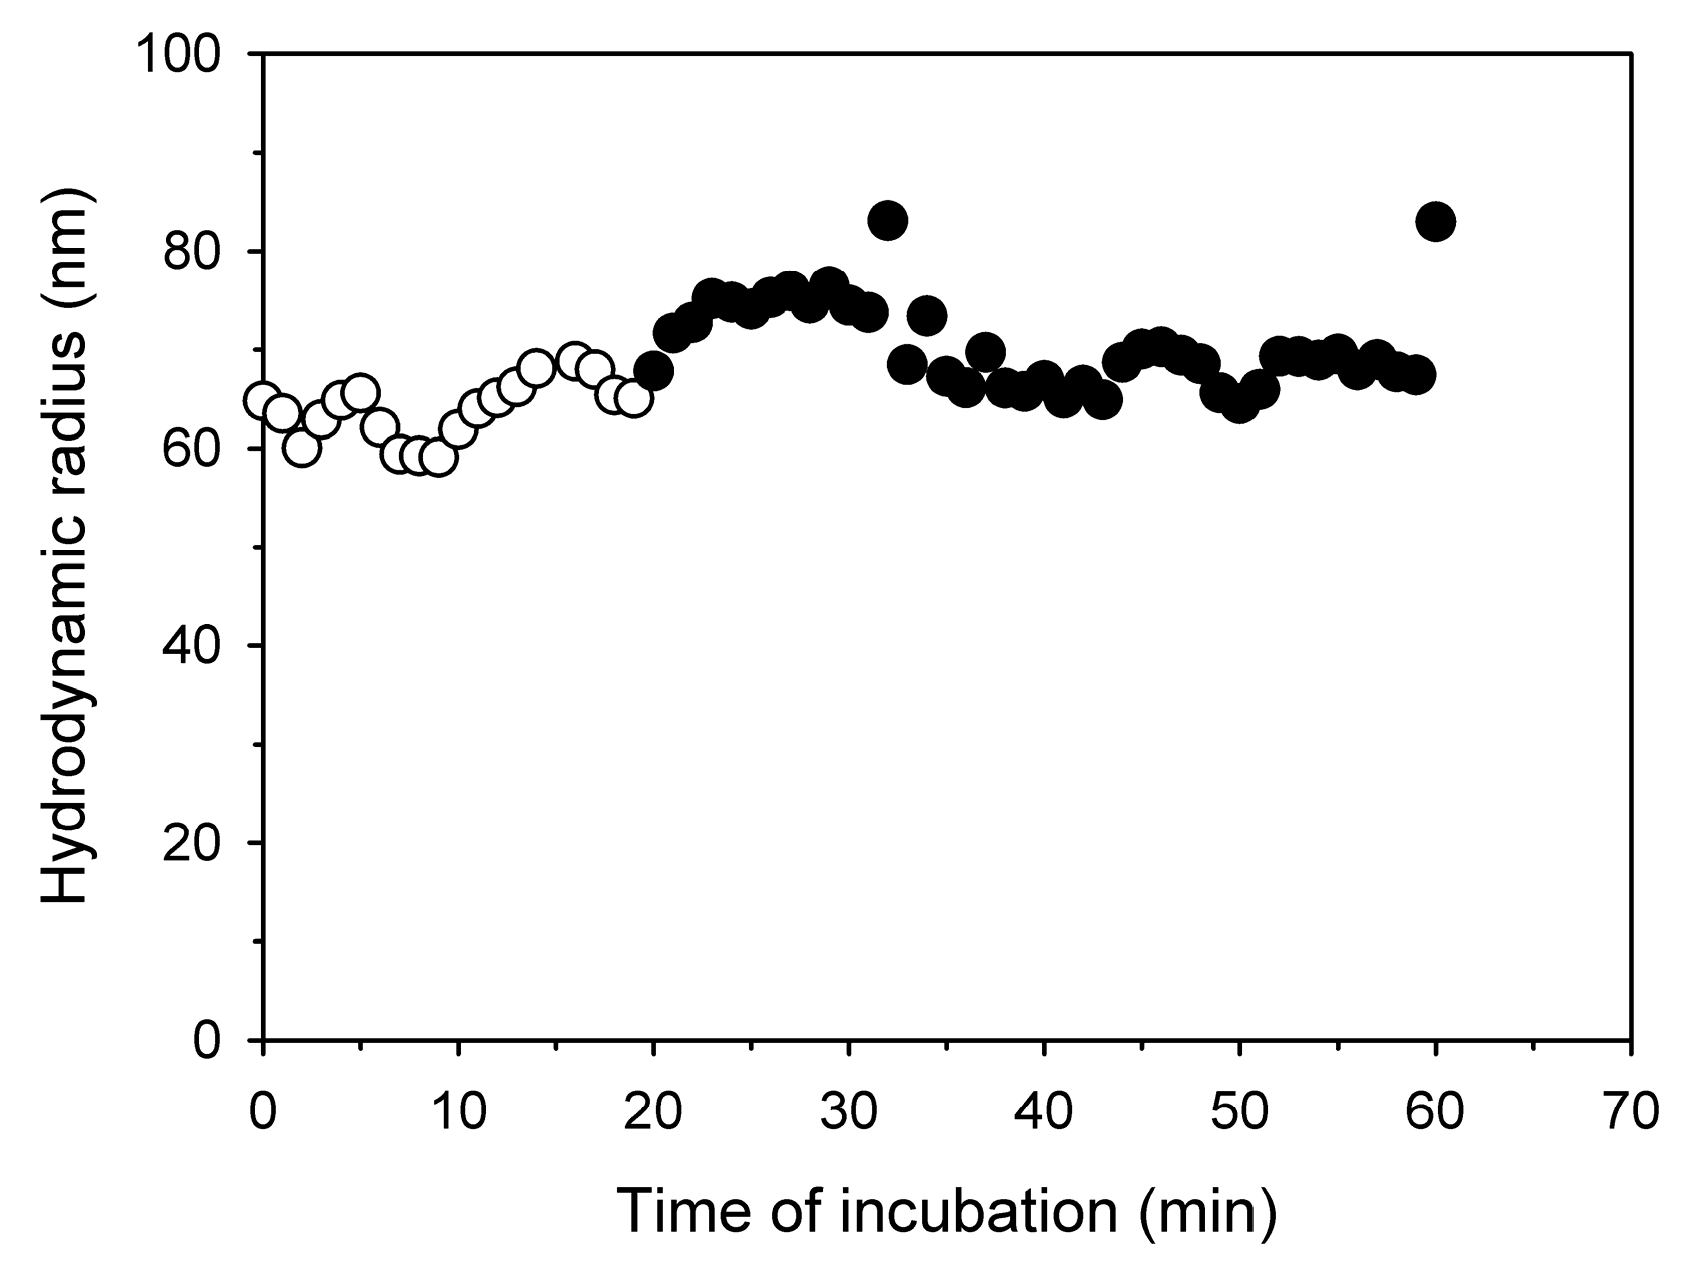
While the zeta potential gives an idea of the N/P ratio required for charge compensation, a direct evaluation of the polyplexes’ net-charge is possible in the gel retardation assay, Figure 2. According to this assay, polyplexes with an N/P ratio >3 (Nanostar) no longer move towards the anode in an electrical field, i.e., have a zero or positive net-charge. For comparison, similar observations are already made for l-PEI at N/P ratio >2.
3.2. Optimization of the Standard Transfection Protocol for Jurkat Cells
The polyplexes formed with the nanostars were then used in comparison to l-PEI as standard to transfect Jurkat cells, which served here as model cells for primary human T lymphocytes. For optimal transfection results, the cells should be rapidly dividing and in the exponential phase of growth. To assure this, standard transfection protocols call for passaging of the cells into fresh medium 24 h prior to transfection. For Jurkat cells, a seeding density of 0.1 × 10⁶ cells mL−1 is recommended by the supplier (ATCC). Transfection efficiencies improved, however, by 1.8-fold (~17% to ~30%), when the cells were instead seeded at 0.05 × 10⁶ cells mL−1 and transfected 12 h afterwards. Low seeding cell densities in this range are, incidentally, also recommended in nucleofection protocols for T lymphocytes.
Under these conditions, the nanostar was more efficient in transfecting the Jurkat cells than l-PEI, but also significantly more toxic, Table 2. The different N/P ratios (20 for l-PEI, 10 for the nanostar) used in these experiments were chosen because they had previously been identified to be the most suitable for Jurkat cells in experiments involving a variant of the nanostar with 20 arms and l-PEI as reference material [11].
In term of transfection efficiency, the results obtained here for the nanostars are better than the ones previously determined for nanostars of similar chemistry, [11] including some micellar constructs [31,32], while viabilities were lower. The l-PEI results are in the expected single digit range. l-PEI was chosen because in the past it showed in our hands less cytotoxicity at equal transfection efficiency in various cell lines. However, similar low transfection efficiency in Jurkat cells has been reported for bPEI [9].
The typical correlation between the efficiency and the toxicity of a non-viral transfection agent [33,34] is therefore also found in our case. It is generally considered difficult to uncouple the two effects. However, in a recent paper [31], we have shown that independent of the N/P ratio the cytotoxicity of the transfection cocktail depends strongly on the absolute amount of polymer added. This phenomenon has been obscured in most previous investigations by the fact that the N/P ratio is adjusted by keeping the pDNA amount constant while increasing that of the polycation.
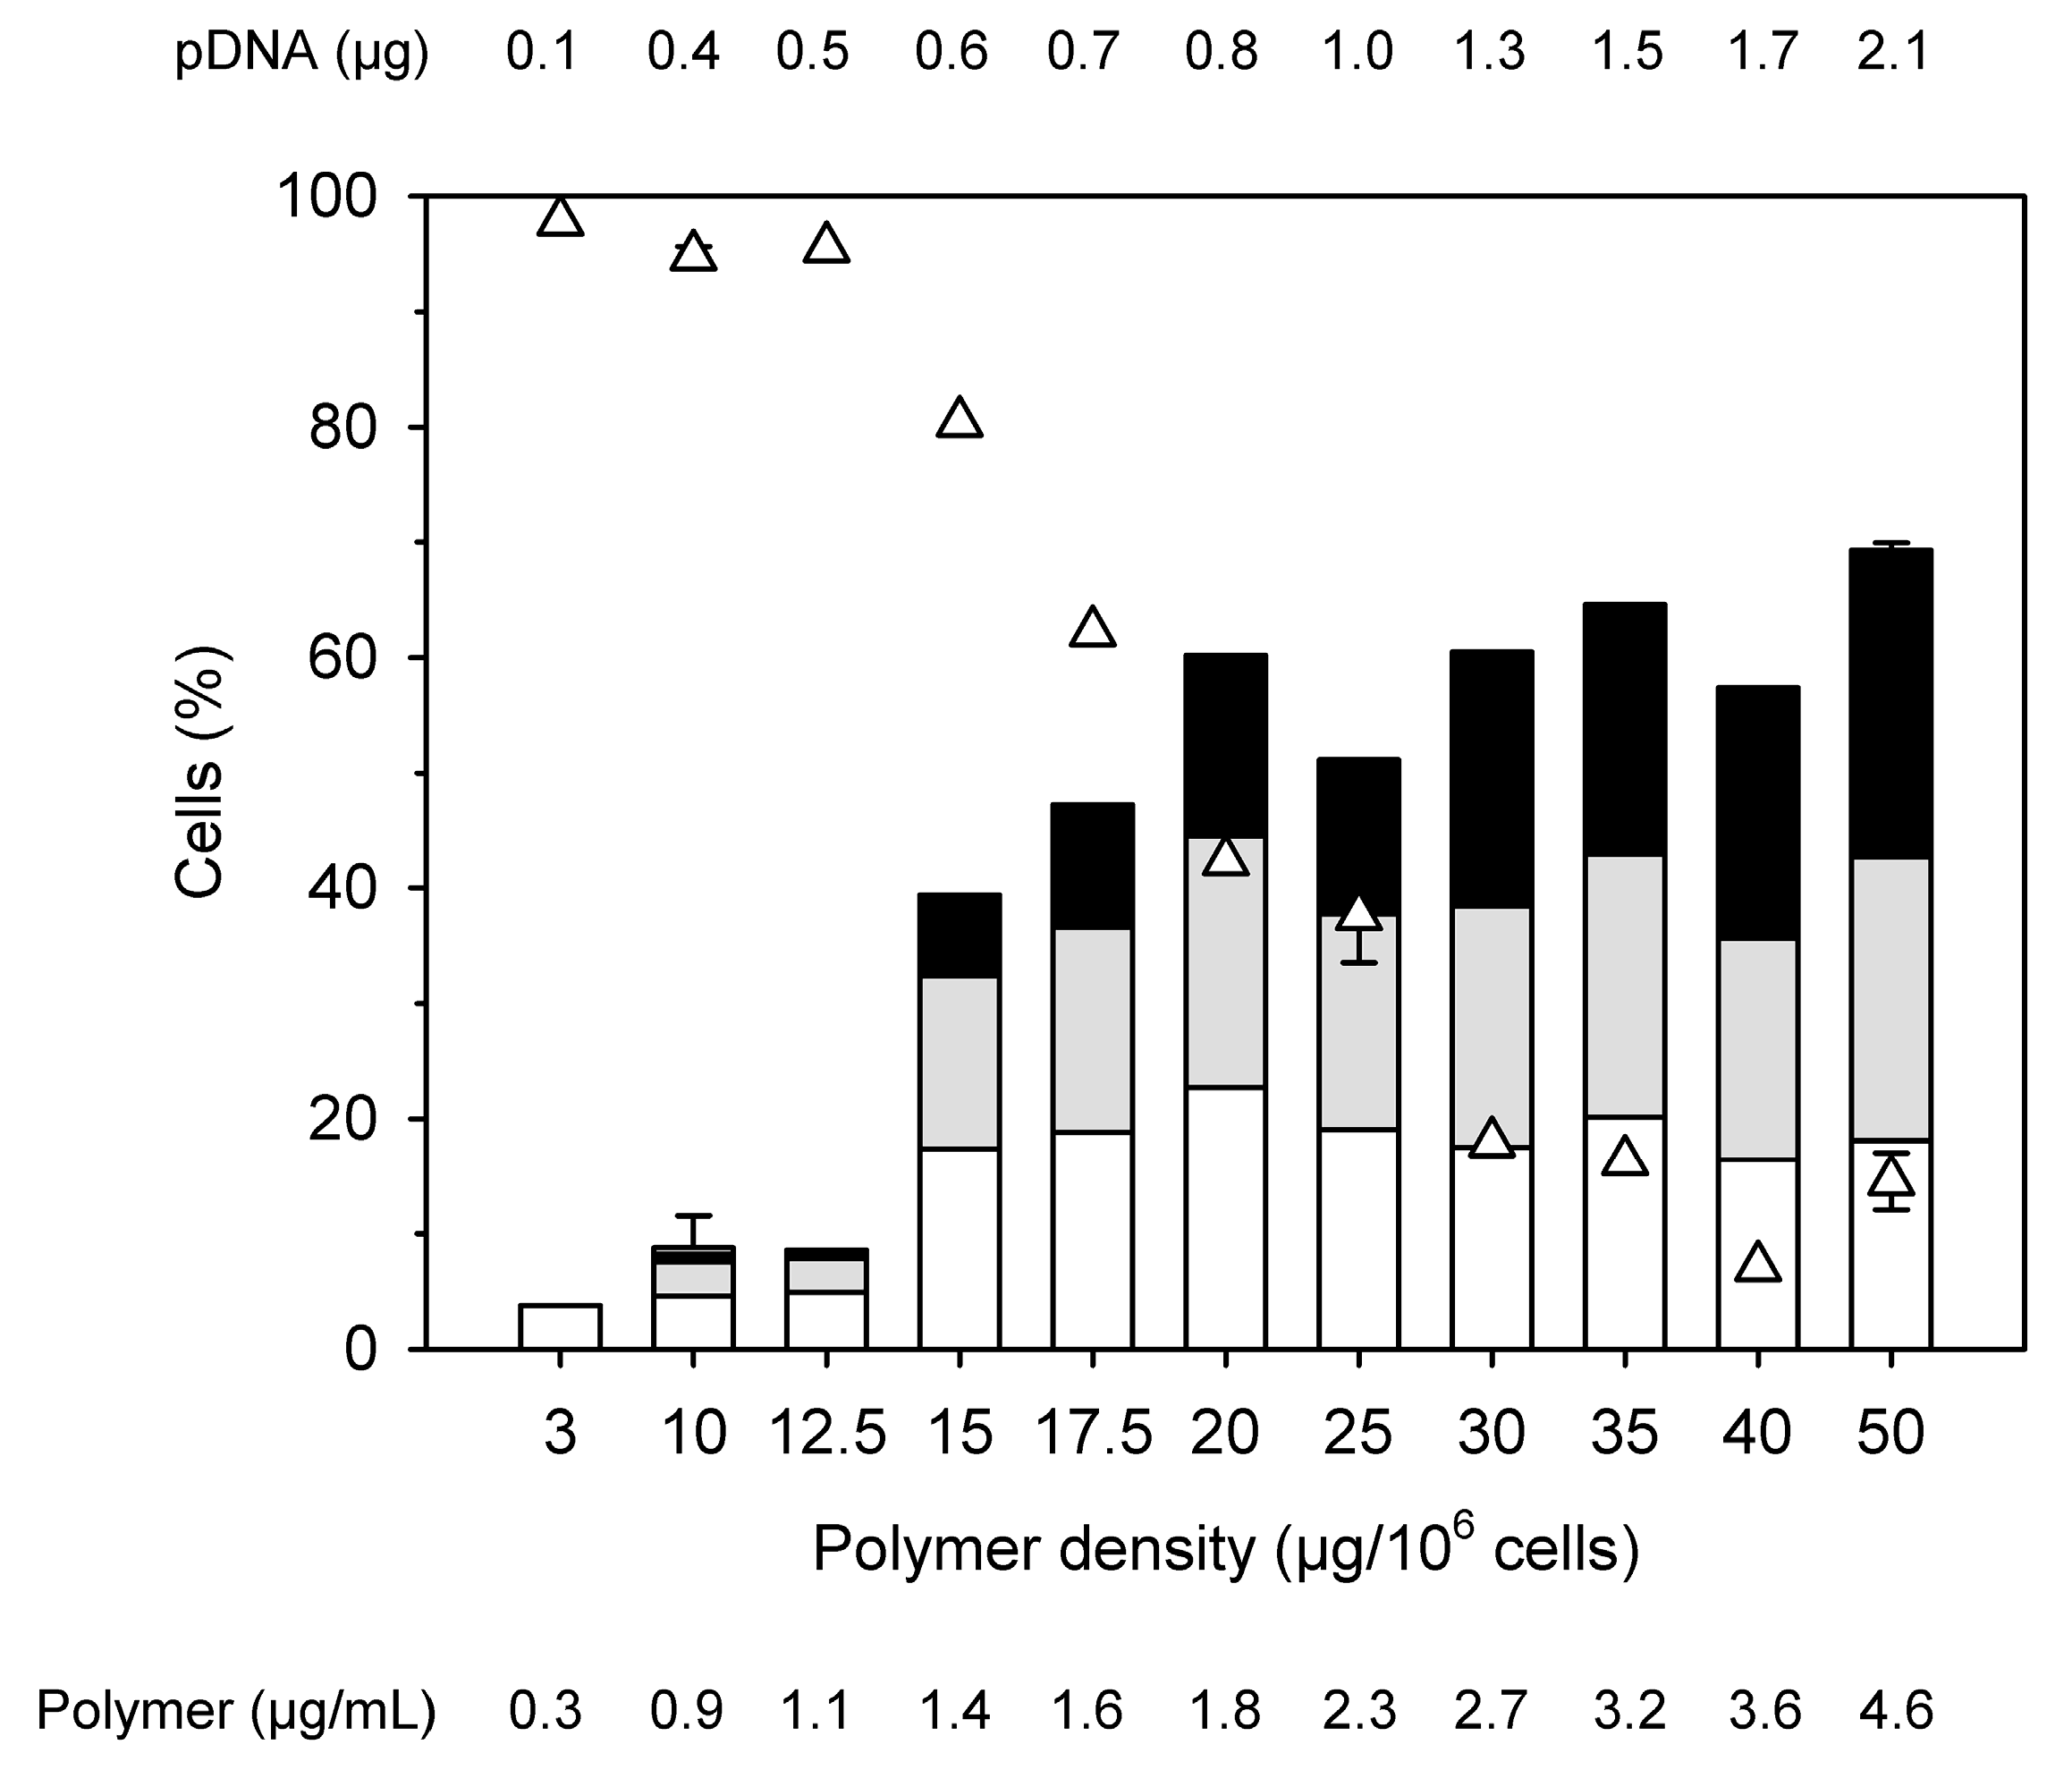
Polymer concentrations and N/P ratios in the standard protocol used here had been established and used with success for various mammalian cells [11]. However, in view of the low viability, Jurkat cells were subsequently transfected keeping a N/P ratio of 10 constant, but reducing the amount of added polyplex and thus the amount of polymer per cell (“polymer density”), Figure 3. Starting conditions in Figure 3, i.e., 2.1 µg pDNA per well and a polymer density of 50 µg per 106 cells correspond to the values in the standard protocol.
Transfection efficiency and viability show differences in their dependency on the polymer density. An optimum with >40% viable cells and a transfection efficiency of approximately 60% is reached at N/P 10 for a polymer density of 20 µg per 106 cells. Any further reduction of the polymer density (at N/P 10) would increase viability at the price of significantly reducing the transfection efficiency. Reduction of the polymer density (per cell) is linked with a dilution of the polyplexes in the transfection volume. We can speculate that, less polyplexes (i.e., lower concentration) will lower their frequency of contact with the surface of cells, and thus their transfection effectiveness under normal gravitational conditions. Therefore, it was next tested whether a reduction of the transfection volume (i.e., an increase in cells and polyplexes concentration) under otherwise identical conditions would improve the transfection efficiency while keeping the cytotoxicity unaffected.
The total amount of cells in all experiments was kept constant and the transfection volume was reduced (1.2 mL for 6-well plate). Polymer densities of 25 µg per 106, 15 µg per 106, and 10 µg per 106 cells were chosen to cover the range of interest, Table 3.
Transfection efficiencies and viabilities obtained in these experiments were similar as before. This indicates that increasing the concentration of the polyplexes 2-fold does not influence the transfection results and that it is indeed the polymer density which determined the outcome of the transfection. In consequence, the optimum result shown in Figure 3, i.e., a transfection efficiency of 60% at 42% viability, seems to be the best result an adaptation of the standard transfection protocol can give in the case of Jurkat cells. While considerably better, than anything l-PEI can produce, the low viability in particular is a concern, since any attempt to improve this value must be expected to dramatically reduce the transfection efficiency. For comparison, the Nucleofection technology has been reported to reach transfection efficiencies of >85% at 90% viability [35].
3.3. High Cell Density Transfection of Jurkat Cells
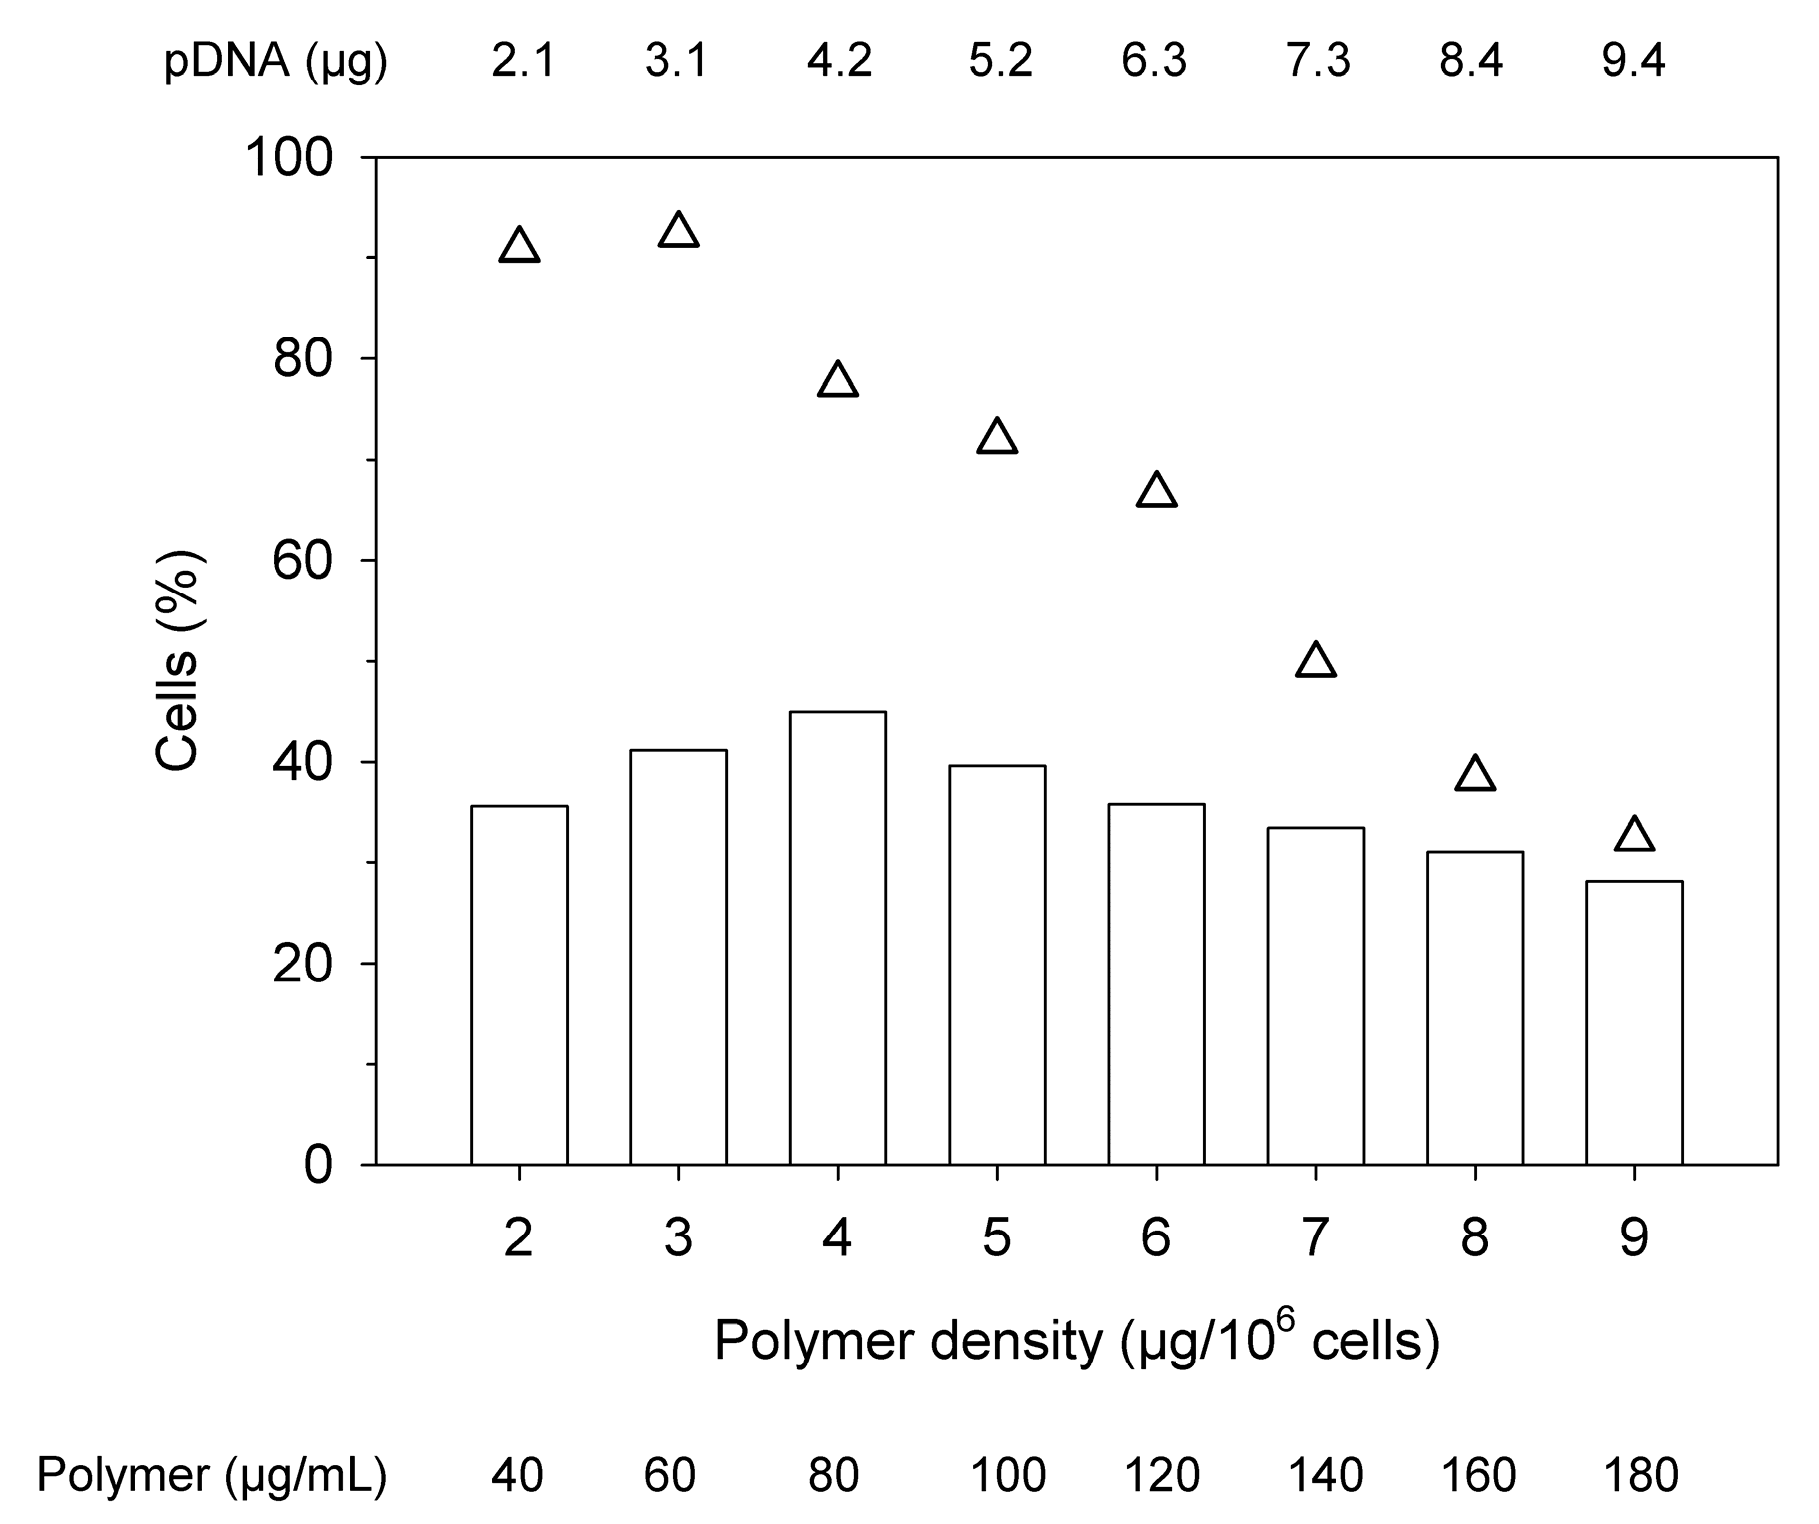
The high cell density (HCD) protocol developed here for the transfection of Jurkat cells was based on a protocol originally developed for CHO and HEK293 cells [25]. One major difference for HCD protocol is that a high density cell suspension and the pDNA are premixed and then the polycation is added. In a first condition screening experiment, the cells were transfected in Eppendorf tubes at a density of 20 × 106 cells mL−1 in Opti-MEM varying again the absolute amount of pDNA and polymer added, while keeping an N/P ratio of 10, Figure 4. The transfections were performed at 37 °C under constant agitation (cell rotator, 20 rpm). After 4 h of incubation, the cell density was adjusted to 1 × 10⁶ cells mL−1 by dilution R10.
Two things are remarkable about these results. Firstly, much lower polymer densities suffice for maximum transfection in the HDC protocol, where the highest transfection efficiency (45%) was observed when using 4 µg of polymer per 106 cells. This suggests, as postulated before for the 6-well transfection, that the “molecular spacing”, i.e., the likelihood of a contact between cells and polymers, influences the outcome of the transfection. Secondly, these high transfection rates are apparently still compatible with good viability (>75% for 4 µg of polymer per 106 cells). Incidentally, when l-PEI was tested in the HCD transfection protocol, transfection efficiencies below 5% were obtained. l-PEI was therefore not tested any further.
In general, the viability showed the expected dependency on the polymer density. However, due to the higher cell numbers (20 × 106 cells mL−1 in the HCD protocol, 0.09 × 10⁶ cells mL−1 in the standard protocol), higher polymer concentrations are needed to achieve a certain polymer density in the HCD protocol, which in turn has an effect on the viability. For example, 10 µg of polymer per 106 cells still leaves over 90% of the cells viable in the standard protocol, Figure 3, while 9 µg per 106 cells reduced the viability of the cells to less than 40% in the HCD protocol, Figure 4. The fact that the polymer is added as a free agent in the HCD protocol, whereas polyplexes are used in the standard protocol, may also increase the cytotoxic effect of the transfection agent.
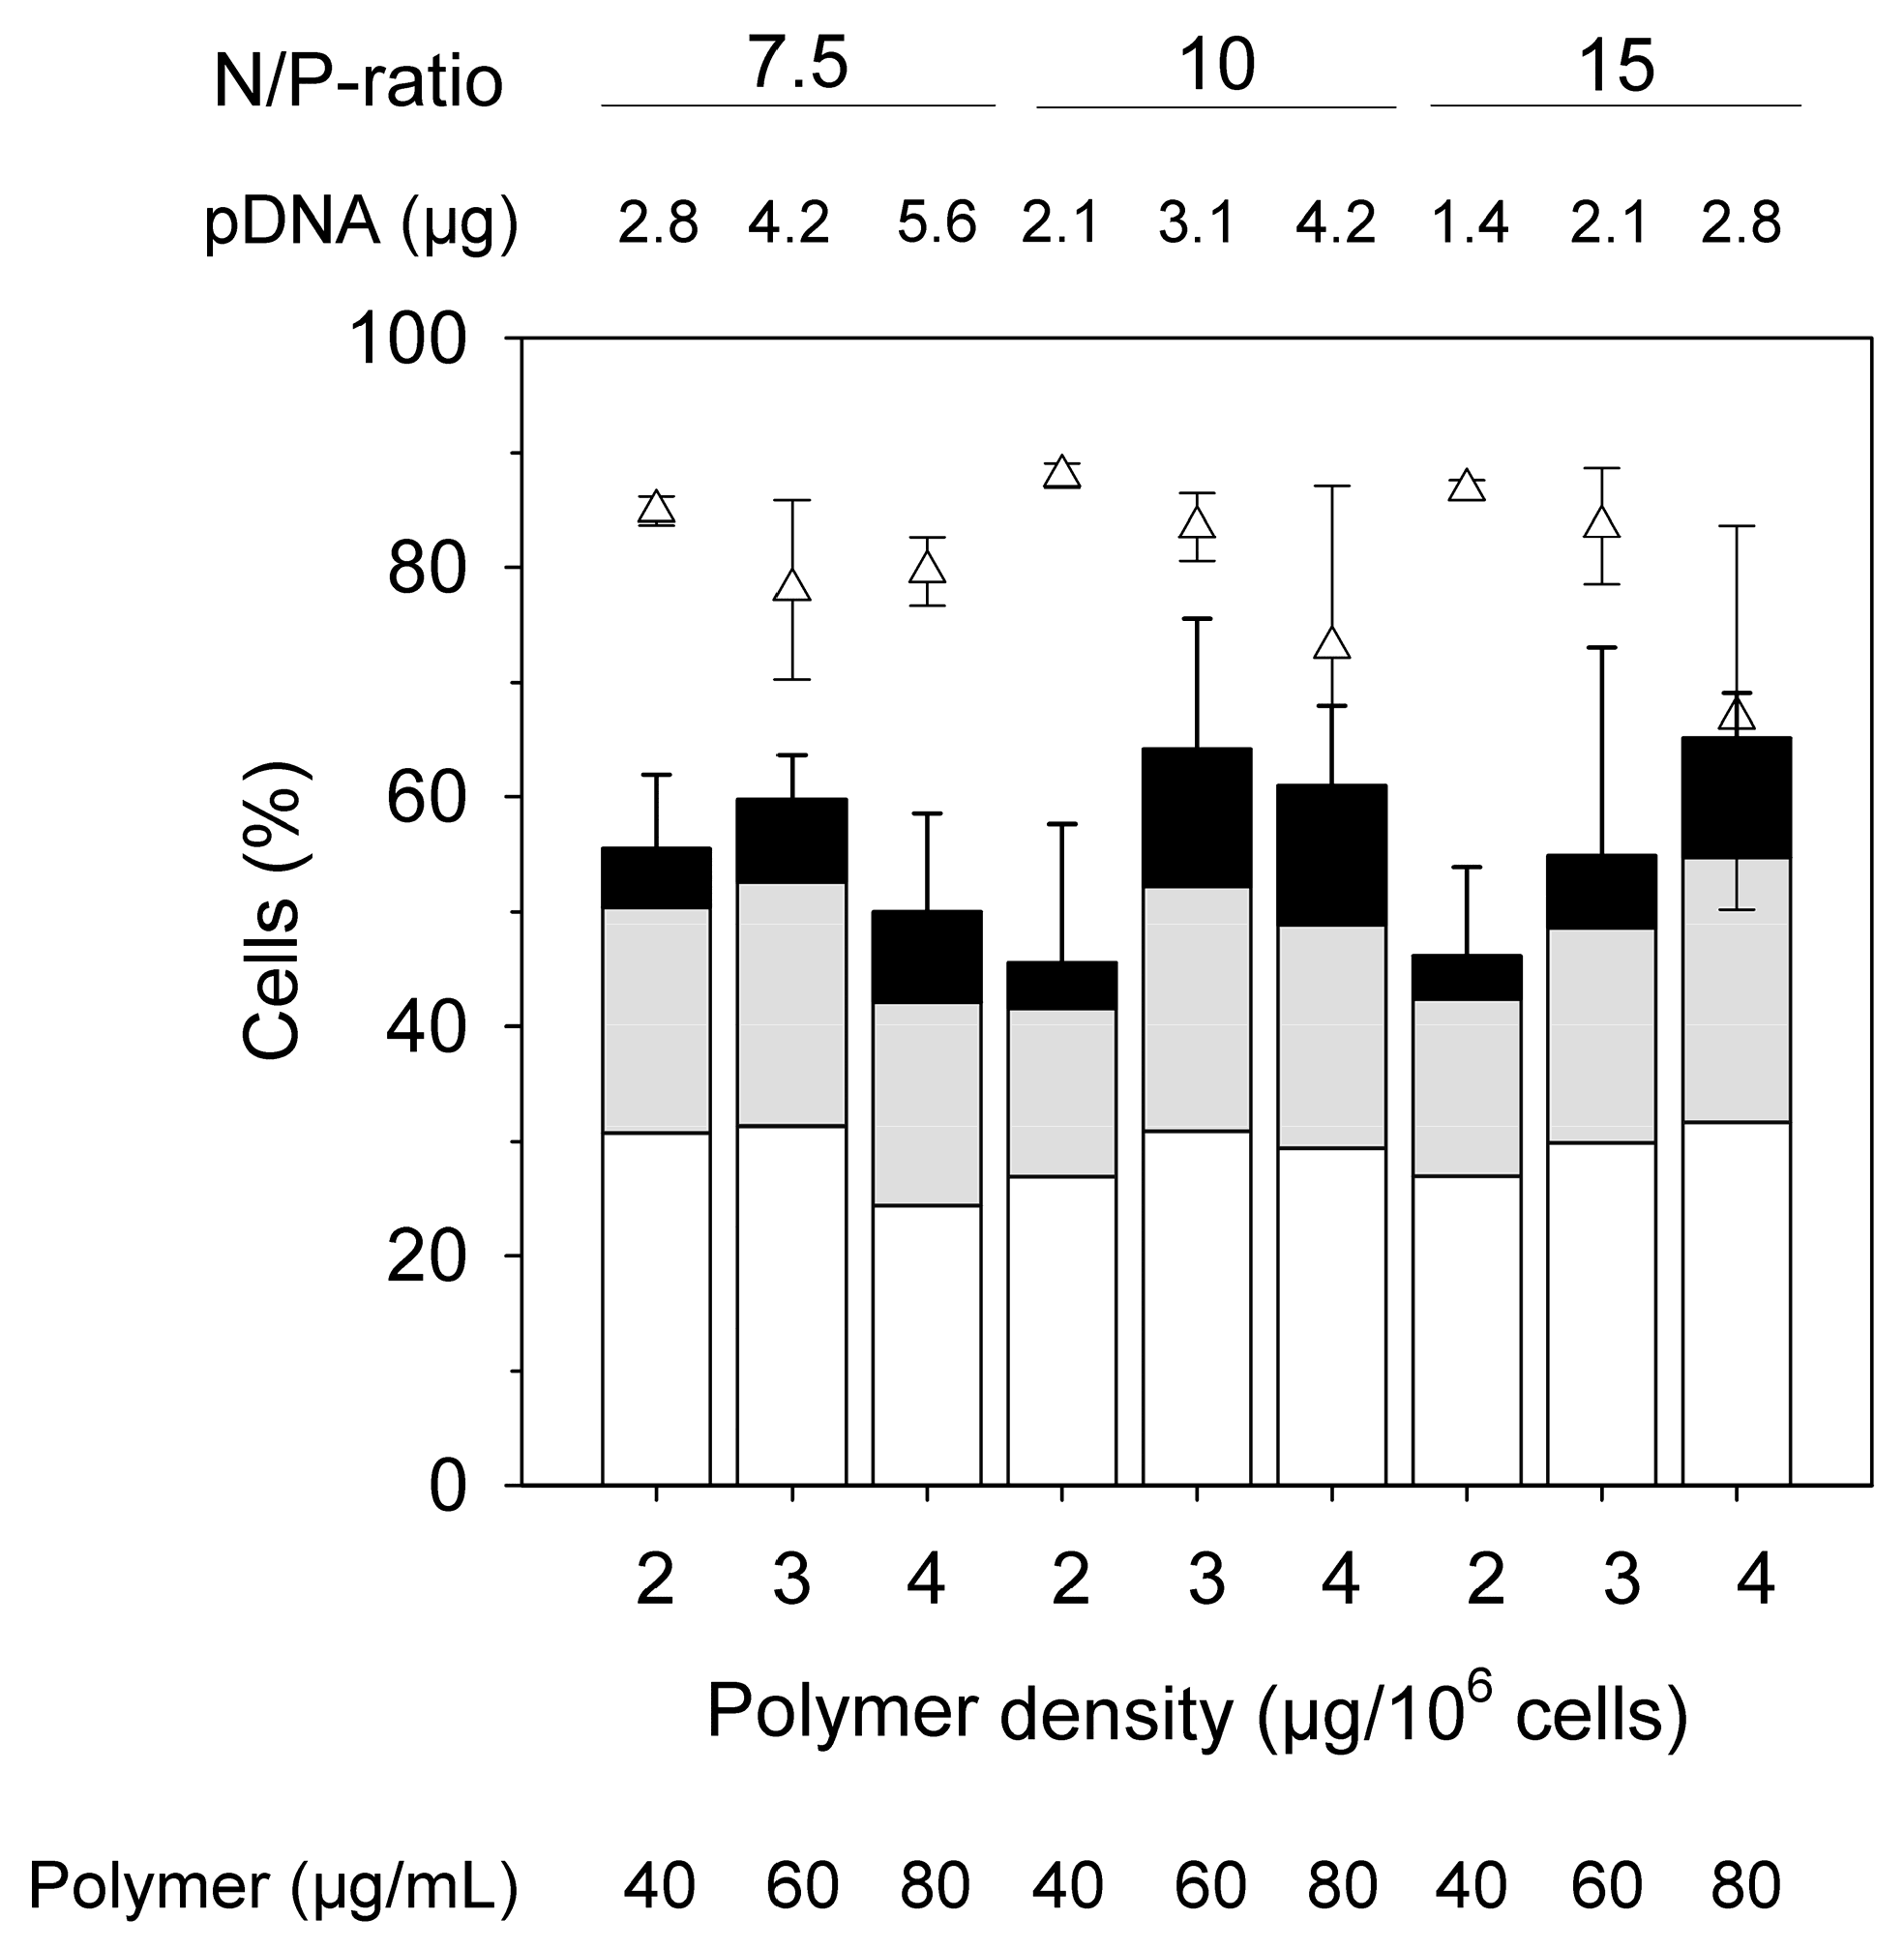
According to the supplier of the cells (ATCC), Jurkat cells are sensitive towards high cell densities and should in principle be maintained between 1 × 10⁵ viable cells mL−1 and 1 × 10⁶ viable cells mL−1 throughout. In an attempt to further improve the transfection efficiency, the dilution factor post-transfection was increase to 80 to achieve a density of 0.25 × 10⁶ cells mL−1 at the beginning of the cultivation. In addition, the N/P ratio was varied (7.5, 10, 15) for polymer densities of 2 µg per 106 cells, 3 µg per 106 cells, and 4 µg per 106 cells, Figure 5.
The transfection efficiencies measured 48 h post-transfection showed no statistically relevant variation in these experiments (p < 0.05), while they were higher than the ones in Figure 4. This might eventually be ascribed to a better fitness of the cells due to the lower seeding cell density post-transfection. The distribution over low, middle, and high producers is also similar. Cell viabilities were generally high (≥60%). Again, observable differences were not statistically relevant.
The scale of the HCD protocol was subsequently increased to 108 cells (Falcon tube, 5 mL transfection volume) as well as to 2 × 10⁹ cells (Falcon tubes, 2 × 25 mL), all the time adjusting a polymer density of 3 µg polymer per 106 cells. To accommodate the largest transfection volume (50 mL), only the addition of the polymer to the DNA/cell mixture took place in Falcon tubes (assumed to allow more rapid mixing), while the subsequent incubation was already performed in a 100 mL spinner flask stirred continuously at 70 rpm. Only a N/P of 10 was investigated for the largest scale. Results are summarized in Table 4.
Transfection efficiencies and viabilities obtained at larger scale were similar to those obtained in the corresponding small-scale experiments, Figure 5, but higher than the ones obtained during the conditions screening experiment Figure 4. Throughout, approximately 70% of the cells remained viable, out of which 70% were also transfected. The distribution over low, middle, and high producers was also similar to that of the small-scale experiments. An HCD transfection of Jurkat cells can thus be used to efficiently transfect at least up to 2 × 10⁹ Jurkat cells at a time with tolerable mortality and should easily be scalable beyond this point by keeping the polymer density at 3 µg per 106 cells. This approach may hence be convenient in the context of T cells therapy, where large number of cells need to be transiently transfected.
3.4. Adaptation of the Standard Protocol to Eppendorf Tubes
Finally, the standard protocol, originally developed for a plate-based geometry, was adapted to the Eppendorf tube format. In this case, the harvested cells (stored on ice) were directly suspended in the polyplex-in-medium suspension (0.25 mL). As a result, the polymer concentration during transfection is 4.8-fold to 8.8-fold higher in the tubes than in the plates with 1.2 mL and 2.2 mL transfection volumes, respectively. Polymer densities of 50 µg per 106 cells, 25 µg per 106 cells, 15 µg per 106 cells, and 10 µg per 106 cells were adjusted in these experiments to cover the range of interest. The N/P ratio was again set to 10.
When the standard incubation time of 4 h was chosen, cells did not survive. When the incubation time with the polyplexes was lowered to 2 h, better results were obtained, Table 5. Moreover, in all cases, a polymer density of 50 µg polymer/106 cells was too toxic for the cells.
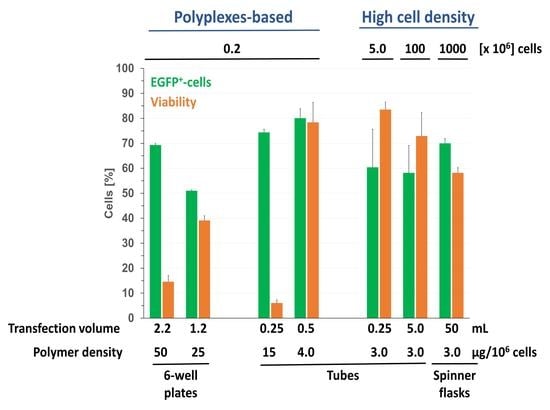
Compared to the results for the 6-well plates (Figure 3), higher transfection efficiencies were reached, but viabilities were low. This supports our assumption that the molecular spacing during the transfection is a relevant parameter to consider. Doubling the transfection volume to 0.5 mL, while keeping the polymer density constant (15 µg per 106 cells), led to an increase in viability by a factor of 7.4 (45.1%) while the transfection efficiency increased to 90.9% (12% low producer, 45% middle producer, 34% high producer), arguing that the polymer concentration, which had served well in the 6 well plate format, was too high in case of the Eppendorf tube format. Indeed, when the polymer density was lowered to values more typical of the HCD transfection protocol (see above), viabilities and transfection efficiencies improved, in particular, when the incubation time was further reduced (90 min, 30 min, 15 min), Figure 6.
At incubation times of 30 and in particular 90 min (Figure 6A,B), low polymer densities of 5 and 4 µg per 106 of cells resulted in excellent transfection efficiencies of ≥80% at viabilities of more than 80%. However, an incubation time of only 15 min was obviously too short to achieve transfection, Figure 6C. The cytotoxic response, on the other hand, is very fast and can be already be detected within the first 15 min of incubation and might be due to plasma membrane permeabilization. Moreover, in comparison to the experiments in 6-well plates, the level of transgene expression was shifted towards middle and high producers, when the cells were transfected in Eppendorf tubes. Interestingly, the transfection efficiency but not the viability seemed to pass through a minimum in these experiments. Low polymer densities thus achieve good transfection efficiency, while being gentle on the cells.
In the Eppendorf tube protocol, cells and polyplexes are used at higher concentrations than in the standard 6-well format. For polymer concentrations ≤2.4 µg mL−1, this does not extensively influence the viability (60%) but dramatically improves the transfection efficiency (compare Figure 3 and Figure 6A). Moreover, cells are directly suspended in the polyplex preparation in the Eppendorf protocol and thus will settle together in response to gravity at the bottom of the tube during incubation. Creating a high local polyplex concentration presumably enforces interactions between cells and polyplexes. It has, e.g., been known for some time, that the transfection efficiency can be increased using centrifugal forces to promote sedimentation of small polyplexes over adherent cells [36]. The result is an intensification of the contact frequency and a reduction of mass transfer limitations. Both lead to an acceleration of the transfection kinetics, which in turn allows a reduction of the incubation time. Since DNA uptake and cytotoxic effects are both time dependent, this creates a situation where a significant number of cells take up sufficient amounts of DNA to allow transgene expression 48 h later, while surviving the procedure in large numbers. Thus, for the first time, it is possible to chemically transfect Jurkat cells with both a transfection efficiency and a viability above 80%. Such results have only been obtained so far with nucleofection kits [35], which are associated with high costs and might not be suitable for large-scale experiments.
The level of transgene expression is also improved in the Eppendorf tube protocol. Improved transgene expression can, e.g., be the results of an improved cellular uptake (i.e., more DNA molecules enter the cells), an improved nuclear uptake (i.e., more DNA molecules enter the nucleus), or improved transcription (i.e., the transcriptional activity of the CMV promoter is upregulated). The cellular uptake can be enhanced due to the increased frequency of contact between cells and polyplexes as postulated above and might in turn lead to higher amounts of pDNA in the nucleus. The transcriptional activity of the CMV promoter used here to drive EGFP expression is sensitive to a variety of environmental stresses (e.g., osmotic shock, oxidative stress) and can be upregulated via an intracellular stress-activated Mitogen-Activated Protein (MAP) kinase pathway [37]. In the past, PEI-based polyplexes have been shown to induce the generation of reactive oxygen species (ROS) [38,39]. A similar effect by the polyplexes used in this study on the generation of ROS, could therefore have activated transcription via the CMV promoter. Further, the adaptation of the standard protocol to the Eppendorf format required several changes in the cell manipulation (i.e., extended storage on ice, centrifugation steps), which might also influence the cell physiology.
3.5. Transfection of Primary Human T Cells
Both the Eppendorf and the HCD protocol were subsequently applied in preliminary experiments to the transfection of activated T cells from two different donors. The results are summarized in Table 6.
Obviously, transfection efficiencies are much lower for the primary T cells. This was to be expected, as the experiments with the Jurkat cells had shown that cells are highly sensitive to even small changes in the transfection conditions. Further optimization of the protocols is obviously necessary, before it can be applied to primary T cells. However, even in these highly preliminary experiments, transfection efficiencies were consistently above the values for the controls, something which is not the case for primary T cells transfected with l-PEI [11].
The experimental replicates generally show variations up to three-fold for the transfection efficiency. The major differences between the experiments was that the polyplexes were prepared in parallel whereas their addition to the cells was time delayed (15 min to 20 min), i.e., storage of the cells (on ice during the Eppendorf tubes protocol) and incubation of the polyplexes (at room temperature) was slightly longer in the second replicate. Whether these differences are responsible for the higher transfection efficiencies observed is currently under investigation in our laboratory. At any rate, some similarities to the Jurkat cell results can be observed. While a polymer density of 3 µg per 106 cells seems adequate in the HCD protocol, for the Eppendorf tubes protocol 6 µg seem more suitable. Independently of the donor, for Eppendorf tubes but not for HCD transfections, the higher the transfection efficiency is, the lower the viability tends to be. Similar trends were observed for Jurkat cells during the optimization experiments. Finally, cells from donor 1 performed well in the Eppendorf tube, but not in the HCD protocol, while the opposite was the case for cells from donor 2. Here, one should notice that the level of activation of the cells was slightly different for both donors, Table 6. We cannot exclude that the level of activation of the T lymphocytes might be responsible for the observed results. Beside the activation status of the T lymphocytes, cell density, pDNA dose, supplementation of the post-transfection cultivation medium with cytokines have been recently proposed as additional parameters that should be optimized during the development of transfection protocols for human primary T cells [9].
4. Conclusions
It has been speculated that the inability of PEI to transfect blood cells such as T lymphocytes might be partly related to uptake and intracellular trafficking. The polycationic transfection agent PDMAEMA, is indeed more suitable to transfect the human leukemia T cells (Jurkat cells) chosen in this study as model cells for primary T lymphocytes. This might be related to a different uptake mechanism as speculated recently by our group [20]. However, in the standard transfection protocol, transfection efficiencies >70% could only be achieved at severely reduced viabilities. Better results were obtained in a high cell density (HCD) transfection protocol, where the transfection agent (PDMAEMA-nanostar) is added directly to the cell/pDNA mixture and where transfection efficiencies >70% are easily combined with viabilities >70%. Even better results (>80% transfected cells at >80% viability) were obtained in a protocol where polyplexes were used to transfect the cells in an Eppendorf tube. Both protocols use higher cell densities. This intensifies the interaction with the polyplexes and accelerates the transfection kinetics, which inter alia allows lowering the amounts of polymer per 106 cells used and in consequence the cytotoxicity of the process. Whereas the Eppendorf tube protocol could in future be used to effectively transfect cells at small scale for research purposes, the HCD protocol has excellent scale up potential and thus could eventually become the basis for medical applications of T cell therapies. Both protocols were tested for the transfection of primary T cells from two different donors. In these preliminary experiments, the obtained transfection efficiencies were lower than for the Jurkat cells, but significantly better than with l-PEI. Moreover, the cells from the two donors showed distinct differences in their reaction to the conditions of the protocols, which presents the starting point for further optimizations currently under way in our laboratory.
Author Contributions
S.A.B.R., A.R., V.J., and R.F. conceived and designed the experiments; S.A.B.R., A.R., and P.K. performed the experiments; S.A.B.R., A.R., P.K., V.J., and R.F. analyzed the data; C.V.S. synthesized and characterized the nanostar; V.J. and R.F. wrote the paper.
Funding
This work was funded by the Upper Franconian Trust (Oberfrankenstiftung, Bayreuth, Germany) grant P-Nr.: 03847.
Acknowledgments
Andrea Schott supported this study by purifying the plasmid. Daniel Manco and Max Puhlmann supported this study by performing some of the transfections in 6-well plates and all the polyplexes-based transfections in Eppendorf tubes. Oliver Riester supported this study by performing some of the HCD transfections.
Conflicts of Interest
The authors declare no conflict of interest. The founding sponsor had no role in the design of the study; in the collection, analyses, or interpretation of data; in the writing of the manuscript, and in the decision to publish the results.
References
- Fischbach, M.A.; Bluestone, J.A.; Lim, W.A. Cell-based therapeutics: The next pillar of medicine. Sci. Transl. Med. 2013, 5, 179ps7. [Google Scholar] [CrossRef] [PubMed]
- Fesnak, A.D.; June, C.H.; Levine, B.L. Engineered T cells: The promise and challenges of cancer immunotherapy. Nat. Rev. Cancer 2016, 16, 566–581. [Google Scholar] [CrossRef] [PubMed]
- Su, S.; Hu, B.; Shao, J.; Shen, B.; Du, J.; Du, Y.; Zhou, J.; Yu, L.; Zhang, L.; Chen, F. CRISPR-Cas9 mediated efficient PD-1 disruption on human primary T cells from cancer patients. Sci. Rep. 2016, 6, 20070. [Google Scholar] [CrossRef] [PubMed] [Green Version]
- Hardee, C.L.; Arévalo-Soliz, L.M.; Hornstein, B.D.; Zechiedrich, L. Advances in Non-Viral DNA Vectors for Gene Therapy. Genes 2017, 8, 65–87. [Google Scholar] [CrossRef] [PubMed]
- Morgan, R.A.; Boyerinas, B. Genetic Modification of T Cells. Biomedicines 2016, 4, 9–23. [Google Scholar] [CrossRef] [PubMed]
- Kanthou, C.; Kranjc, S.; Sersa, G.; Tozer, G.; Zupanic, A.; Cemazar, M. The endothelial cytoskeleton as a target of electroporation-based therapies. Mol. Cancer Ther. 2006, 5, 3145–3152. [Google Scholar] [CrossRef] [PubMed] [Green Version]
- Pehlivanova, V.N.; Tsoneva, I.H.; Tzoneva, R.D. Multiple effects of electroporation on the adhesive behaviour of breast cancer cells and fibroblasts. Cancer Cell Int. 2012, 12, 9–23. [Google Scholar] [CrossRef] [PubMed]
- McManus, M.T. Small interfering RNA-mediated gene silencing in T lymphocytes. J. Immunol. 2002, 169, 5754–5760. [Google Scholar] [CrossRef] [PubMed]
- Olden, B.R.; Cheng, Y.; Yu, J.L.; Pun, S.H. Cationic polymers for non-viral gene delivery to human T cells. J. Control. Release 2018, 282, 140–147. [Google Scholar] [CrossRef] [PubMed]
- O’Neill, M.M.; Kennedy, C.A.; Barton, R.W.; Tatake, R.J. Receptor-mediated gene delivery to human peripheral blood mononuclear cells using anti-CD3 antibody coupled to polyethylenimine. Gene Ther. 2001, 8, 362–368. [Google Scholar] [CrossRef] [PubMed] [Green Version]
- Schallon, A.; Synatschke, C.V.; Jérôme, V.; Müller, A.H.E.; Freitag, R. Nanoparticulate nonviral agent for the effective delivery of pDNA and siRNA to differentiated cells and primary human T lymphocytes. Biomacromolecules 2012, 13, 3463–3474. [Google Scholar] [CrossRef] [PubMed]
- Kjellen, L.; Lindahl, U. Proteoglycans: Structures and interactions. Annu. Rev. Biochem. 1991, 60, 443–475. [Google Scholar] [CrossRef] [PubMed]
- Hess, G.T.; Humphries, W.H.T.; Fay, N.C.; Payne, C.K. Cellular binding, motion, and internalization of synthetic gene delivery polymers. Biochim. Biophys. Acta 2007, 1773, 1583–1588. [Google Scholar] [CrossRef] [PubMed]
- Payne, C.K.; Jones, S.A.; Chen, C.; Zhuang, X. Internalization and trafficking of cell surface proteoglycans and proteoglycan-binding ligands. Traffic 2007, 8, 389–401. [Google Scholar] [CrossRef] [PubMed]
- Ruponen, M.; Yla-Herttuala, S.; Urtti, A. Interactions of polymeric and liposomal gene delivery systems with extracellular glycosaminoglycans: Physicochemical and transfection studies. Biochim. Biophys. Acta 1999, 1415, 331–341. [Google Scholar] [CrossRef]
- Paris, S.; Burlacu, A.; Durocher, Y. Opposing Roles of Syndecan-1 and Syndecan-2 in Polyethyleneimine-mediated Gene Delivery. J. Biol. Chem. 2008, 283, 7697–7704. [Google Scholar] [CrossRef] [PubMed] [Green Version]
- Mozley, O.L.; Thompson, B.C.; Fernandez-Martell, A.; James, D.C. A mechanistic dissection of polyethylenimine mediated transfection of CHO cells: To enhance the efficiency of recombinant DNA utilization. Biotechnol. Prog. 2014, 30, 1161–1170. [Google Scholar] [CrossRef] [PubMed]
- Fadnes, B.; Husebekk, A.; Svineng, G.; Rekdal, Ø.; Yanagishita, M.; Kolset, S.O.; Uhlin-Hansen, L. The proteoglycan repertoire of lymphoid cells. Glycoconj. J. 2012, 29, 513–523. [Google Scholar] [CrossRef] [PubMed] [Green Version]
- Verdurmen, W.P.; Wallbrecher, R.; Schmidt, S.; Eilander, J.; Bovee-Geurts, P.; Fanghanel, S.; Burck, J.; Wadhwani, P.; Ulrich, A.S.; Brock, R. Cell surface clustering of heparan sulfate proteoglycans by amphipathic cell-penetrating peptides does not contribute to uptake. J. Control. Release 2013, 170, 83–91. [Google Scholar] [CrossRef] [PubMed]
- Raup, A.; Wang, H.; Synatschke, C.V.; Jérôme, V.; Agarwal, S.; Pergushov, D.V.; Müller, A.H.E.; Freitag, R. Compaction and Transmembrane Delivery of pDNA: Differences between l-PEI and Two Types of Amphiphilic Block Copolymers. Biomacromolecules 2017, 18, 808–818. [Google Scholar] [CrossRef] [PubMed]
- Huls, M.H.; Figliola, M.J.; Dawson, M.J.; Olivares, S.; Kebriaei, P.; Shpall, E.J.; Champlin, R.E.; Singh, H.; Cooper, L.J.N. Clinical Application of Sleeping Beauty and Artificial Antigen Presenting Cells to Genetically Modify T Cells from Peripheral and Umbilical Cord Blood. J. Vis. Exp. 2013, 72, e50070. [Google Scholar] [CrossRef] [PubMed]
- Potter, H.; Heller, R. Transfection by Electroporation. Curr. Protoc. Mol. Biol. 2003, 121, 9.3.1–9.3.13. [Google Scholar] [CrossRef]
- Backliwal, G.; Hildinger, M.; Hasija, V.; Wurm, F.M. High-density transfection with HEK-293 cells allows doubling of transient titers and removes need for a priori DNA complex formation with PEI. Biotechnol. Bioeng. 2008, 99, 721–727. [Google Scholar] [CrossRef] [PubMed]
- Baldi, L.; Hacker, D.L.; Meerschman, C.; Wurm, F.M. Large-scale transfection of mammalian cells. Methods Mol. Biol. 2012, 801, 13–26. [Google Scholar] [CrossRef] [PubMed]
- Derouazi, M.; Girard, P.; Van Tilborgh, F.; Iglesias, K.; Muller, N.; Bertschinger, M.; Wurm, F.M. Serum-free large-scale transient transfection of CHO cells. Biotechnol. Bioeng. 2004, 87, 537–545. [Google Scholar] [CrossRef] [PubMed]
- Chen, B.; Synatschke, C.V.; Jérôme, V.; Müller, A.H.E.; Freitag, R.; Wu, C. Co-transfection of star-shaped PDMAEMAs enhance transfection efficiency of protamine/pDNA complexes in the presence of serum. Eur. Pol. J. 2018, 103, 362–369. [Google Scholar] [CrossRef]
- Durocher, Y.; Perret, S.; Kamen, A. High-level and high-throughput recombinant protein production by transient transfection of suspension-growing human 293-EBNA1 cells. Nucleic Acids Res. 2002, 30, E9. [Google Scholar] [CrossRef] [PubMed]
- Jérôme, V.; Werner, M.; Kaiser, P.; Freitag, R. Creating a Biomimetic Microenvironment for the Ex Vivo Expansion of Primary Human T Lymphocytes. Macromol. Biosci. 2017, 17, 1700091. [Google Scholar] [CrossRef] [PubMed]
- dos Santos, T.; Varela, J.; Lynch, I.; Salvati, A.; Dawson, K.A. Effects of transport inhibitors on the cellular uptake of carboxylated polystyrene nanoparticles in different cell lines. PLoS ONE 2011, 6, e24438. [Google Scholar] [CrossRef] [PubMed]
- Van Gaal, E.V.; Spierenburg, G.; Hennink, W.E.; Crommelin, D.J.; Mastrobattista, E. Flow cytometry for rapid size determination and sorting of nucleic acid containing nanoparticles in biological fluids. J. Control. Release 2010, 141, 328–338. [Google Scholar] [CrossRef] [PubMed]
- Raup, A.; Stahlschmidt, U.; Jérôme, V.; Synatschke, C.V.; Müller, A.H.E.; Freitag, R. Influence of polyplex formation on the performance of star-shaped polycationic transfection agents for mammalian cells. Polymers 2016, 8, 224–240. [Google Scholar] [CrossRef]
- Raup, A.; Jérôme, V.; Freitag, R.; Synatschke, C.V.; Müller, A.H.E. Promoter, transgene, and cell line effects in the transfection of mammalian cells using PDMAEMA-based nano-stars. Biotechnol. Rep. 2016, 11, 53–61. [Google Scholar] [CrossRef] [PubMed]
- Breunig, M.; Lungwitz, U.; Liebl, R.; Goepferich, A. Breaking up the correlation between efficacy and toxicity for nonviral gene delivery. Proc. Natl. Acad. Sci. USA 2007, 104, 14454–14459. [Google Scholar] [CrossRef] [PubMed] [Green Version]
- Synatschke, C.V.; Schallon, A.; Jérôme, V.; Freitag, R.; Müller, A.H.E. Influence of polymer architecture and molecular weight of poly(2-(dimethylamino)ethyl methacrylate) polycations on transfection efficiency and cell viability in gene delivery. Biomacromolecules 2011, 12, 4247–4255. [Google Scholar] [CrossRef] [PubMed]
- Chicaybam, L.; Barcelos, C.; Peixoto, B.; Carneiro, M.; Limia, C.G.; Redondo, P.; Lira, C.; Paraguassú-Braga, F.; Vasconcelos, Z.F.M.D.; Barros, L.; et al. An Efficient Electroporation Protocol for the Genetic Modification of Mammalian Cells. Front. Bioeng. Biotechnol. 2016, 4, 99. [Google Scholar] [CrossRef] [PubMed]
- Boussif, O.; Lezoualc’h, F.; Zanta, M.A.; Mergny, M.D.; Scherman, D.; Demeneix, B.; Behr, J.P. A versatile vector for gene and oligonucleotide transfer into cells in culture and in vivo: Polyethylenimine. Proc. Natl. Acad. Sci. USA 1995, 92, 7297–7301. [Google Scholar] [CrossRef] [PubMed]
- Bruening, W.; Giasson, B.; Mushynski, W.; Durham, H.D. Activation of stress-activated MAP protein kinases up-regulates expression of transgenes driven by the cytomegalovirus immediate/early promoter. Nucleic Acids Res. 1998, 26, 486–489. [Google Scholar] [CrossRef] [PubMed] [Green Version]
- Lee, M.S.; Kim, N.W.; Lee, K.; Kim, H.; Jeong, J.H. Enhanced transfection by antioxidative polymeric gene carrier that reduces polyplex-mediated cellular oxidative stress. Pharm. Res. 2013, 30, 1642–1651. [Google Scholar] [CrossRef] [PubMed]
- Wang, L.-H.; Wu, T.; Wu, D.-C.; You, Y.-Z. Bioreducible Gene Delivery Vector Capable of Self-Scavenging the Intracellular-Generated ROS Exhibiting High Gene Transfection. ACS Appl. Mater. Interfaces 2016, 8, 19238–19244. [Google Scholar] [CrossRef] [PubMed]
Scheme 1.
Chemical structure of the nanostar.

Figure 1.
Development of the hydrodynamic radius of the polyplexes with incubation time. White symbols: initial incubation in Hepes-buffered glucose solution (HBG), black symbols: after dilution with Opti-MEM (1 mL), N/P ratio: 20.
Figure 1.
Development of the hydrodynamic radius of the polyplexes with incubation time. White symbols: initial incubation in Hepes-buffered glucose solution (HBG), black symbols: after dilution with Opti-MEM (1 mL), N/P ratio: 20.

Figure 2.
Gel retardation of the polyplexes as a function of the N/P ratio (indicated on the top of the respective lanes).
Figure 2.
Gel retardation of the polyplexes as a function of the N/P ratio (indicated on the top of the respective lanes).

Figure 3.
Influence of the “polymer density” (amount of nanostar added per 106 cells) on transfection efficiency and viability keeping the N/P ratio constant at a value of 10. (Total cells: 0.2 × 10⁶, transfection volume 2.2 mL (0.2 mL polyplex solution), bars represent percentages of transfected cells within the viable cell population (white: low producer, grey: middle producer, black: high producer), △: viabilities. Shown are mean values ± SD, n = 2 for 50 µg, 25 µg and 10 µg polymer, n = 1 for the rest (data represent the averaged values of one experiment carried out in duplicate), SD are given for total transfection efficiencies and for viabilities.)

Figure 4.
Optimization of the polymer density in high cell density (HCD) transfections of Jurkat cells. (Total cells: 5 × 10⁶ cells, transfection volume 0.25 mL, bars represent the percentage of transfected cells, △: viabilities, data represent the averaged values of one experiment carried out in duplicate. An N/P of 10 was adjusted in all experiments.).

Figure 5.
HCD transfection as a function of the N/P ratio and the polymer density. (Total cell number: 5 × 10⁶ cells, transfection volume 0.25 mL, 2 mL Eppendorf tube, amount of pDNA is given per sample. Bars represent the percentage of transfected cells, with white: low producers, grey: middle producers, black: high producers; △: viabilities. Shown are mean values ± SD, n ≥ 3, SD given for total transfection efficiencies and for viabilities.)

Figure 6.
Transfection in Eppendorf tubes as a function of the polymer densities. (A) 90 min incubation, (B) 30 min incubation, (C) 15 min incubation. (0.2 × 10⁶ cells, N/P 10, transfection volume 0.5 mL. Bars represent the percentage of transfected cells, with white: low producers, grey: middle producers, black: high producers; △: viabilities. Shown are mean values ± SD, n ≥ 2, SD given for total transfection efficiencies and for viabilities.)


Table 1.
Zeta potentials of polyplexes at the indicated N/P-ratios.
| N/P Ratio | Zeta Potential Values (mV) |
|---|---|
| 3 | −30.7 ± 2.1 |
| 5 | −0.4 ± 4.0 |
| 10 | 7.4 ± 1.8 |
| 20 | 10.1 ± 1.2 |
The zeta potential of the non-complexed DNA is −26.9 ± 3.2 mV. Shown are mean values ± standard deviation (SD), n = 3.
Table 2.
Transfection of Jurkat cells from exponentially growing cultures using nanostars in comparison to l-PEI (PEI: polyethylenimine).
Table 2.
Transfection of Jurkat cells from exponentially growing cultures using nanostars in comparison to l-PEI (PEI: polyethylenimine).
| Viability (%) | Transfection Efficiency (%) | ||||
|---|---|---|---|---|---|
| Total | Low Producers | Middle Producers | High Producers | ||
| PEI | 83.1 ± 3.8 | 7.9 ± 0.7 | 2.6 ± 0.1 | 2.4 ± 0.1 | 2.9 ± 0.6 |
| Nanostar | 31.3 ± 11.2 | 57.7 ± 8.9 | 24.6 ± 7.8 | 17.3 ± 2.1 | 15.9 ± 1.0 |
Transfection volume 2.2 mL. l-PEI: 5 µg polymer, 1.9 µg pDNA, N/P 20; nanostar: 10 µg polymer, 2.1 µg pDNA, N/P 10. Shown are mean values ± SD, n ≥ 2.
Table 3.
Comparison of the transfections in 6-well plates for increasing cell and polymer concentrations at constant cell number.
Table 3.
Comparison of the transfections in 6-well plates for increasing cell and polymer concentrations at constant cell number.
| Polymer Density (µg per 106 Cells) | Polymer Concentration (µg mL−1) | Viability (%) | Transfection Efficiency (%) |
|---|---|---|---|
| 25 | 4.0 | 39.1 ± 1.9 | 51.0 ± 0.3 |
| 15 | 2.4 | 80.4 | 39.4 |
| 10 | 1.6 | 94.8 ± 0.8 | 8.9 ± 5.7 |
0.2 × 10⁶ cells per sample, N/P 10. Shown are mean values ± SD, n ≥ 2 except for 15 µg polymer, where n = 1 in that case data represent the averaged values of one experiment carried out in duplicate.
Table 4.
Large scale high cell density (HCD) transfection of Jurkat cells.
| Cells | N/P Ratio | pDNA (µg) | Viability (%) | Transfection Efficiency (%) | |||
|---|---|---|---|---|---|---|---|
| Total | Low Producers | Middle Producers | High Producers | ||||
| 1 × 10⁸ | 7.5 | 83.5 | 67.2 ± 13.9 | 52.7 ± 0.7 | 21.2 ± 3.9 | 20.0 ± 2.2 | 11.5 ± 6.9 |
| 10 | 62.6 | 72.9 ± 9.4 | 58.2 ± 10.9 | 27.6 ± 7.3 | 21.3 ± 4.8 | 9.3 ± 3.0 | |
| 15 | 41.8 | 68.8 ± 20.3 | 50.6 ± 7.0 | 25.8 ± 13.9 | 16.9 ± 1.3 | 7.9 ± 5.6 | |
| 2 × 10⁹ | 10 | 1252 | 58.2 ± 2.1 | 70.0 ± 1.9 | 38.4 ± 0.6 | 23.7 ± 1.2 | 7.9 ± 0.5 |
1 × 10⁸ cells, transfection volume 5 mL, 50 mL Falcon tubes. 2 × 10⁹ cells, transfection volume 50 mL, 100 mL spinner flask. Polymer density: 3 µg per 106 cells. Polymer concentration: 60 µg mL−1. Dilution factor post-transfection: 20. Amount of pDNA is given as per sample. Shown are mean values ± SD, n ≥ 2.
Table 5.
Transfection in Eppendorf tubes as a function of the polymer density.
| Polymer Density (µg per 106 Cells) | Polymer Concentration (µg mL−1) | Viability (%) | Transfection Efficiency (%) |
|---|---|---|---|
| 25 | 20 | 11.0 ± 9.7 | 64.5 ± 2.1 |
| 15 | 12 | 6.1 | 74.4 |
| 10 | 8 | 17.0 ± 5.5 | 65.4 ± 14.0 |
0.2 × 10⁶ cells per sample; N/P 10; incubation with polyplexes 2 h. Shown are mean values ± SD, n ≥ 2 except for 15 µg polymer, where n = 1 (data represent the averaged values of one experiment carried out in duplicate).
Table 6.
Transfection in Eppendorf tubes and HCD transfection of human primary T cells.
| Polymer Density (µg per 106 Cells) | Polymer Concentration (µg mL−1) | pDNA (µg) | Transfection Efficiency (%) Viability (%) | ||
|---|---|---|---|---|---|
| Donor 1 | Donor 2 | ||||
| Eppendorf tubes a | control | - | - | 0.8/0.9 | 0.8/0.7 |
| 75.8/78.2 | 93.3/91.3 | ||||
| 6 | 2.4 | 0.28 | 19.4/13.6 | 2.0/6.1 | |
| 35.1/39.6 | 78.9/80.1 | ||||
| 5 | 2.0 | 0.23 | 7.8/15 | 0.9/1.8 | |
| 48.4/38.1 | 86.1/88.5 | ||||
| 3.7/8.2 | 0.7/2.4 | ||||
| 4 | 1.6 | 0.18 | 56.8/44.7 | 89.9/89.3 | |
| HCD b | Control | - | - | 0.5 | 0.8 |
| 68.9 | 87.6 | ||||
| 3.2 | 14.8 | ||||
| 3 | 60 | 3.1 | 37.5 | 65.3 | |
a 0.2 × 10⁶ cells per sample, N/P 10, transfection volume: 0.5 mL, incubation with polyplexes 90 min, data represent the results of experimental replicates using the same polyplexes for the two donors. b 5 × 10⁶ cells per sample, N/P 10, transfection volume: 0.25 mL, incubation 4 h. Amount of activated T cells (CD3+/CD25+) at the time of transfection: Donor 1, 86%; Donor 2, 98%. The cells were incubated for 48 h in LymphoGrow medium supplemented with 11 ng mL−1 rhIL-2 post-transfection. Transfection efficiencies are displayed in bold and cell viabilities in italic.
© 2018 by the authors. Licensee MDPI, Basel, Switzerland. This article is an open access article distributed under the terms and conditions of the Creative Commons Attribution (CC BY) license (http://creativecommons.org/licenses/by/4.0/).
Share and Cite
MDPI and ACS Style
Riedl, S.A.B.; Kaiser, P.; Raup, A.; Synatschke, C.V.; Jérôme, V.; Freitag, R. Non-Viral Transfection of Human T Lymphocytes. Processes 2018, 6, 188. https://doi.org/10.3390/pr6100188
AMA Style
Riedl SAB, Kaiser P, Raup A, Synatschke CV, Jérôme V, Freitag R. Non-Viral Transfection of Human T Lymphocytes. Processes. 2018; 6(10):188. https://doi.org/10.3390/pr6100188
Chicago/Turabian StyleRiedl, Simon A. B., Patrick Kaiser, Alexander Raup, Christopher V. Synatschke, Valérie Jérôme, and Ruth Freitag. 2018. "Non-Viral Transfection of Human T Lymphocytes" Processes 6, no. 10: 188. https://doi.org/10.3390/pr6100188
Note that from the first issue of 2016, this journal uses article numbers instead of page numbers. See further details here.