Hydrodynamic Study of AR Coupling Effects on Solid Circulation and Gas Leakages in a High-Flux In Situ Gasification Chemical Looping Combustion System

Abstract
:1. Introduction
2. Materials and Methods
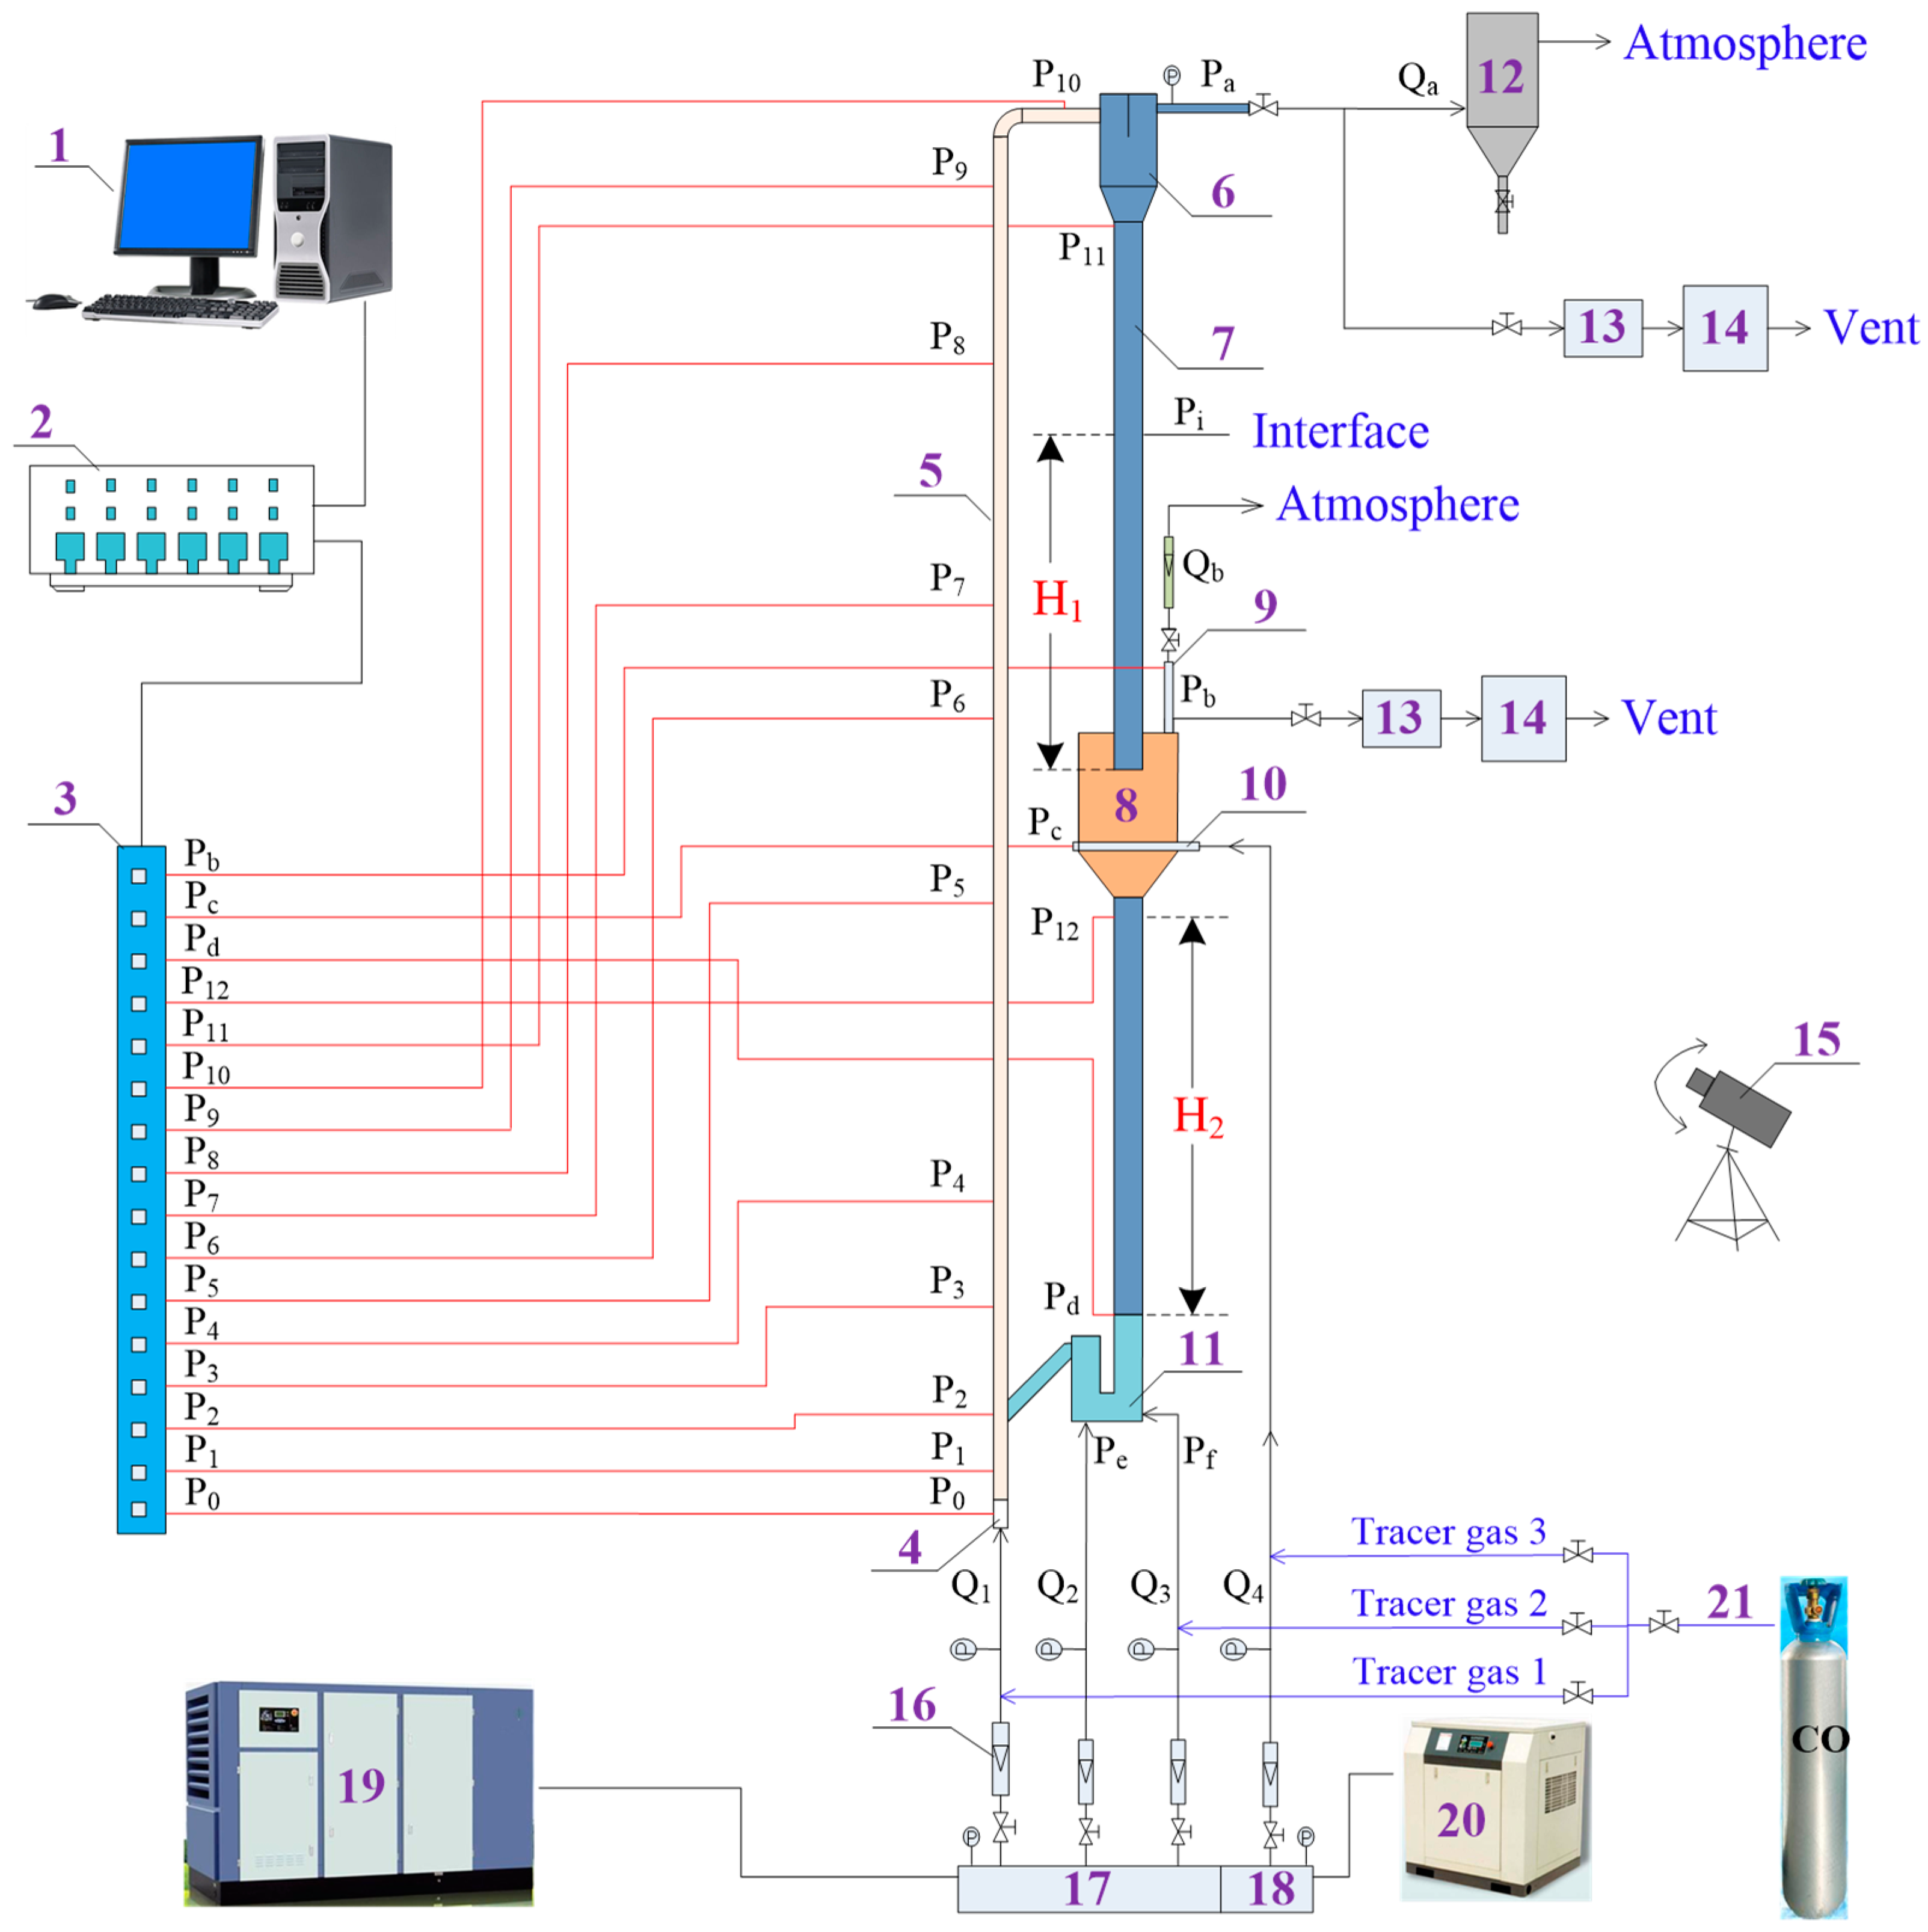
2.1. Experimental Device
2.1.1. Main Assembly
2.1.2. Gas Supply System
2.1.3. Data Acquisition System
2.2. Material
2.3. Experimental Procedures
2.4. Data Evaluation
2.4.1. Gas Flow Rates
2.4.2. Solid Circulation Flux
2.4.3. Gas Leakage Ratios
2.4.4. Pressure Gradients
3. Results and Discussion
3.1. Pressure Balance and Solid Circulation of the iG-CLC System
3.2. Effect of the AR Coupling on the Solid Circulation
3.3. Effect of the AR Coupling on the Gas Leakages
3.4. Performance Optimization of the AR Coupling
4. Conclusions
Author Contributions
Funding
Conflicts of Interest
References
- Fan, L.S.; Zeng, L.; Wang, W.; Luo, S. Chemical looping processes for CO2 capture and carbonaceous fuel conversion—Prospect and opportunity. Energy Environ. Sci. 2012, 5, 7254–7280. [Google Scholar] [CrossRef]
- Lyngfelt, A.; Leckner, B.; Mattisson, T. A fluidized-bed combustion process with inherent CO2 separation; application of chemical-looping combustion. Chem. Eng. Sci. 2001, 56, 3101–3113. [Google Scholar] [CrossRef]
- Abad, A.; Mattisson, T.; Lyngfelt, A.; Johansson, M. The use of iron oxide as oxygen carrier in a chemical-looping reactor. Fuel 2007, 86, 1021–1035. [Google Scholar] [CrossRef]
- Mattisson, T.; García-Labiano, F.; Kronberger, B.; Lyngfelt, A.; Adánez, J.; Hofbauer, H. Chemical-Looping Combustion using syngas as fuel. Int. J. Greenh. Gas Control 2007, 1, 158–169. [Google Scholar] [CrossRef]
- Ishida, M.; Jin, H.; Okamoto, T. A fundamental study of a new kind of medium material for chemical-looping combustion. Energy Fuels 1996, 10, 958–963. [Google Scholar] [CrossRef]
- Jin, H.; Okamoto, T.; Ishida, M. Development of a novel chemical-looping combustion: Synthesis of a solid looping material of NiO/NiAl2O4. Ind. Eng. Chem. Res. 1999, 38, 126–132. [Google Scholar] [CrossRef]
- Mattisson, T.; Järdnäs, A.; Lyngfelt, A. Reactivity of some metal oxides supported on alumina with alternating methane and oxygen application for chemical-looping combustion. Energy Fuels 2003, 17, 643–651. [Google Scholar] [CrossRef]
- Cho, P.; Mattisson, T.; Lyngfelt, A. Comparison of iron-, nickel-, copper-and manganese-based oxygen carriers for chemical-looping combustion. Fuel 2004, 83, 1215–1225. [Google Scholar] [CrossRef]
- Abad, A.; Mattisson, T.; Lyngfelt, A.; Rydén, M. Chemical-looping combustion in a 300 W continuously operating reactor system using a manganese-based oxygen carrier. Fuel 2006, 85, 1174–1185. [Google Scholar] [CrossRef]
- De Diego, L.F.; García-Labiano, F.; Gayán, P.; Celaya, J.; Palacios, J.M.; Adánez, J. Operation of a 10 kWth chemical-looping combustor during 200 h with a CuO-Al2O3 oxygen carrier. Fuel 2007, 86, 1036–1045. [Google Scholar] [CrossRef] [Green Version]
- Adánez, J.; Dueso, C.; de Diego, L.F.; García-Labiano, F.; Gayán, P.; Abad, A. Methane combustion in a 500 Wth chemical-looping combustion system using an impregnated Ni-based oxygen carrier. Energy Fuels 2008, 23, 130–142. [Google Scholar] [CrossRef]
- Kolbitsch, P.; Bolhàr-Nordenkampf, J.; Pröll, T.; Hofbauer, H. Operating experience with chemical looping combustion in a 120 kW dual circulating fluidized bed (DCFB) unit. Int. J. Greenh. Gas Control 2010, 4, 180–185. [Google Scholar] [CrossRef]
- Ma, J.; Zhao, H.; Tian, X.; Wei, Y.; Zhang, Y.; Zheng, C. Continuous Operation of Interconnected Fluidized Bed Reactor for Chemical Looping Combustion of CH4 Using Hematite as Oxygen Carrier. Energy Fuels 2015, 29, 3257–3267. [Google Scholar] [CrossRef]
- Diglio, G.; Bareschino, P.; Mancusi, E.; Pepe, F. Techno-Economic Evaluation of a small-scale power generation unit based on a Chemical Looping Combustion Process in Fixed Bed Reactor network. Ind. Eng. Chem. Res. 2018, 57, 11299–11311. [Google Scholar] [CrossRef]
- Cao, Y.; Pan, W.P. Investigation of Chemical looping combustion by solid fuels: 1 Process analysis. Energy Fuels 2006, 20, 1836–1844. [Google Scholar] [CrossRef]
- Berguerand, N.; Lyngfelt, A. Design and operation of a 10 kWth chemical-looping combustor for solid fuels-testing with South African coal. Fuel 2008, 87, 2713–2726. [Google Scholar] [CrossRef]
- Leion, H.; Mattisson, T.; Lyngfelt, A. Solid fuels in chemical-looping combustion. Int. J. Greenh. Gas Control 2008, 2, 180–193. [Google Scholar] [CrossRef]
- Shen, L.H.; Wu, J.H.; Xiao, J. Experiments on chemical looping combustion of coal with a NiO based oxygen carrier. Combust. Flame 2009, 156, 721–728. [Google Scholar] [CrossRef]
- Fan, L.S.; Li, F. Chemical looping technology and its fossil energy conversion applications. Ind. Eng. Chem. Res. 2010, 49, 10200–10211. [Google Scholar] [CrossRef]
- Abad, A.; Gayán, P.; de Diego, L.F.; García-Labiano, F.; Adánez, J. Fuel reactor modelling in chemical-looping combustion of coal: 1. Model formulation. Chem. Eng. Sci. 2013, 87, 277–293. [Google Scholar] [CrossRef] [Green Version]
- García-Labiano, F.; de Diego, L.F.; Gayán, P.; Abad, A.; Adánez, J. Fuel reactor modelling in chemical-looping combustion of coal: 2-simulation and optimization. Chem. Eng. Sci. 2013, 87, 173–182. [Google Scholar] [CrossRef] [Green Version]
- Thon, A.; Kramp, M.; Hartge, E.-U.; Heinrich, S.; Werther, J. Operational experience with a system of coupled fluidized beds for chemical looping combustion of solid fuels using ilmenite as oxygen carrier. Appl. Energy 2014, 118, 309–317. [Google Scholar] [CrossRef]
- Bayham, S.; McGiveron, O.; Tong, A.; Chung, E.; Kathe, M.; Wang, D.; Zeng, L.; Fan, L.S. Parametric and dynamic studies of an iron-based 25-kWth coal direct chemical looping unit using sub-bituminous coal. Appl. Energy 2015, 145, 354–363. [Google Scholar] [CrossRef]
- Adánez, J.; Abad, A.; Perez-Vega, R.; Luis, F.; García-Labiano, F.; Gayán, P. Design and Operation of a Coal-fired 50 kWth Chemical Looping Combustor. Energy Procedia 2014, 63, 63–72. [Google Scholar] [CrossRef]
- Markström, P.; Linderholm, C.; Lyngfelt, A. Operation of a 100 kW chemical-looping combustor with Mexican petroleum coke and Cerrejón coal. Appl. Energy 2014, 113, 1830–1835. [Google Scholar] [CrossRef]
- Ma, J.; Zhao, H.; Tian, X.; Wei, Y.; Rajendran, S.; Zhang, Y.; Bhattacharya, S.; Zheng, C. Chemical looping combustion of coal in a 5 kWth interconnected fluidized bed reactor using hematite as oxygen carrier. Appl. Energy 2015, 157, 304–313. [Google Scholar] [CrossRef]
- Ströhle, J.; Orth, M.; Epple, B. Design and operation of a 1 MWth chemical looping plant. Appl. Energy 2014, 113, 1490–1495. [Google Scholar] [CrossRef]
- Xiao, R.; Chen, L.; Saha, C.; Zhang, S.; Bhattacharya, S. Pressurized chemical-looping combustion of coal using an iron ore as oxygen carrier in a pilot-scale unit. Int. J. Greenh. Gas Control 2012, 10, 363–373. [Google Scholar] [CrossRef]
- Wang, X.; Jin, B.; Zhang, Y.; Zhang, Y.; Liu, X. Three Dimensional Modeling of a Coal-Fired Chemical Looping Combustion Process in the Circulating Fluidized Bed Fuel Reactor. Energy Fuels 2013, 27, 2173–2184. [Google Scholar] [CrossRef]
- Wang, X.; Jin, B.; Liu, X.; Zhang, Y.; Liu, H. Experimental investigation on flow behaviors in a novel in situ gasification chemical looping combustion apparatus. Ind. Eng. Chem. Res. 2013, 52, 14208–14218. [Google Scholar] [CrossRef]
- Wang, X.; Jin, B.; Liu, H.; Wang, W.; Liu, X.; Zhang, Y. Optimization of in Situ Gasification Chemical Looping Combustion through Experimental Investigations with a Cold Experimental System. Ind. Eng. Chem. Res. 2015, 54, 5749–5758. [Google Scholar] [CrossRef]
- Wang, X.; Jin, B.; Zhu, X.; Liu, H. Experimental Evaluation of a Novel 20 kWth in Situ Gasification Chemical Looping Combustion Unit with an Iron Ore as the Oxygen Carrier. Ind. Eng. Chem. Res. 2016, 55, 11775–11784. [Google Scholar] [CrossRef]


| Description | Value | |
|---|---|---|
| Particle size distribution | Diameter (mm) | Mass Fraction (%) |
| >1.25 | 0.05 | |
| 1–1.25 | 0.71 | |
| 0.6–1 | 2.79 | |
| 0.45–0.6 | 22.94 | |
| 0.4–0.45 | 45.14 | |
| 0.3–0.4 | 22.94 | |
| <0.3 | 5.43 | |
| Mean diameter dp (mm) | 0.43 | - |
| Apparent density ρs (kg/m3) | 3015 | - |
| Bulk density ρb (kg/m3) | 1577 | - |
| Minimum fluidization gas velocity Umf (m/s) | 0.187 | - |
| Description | Range of Values |
|---|---|
| Solid circulation flux Gs (kg/m2·s) | 170–480 |
| FR superficial gas velocity Uf,sta (m/s) | 7–12.5 |
| AR inlet air flow rate Q4,sta (m3/h) | 20–60 |
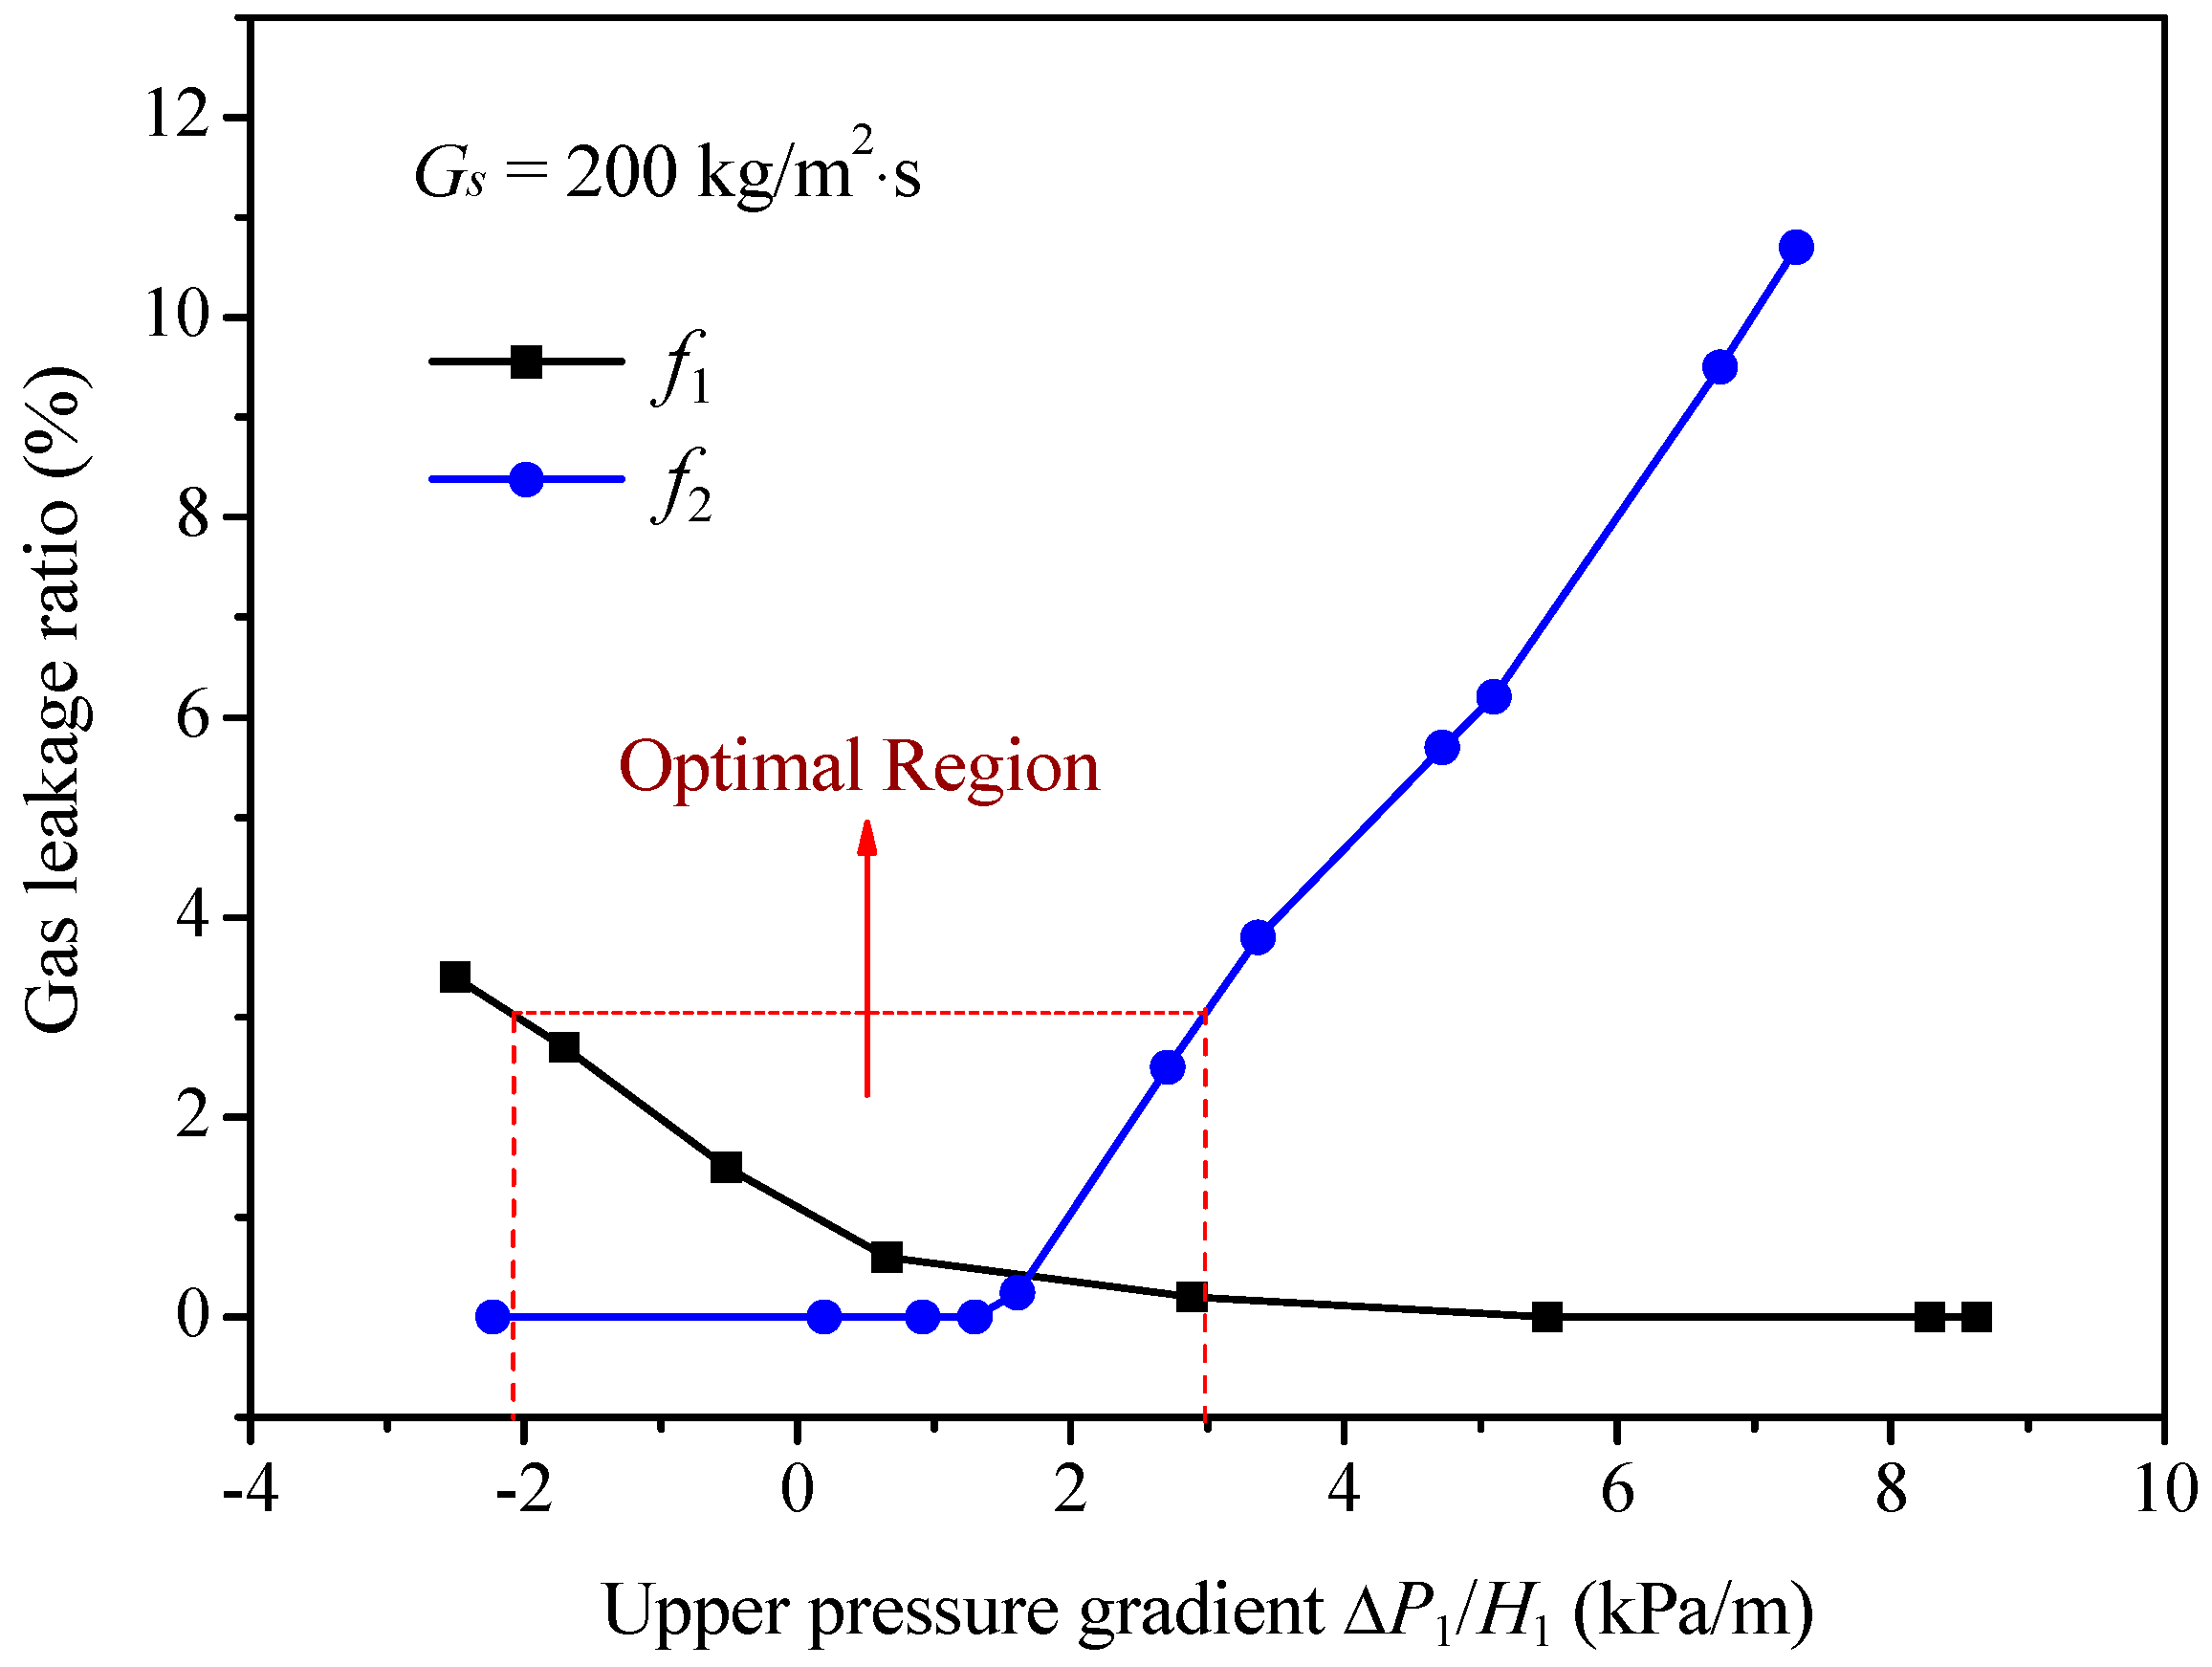
| Upper pressure gradient ΔP1/H1 (kPa/m) | −4–13 |
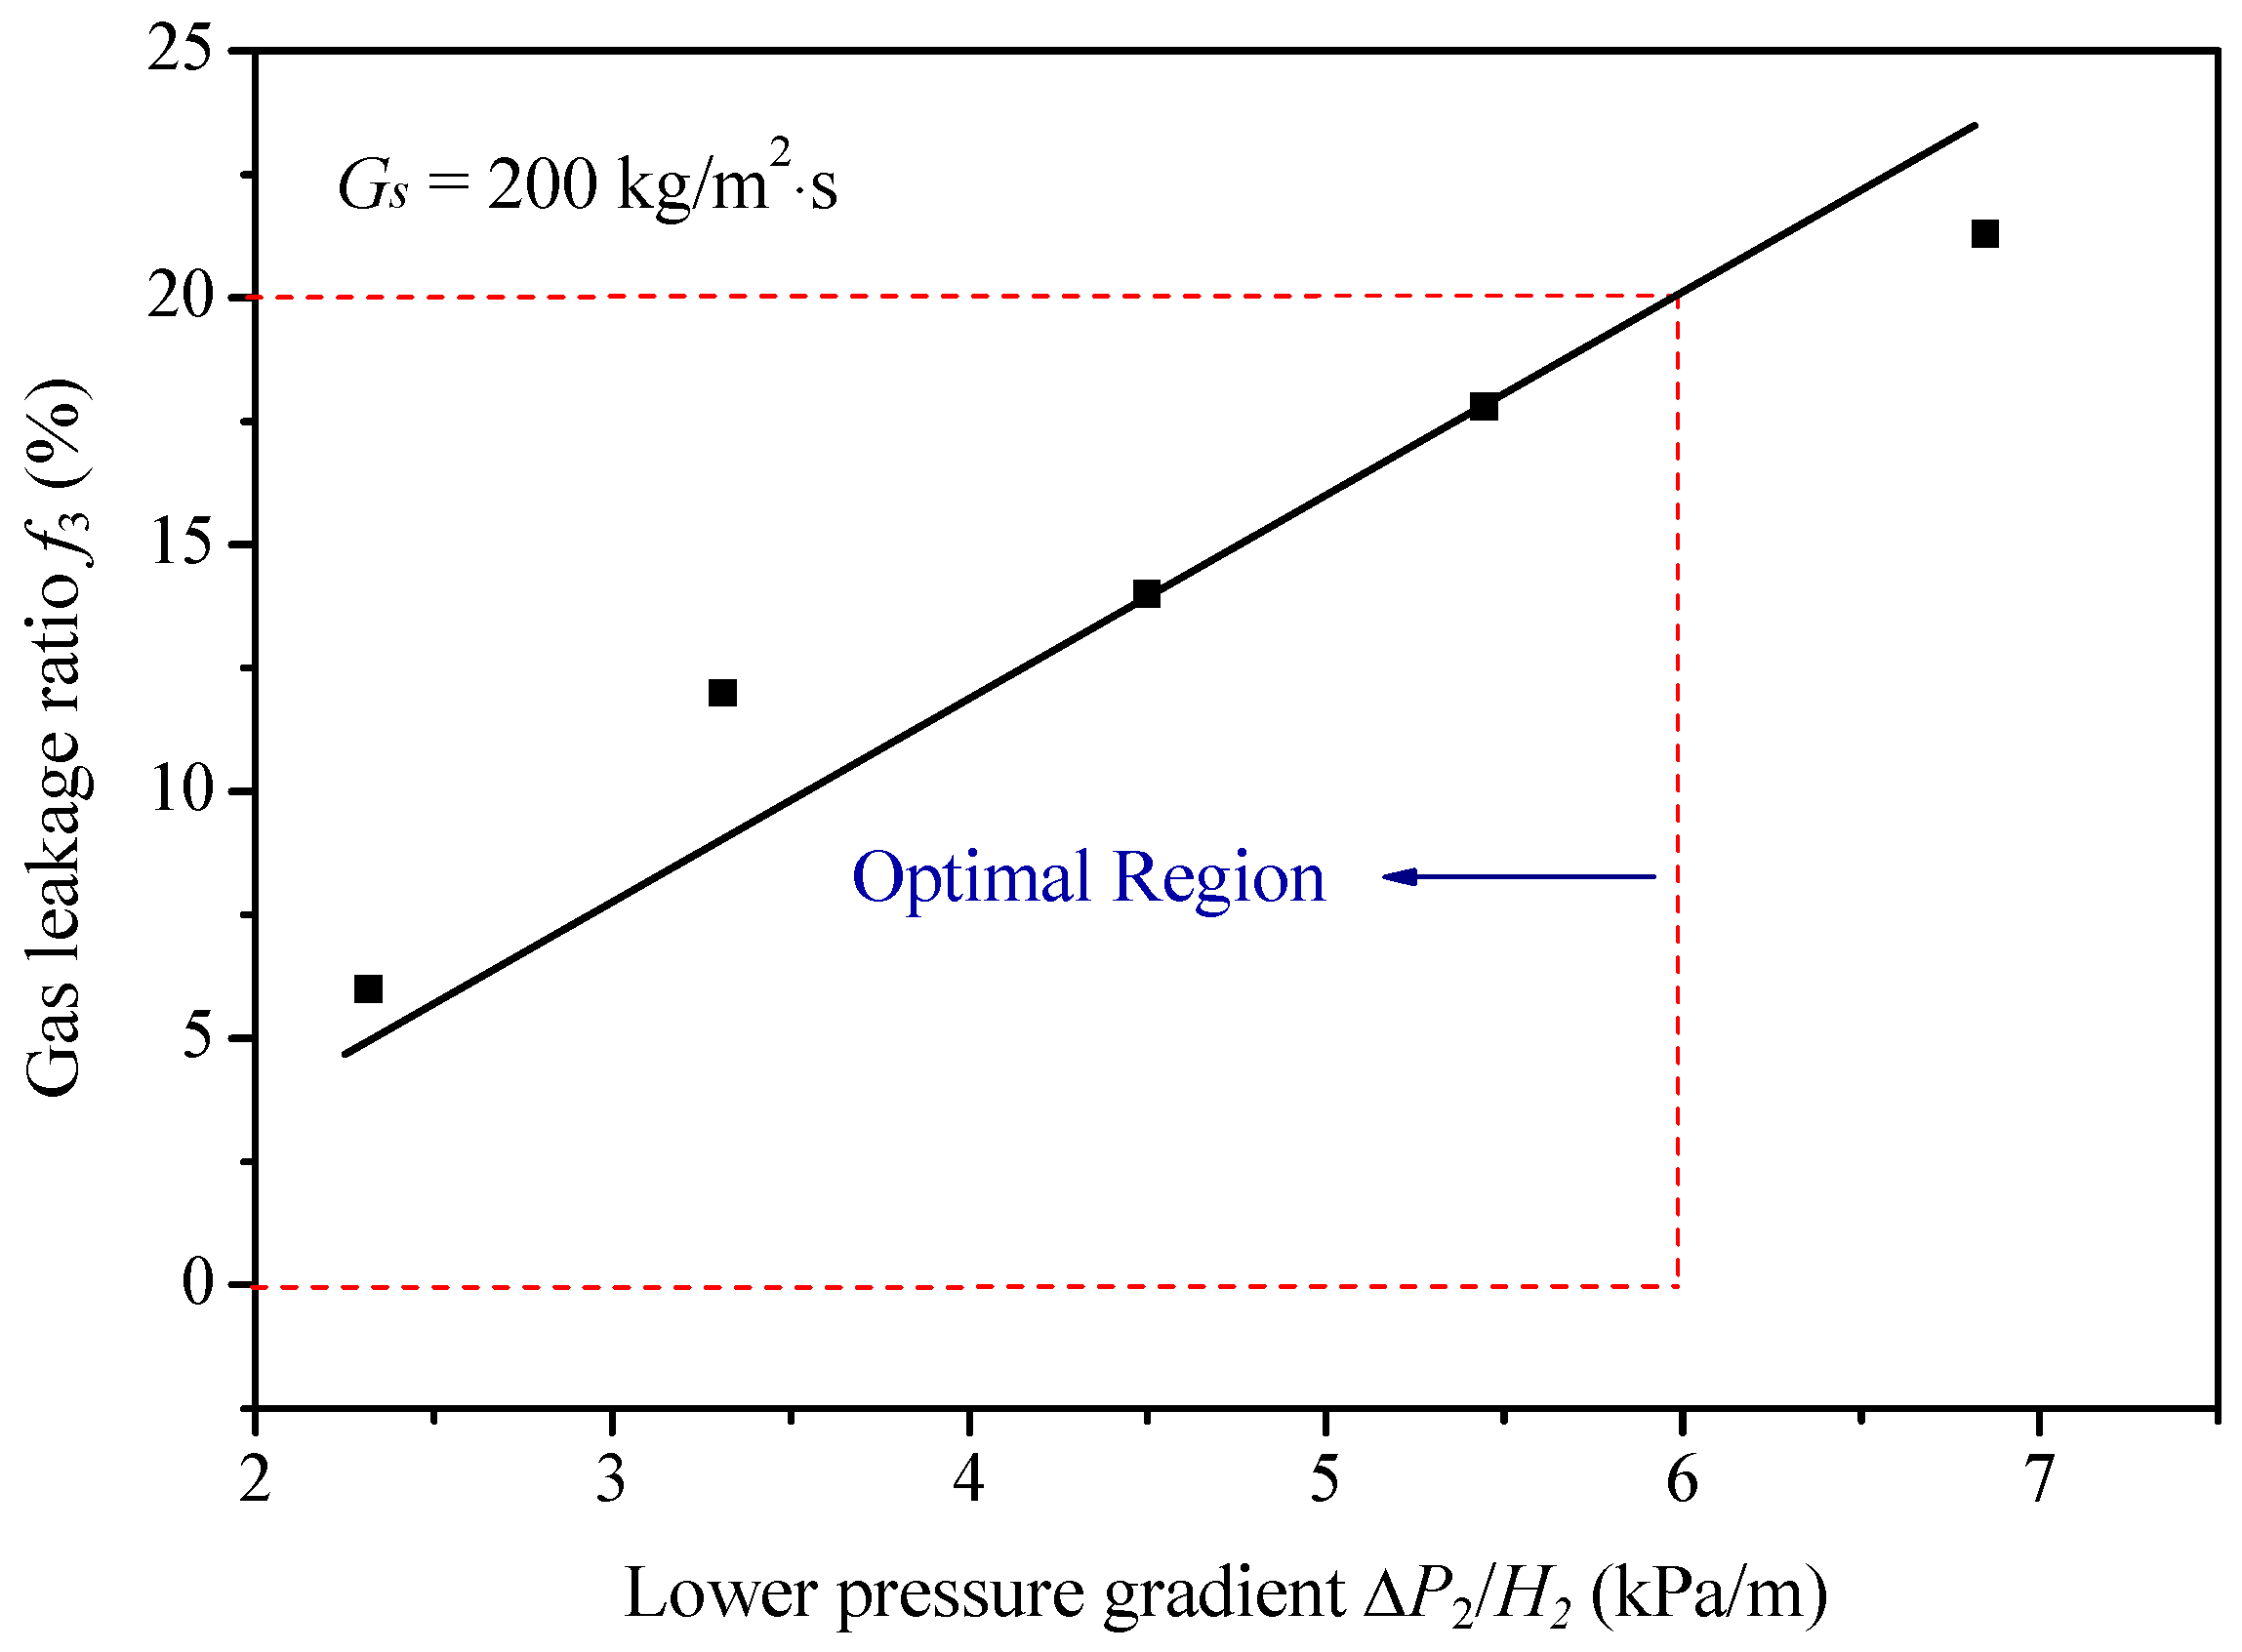
| Lower pressure gradient ΔP2/H2 (kPa/m) | 2.0–7.0 |
| Description | Reference Condition | Optimal Condition |
|---|---|---|
| Solid circulation flux Gs (kg/m2·s) | 310 | 310 |
| Upper pressure gradient ΔP1/H1 (kPa/m) | 8.0 | 3.5 |
| Lower pressure gradient ΔP2/H2 (kPa/m) | 3.8 | 5.0 |
| FR leakage ratio f1 (%) | 0 | 0 |
| AR leakage ratio f2 (%) | 10.7 | 1.9 |
| J-valve leakage ratio f3 (%) | 11.0 | 15.0 |
© 2018 by the authors. Licensee MDPI, Basel, Switzerland. This article is an open access article distributed under the terms and conditions of the Creative Commons Attribution (CC BY) license (http://creativecommons.org/licenses/by/4.0/).
Share and Cite
Wang, X.; Liu, X.; Jin, B.; Wang, D. Hydrodynamic Study of AR Coupling Effects on Solid Circulation and Gas Leakages in a High-Flux In Situ Gasification Chemical Looping Combustion System. Processes 2018, 6, 196. https://doi.org/10.3390/pr6100196
Wang X, Liu X, Jin B, Wang D. Hydrodynamic Study of AR Coupling Effects on Solid Circulation and Gas Leakages in a High-Flux In Situ Gasification Chemical Looping Combustion System. Processes. 2018; 6(10):196. https://doi.org/10.3390/pr6100196
Chicago/Turabian StyleWang, Xiaojia, Xianli Liu, Baosheng Jin, and Decheng Wang. 2018. "Hydrodynamic Study of AR Coupling Effects on Solid Circulation and Gas Leakages in a High-Flux In Situ Gasification Chemical Looping Combustion System" Processes 6, no. 10: 196. https://doi.org/10.3390/pr6100196