Experimental Study on Feasibility of Enhanced Gas Recovery through CO2 Flooding in Tight Sandstone Gas Reservoirs


1
Key Laboratory for Enhanced Oil & Gas Recovery of the Ministry of Education, College of Petroleum Engineering, Northeast Petroleum University, Daqing 163318, China
2
CNOOC China Limited, Tianjin Branch, Tianjin 300459, China
*
Authors to whom correspondence should be addressed.
Processes 2018, 6(11), 214; https://doi.org/10.3390/pr6110214
Submission received: 15 October 2018
/
Revised: 31 October 2018
/
Accepted: 31 October 2018
/
Published: 2 November 2018
(This article belongs to the Special Issue Fluid Flow in Fractured Porous Media)
Abstract
:The development of natural gas in tight sandstone gas reservoirs via CH4-CO2 replacement is promising for its advantages in enhanced gas recovery (EGR) and CO2 geologic sequestration. However, the degree of recovery and the influencing factors of CO2 flooding for enhanced gas recovery as well as the CO2 geological rate are not yet clear. In this study, the tight sandstone gas reservoir characteristics and the fluid properties of the Sulige Gasfield were chosen as the research platform. Tight sandstone gas long-core displacement experiments were performed to investigate (1) the extent to which CO2 injection enhanced gas recovery (CO2-EGR) and (2) the ability to achieve CO2 geological storage. Through modification of the injection rate, the water content of the core, and the formation dip angle, comparative studies were also carried out. The experimental results demonstrated that the gas recovery from CO2 flooding increased by 18.36% when compared to the depletion development method. At a lower injection rate, the diffusion of CO2 was dominant and the main seepage resistance was the viscous force, which resulted in an earlier CO2 breakthrough. The dissolution of CO2 in water postponed the breakthrough of CO2 while it was also favorable for improving the gas recovery and CO2 geological storage. However, the effects of these two factors were insignificant. A greater influence was observed from the presence of a dip angle in tight sandstone gas reservoirs. The effect of CO2 gravity separation and its higher viscosity were more conducive to stable displacement. Therefore, an additional gas recovery of 5% to 8% was obtained. Furthermore, the CO2 geological storage exceeded 60%. As a consequence, CO2-EGR was found to be feasible for a tight sandstone gas reservoir while also achieving the purpose of effective CO2 geological storage especially for a reservoir with a dip angle.
1. Introduction
“Gas flooding” typically using CO2, N2, or air has become one of the leading enhanced oil recovery (EOR) technologies for residual oil development in conventional reservoirs [1,2,3,4]. Unfortunately, “gas flooding” for natural gas reservoirs is currently only in the research and development stage. Tight gas reservoirs are one of the most important areas of unconventional natural gas exploration and development in the world and they have rich resource reserves [5]. However, a tight gas reservoir is characterized by poor reservoir properties, strong heterogeneity, and complicated pore-throat structures. The main traditional method for gas recovery is depletion development, but the recovery is only approximately 35% [6,7]. In order to increase recovery from tight gas reservoirs, a new method of enhanced gas recovery (EGR) is urgently required. The phase state of CO2 is easily transformed into the supercritical state [8,9,10] when the temperature exceeds the critical temperature (31.26 °C) and the pressure exceeds the critical pressure (7.29 MPa). Due to tight/shale gas reservoirs generally having great depths, it is easy for CO2 to reach the supercritical state if it is injected into these reservoirs. Theoretically, supercritical CO2 effectively displaces the natural gas and improves gas recovery in tight/shale gas reservoirs due to its higher density, higher viscosity, and lower diffusion rate.
There have been a substantial number of detailed investigations on gas adsorption characteristics in recent years, which aim to understand the mechanism of CH4 displacement by CO2 in coal reservoirs. Littke [11] studied the adsorption and desorption abilities of CO2 and CH4 under various temperature and pressure conditions. The adsorption capacity of CO2 was higher when compared to CH4. Liang [12] experimentally investigated the displacement mechanism underlying the driving out of coal-bed methane by gaseous CO2 and discovered that the permeability of CO2 was beyond two orders of magnitude higher when compared to CH4. This result was explained by the differences in the physical properties of the two gases, which are combined with the competitive adsorption effect. Zeng [13] theoretically established an internally consistent adsorption-strain-permeability model to describe the adsorption capacity of coal reservoirs to CH4 and CO2 and the displacement process of CH4 by CO2. The results indicated that the adsorption capacity of CO2 was two to five times that of CH4. In general, CO2 is chosen for injection into tight sandstone gas reservoirs to achieve EGR based on the following aspects. First, CH4 in tight gas reservoirs primarily exists in an adsorbed state and CO2 has a stronger adsorption capacity than CH4 under the same conditions [14,15]. Second, since the mixing speed of CO2 and CH4 is slower when compared to pressure recovery, the injection of CO2 can increase the formation pressure and displacement pressure gradient. Consequently, the flow velocity increases, which effectively gathers and drives the flow of CH4 in the reservoirs [16]. Moreover, the maintenance of pressure can also provide pressure support to prevent the formation of subsidence and water invasion [17]. In addition, injecting CO2 into tight sandstone gas reservoirs not only can achieve the purpose of EGR but also realize CO2 geological storage, which is of great significance for mitigating the global greenhouse effect [18,19]. For the previously mentioned reasons and the fact that CO2 flooding can increase coal seam recovery, CO2 flooding is feasible for EGR from tight sandstone gas reservoirs, theoretically. According to reports, only three pilot projects have existed globally [20,21]. CO2 storage pilot experiments were carried out in three gas fields including Beihai K12-B in Holland [22], Budafa in Hungary [23], and Algeria [10], but all were mainly concerned with achieving CO2 geological storage. CO2-EGR is widely utilized in medium-permeability and high-permeability gas reservoirs both domestically and overseas while experimental studies on CO2-EGR in tight sandstone gas reservoirs have rarely been reported.
In this work, the reservoir characteristics and fluid properties of the Sulige Gasfield were chosen as the research platform while displacement experiments using combined natural long-cores were performed to investigate the variables affecting CO2-EGR. The extent of CO2-EGR and CO2 geological storage was measured by using various injection rates, dry and aqueous cores, and formation dip angles. In this scenario, the feasibility of CO2-EGR in tight sandstone gas reservoirs using the displacement mechanism is examined and the geological storage of CO2 is also discussed and explained.
2. Experimental Section
2.1. Cores
During experimentation, natural tight cores were obtained from the Sulige Gasfield of Ordos Basin. In order to simulate the actual geological conditions of tight gas sandstone reservoirs, long-core displacement experiments were carried out. Since a natural tight long-core with a length of 1 m was obviously unrealistic for the experiments, a series of natural small-sized cores were combined to form a long-core, which was used to perform the displacement experiments of natural gas with CO2. The long-core consisted of 32 natural tight short-cores that were 3.0 × 10⁻⁴ m in length and 2.5 × 10⁻⁴ m in diameter. The total long-core was approximately 1 m in length. Even though this combination of natural short-cores might result in the end effect, the placement of a piece of filter paper between every two short-cores could effectively ameliorate it [24]. Using weighted averages, the average permeability and porosity of the long-core were 0.325 × 10⁻³ μm2 and 9.36%, respectively. In addition, a piece of tight sandstone core was used to perform the capillary pressure tests. The diameter of the core was 2.54 × 10⁻² m and the length was 5 × 10⁻² m. The core permeability and porosity were 0.307 × 10⁻³ μm2 and 9.41%, respectively.
2.2. Fluid
The gas for the experiments was CH4 of high purity with the purity exceeding 99.95%. The CO2 purity for the experiments exceeded 99.9%. The simulated formation water for the experiments was prepared according to the ion content and salinity of the actual formation water in the Sulige Gasfield, which is presented in Table 1.
2.3. Experimental Setup
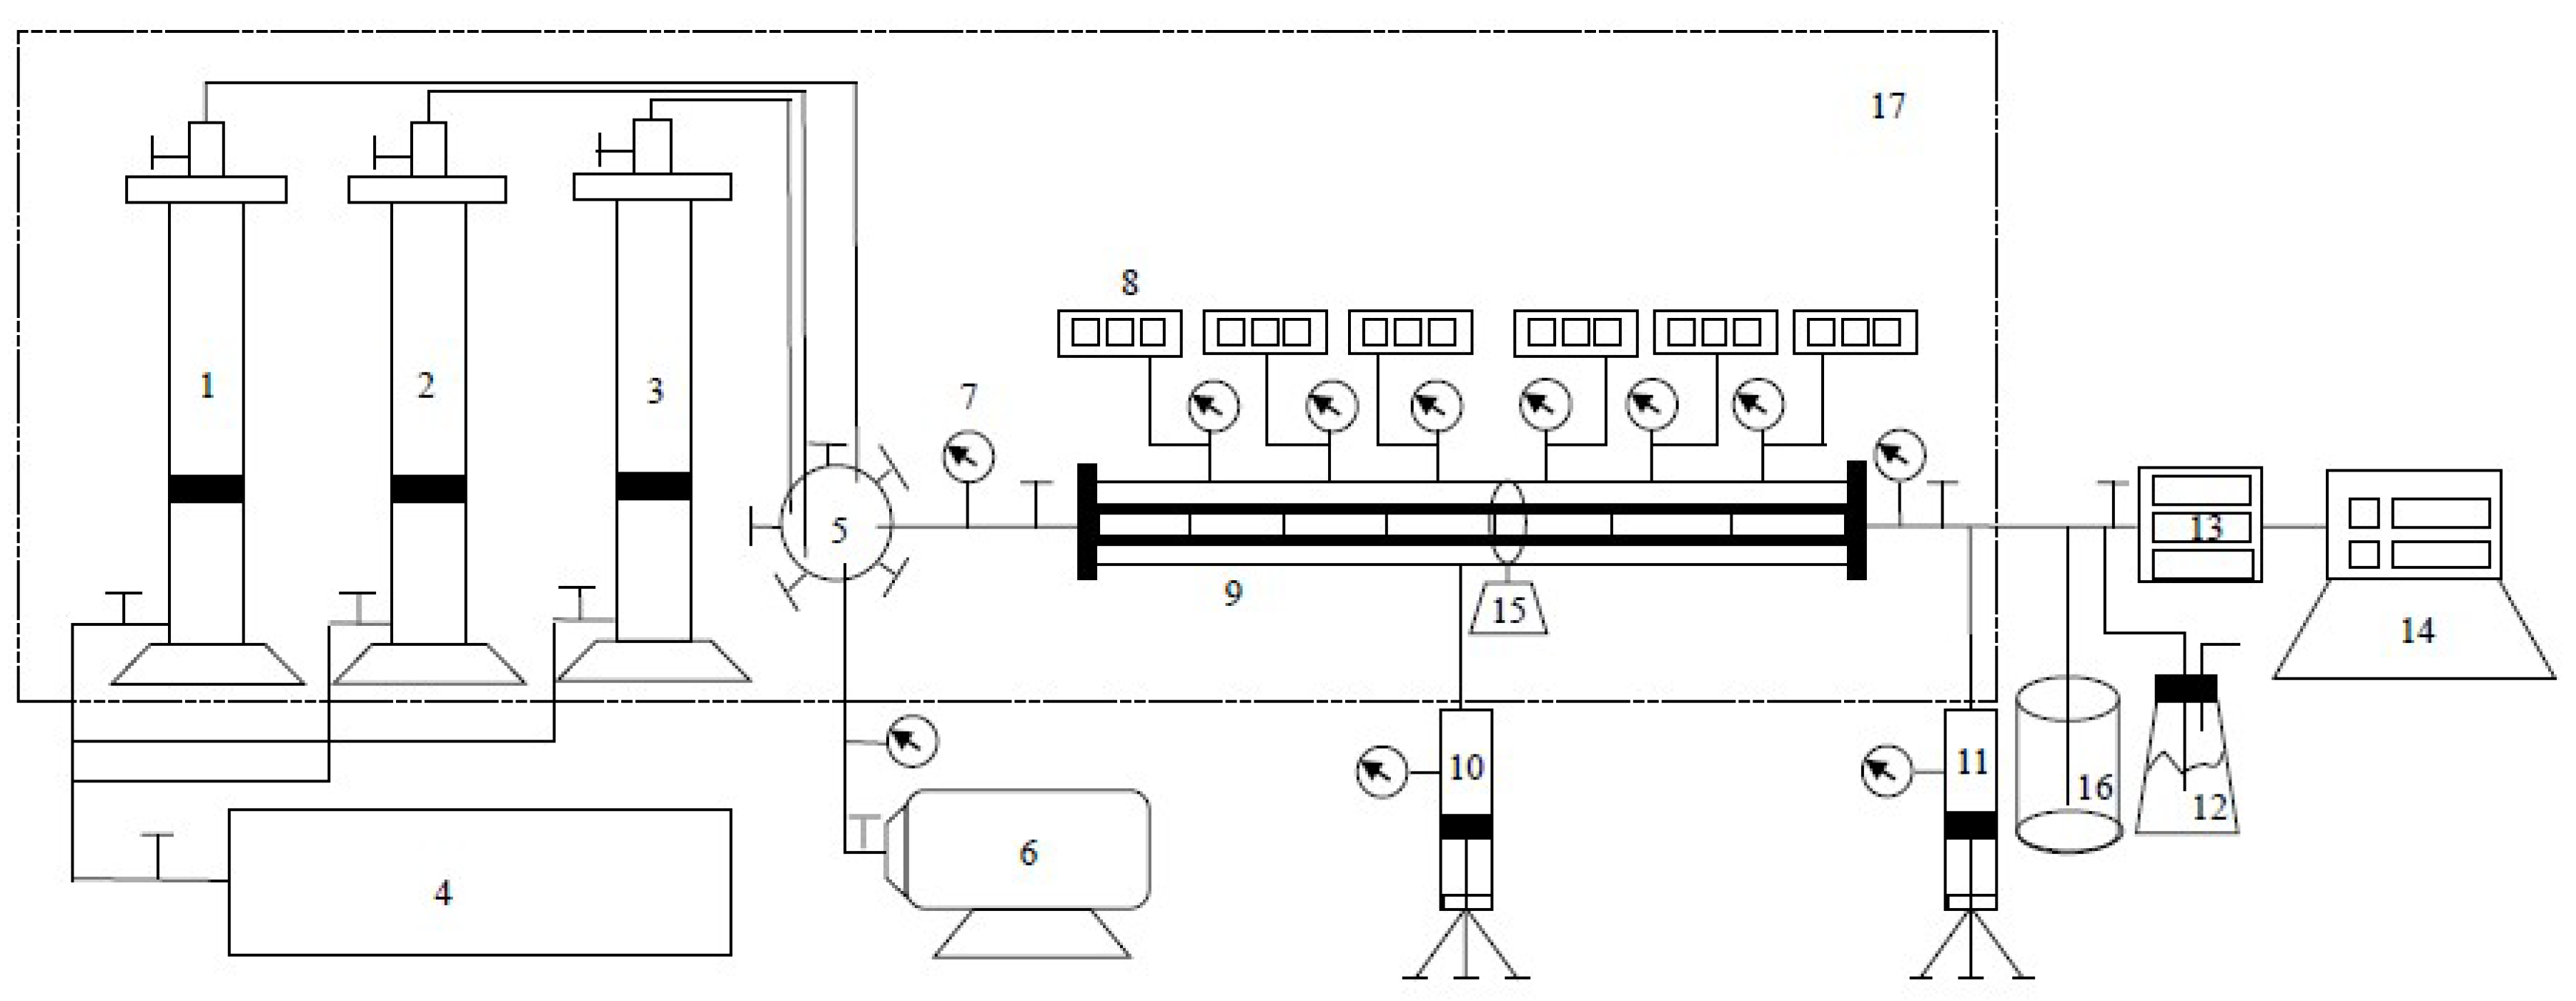
The experimental setup for the long-core displacement experiments was produced in France and it was mainly composed of an injection system, a displacement system, and a production system. A total of six pressure measurement points were set up from the injection end to the outlet end and the pressure variation throughout the entire process was observed by a monitoring system. The experimental installation is presented in Figure 1.
In addition, a high-pressure semipermeable plate instrument was utilized for capillary pressure testing.
2.4. Experimental Method
The experiments were conducted under the conditions of 110 °C and 30 MPa, which match the conditions in the actual tight gas reservoir of the Sulige Gasfield.
2.4.1. Measurement of Capillary Pressure
The effect of the injection rate on the results of CO2 flooding CH4 can be interpreted by comparing the viscous pressure drop generated by the flow and the capillary pressure. Therefore, we conducted an experiment using the semipermeable plate method to measure the capillary force [25] and then we measured the correlation of the capillary force with water saturation. First, the core was saturated with water. Then the displacement pressure difference between the two ends was established by using vacuum extraction. This pressure difference is balanced with a certain capillary force and different displacement pressure differences correspond to different capillary forces. Under a displacement pressure difference, the non-wet phase fluid (gas) displaces the wet phase fluid (the formation water) in the core. Therefore, the saturation of the wet phase (water) decreases as the displacement pressure difference increases. According to the displacement pressure balanced with the capillary pressure and the corresponding wet phase (water) saturation in the core during the displacement process, the correlation of the capillary force with the wet phase (water) saturation can be obtained. According to the research of Zou et al. [26,27], for a tight sandstone gas core, a hydrophilic semipermeable plate with a threshold pressure of 3 MPa should be selected. Thus, after the wet phase fluid saturates the semipermeable plate, the wet phase fluid can only pass through the semipermeable plate as a result of the capillary pressure until the displacement pressure is not less than the threshold pressure of the semipermeable plate. It is worth noting that the equilibration time should exceed 72 h for each pressure point.
2.4.2. Measurement of CH4 Recovery and CO2 Storage Efficiency through CO2 Flooding
Generally, higher water saturation always exists in tight sandstone gas reservoirs in China. As a consequence, irreducible water saturation under conditions of confining pressure and a displacement pressure drop should be established in the experiment first. The simulated formation water was injected into the long-core and CH4 was used to displace the water until the simulated formation water did not flow out of the long-core outlet.
The experiments were performed according to the following procedures.
- (1)
- The short tight sandstone cores were added to the long-core holder in order, which was placed into the thermostat box. The displacement flow path was connected, according to the experimental device diagram presented in Figure 1.
- (2)
- The long-core was vacuum-pumped. The thermostat box was set to 110 °C and the long-core confining pressure was set to 30 MPa.
- (3)
- The irreducible water saturation status of the combined tight long-core was obtained under conditions of confining pressure and a displacement pressure drop. The simulated formation water was injected into the closed long-core holding system from intermediate container 2. Consequently, high-purity CH4 gas was injected into the system from intermediate container 1. In this process, the simulated formation water was displaced by CH4 until it did not flow out of the long-core outlet, which indicated that this procedure was over.
- (4)
- Pure CH4 was continuously injected into the closed long-core holding system with a constant pressure of 8 MPa. The tight sandstone long-core was fully saturated with CH4 and the outlet valve was closed during the entire saturation process. The CH4 saturation process was considered to be completed when the inlet pressure was stable for more than 12 h.
- (5)
- The intermediate container 3, which was filled with high-purity CO2, was connected to the displacement device system. The pressures of the long-core inlet and outlet were 12 MPa and 8 MPa, respectively. This meant that the displacement differential pressure was 4 MPa. Each time that a 0.1 pore volume (PV) of CO2 was injected into the long-core, the pressure at each pressure point was recorded. Furthermore, the gas production at the outlet was also recorded and the gas contents of CH4 and CO2 were analyzed with the chromatography analyzer. The characteristics of CO2 migration and breakthrough of the front edge were monitored in real time. Additionally, the displacement efficiency of CO2 flooding CH4 was calculated. When the gas content of CO2 at the outlet exceeded 98%, the experiments were over.
- (6)
- Subsequent to each group of experiments, the tight sandstone long-core was vacuum-pumped and steps (2)–(5) were repeated.
3. Results and Discussion
3.1. CH4 Recovery through CO2 Flooding and CO2 Storage Efficiency under Constant Pressure Displacement
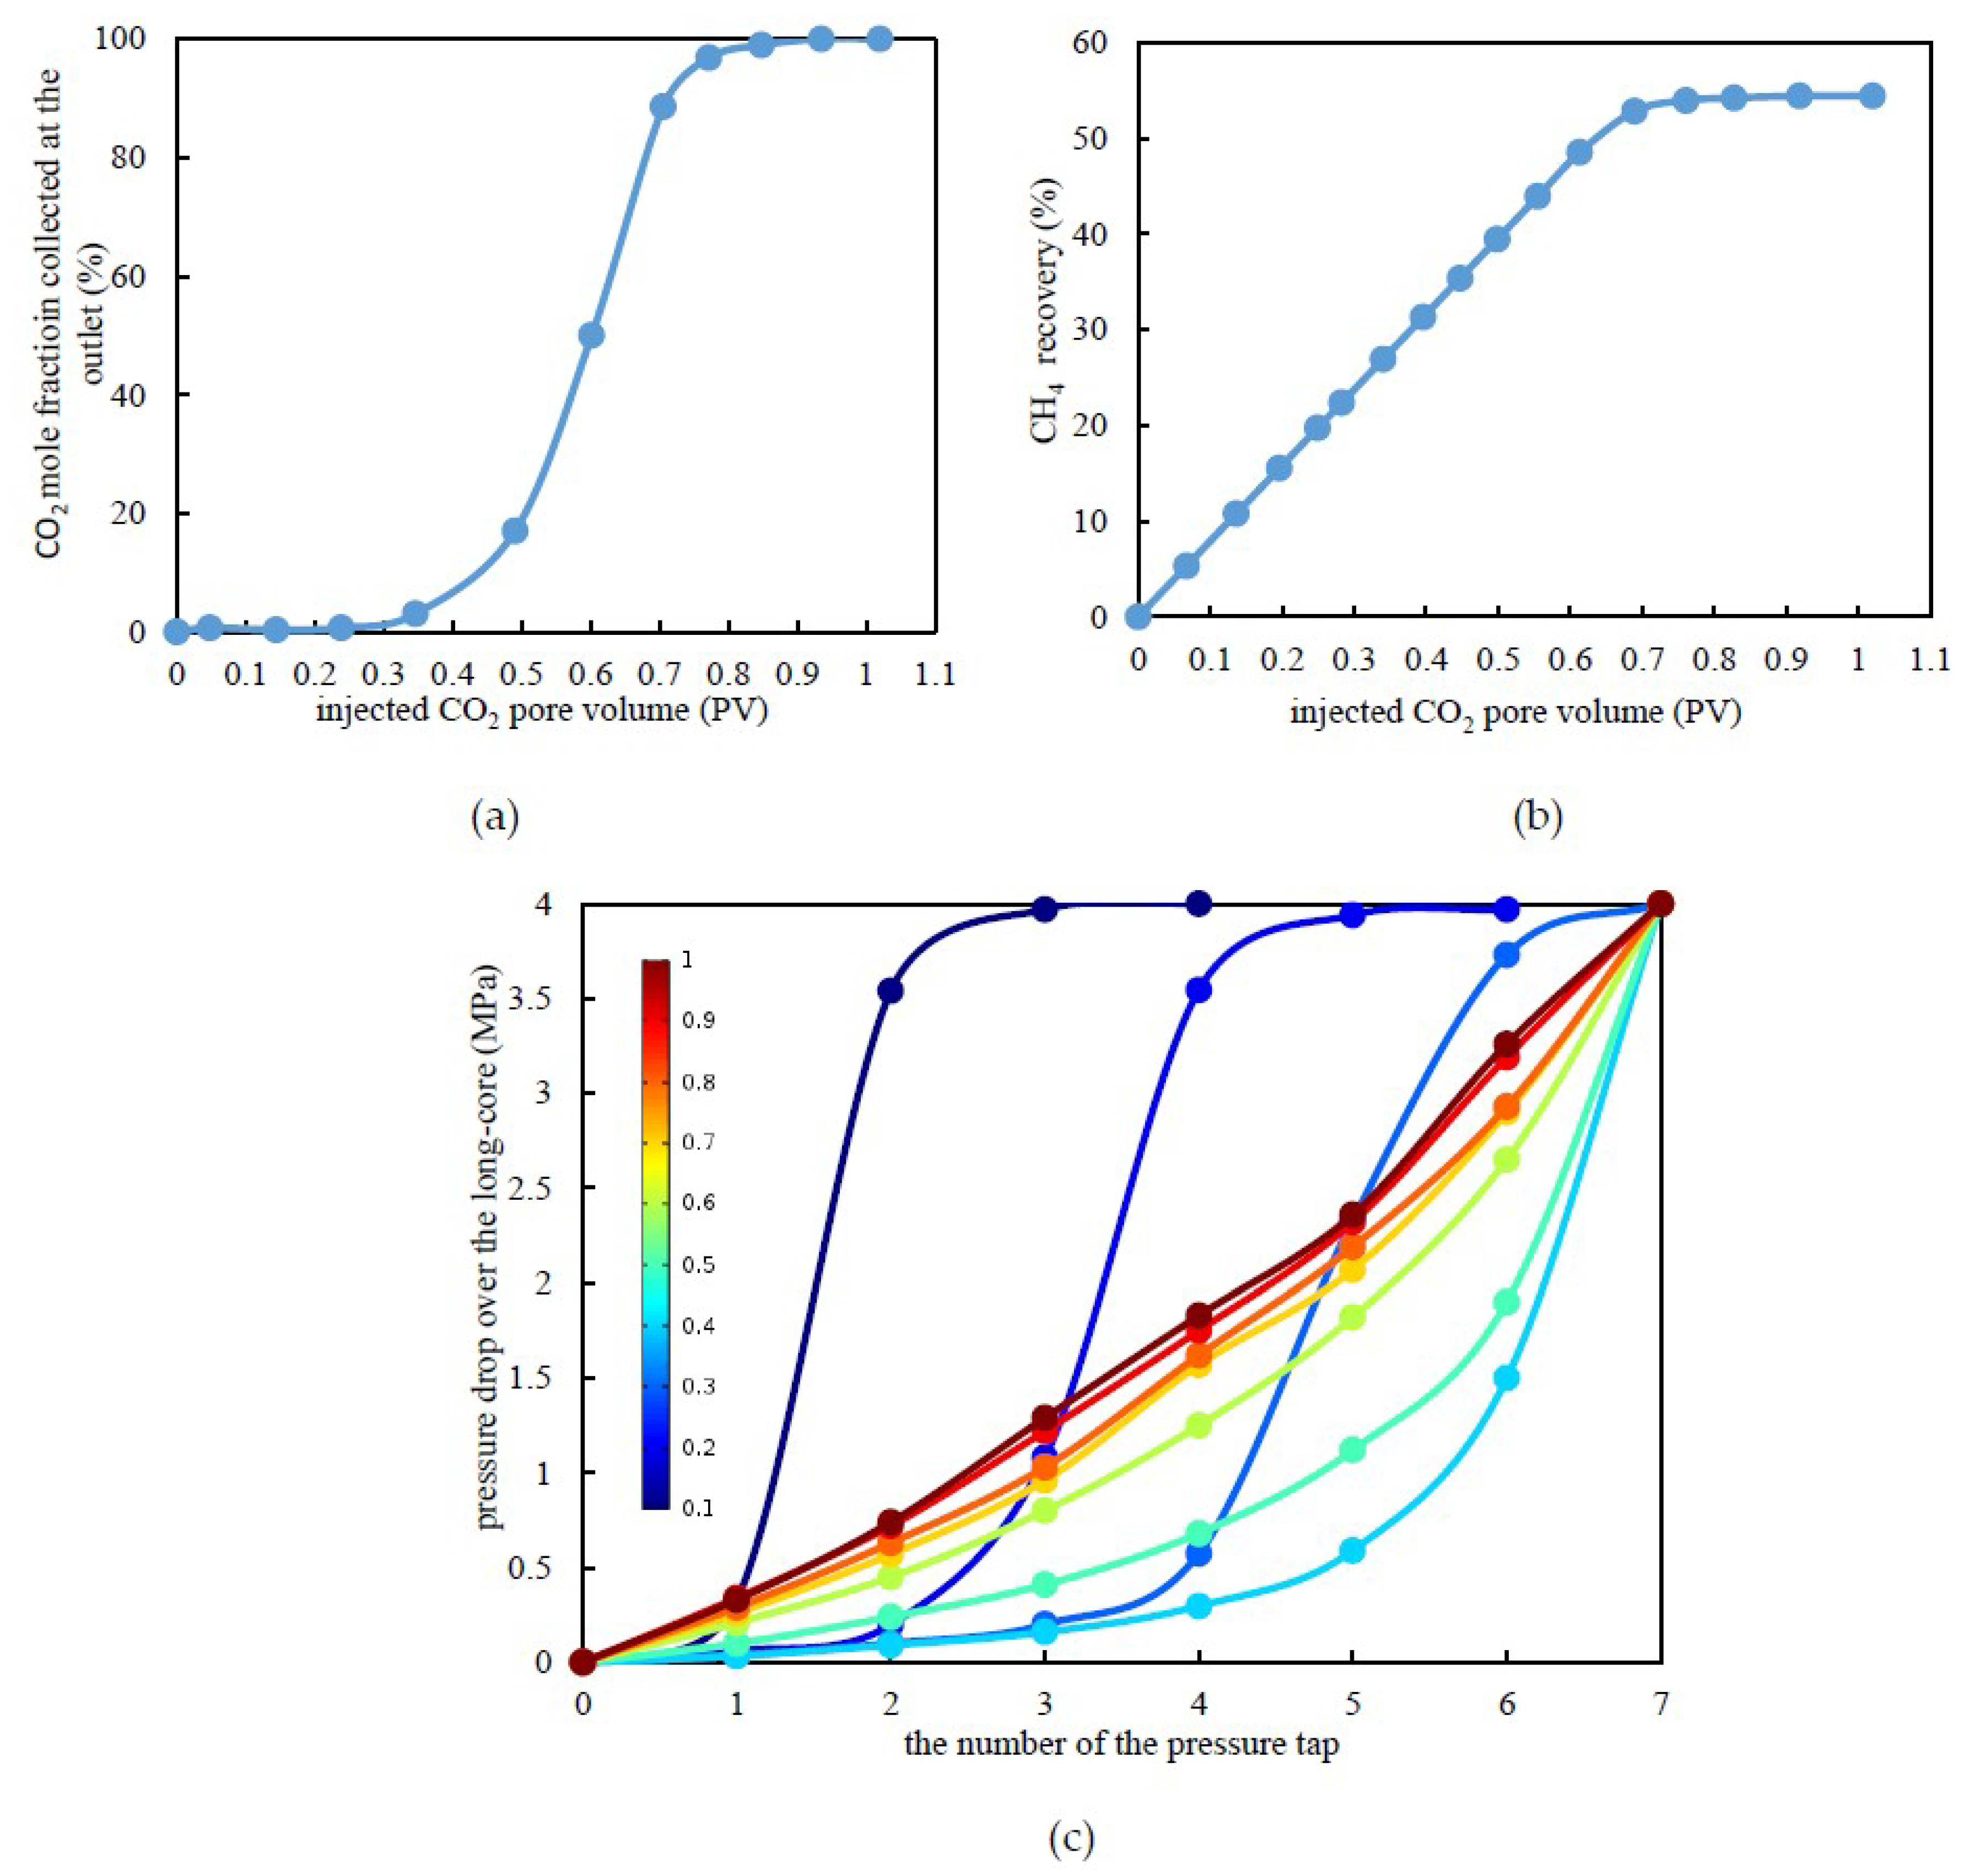
Under a confining pressure of 30 MPa, the irreducible water saturation of the combined tight long-core was 41.05% in this experiment. According to the previously mentioned experimental procedures, CO2 was injected to displace CH4 at a constant pressure of 4 MPa until the gas content of CO2 at the outlet exceeded 98%. The CO2 mole fraction collected at the outlet and the CO2 recovery calculated are shown in Figure 2a,b. Under the experimental temperature and pressure conditions, CO2 was in the supercritical state. The results demonstrated that the displacement front of supercritical CO2 would be miscible with CH4, which requires an extended duration of this process.
According to Figure 2a, as the pore volume (PV) of the injected CO2 increased to 0.4 PV, a current of CO2 was detected at the outlet, which indicated that displacement front breakthrough had occurred. Following this, the CO2 mole fraction collected at the outlet increased almost linearly with the pore volume of the injected CO2 until it reached 0.7 PV. When it reached approximately 0.8 PV, almost no CH4 was detected at the outlet, which indicates that the CH4 recovery had reached its maximum. It can be clearly observed from Figure 2c that the pressure drop was mainly diminished at the displacement leading edge. Before breakthrough of the leading edge, the higher the pore volume of the injected CO2, the further the pressure propagation, and, for the same pressure test point, the pressure drop decreased. As the injected CO2 reached 0.4 PV, breakthrough occurred at the displacement leading edge. Subsequently, with the increase in the pore volume of injected CO2, the distribution of the pressure drop was more uniform over the whole long-core. With the formation of continuous flow channels, the pressure drop tended to be stable. When the injected CO2 pore volume was 1.0 PV, the pressure drop curve was close to linear.
As seen in Figure 2b, the CH4 recovery from CO2 flooding was approximately 53.36%, which is an 18.36% increase when compared to the depletion development method for tight sandstone gas reservoirs. Therefore, it can be concluded that it is feasible to achieve EGR in tight sandstone gas reservoirs through CO2 flooding.
3.2. CH4 Recovery through CO2 Flooding and CO2 Storage Efficiency under Various Injection Rates
In order to determine the effect of the injection rate on EGR and CO2 storage efficiency, four groups of experiments were conducted using injection rates of 0.2, 0.4, 0.6, and 0.8 mL/min, respectively. The experimental results are presented in Figure 3.
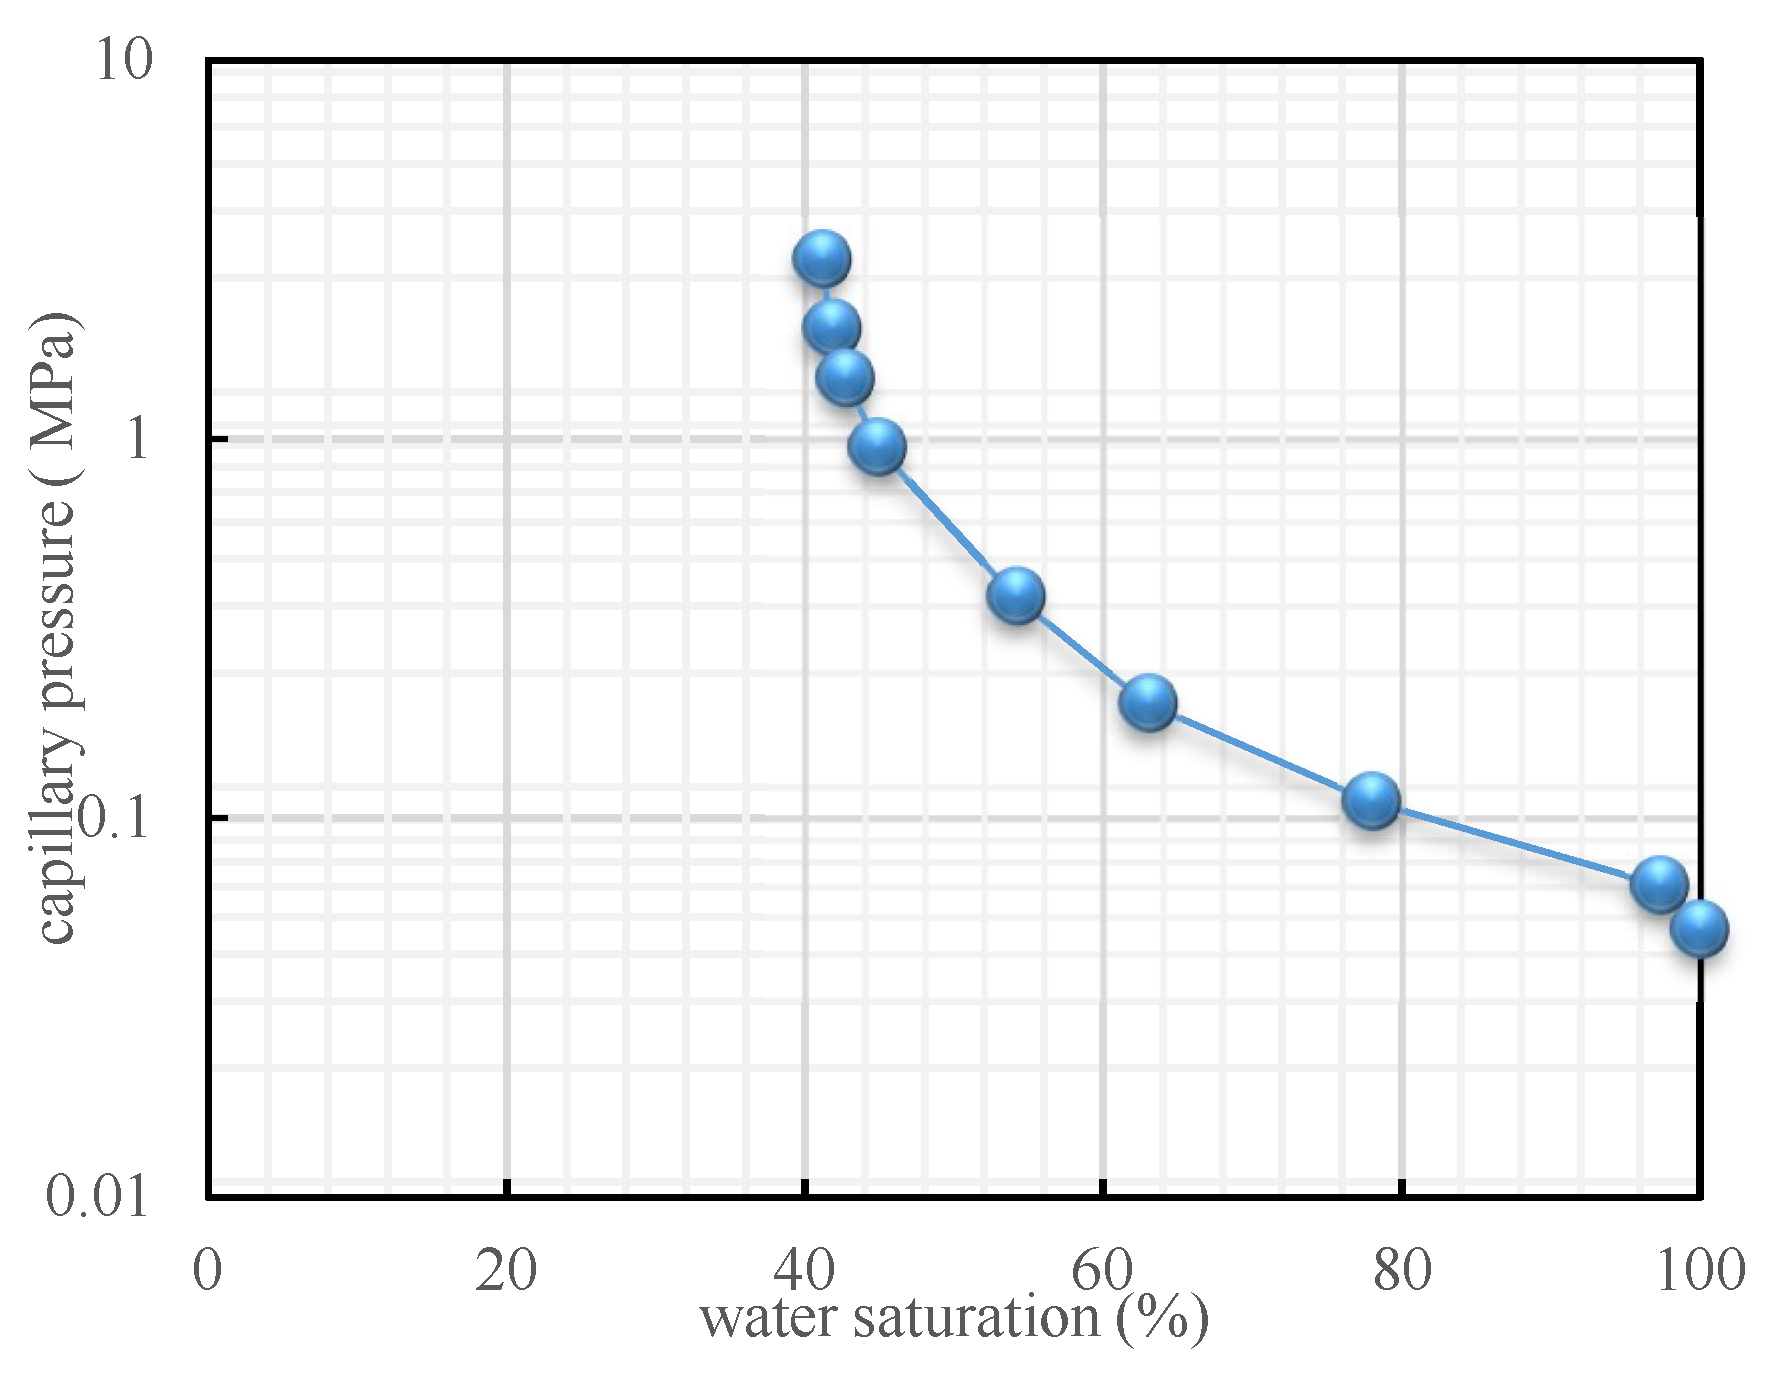
The results demonstrated that, with the injection rate conditions of 0.2, 0.4, 0.6, and 0.8 mL/min, displacement front breakthrough occurred when the injected CO2 pore volume was 0.34, 0.42, 0.47, and 0.60 PV, respectively (Figure 3a). The lower the displacement velocity is, the earlier the occurrence of displacement front breakthrough is. This result occurred because the diffusion of CO2 dominated under a lower injection rate. Moreover, the viscous pressure drop, which was generated by the flow and the capillary pressure between the gas and the water, constituted the percolation resistance. At a lower injection rate, because the water in the tiny capillaries could barely be driven and the long-core was already in a state of near-irreducible water saturation, the capillary pressure had little effect on the gas flow. CO2 mainly flowed in the channels formed by larger-sized pores and throats. The main seepage resistance was the viscous force between the gas and the water attached to the pore surface while the viscous force was relatively lower at a lower injection rate. This was also a reason for gas breakthrough occurring sooner. Under a higher injection rate, in order to overcome higher seepage resistance, the injection pressure was apparently higher, which caused displacement of the additional water in the tiny capillaries. Consequently, the water saturation further decreased and the capillary pressure increased (Figure 4). When the water saturation decreased from 41.5% to 40.75%, the capillary force rapidly increased from 2.09 to 3.52 MPa. That means that the water saturation only decreased by less than 1.8% but caused an increase in a capillary force up to 168%. In this case, the capillary pressure and the viscous force increased simultaneously, but the seepage resistance was too high, which requires more time for the breakthrough to occur.
Figure 3b shows the changing degrees of CH4 recovery with varying injection rates. There were large differences in the degree of CH4 recovery for different time frames of CO2 breakthrough. At CO2 leading edge breakthrough, the CH4 recovery was 43.24%, 46.10%, 50.46%, and 56.25%, which corresponds to the CO2 injection rates of 0.2, 0.4, 0.6, and 0.8 mL/min. The difference between the maximum and the minimum degree of recovery was 13.01%. However, at the end of displacement, CH4 recovery corresponding to the four injection rates above was 56.39%, 57.32%, 58.00%, and 59.80%. The CH4 recovery difference was only 3.4% over the entire displacement range. This phenomenon demonstrated that the miscible behavior between supercritical CO2 and CH4 mainly occurred at the leading edge of the displacement and it required more time to occur under lower displacement velocity conditions. Therefore, the miscible band range was also relatively higher. In addition, a continuous flow channel gradually formed following breakthrough of the leading edge and, subsequently, no additional water outflow occurred at the outlet. This meant that the capillary pressure was essentially constant and the viscous force was slightly decreased. In general, slight changes existed in the swept volume of CO2 flooding at various injection rates. Consequently, the injection rates had slight differences during EGR by CO2 flooding.
During CO2 flooding, the increase in the pressure drop accelerated with the injected CO2 pore volume prior to the displacement front breakthrough (Figure 3c). The pressure drop over the long-core attained its maximum value prior to the moment of the breakthrough. At the different breakthrough points, the pressure drop over the long-core was 2.12, 4.07, 5.89, and 8.16 MPa. Subsequently, the pressure drop decreased gradually and the speed decreased more quickly for higher injection rates of displacement under the same injected CO2 pore volume conditions. At a lower injection rate, breakthrough of the leading edge mainly depended on the diffusion of CO2 molecules. Consequently, the pressure drop became slower after breakthrough. As a flowing single gas gradually becomes a mixture of gases, the pressure drop was mainly concentrated in the latter half of the long-core. The closer to the outlet the pressure drop concentration is, the higher the resistance to seepage is.
The proportion of CO2 being stored is defined as the ratio of the amount of CO2 storage to the total amount of CO2 injected. In the initial stage, most of the injected CO2 remained in the long-core and the proportion of CO2 being stored was higher (Figure 3d). From the injection of CO2 to breakthrough of the leading edge, the proportion of the stored CO2 decreased from 100% to 84.85%, 85.07%, 86.76%, and 87.64%, which corresponds to CO2 injection rates of 0.2, 0.4, 0.6, and 0.8 mL/min, respectively. Following CO2 breakthrough, the proportion of stored CO2 decreased rapidly and it was almost unaffected by the injection rate. The final proportion of CO2 being stored was 32.50%. This occurred due to the fact that both CO2 and CH4 had sufficient time to achieve sufficient miscibility with a lower injection rate. Therefore, additional CO2 was stored subsequently to the leading edge breakthrough. To a certain extent, a higher CO2 injection rate could improve gas recovery. However, it would also lead to larger pressure loss in a short time, which is not conducive to sustainable, stable production. As a consequence, the actual production system for developing tight sandstone gas reservoirs should take into account the joint determination of EGR and the economic payback period.
3.3. CH4 Recovery through CO2 Flooding and CO2 Storage Efficiency under Dry and Aqueous Cores
In general, higher water saturation is common in the tight sandstone gas reservoirs of China [5]. In one group of experiments, the tight long-core was saturated with high-purity and dry CH4. In the other group, an aqueous long-core with an irreducible water saturation of 41.5% existed under the confining pressure of 30 MPa. The injection rate was 0.2 mL/min.
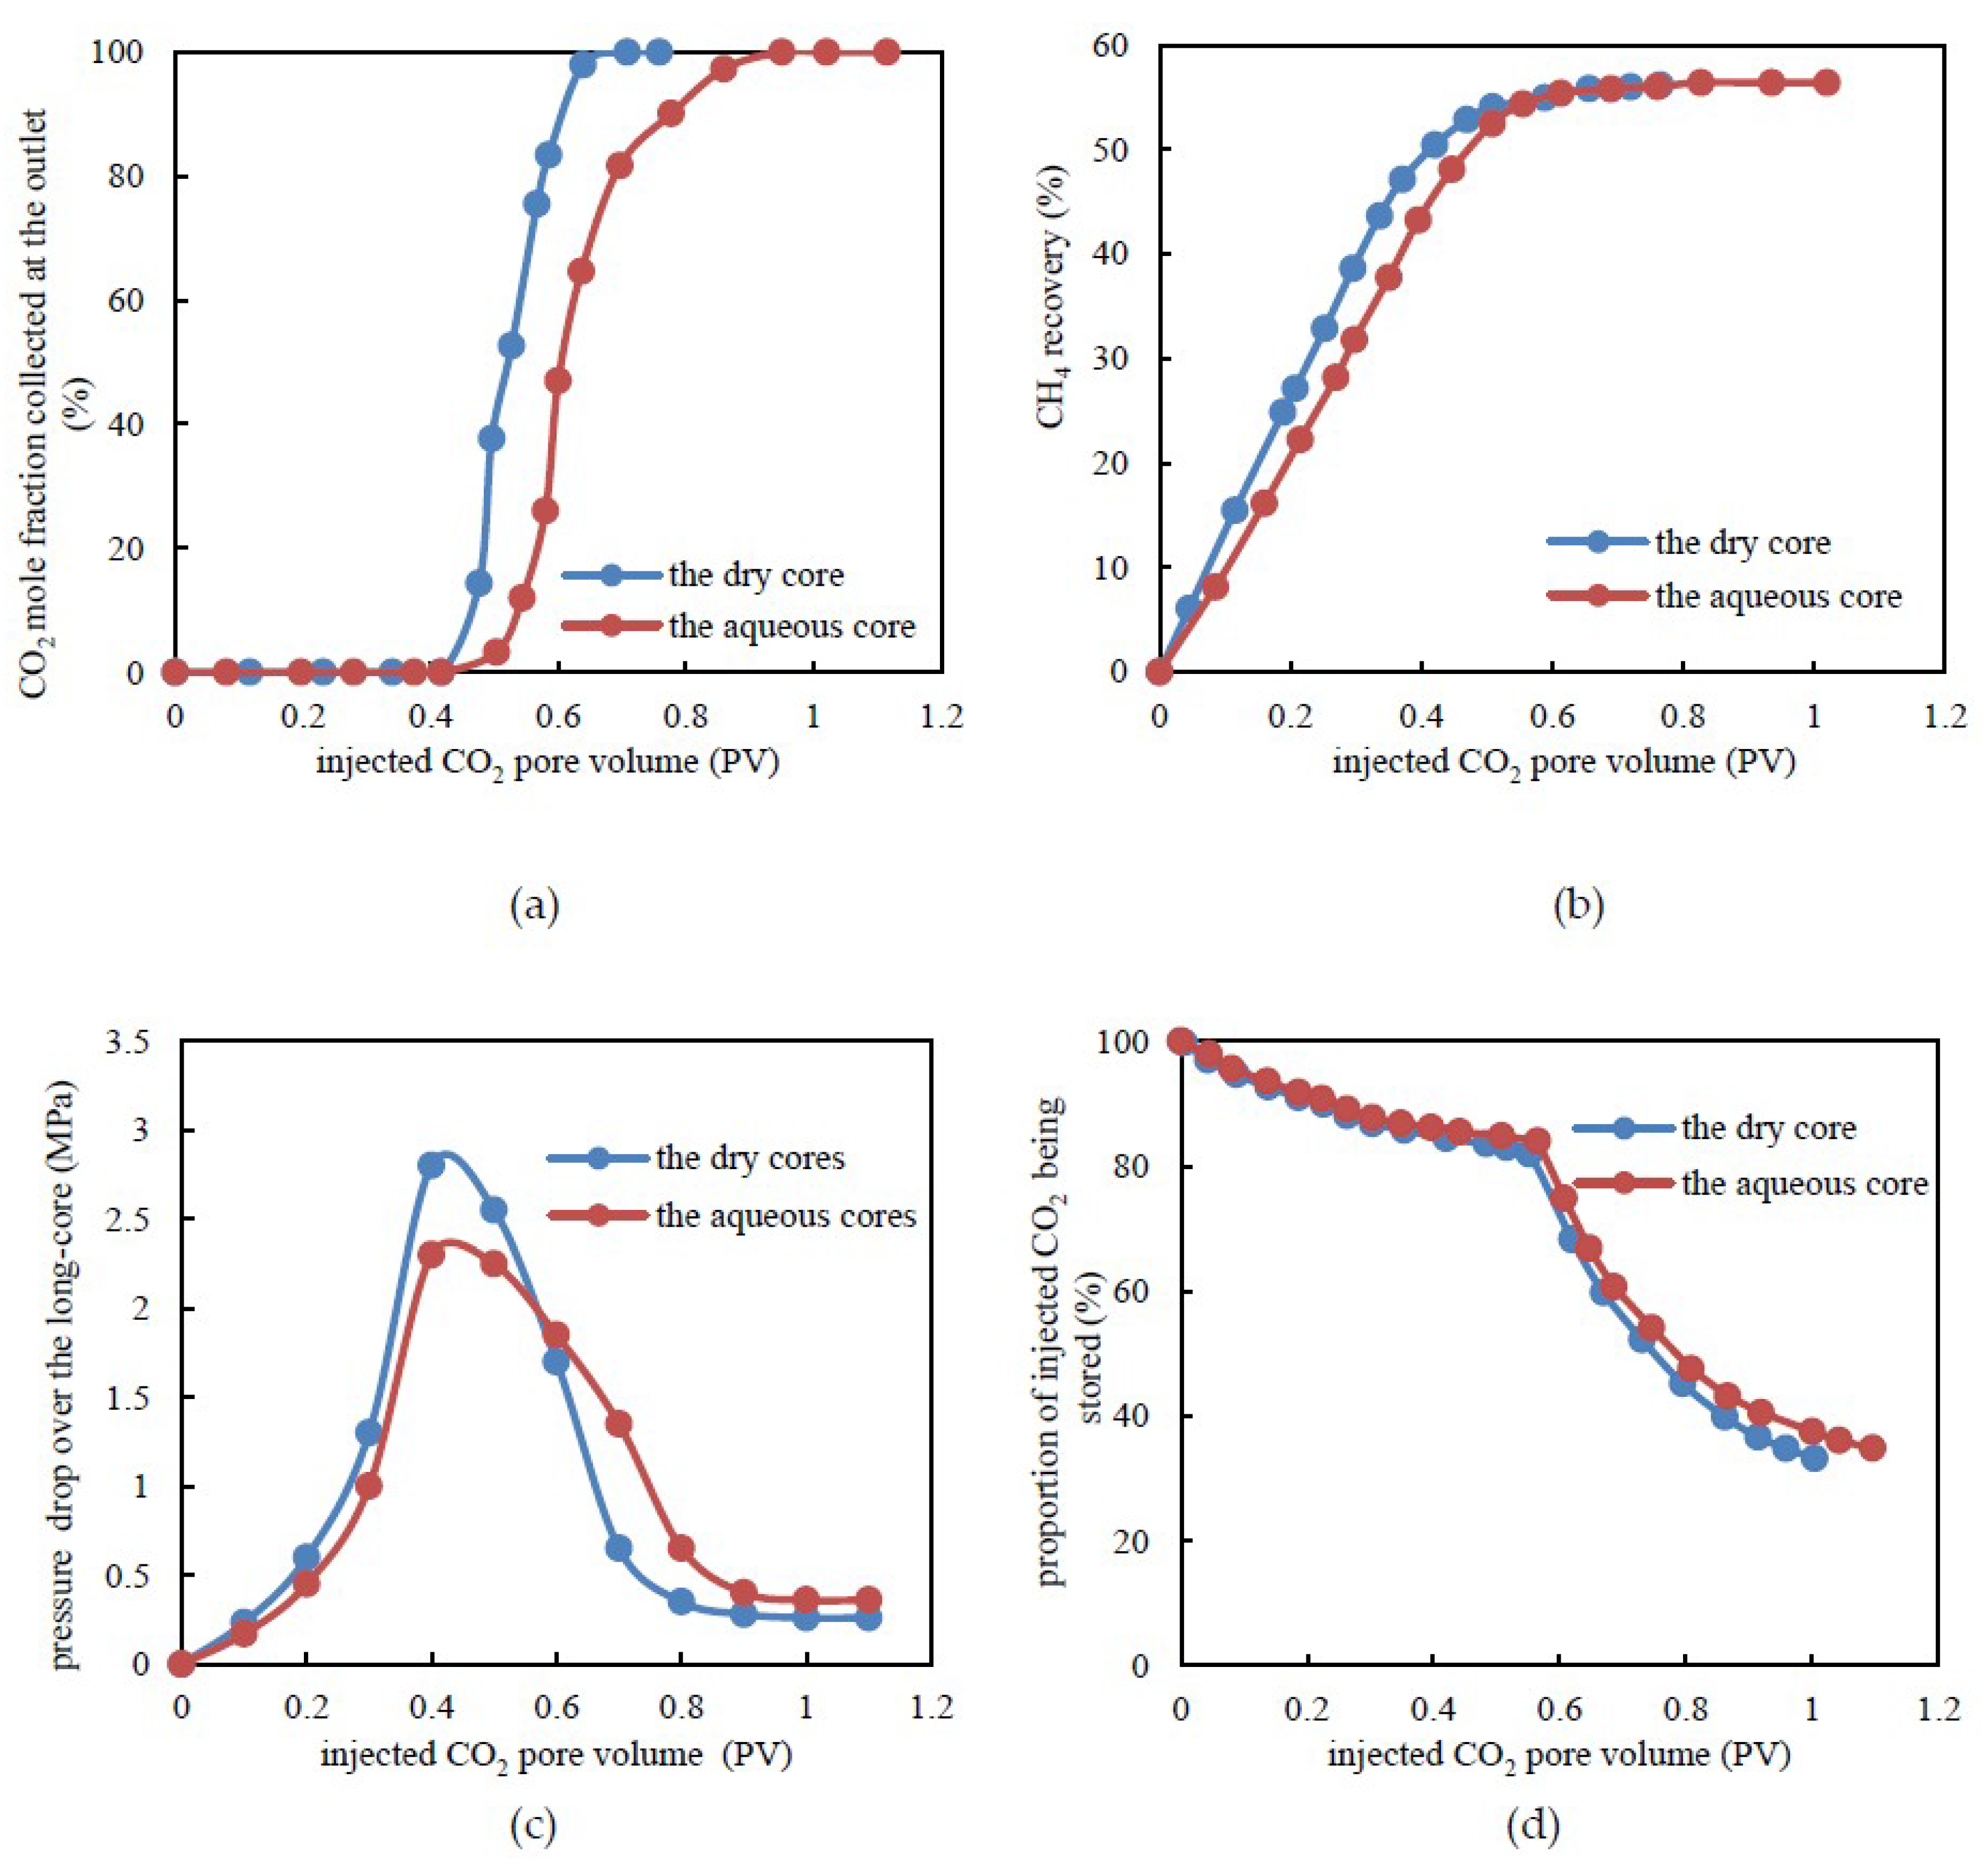
The results demonstrated that the displacement front broke through when the injected CO2 pore volume was 0.4 PV for the dry long-core while it was up to 0.5 PV for the aqueous core (Figure 5a). For the former, when the injected CO2 was 0.76 PV, the CO2 mole fraction collected at the outlet was 100% and no more CH4 was displaced. For the latter, this situation did not occur until the injected CO2 was 0.95 PV. Due to the presence of water, a portion of injected CO2 initially dissolved and formed unstable carbonic acid in the water. In the same area, when the carbonic acid was saturated in the aqueous solution, CO2 began to displace CH4. Consequently, leading edge breakthrough occurred slightly later in time for the aqueous long-core with CO2 flooding. When the CO2 leading edge broke through, the CH4 recovery was 48.78% and 52.48%, which corresponds to the dry long-core and the aqueous core. However, at the end of displacement, the corresponding CH4 recovery was 54.68% and 56.23%, respectively (Figure 5b). In previous studies [28], it was shown that, due to the strong adsorption capacity of the tight sandstone rock surface, a tiny fraction of pores and throats might be blocked by water. Consequently, CH4 exists in relatively larger-sized pores and throats, so it is more easily displaced. The amount of gas in this part was quite limited. Therefore, CO2-EGR for the aqueous long-core was slightly enhanced when compared to the dry long-core.
As shown in Figure 5c, there was less variation in the range of pressure drop values for the aqueous long-core when compared to the dry long-core. Due to a portion of injected CO2 being dissolved in the formation water, under the same injected CO2 pore volume, the pressure drop was relatively lower when compared to the dry long-core. The higher the pressure, the higher the proportion of dissolved CO2 in the formation water. At the point of CO2 leading edge breakthrough, the pressure drop over the dry long-core and the aqueous long-core was 2.85 and 2.32 MPa. Following breakthrough of the leading edge, for the aqueous long-core, the seepage resistance was lower when compared to the dry long-core. Therefore, the pressure drop decreased more slowly.
From the injection of CO2 to the breakthrough of the leading edge, the proportion of the stored CO2 decreased from 100% to 84.03% and 84.80%, which corresponds to the dry long-core and the aqueous core, respectively (Figure 5d). Following breakthrough of CO2, the proportion of CO2 being stored decreased rapidly for the two situations mentioned above. At the end of displacement, the proportion of CO2 being stored was 33.07% and 34.92%. In summary, due to the dissolution of CO2 in the formation water, the total CO2 being stored in the aqueous tight long-core was about 5% higher than that of the dry long-core during the whole displacement process. For the aqueous long-core, CO2 was mainly stored by two mechanisms. One was to displace CH4 and occupy its former position and the other way was to dissolve in the formation water. Accordingly, a slightly improved geological storage effect existed for CO2 in tight sandstone reservoirs with formation water. This indicates that CO2 flooding is more suitable for an aqueous tight sandstone gas reservoir (such as in China) since it results in a higher degree of enhanced gas recovery and improved CO2 storage. In addition, with a stable injection rate, since the CO2-EGR method can more or less mitigate the hindrance of water relative to the gas flow, controlling the water saturation could be regarded as a major factor rather than a primary factor in the development process of actual tight sandstone gas reservoirs.
3.4. CH4 Recovery through CO2 Flooding and CO2 Storage Efficiency under Various Formation Dip Angle Conditions
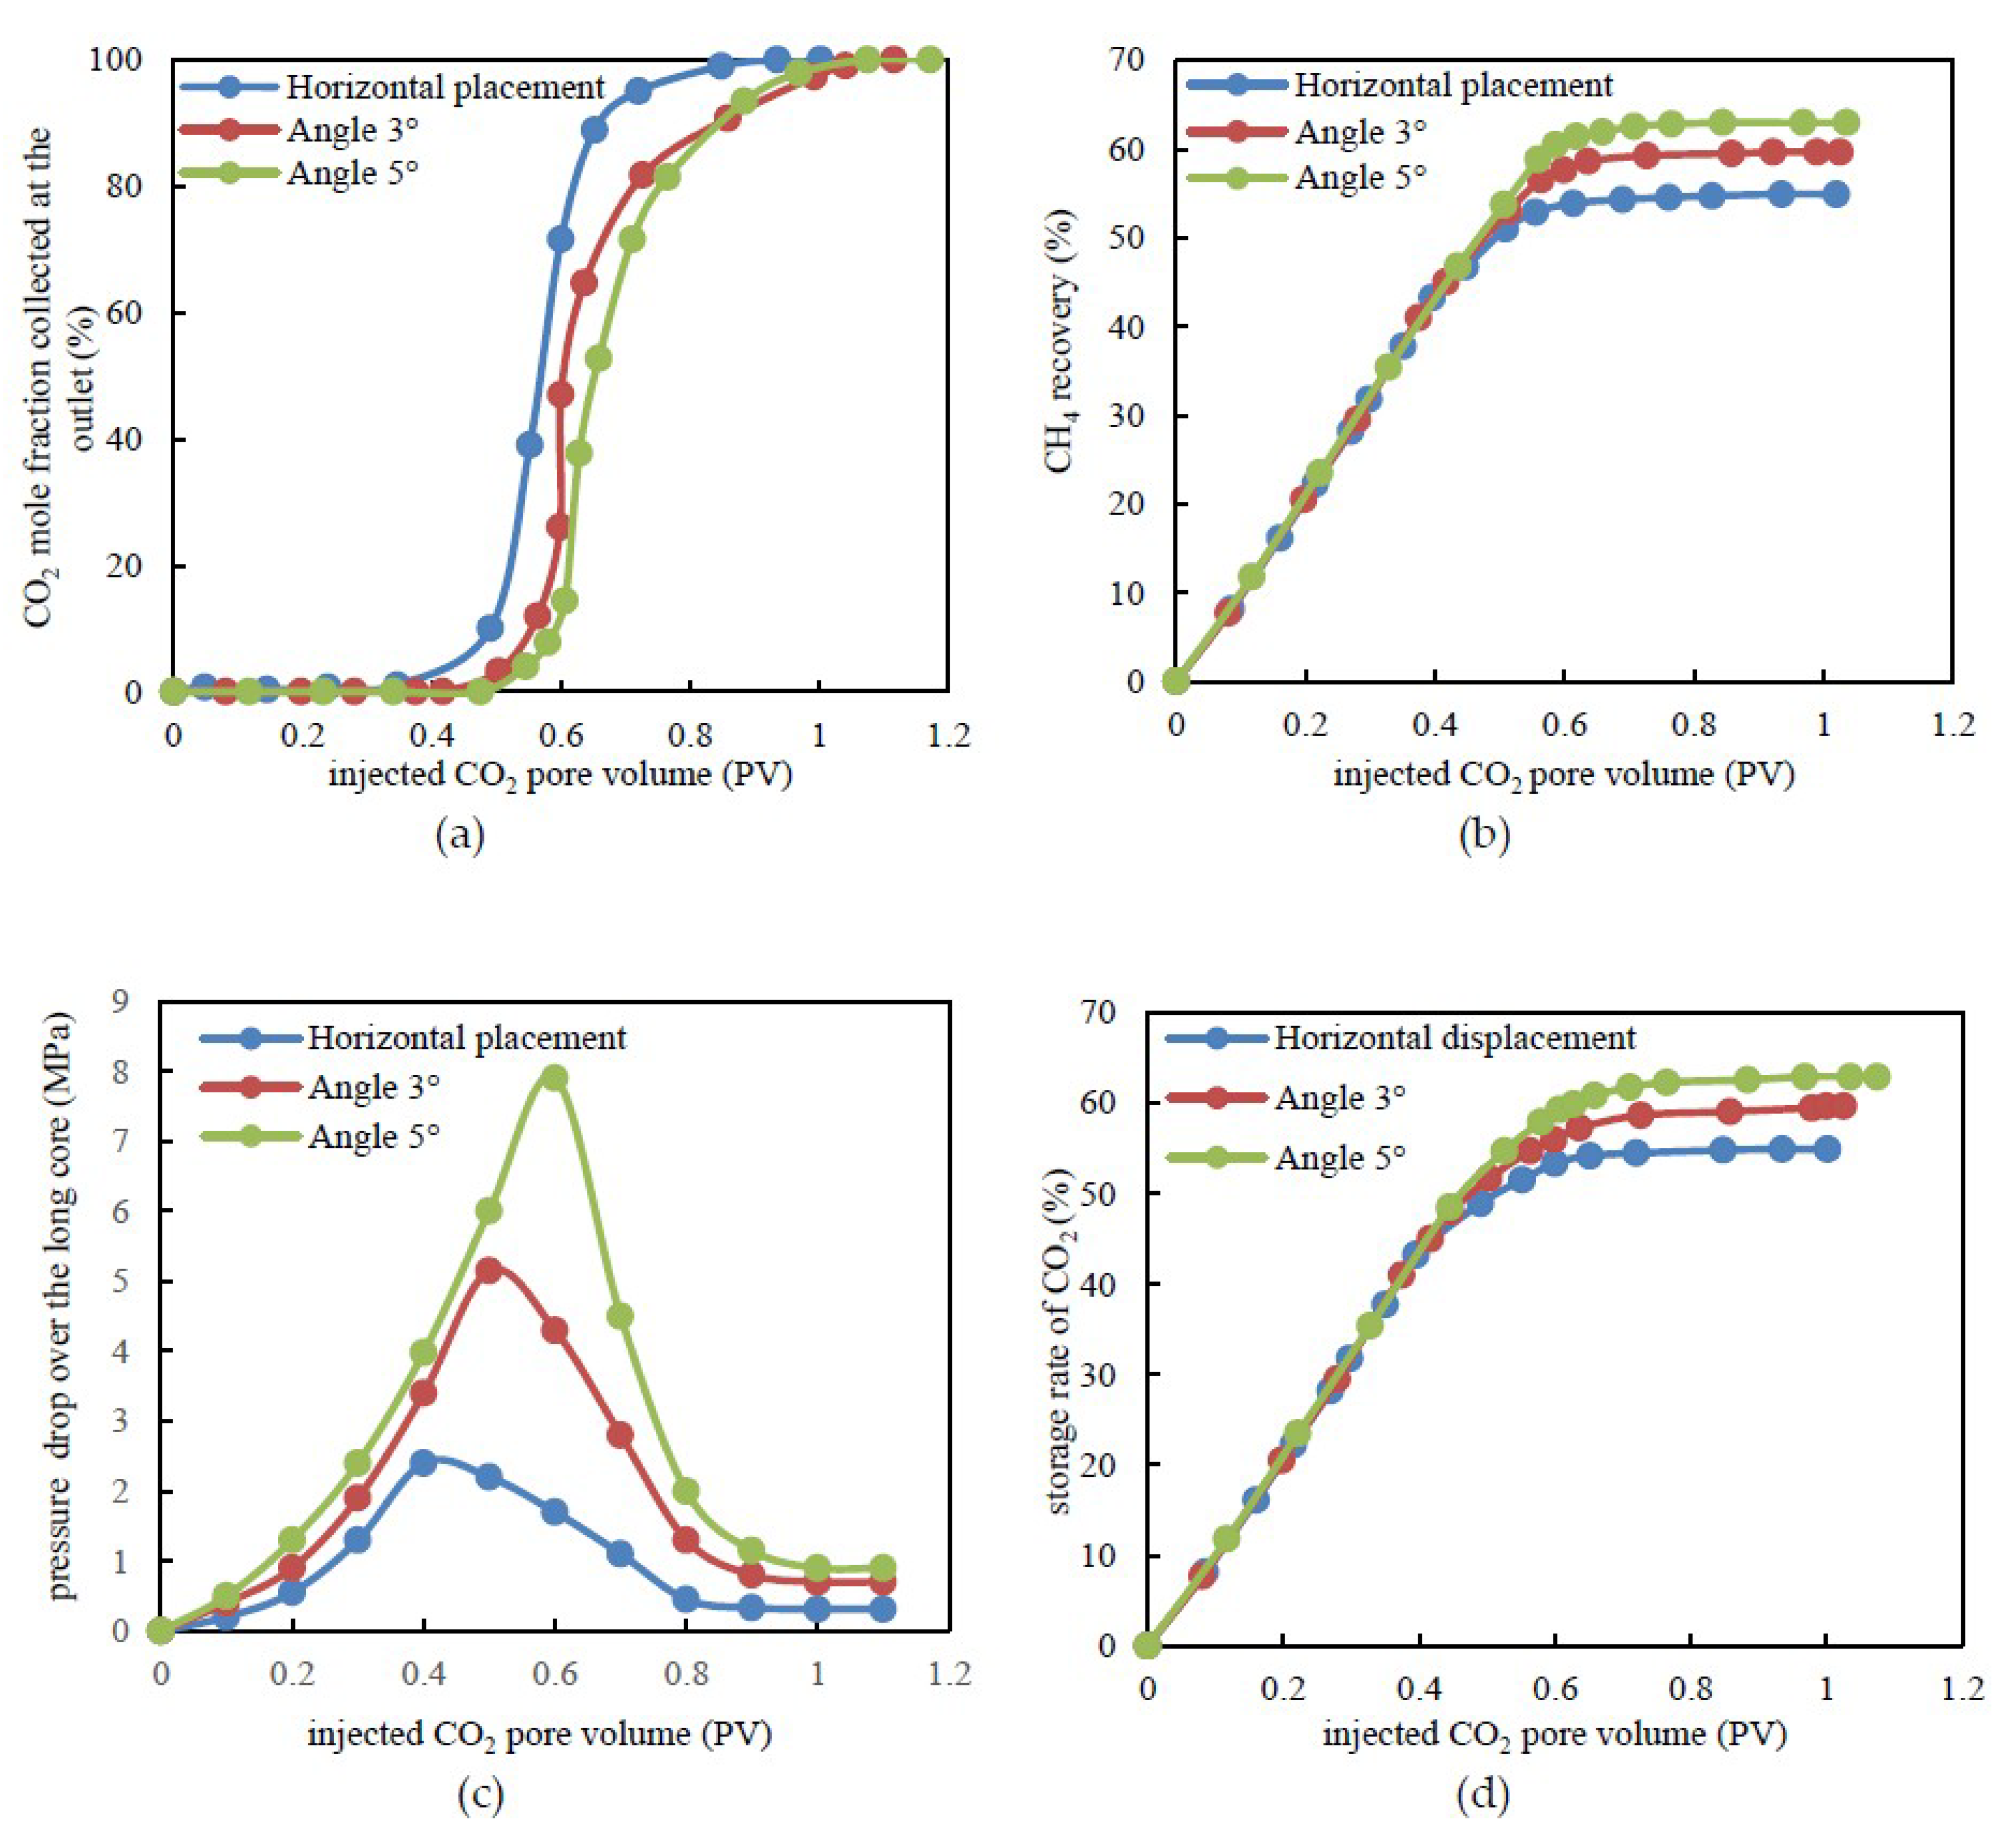
Since the density of supercritical CO2 was higher when compared to CH4, the injected CO2 tended to deposit at the reservoir bottom. Therefore, three groups of experiments were carried out to study the formation angle effect on EGR through CO2 flooding. In the displacement experiments, the injection end of the long-core was at a lower position and the corresponding outlet was at a higher position with formation dip angles of 3° and 5°, respectively, relative to the actual formation conditions. In addition, a group of experiments was designed for comparison with the long-core placed horizontally. The injection rate was 0.2 mL/min.
The results demonstrated that the displacement front breakthrough occurred when the injected CO2 pore volume was 0.37, 0.51, and 0.60 PV, which corresponds to the horizontally placed long-core and dip angles of 3° and 5°, respectively (Figure 6a). The higher the dip angle, the longer the miscible band and the later CO2 breakthrough occurred. Since the stage before CH4 breakthrough is an important period for CO2 storage, such experimental results indicated that the CO2 storage rate could be increased by at least around 1.5 times at this stage for a tight sandstone gas reservoir even with a small dip angle. When the CO2 leading edge broke through, the CO2 recovery was 40.49%, 53.03%, and 59.06%, which corresponds to the horizontally placed long-core and dip angles of 3° and 5°, respectively (Figure 6b). In addition, at the end of displacement, the corresponding CH4 recovery was 54.49%, 59.65%, and 62.95%, respectively. Due to the higher density of supercritical CO2, it was easier for CH4 to move from the bottom to the higher part. Moreover, the gravitational differentiation between CO2 and CH4 limited the mixing of gases in the vertical direction, which was beneficial to the displacement. Furthermore, as the viscosity of supercritical CO2 was higher when compared to CH4, a favorable mobility ratio could improve the displacement stability. An additional 5% to 8% recovery of CH4 could be achieved when compared to the horizontally placed long-core due to the dip angles (Figure 6b).
In terms of a pressure drop over the long-core, a relatively higher seepage resistance existed in the long-core with a dip angle at the early stage, which leads to a higher pressure drop for the same injected CO2 pore volume (Figure 6c). At the point of CO2 leading edge breakthrough, the pressure drop over the long-core was 2.40, 5.15, and 7.9 MPa, which corresponds to the horizontally placed long-core and dip angles of 3° and 5°, respectively. Subsequent to leading edge breakthrough, the pressure difference decreased faster in the slanted long-core. For the long-cores with a dip angle, the gravity increased the flow pressure at the injection end while the CH4 at the bottom was displaced to a higher position by CO2. The higher the dip angle, the higher the pressure drop over the long-core and the larger the stored volume of CO2. The geological rate of CO2 refers to the ratio of the amount of CO2 storage to the pore volume of the core. Consequently, CO2 could occupy the additional space that previously belonged to CH4. Furthermore, the storage rate of injected CO2 would be higher under the same conditions (Figure 6d). From the injection of CO2 to breakthrough of the leading edge, the stored rate of CO2 gradually reached 40.49%, 52.68%, and 56.29%, which corresponds to the horizontally placed long-core and dip angles of 3° and 5°, respectively. At the end of the displacement, the corresponding storage rate of CO2 was eventually 54.88%, 59.65%, and 62.90%. Thus, the geological rate of CO2 increased by 4.77% and 8.02% for the long-cores with dip angles of 3° and 5°. Therefore, the CH4 recovery and CO2 storage could be improved CO2 flooding in tight gas sandstone reservoirs with a dip angle.
In addition, before CO2 breakthrough, the pressure drop over the long-core with a dip angle of 5° was approximately four times that without a dip angle under the same injection rate and it stored a large amount of displacement energy. This suggested that the initial bottom-hole pressure should be appropriately higher in tight sandstone gas reservoirs with a dip angle. The purpose is to reduce the rapid coning entry of CH4 and CO2 after the gas leading edge breakthrough. Then the bottom-hole pressure should be slowed as the development progresses in order to effectively extend the effective period of CO2-EGR and improve the storage rate of CO2.
4. Conclusions
In this work, the extent of CO2-EGR and CO2 geological storage in a tight sandstone gas reservoir were investigated by carrying out a series of long-core displacement experiments with the purpose of analyzing the feasibility of CO2-EGR. The effects of the injection rate, the water content of the core, and the ability to achieve CO2 geological storage are discussed in detail and their implications for CO2-EGR are summarized. It is found that the CH4 recovery through CO2 flooding is approximately 53.36%, which is an 18.36% increase when compared to the depletion development method for tight sandstone gas reservoirs. Additionally, the CO2 geological rate is around 60%. The CH4 recovery and CO2 geological rate are related to the time of CO2 leading edge breakthrough and the pressure drop distribution along the long-core. First, a higher injection rate improves the CH4 recovery and CO2 geological rate to some extent. However, a higher CO2 injection rate leads to greater pressure loss. Therefore, a reasonable developing strategy for tight sandstone gas reservoirs should consider the combined effect of EGR and economic payback period. Second, for the aqueous tight long-core due to the dissolution of CO2 in the formation water, the CH4 recovery and the CO2 geological rate are increased by 1.5% and 5%, respectively. The water phase reduces the pressure loss and extends the time to the gas leading edge breakthrough. Therefore, when a CO2-EGR method is utilized to develop a tight sandstone gas reservoir, controlling water saturation could be regarded as a major factor rather than a primary factor. Third, compared with the horizontally placed long-core, the CH4 recovery increases by an additional 5% to 8% for an inclined long-core with dip angles of 3° and 5°. In addition, the geological rate of CO2 increases by 4.77% and 8.02%. Additionally, based on the pressure drop over the long-core before CO2 breakthrough, the initial bottom-hole pressure should be appropriately higher in tight sandstone gas reservoirs with a dip angle. Then the bottom-hole pressure should be slowed as the development progresses in order to extend the effective period of CO2-EGR and improve the geological rate of CO2. This research is of great significance for guiding a successful CO2-EGR process for the actual development of tight sandstone gas reservoirs.
Author Contributions
F.W. and Y.L. put forward the idea of the experiments in this paper; C.H. and Y.W. designed a series of experiments scheme and wrote the paper; A.S. and S.L. contributed to the results analysis and post-processing. All authors reviewed the manuscript.
Funding
This work was supported by the Natural Science Fund of China project (51804076) and the Natural Science for Youth Foundation of Heilongjiang Province (Grant No. QC2018047).
Conflicts of Interest
The authors declare no conflict of interest.
References
- Peter, G.H.; Bath, O.B. Status report on miscible/immiscible gas flooding. J. Pet. Sci. Eng. 1989, 2, 103–117. [Google Scholar] [CrossRef]
- Santos, L.; Marcondes, F.; Sepehrnoori, K. A 3D compositional miscible gas flooding simulator with dispersion using Element-based Finite-Volume method. J. Pet. Sci. Eng. 2013, 112, 61–68. [Google Scholar] [CrossRef]
- Chen, M.; Wang, H.; Liu, Y.; Ma, L.; Wu, D.; Wang, S. Corrosion behavior study of oil casing steel on alternate injection air and foam liquid in air-foam flooding for enhance oil recovery. J. Pet. Sci. Eng. 2017, 165, 970–977. [Google Scholar] [CrossRef]
- Hosseini, S.; Alfi, M.; Nicot, J.; Nunez, L. Analysis of CO2 storage mechanisms at a CO2-EOR site, Cranfield, Mississippi. Greenhouse. Gases Sci. Eng. 2018, 27, 218–229. [Google Scholar] [CrossRef]
- Lai, F.; Li, Z.; Zhang, W.; Dong, H.; Kong, F.; Jiang, Z. Investigation of Pore Characteristics and Irreducible Water Saturation of Tight Reservoir Using Experimental and Theoretical Methods. Energy Fuels 2018, 32, 1–18. [Google Scholar] [CrossRef]
- Wang, H.; Ma, F.; Tong, X.; Liu, Z.; Zhang, X.; Wu, Z.; Li, D.; Wang, B.; Xie, Y.; Yang, L. Assessment of global unconventional oil and gas resources. Pet. Explor. Dev. 2016, 43, 850–862. [Google Scholar] [CrossRef]
- Guo, S.; Lyu, X.; Zhang, Y. Relationship between tight sandstone reservoir formation and hydrocarbon charging: A case study of a Jurassic reservoir in the eastern Kuqa Depression, Tarim Basin, NW China. J. Nat. Gas Eng. 2018, 52, 304–316. [Google Scholar] [CrossRef]
- Wang, F.; Liu, Y.; Hu, C.; Shen, A.; Liang, S.; Cai, B. A Simplified Physical Model Construction Method and Gas-Water Micro Scale Flow Simulation in Tight Sandstone Gas Reservoirs. Energies 2018, 11, 1559. [Google Scholar] [CrossRef]
- Gomez, A.; Briot, P.; Raynal, L.; Broutin, P.; Gimenez, M.; Soazic, M.; Cessat, P.; Saysset, S. ACACIA Project—Development of a Post-Combustion CO2 Capture Process. Case of the DMXTM Process. Oil Gas Sci. Technol. 2014, 69, 1121–1129. [Google Scholar] [CrossRef]
- Shi, Y.; Jia, Y.; Pan, W.; Huang, L.; Yan, J.; Zheng, R. Potential evaluation on CO2-EGR in tight and low-permeability reservoirs. Nat. Gas Ind. B 2017, 37, 62–69. [Google Scholar] [CrossRef]
- Littke, R.; Krooss, B.; Merkel, A.; Gensterblum, Y. Gas saturation and CO2 enhancement potential of coalbed methane reservoirs as a function of depth. AAPG Bull. 2014, 98, 395–420. [Google Scholar] [CrossRef]
- Liang, W.; Wu, D.; Zhao, Y. Experimental study of coalbeds methane replacement by carbon dioxide. Chin. J. Rock Mech. Eng. 2010, 29, 665–673. (In Chinese) [Google Scholar]
- Zeng, Q.; Wang, Z.; Liu, L.; Ye, J. Modeling CH4 Displacement by CO2 in Deformed Coalbeds during Enhanced Coalbed Methane Recovery. Energy Fuels 2018, 32, 1942–1955. [Google Scholar] [CrossRef]
- Dang, Y.; Zhao, L.; Lu, X.; Xu, J.; Sang, P.; Guo, S.; Zhu, H.; Guo, W. Molecular simulation of CO2/CH4 adsorption in brown coal: Effect of oxygen-, nitrogen-, and sulfur-containing functional groups. Appl. Surf. Sci. 2017, 423, 33–42. [Google Scholar] [CrossRef]
- Murray, R.; Derek, B.; Ferus, I.; Cui, X.; Cory, T.; Mike, C. A Laboratory Study of CO2 Interactions within Shale and Tight Sand Cores-Duvernay, Montney and Wolfcamp Formations. In Proceedings of the SPE Canana Unconventional Resources Conference, Calgary, AB, Canada, 13–14 March 2018. [Google Scholar] [CrossRef]
- Xu, C.; Cai, J.; Yu, Y.; Yan, K.; Li, X. Effect of pressure on methane recovery from natural gas hydrates by methane-carbon dioxide replacement. Appl. Energy 2018, 217, 527–536. [Google Scholar] [CrossRef]
- Stanfield, P. Use of low- and High-IFT fluid Systems in experimental and numerical modeling of Systems that mimic CO2 storage in deep saline Formations. J. Pet. Sci. Eng. 2015, 129, 97–109. [Google Scholar] [CrossRef] [Green Version]
- Darcis, M.; Class, H.; Flemisch, B.; Helmig, R. Sequential Model Coupling for Feasibility Studies of CO2 Storage in Deep Saline Aquifers Couplage séquentiel des modèles numériques appliqué aux études de faisabilité du stockage de CO2 en aquifère salin profond. Oil Gas Sci. Technol. 2011, 66, 93–103. [Google Scholar] [CrossRef]
- Tian, W.; Li, A.; Ren, X.; Josephine, Y. The threshold pressure gradient effect in the tight sandstone gas reservoirs with high water saturation. Fuel 2018, 226, 221–229. [Google Scholar] [CrossRef]
- Kubus, P. CCS and CO2-storage possibilities in Hungary. In Proceedings of the SPE International Conference on CO2 Capture, Storage, and Utilization, New Orleans, LA, USA, 10–12 November 2010. [Google Scholar] [CrossRef]
- Birkedal, K.; Hauge, L.; Graue, A.; Ersland, G. Transport Mechanisms for CO2-CH4 Exchange and Safe CO2 Storage in Hydrate-Bearing Sandstone. Energies 2015, 8, 4073–4095. [Google Scholar] [CrossRef]
- Vandeweijer, V.; Meer, B.; Hofstee, C. Monitoring the CO2, injection site: K12-B. Energy Procedia 2011, 4, 5471–5478. [Google Scholar] [CrossRef]
- Zhang, Y.; Wang, Y.; Xue, F.; Wang, Y.; Ren, B.; Zhang, L.; Ren, S. CO2 foam flooding for improved oil recovery: Reservoir simulation models and influencing factors. J. Pet. Sci. Eng. 2015, 133, 838–850. [Google Scholar] [CrossRef]
- Fakhr, M.; Rashidi, A.; Giti, A.; Akbarnejad, M.; Masoud, Z. Parametric Study for the Growth of Single-walled Carbon Nanotubes over Co-Mo/Mgo in Fluidized Bed Reactor by CCVD Method. J. Pet. Sci. Eng. 2010, 4, 28–34. [Google Scholar] [CrossRef]
- Bottero, S.; Hassanizadeh, S.; Kleingeld, P. From Local Measurements to an Upscaled Capillary Pressure–Saturation Curve. Transp. Porous Media 2011, 88, 271–291. [Google Scholar] [CrossRef] [Green Version]
- Zou, C.; Zhu, R.; Wu, S.; Yang, Z.; Tao, S.; Yuan, X.; Hou, L.; Yang, H.; Xu, C.; Li, D.; et al. Type, characteristics, genesis and prospects of conventional and unconventional hydrocarbon accumulation: Taking tight gas in China as an instance. Acta Pet. Sin. 2012, 33, 173–187. [Google Scholar] [CrossRef]
- Zhang, C.; Zhang, C.; Zhang, Z.; Qin, R.; Yu, J. Comparative experimental study of the core irreducible water saturation of tight gas reservoir. Nat. Gas Geosci. 2016, 27, 352–358. [Google Scholar] [CrossRef]
- Hu, H.; Cheng, Y. Modeling by computational fluid dynamics simulation of pipeline corrosion in CO2-containing oil-water two phase flow. J. Pet. Sci. Eng. 2016, 146, 134–141. [Google Scholar] [CrossRef]
Figure 1.
Schematic diagram of the experimental setup (1. Intermediate container (high purity CH4), 2. Intermediate container (simulated water), 3. Intermediate container (high purity CO2), 4. Pump, 5. Sluice with five gates, 6. Vacuum pump, 7. Pressure gage, 8. Electronic pressure gauge, 9. The long-core, 10. Confining pressure pump, 11. Back pressure pump, 12. Conical flask, 13. Electronic pressure gauge, 14. Chromatographic analyzer, 15. Angle regulator of core, 16. Beaker, 17. Thermostat box).

Figure 2.
Experimental results under constant differential pressure displacement. (a) CO2 mole fraction at the outlet versus the injected CO2 pore volume. (b) CH4 recovery by CO2 flooding. (c) Pressure drop over a tight long-core versus the pore volume during CO2 flooding (Note: the colored lines represent the various injected CO2 pore volumes).

Figure 3.
Experimental results under various injection rates. (a) CO2 mole fraction at the outlet versus injected CO2 pore volume. (b) CH4 recovery by CO2 flooding. (c) Pressure drop over tight long-core versus the pore volume during CO2 flooding. (d) The proportion of injected CO2 being stored versus an injected CO2 pore volume.
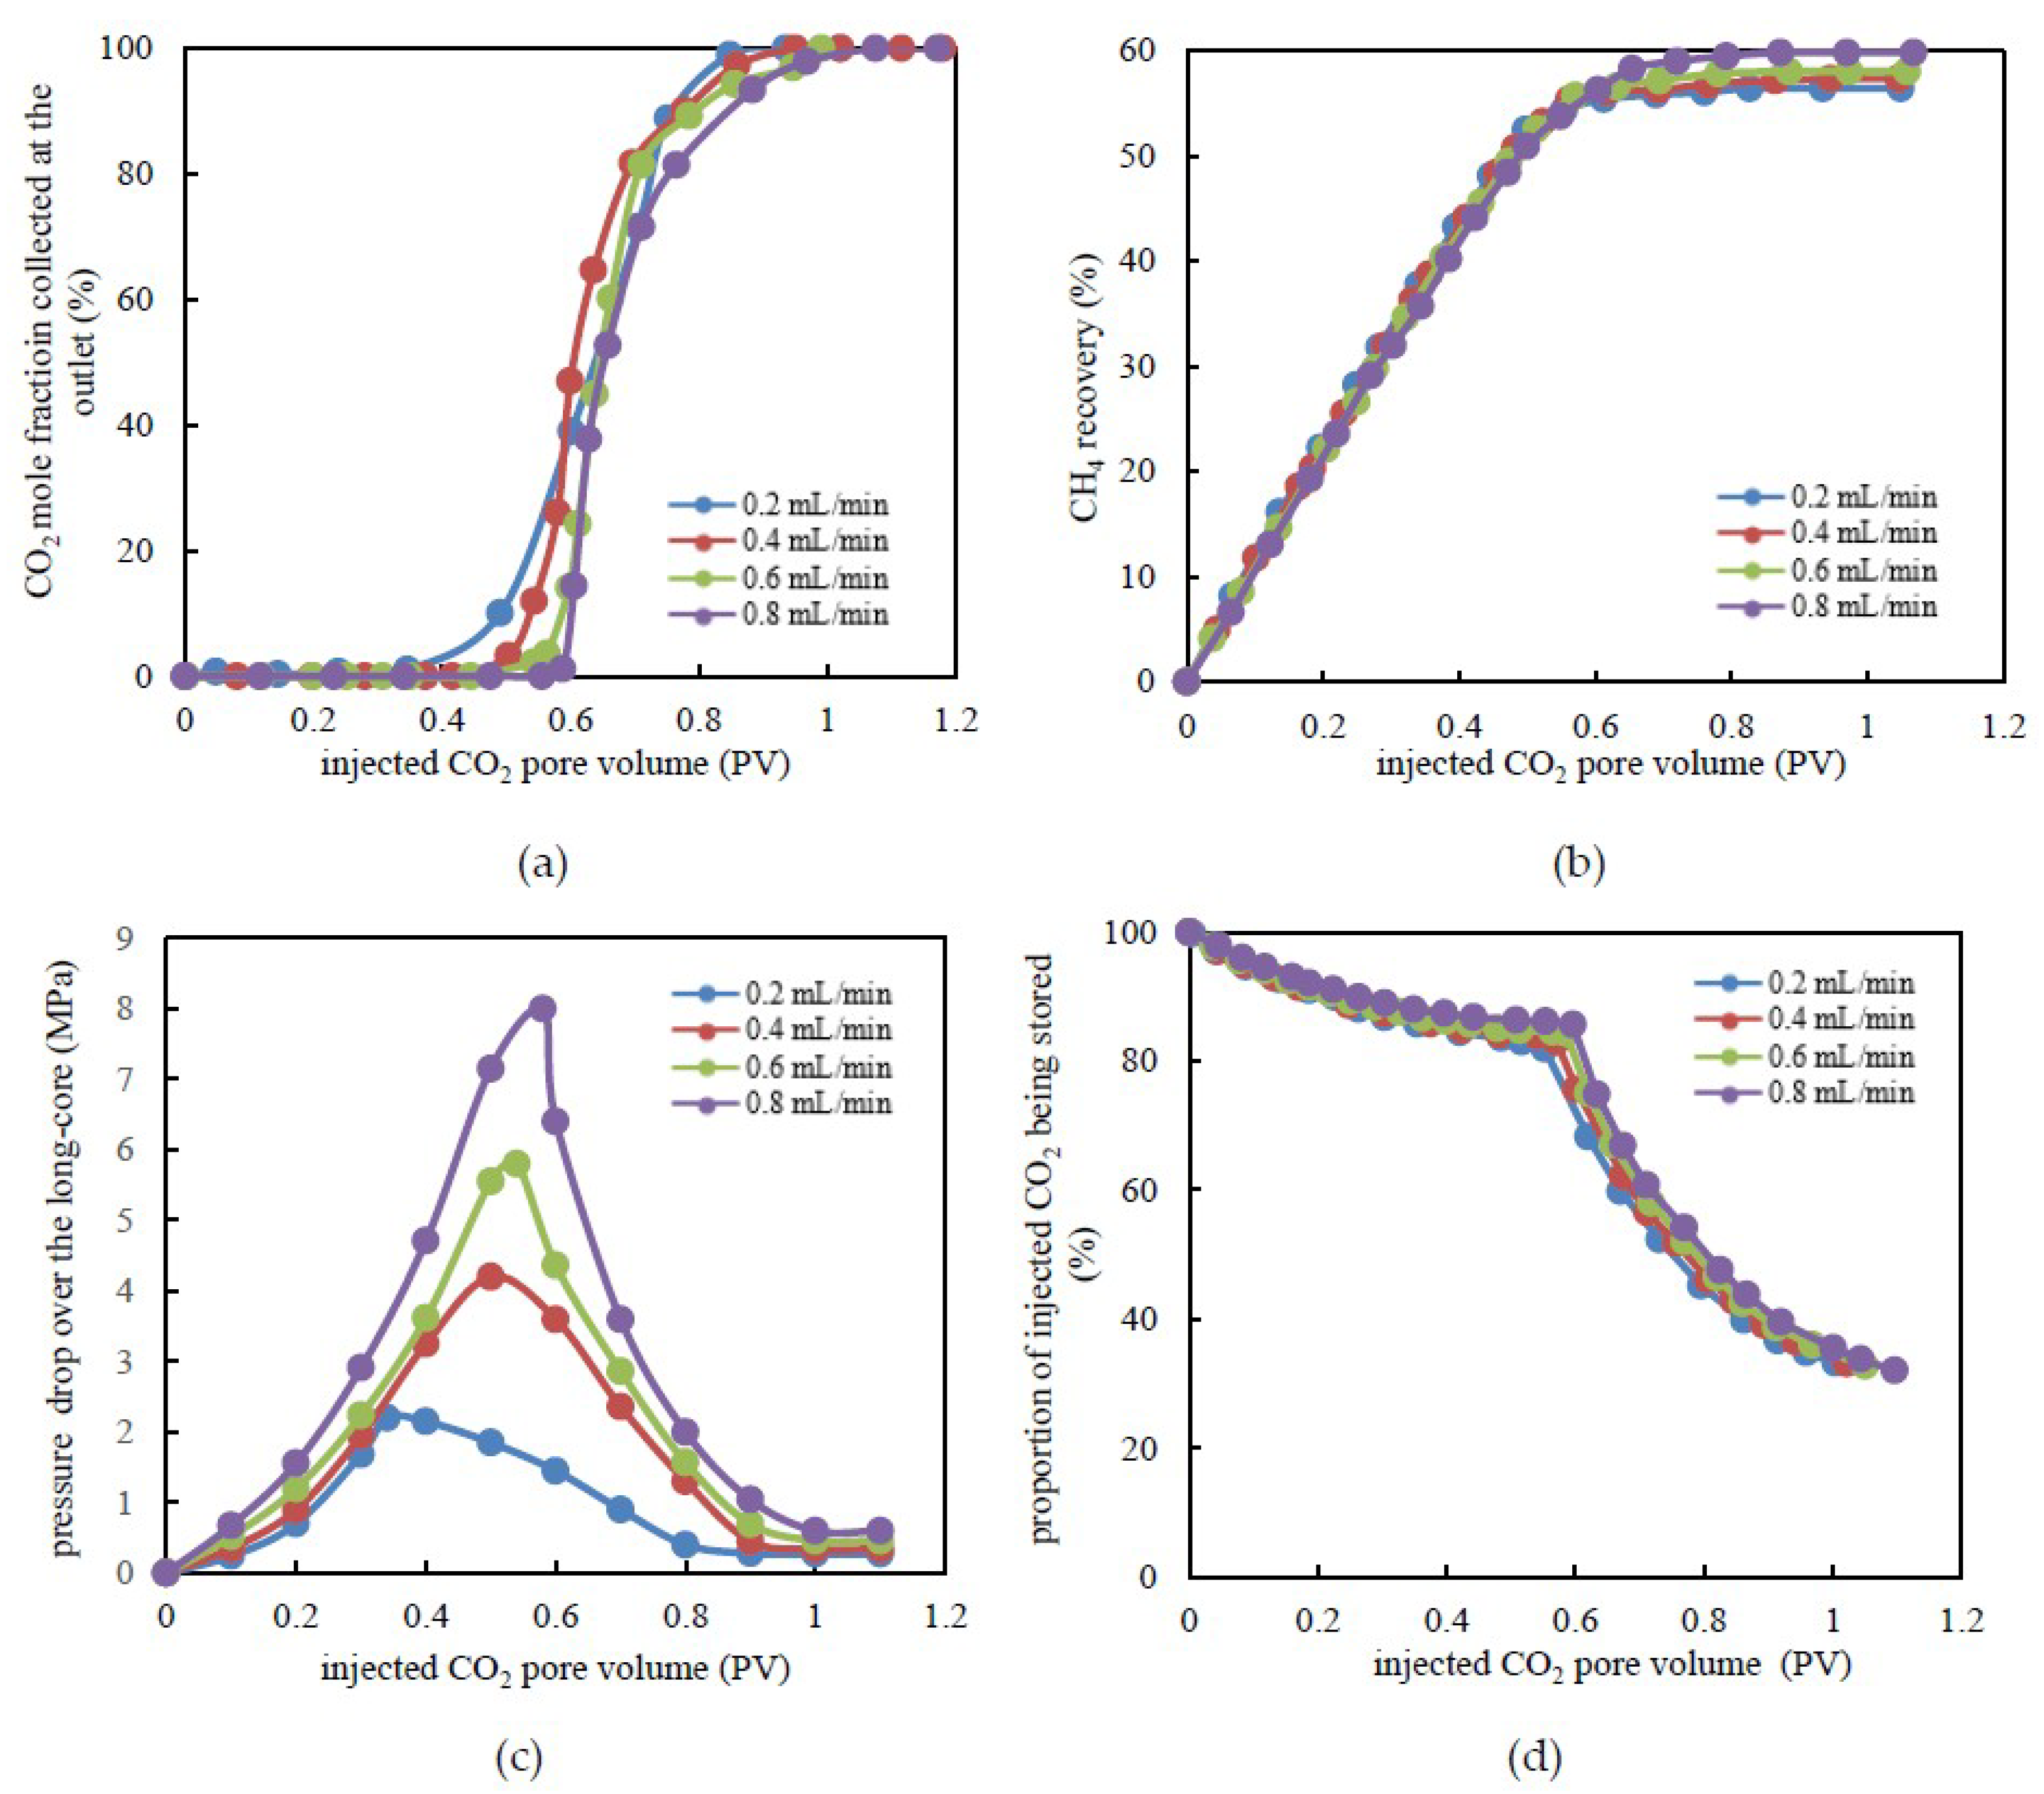
Figure 4.
Curve of capillary pressure versus water saturation.

Figure 5.
Experimental results under tight dry and aqueous cores. (a) CO2 mole fraction at the outlet versus injected CO2 pore volume. (b) CH4 recovery by CO2 flooding. (c) Pressure drop over tight long-core versus the pore volume during CO2 flooding. (d) The proportion of injected CO2 being stored versus an injected CO2 pore volume.

Figure 6.
Experimental results under various formation dip angle conditions. (a) CO2 mole fraction at the outlet versus injected CO2 pore-volume. (b) CH4 recovery by CO2 flooding. (c) Pressure drop over tight long-core versus the pore-volume during CO2 flooding. (d) The storage rate of CO2 versus injected CO2 pore-volume.

Table 1.
Mineral composition of the water sample in experiments.
| K+ | Na+ | Ca2+ | Mg2+ | Sr2+ | Cl− | SO42− | CO32− | HCO3− | OH− | Total Salinity |
|---|---|---|---|---|---|---|---|---|---|---|
| (mg/L) | ||||||||||
| 1541 | 15,221 | 12,344 | 2539 | 650 | 59,774 | 744 | none | 257 | none | 102,000 |
© 2018 by the authors. Licensee MDPI, Basel, Switzerland. This article is an open access article distributed under the terms and conditions of the Creative Commons Attribution (CC BY) license (http://creativecommons.org/licenses/by/4.0/).
Share and Cite
MDPI and ACS Style
Wang, F.; Liu, Y.; Hu, C.; Wang, Y.; Shen, A.; Liang, S. Experimental Study on Feasibility of Enhanced Gas Recovery through CO2 Flooding in Tight Sandstone Gas Reservoirs. Processes 2018, 6, 214. https://doi.org/10.3390/pr6110214
AMA Style
Wang F, Liu Y, Hu C, Wang Y, Shen A, Liang S. Experimental Study on Feasibility of Enhanced Gas Recovery through CO2 Flooding in Tight Sandstone Gas Reservoirs. Processes. 2018; 6(11):214. https://doi.org/10.3390/pr6110214
Chicago/Turabian StyleWang, Fengjiao, Yikun Liu, Chaoyang Hu, Yongping Wang, Anqi Shen, and Shuang Liang. 2018. "Experimental Study on Feasibility of Enhanced Gas Recovery through CO2 Flooding in Tight Sandstone Gas Reservoirs" Processes 6, no. 11: 214. https://doi.org/10.3390/pr6110214
Note that from the first issue of 2016, this journal uses article numbers instead of page numbers. See further details here.