Article

Green Hydrogen Production from Raw Biogas: A Techno-Economic Investigation of Conventional Processes Using Pressure Swing Adsorption Unit

Deparment of Energy, Politecnico di Milano, via Lambruschini 4, 20156 Milano, Italy
*
Author to whom correspondence should be addressed.
Processes 2018, 6(3), 19; https://doi.org/10.3390/pr6030019
Submission received: 23 December 2017 / Revised: 14 February 2018 / Accepted: 15 February 2018 / Published: 25 February 2018

Abstract

:
This paper discusses the techno-economic assessment of hydrogen production from biogas with conventional systems. The work is part of the European project BIONICO, whose purpose is to develop and test a membrane reactor (MR) for hydrogen production from biogas. Within the BIONICO project, steam reforming (SR) and autothermal reforming (ATR), have been identified as well-known technologies for hydrogen production from biogas. Two biogases were examined: one produced by landfill and the other one by anaerobic digester. The purification unit required in the conventional plants has been studied and modeled in detail, using Aspen Adsorption. A pressure swing adsorption system (PSA) with two and four beds and a vacuum PSA (VPSA) made of four beds are compared. VPSA operates at sub-atmospheric pressure, thus increasing the recovery: results of the simulations show that the performances strongly depend on the design choices and on the gas feeding the purification unit. The best purity and recovery values were obtained with the VPSA system, which achieves a recovery between 50% and 60% at a vacuum pressure of 0.1 bar and a hydrogen purity of 99.999%. The SR and ATR plants were designed in Aspen Plus, integrating the studied VPSA model, and analyzing the behavior of the systems at the variation of the pressure and the type of input biogas. The SR system achieves a maximum efficiency, calculated on the LHV, of 52% at 12 bar, while the ATR of 28% at 18 bar. The economic analysis determined a hydrogen production cost of around 5 €/kg of hydrogen for the SR case.

1. Introduction

The current challenges of energy saving and reduction of CO2 emissions must deal with the significant growth of energy demand. Hydrogen is a promising energy carrier that can replace fossil fuels in power generation and transportation, drastically reducing local pollution and CO2 emission when produced by renewable sources. The global hydrogen production is nowadays within the range of 600–720 billion Nm3/year, 80 billion of which is produced in the European Union [1], and it is continuously increasing at a rate of 5–6% per year. Almost 50% of the global hydrogen production is currently generated via steam methane reforming (SR), therefore, using natural gas (NG) as feedstock, while less than 3–4% is produced without using fossil fuels [2]. Hydrogen production is therefore still bounded to non-renewable sources. Moreover, conventional plants lead to large CO2 emissions to the atmosphere (about 380–420 kgCO2/Nm3H2), associated with the combustion of off-gas and of the additional fuel required to provide heat for the endothermic reforming reactions.
Green hydrogen (hydrogen generated by renewable sources) can be produced by biomass via pyrolysis or gasification, but these processes are highly expensive [3], while water electrolysis using photovoltaics or wind energy is even more expensive than the biomass-based production processes [3,4,5]. A recent study commissioned by the FCH-JU on “green hydrogen” [6] has identified eleven possible pathways to produce hydrogen from renewable energy sources, where a less expensive and promising way is using biogas (BG), that mainly consists of methane and carbon dioxide, as a raw material for reforming processes. The conversion process can be similar to the steam reforming one, but has to be applied to a much smaller scale in relation to the typical existing BG plants that can produce around 0.25 Nm3/s of methane, with respect to 25–30 Nm3/s used in large scale reforming plant. In 2014 there were over 17,200 biogas plants in Europe, with an installed capacity of 8.293 MWel [7]. The European Union (EU) produced 15.6 Mtoe of primary energy from BG in 2015, with a growth of at least 5% every year in the last decade [8]. The type of biogas plants can change significantly from country to country: Germany and Italy have mostly anaerobic digesters (AD) biogas plants (>75% of the installed plants) of small medium-size (up to 1 MWel) that mostly treat energy crops and manure, while the United Kingdom produces mainly landfill biogas in larger plants.
Previous works have shown how this process is a technically and economically feasible technology for hydrogen production [9]. Moreover, since the biogas has a composition similar to natural gas, significant changes in the steam reforming system are not needed. Conventional fuel processors include a steam or autothermal reformer, followed by one or two stages of water gas shift (WGS) to enhance hydrogen concentration in the reformate stream, and a pressure swing adsorption unit for hydrogen separation and purification. There are also some studies on other non-conventional processes for hydrogen production from methane, such us solar reforming, thermal plasma reforming, and catalytic decomposition [6,10,11,12].
In general, H2 can be produced by biogas steam reforming (BSR) in a wide temperature range between 600 and 1000 °C (endothermic and reversible reactions), involving catalytic processes that are often combined. Both reforming processes can be performed at low pressure (in most cases under atmospheric pressure) in tubular fixed bed or fluidized reactors [10,13,14,15]. The most important difference between the steam methane reforming and the biogas steam reforming is the presence of carbon dioxide in the feed, which leads the system to high sensitivity to carbon formation in the operation regime, which could deposit on the support, as well as on the active phase of the catalyst. From a thermodynamic point of view, carbon formation can be suppressed feeding steam to the system, and for this reason, an excess of steam is usually employed when dealing with a biogas mixture; excess steam can be then removed downstream in the process through condensation. In most studies found in the literature on BSR for green hydrogen production, however, there are detailed experiments using mixtures of CO2 and CH4 to mimic the biofuel compositions in laboratory, with a limited number of cases using real biogas from the direct digestion process of residual biomass (real biogas) [16,17,18].
Also, the hydrogen separation step is strongly affected by the feed gas: pressure swing adsorption (PSA) and vacuum pressure swing adsorption (VPSA) are the typical purification systems for a syngas or a reformate rich in H2. These units use multiple beds filled with adsorbent material, which undergo a sequence of steps, cyclically repeated. The step sequence is generally made of (a) an adsorption step at high pressure, in which impurities are adsorbed and removed from the feed stream, while hydrogen is collected in the product stream, (b) a depressurization/pressurization step, in which two columns at different pressure communicate, one decreasing pressure while the other one increases up to a common value, (c) a purge step at low pressure, in which impurities are desorbed from the bed by using also part of the hydrogen produced. Design of a PSA or VPSA unit is not a trivial task, due to the large number of parameters in play, including detailed design of subcomponents and auxiliaries. Some works focused on a preliminary design of PSA for steam reforming or coal gasification processes, selecting the type of adsorbent, particle size, bed size, bed configuration, pressure equalizations, and feed composition. Most of the studies found in literature describe and analyze PSA systems designed for the use, with a feed coming mainly from natural gas reforming [19,20,21], which is significantly different from the one coming from biogas: the presence of large amounts of impurities in the feed, such as carbon dioxide and nitrogen, requires a specific design of this component, different from the natural gas steam reforming case.
This work performs a techno-economic assessment of two conventional technologies for raw biogas processing in the context of hydrogen production: steam reforming or autothermal reforming. In both cases, the reforming reactor is followed by two temperature-staged water gas shift reactors, and a PSA for hydrogen separation. The system modeling is performed in Aspen Plus and Aspen Plus Adsorption for the PSA unit. The two systems analyzed are PSA and VPSA, which differ only by the pressure at which the desorption of the impurities is performed, with particular focus on a novel VPSA system entirely designed for this specific case. This is one of the first studies on hydrogen produced from raw biogas without an upstream upgrading system, so it required a complete design of the PSA and VPSA systems on Aspen Adsorption according to different gas compositions.

2. Methodology

2.1. General Assumptions and Definitions

The considered conventional hydrogen production plants are designed for 100 kg/day of hydrogen with a purity of at least 4.0, that is the target of BIONICO project. Final product is delivered at the same pressure (20 bar) for all cases (an additional hydrogen compressor will be considered if the reactor operating pressure is lower). The impact of a higher final hydrogen delivery pressure for refueling stations (350 bar, 700 bar) on the system efficiency has also been analyzed. As discussed above, BG composition can vary significantly, and depends on the biomass raw material. To assess the impact of BG type on system design and performance, two different compositions are considered: the first BG is produced from landfill, has a lower CH4 content and higher inert content, and the second, from anaerobic digester, has a higher CH4 content, resulting in the highest low heating value (LHV). Both biogas have no sulfur content as a sulfur compounds removal unit (e.g., based on activated carbon) upstream the reforming system is assumed to prevent reforming catalyst’s poisoning. This step, that is prior to the inlet to the system, is not shown in the layouts being neutral to the purpose of this model. The two compositions are reported in Table 1.
Fuel processors and their relative balance of plant (BoP) are modelled in Aspen Plus® [22], where mass and energy balances are solved. The methodology adopted is consistent with previous works [23,24,25]. The Peng–Robinson cubic equation of state [26] is used for all thermodynamic properties, except for liquid molar volume evaluation where the Rackett model [27] is used, and for steam properties, where NBS/NRC steam tables [28] are adopted. The design parameters and the main assumptions of the reference cases are summarized in Table 2.
Regarding the fuel processor chain, considering relatively high catalyst load, all the mechanisms in the reactors (SR or ATR, high temperature WGS, low temperature WGS) were assumed to achieve chemical equilibrium determined through Gibbs free energy minimization. The reactions of reforming (R.1), water gas shift (R.2), dry reforming (R.3), and methane oxidation (R.4) are reported below:
CH4 + H2O ⇔ CO + 3H2 Δ H 298   K 0 =   206   kJ / mol (R.1)
CO + H2O ⇔ CO2 + H2 Δ H 298   K 0 =   - 41   kJ / mol (R.2)
CH4 + CO2 ⇔ 2CO + 2H2 Δ H 298   K 0 =   247 . 3   kJ / mol (R.3)
CH4 + 2O2 ⇒ CO2 + 2H2O Δ H 298   K 0 =   - 802   kJ / mol (R.4)
The steam to carbon ratio S/C is defined at the inlet of the reactor as
S / C = n ˙ H 2 O n ˙ C H 4
In the ATR system, the presence of oxygen and the faster kinetics of combustion reaction (R.4) with respect to reforming reactions (R.1, R.2, R.3) leads to the oxidation of some methane at the inlet of the reactor: for this reason, the S/C ratio for the ATR case is lower. The amount of air at the inlet of the ATR is below stoichiometry, and controlled in order to balance the heat required by the endothermic reforming reaction and to maintain the reactor operating temperature.
λ A T R = n ˙ A I R n ˙ O 2 , S T / x O 2 , A I R
Regarding the PSA system, a four-column vacuum pressure swing adsorption is modelled in Aspen Adsorption, where all the thermodynamic properties are consistent with the overall system model. The model is described in detail in Section 3.2, where the influence of feed pressure on the product recovery and hydrogen purity is defined for different syngas inlet flows and compositions.
The auxiliary values adopted for the balance of plant result from benchmark technologies, typical O&M specifications, requirements for the materials. The excess of air sent to the burner is set in order to achieve an oxygen volume dry fraction in the exhaust gases equal to 3%. The geometry adopted for the heat transfer corresponds to counter-current configuration, with hot gas flow external to staggered tube bundle and cold streams in tube. Such configuration provides a compact design, while keeping high heat transfer coefficient.
The two different systems are compared in terms of overall efficiency, defined as the ratio of H2 energy output to biogas and auxiliary energy inputs:
η s y s = m ˙ H 2 L H V H 2 ( m ˙ B G , f + m ˙ B G , a u x ) L H V B G + W a u x η e l , r e f
where
  • L H V H 2 is equal to 120 MJ/kg;
  • W a u x is the sum of the electric consumptions of the system auxiliaries (i.e., compressors, pumps, control system);
  • η e l , r e f   is set equal to 45%, as the average electric efficiency of the power generating park.

2.2. System Layouts

The layout for the conventional system based on high temperature steam methane reforming is shown in Figure 1. The scheme shows the hydrogen production and purification processes as follows: in the first step, a mixture of compressed BG and steam is fed to the SR reactor. The reforming reaction is endothermic, thus favored by high temperatures.
After a first cooling step (HX-4), the syngas exiting the reforming reactor is sent to water gas shift reactors to promote the CO conversion in CO2, increasing hydrogen production through the moderately exothermic reaction. Two WGSs at different temperature (350 °C and 200 °C) are considered to maximize the CO conversion in H2. The resulting stream consists of a H2-rich syngas diluted with inert gases, such as CO2, steam, and N2. After the water removal, a pure H2 flow is recovered by a pressure swing adsorption system.
In the first reference case with a steam reforming reactor, the heat required by the endothermic reaction at the SR is supplied by the combustion of the off-gas from the PSA, and an additional amount of biogas (BGbrn). The heat exchange within the SR reactor is implemented as counter-current, with a minimum pinch-point of about 100 °C. The feed water is pumped by P-1 and is evaporated through HX-1, HX-2 by the reformate gas, and through HX-3 by the flue gas, and finally, superheated in HX-4 by the reformate gas at the outlet of the SR. The process water, recovered from the condensation in the separators downstream of the reformate and flue gas cooling, is recycled back into the system. Table 3 summarizes the thermodynamic properties of the main streams involved.
Figure 2 shows the layout of the second conventional case with autothermal reforming reactor (ATR). The main difference with the previous case relies on the reforming reactor for biogas-to-hydrogen conversion. The stream at the inlet of the reactor is a mixture of compressed BG, steam, and air. In this case, the heat required by the endothermic reforming reaction is balanced by the partial oxidation of the feed fuel with air (R.4). The intake of air is below stoichiometry, and regulated to control the temperature in the reactor. The compressed air is mixed with the steam before entering the reactor. Thanks to the partial oxidation, there is no need to supply an additional amount of biogas to the burner: in the ATR configuration, the burner is fed only with the off-gas from the PSA. Table 4 summarizes the thermodynamic properties of the main streams involved.

3. Vacuum Pressure Swing Adsorption

The purpose of the work is the design of a separation unit for the production of 100 kg/day of hydrogen with a purity equal to 99.999% from a raw biogas reformer. A literature review shows that the common feed composition of the gas entering the PSA systems mainly comes from reforming of natural gas, which is different from the one here analyzed, due to higher presence of impurities. As discussed below, the inlet syngas composition strongly affects the final value of hydrogen purity, so it was necessary to design a new model of PSA/VPSA.

3.1. PSA Model Literature

This section reports modelling and experimental works on PSA, studying the effect of various parameters, such as bed size, bed configurations, pressure equalizations, feed composition, etc. Four-bed PSA, four-bed VPSA, and four-bed TSA are modelled by [20], considering feed gas produced by the steam reforming of natural gas containing 75% of hydrogen. The purity required is in the range 99.9–99.99%. A comparison is made among the three different purification systems, trying to identify which is the best in terms of purity, recovery, and productivity. The VPSA system was selected as the most economical process to meet the fuel cell purity (99.99%), while the PSA would meet the requirements with a recovery as low as 10–15%, making this system uneconomical. Another work [19] modelled a two- and four-bed PSA, considering as feed gas a syngas produced from coal gasification with low hydrogen concentration (38% H2, 50% CO2, 1% CH4, 1% CO, 10% N2). The work analyzes the different performances of two and four beds, varying each time a single parameter (carbon to zeolites ratio, pressure, temperature, adsorption time). Results showed that the four-bed PSA process was able to produce H2 with a purity of 96–99.5% and a recovery of 71–85%, together with N2 as the major impurity. The separation of hydrogen from a five component mixture (73.3% H2, 16.6% CO2, 3.5% CH4, 2.9% CO, 3.7% N2) by pressure swing adsorption was analyzed [29]. A complete mathematical model that describes the dynamic behavior of a PSA unit is presented. This model is applied in the study of the behavior of both single column and four-column PSA processes with layered activated carbon/zeolite beds, and with an eight step cycle. The influence of feed flowrate, purge to feed ratio, and lengths of both adsorbent layers on the system performance is assessed. It is shown that the introduction of the zeolite layer improves both the purity and recovery of the process. A reduced model and a complete model were also compared. It was shown that the reduced model in which only micro-pore resistance was taken into account, and in which it was assumed thermal equilibrium between gas and solid phase, predicted with high accuracy the performances of the PSA. Moreover, [21] studied a four-bed configuration with activated carbon and zeolites. The feed composition is a syngas with no N2 (H2 72.2%, CH4 4.17%, CO 2.03%, CO2 21.6%). The effect of linear velocity, adsorption time, purge quantity was investigated. The results showed an ultrapure hydrogen (99.999%) with a recovery of 66%. In [30], a multicomponent breakthrough experiment to validate the mathematical model with a mixture of five components (H2–CO2–CO–CH4–N2) was performed. A ten-step VPSA experiment was performed with a feed composition of 79% H2, 17% CO2, 2.1% CH4, 1.2% CO, and 0.7% N2. It was demonstrated that the VPSA could reach high purity hydrogen (>99.99%), with recoveries as high as 75% at 5 bar, and a productivity of 160 molH2/kgads/day. The effect of pressure equalization was also investigated, which increases the recovery by 15% from one pressure equalization to three pressure equalizations. It was also demonstrated that higher feed pressure increases the productivity of the system, maintaining the same purity.

3.2. PSA and VPSA Model

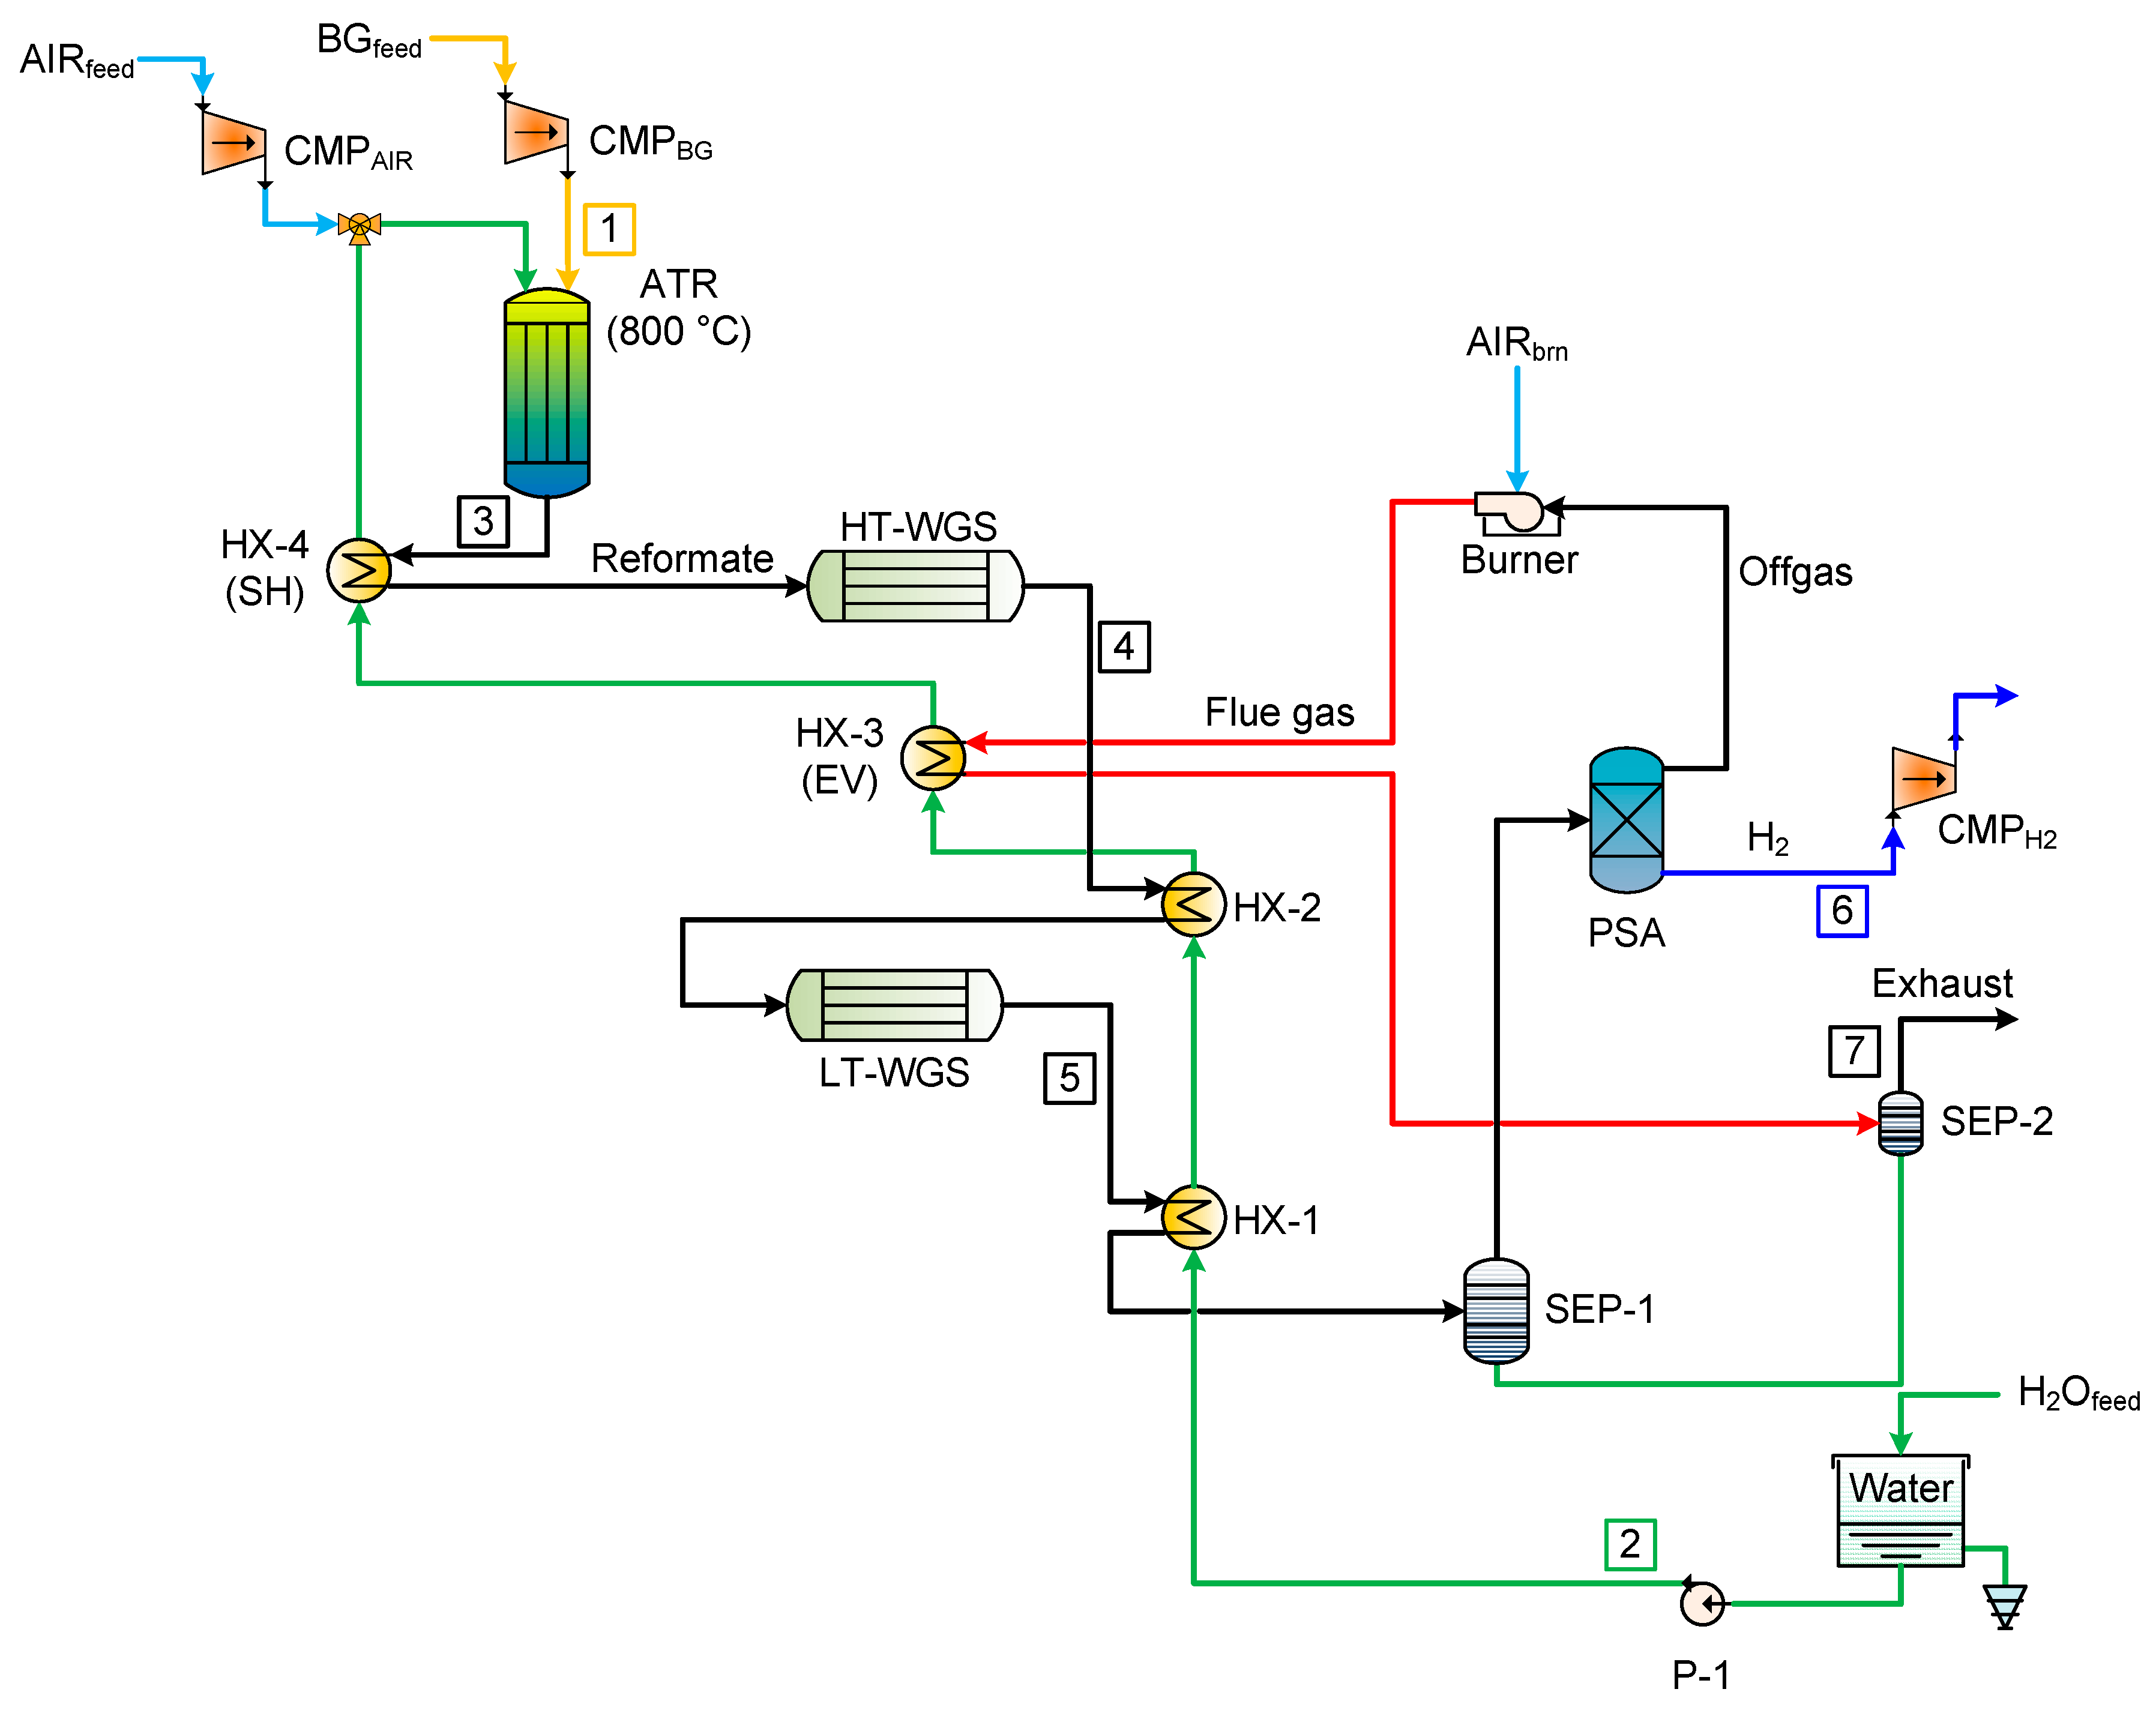
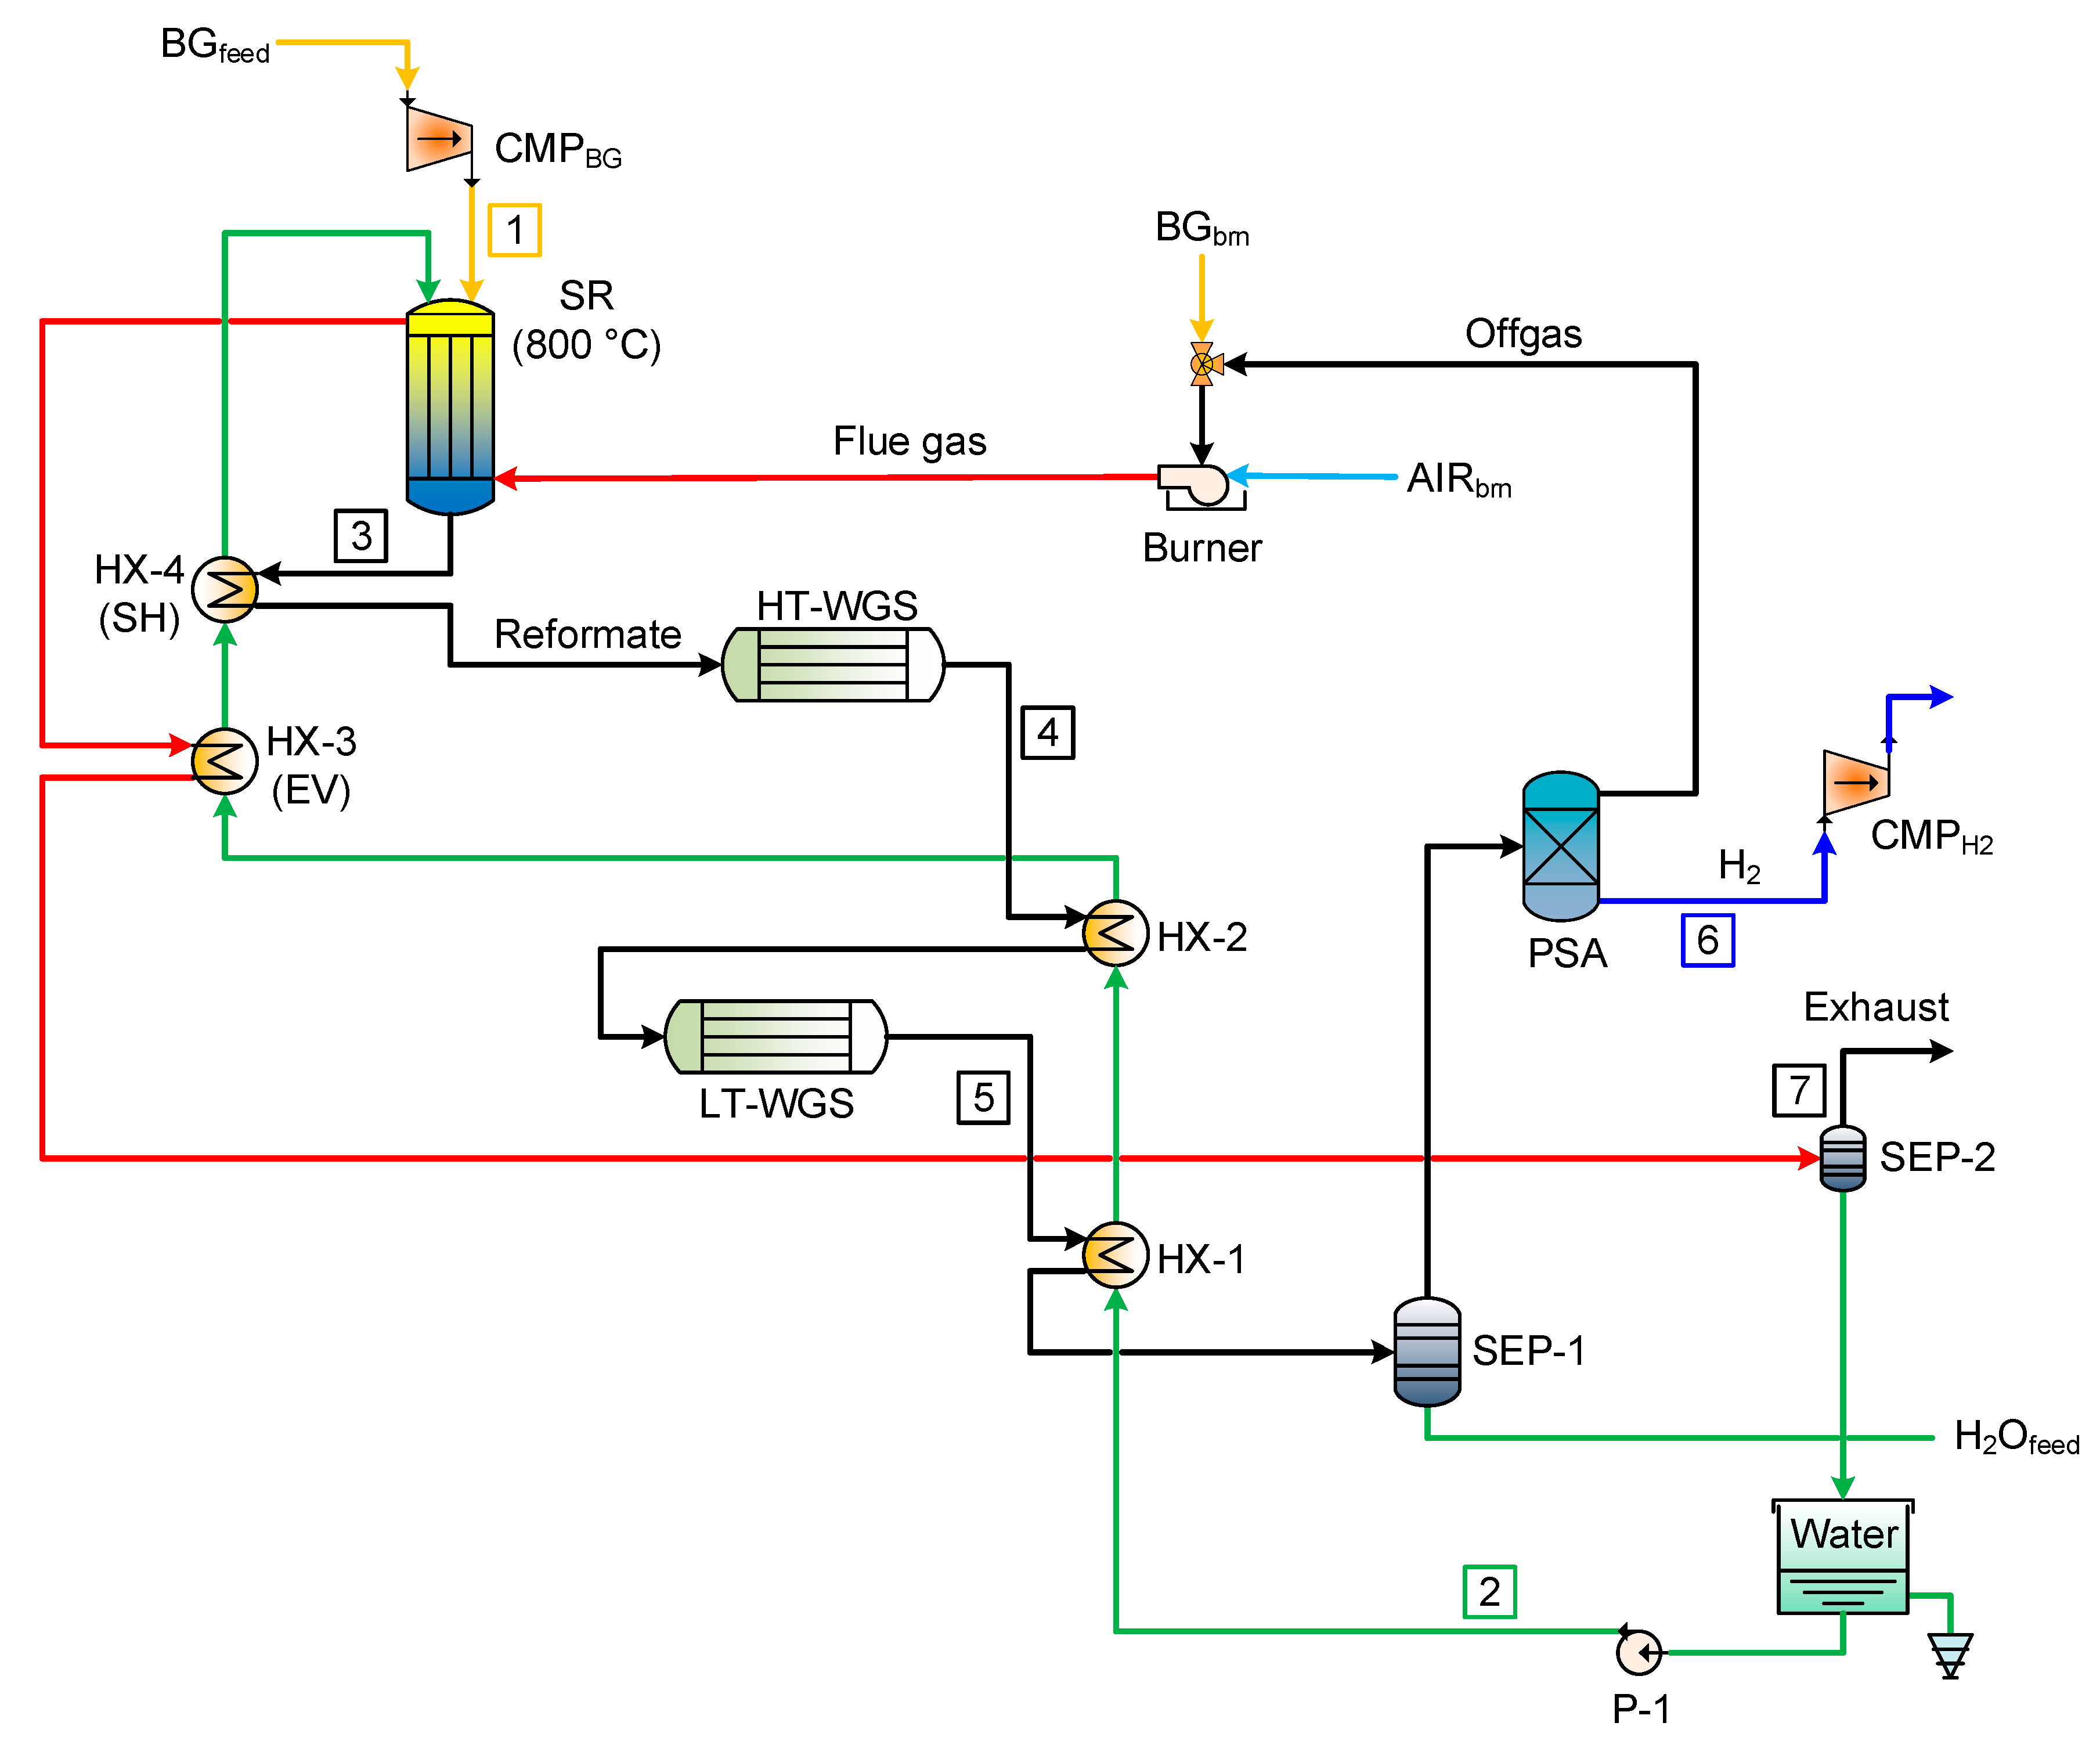
The software Aspen Adsorption has been used to model and simulate the performance of the systems. The flowsheet reported in Figure 3 shows the components used in the simulation. The various references have been used to make a preliminary design of the PSA/VPSA, and to have sensitivity on the values and on the order of magnitude of the different parameters. The aim of this section was, hence, to design a system able to process 100 kg/day, delivering ultrapure hydrogen (99.999%). The simplest model of PSA (two-bed system) was firstly designed, and then, having a better understanding of the process and software used, it was possible to design four-bed PSA and then, finally, four-bed VPSA. In a H2 PSA unit, a complex configuration involving a higher number of beds is fundamental to increase the recovery at the same purity. The multiple-bed solution is modelled with the “unibed” approach [31] in Aspen Adsorption by means of the “interaction column”, which simulates any number of columns by storing the inlet stream properties (such as flowrate, composition, pressure,) and playing them back later according to the step sequence.
The sequence of steps is designed so that the whole PSA system provides constant feed, product, and off-gas flows, even though the system is made of multiple beds and not a continuous unit operation. The number of columns used for the simulation has been chosen according to references in which PSA systems have been designed to work in conditions similar in flowrate and composition to the one modelled in this work [19,20,21]. Moreover, commercially available system for hydrogen production with the same size considers a four-column VPSA system [32]. The process is generally referred to as Polybed [33], and it can be applied to a large variety of PSA systems with any number of columns. The main features of the Polybed sequence are (i) stopping the adsorption step when a substantial part of the bed capacity remains unused near the product end for increasing the purity, and (ii) use of co-current depressurizations to greatly increase the recovery and performance of the system. The step sequence is taken from [20].
The adsorbent layer materials are activated carbon and zeolite 5a, that have been proven, in literature, to have the best performance at investigated pressures and composition [19]. The activated carbon mainly adsorbs CO2, CH4, and CO, and are placed at bottom of the column (feed inlet), while the zeolite layer adsorbs N2 and CO, and it is placed at the top of the activated carbon. The relative length of the two layers is expressed by the “carbon-to-zeolite ratio”, and it is a key parameter inside the PSA system.
The geometry of the reactor, reported in Table 5, has been set according to references showing configurations similar in size to the one designed in this work and to information about existing systems. The diameter of the column was set to 0.38 m, which made the gas velocity inside the reactor around 3 cm/s. The height of the PSA columns was set to 2 and 2.8 m for the two beds, while the four-bed configuration has a height of 2.8 meters, with a carbon-to-zeolite ratio equal to 50:50.
The parameters considered for the evaluation of the PSA/VPSA performances are
P U R I T Y = 0 t a d s x H 2   o u t n ˙ H 2   o u t d t i = 0 n s p e c i e s 0 t a d s x i , o u t   n ˙ i , o u t d t × 100
R E C O V E R Y = 0 t c y c l e x H 2   o u t n ˙ H 2   o u t d t 0 t c y c l e x H 2   i n n ˙ H 2   i n d t × 100
Pressure swing adsorption system is very complex, due to its cyclic nature, with multiple steps and interactions between beds undergoing different operations. For the maximization of the recovery with the purity constraint (99.999%), the following parameters have been manipulated during the simulations:
  • 3 pressures (Feed, Product, Purge)
  • purge-to-feed ratio (P/F)
  • 6 time steps
  • 4 valve coefficients
  • gas velocity in the column
  • activated carbon-to-zeolites ratio
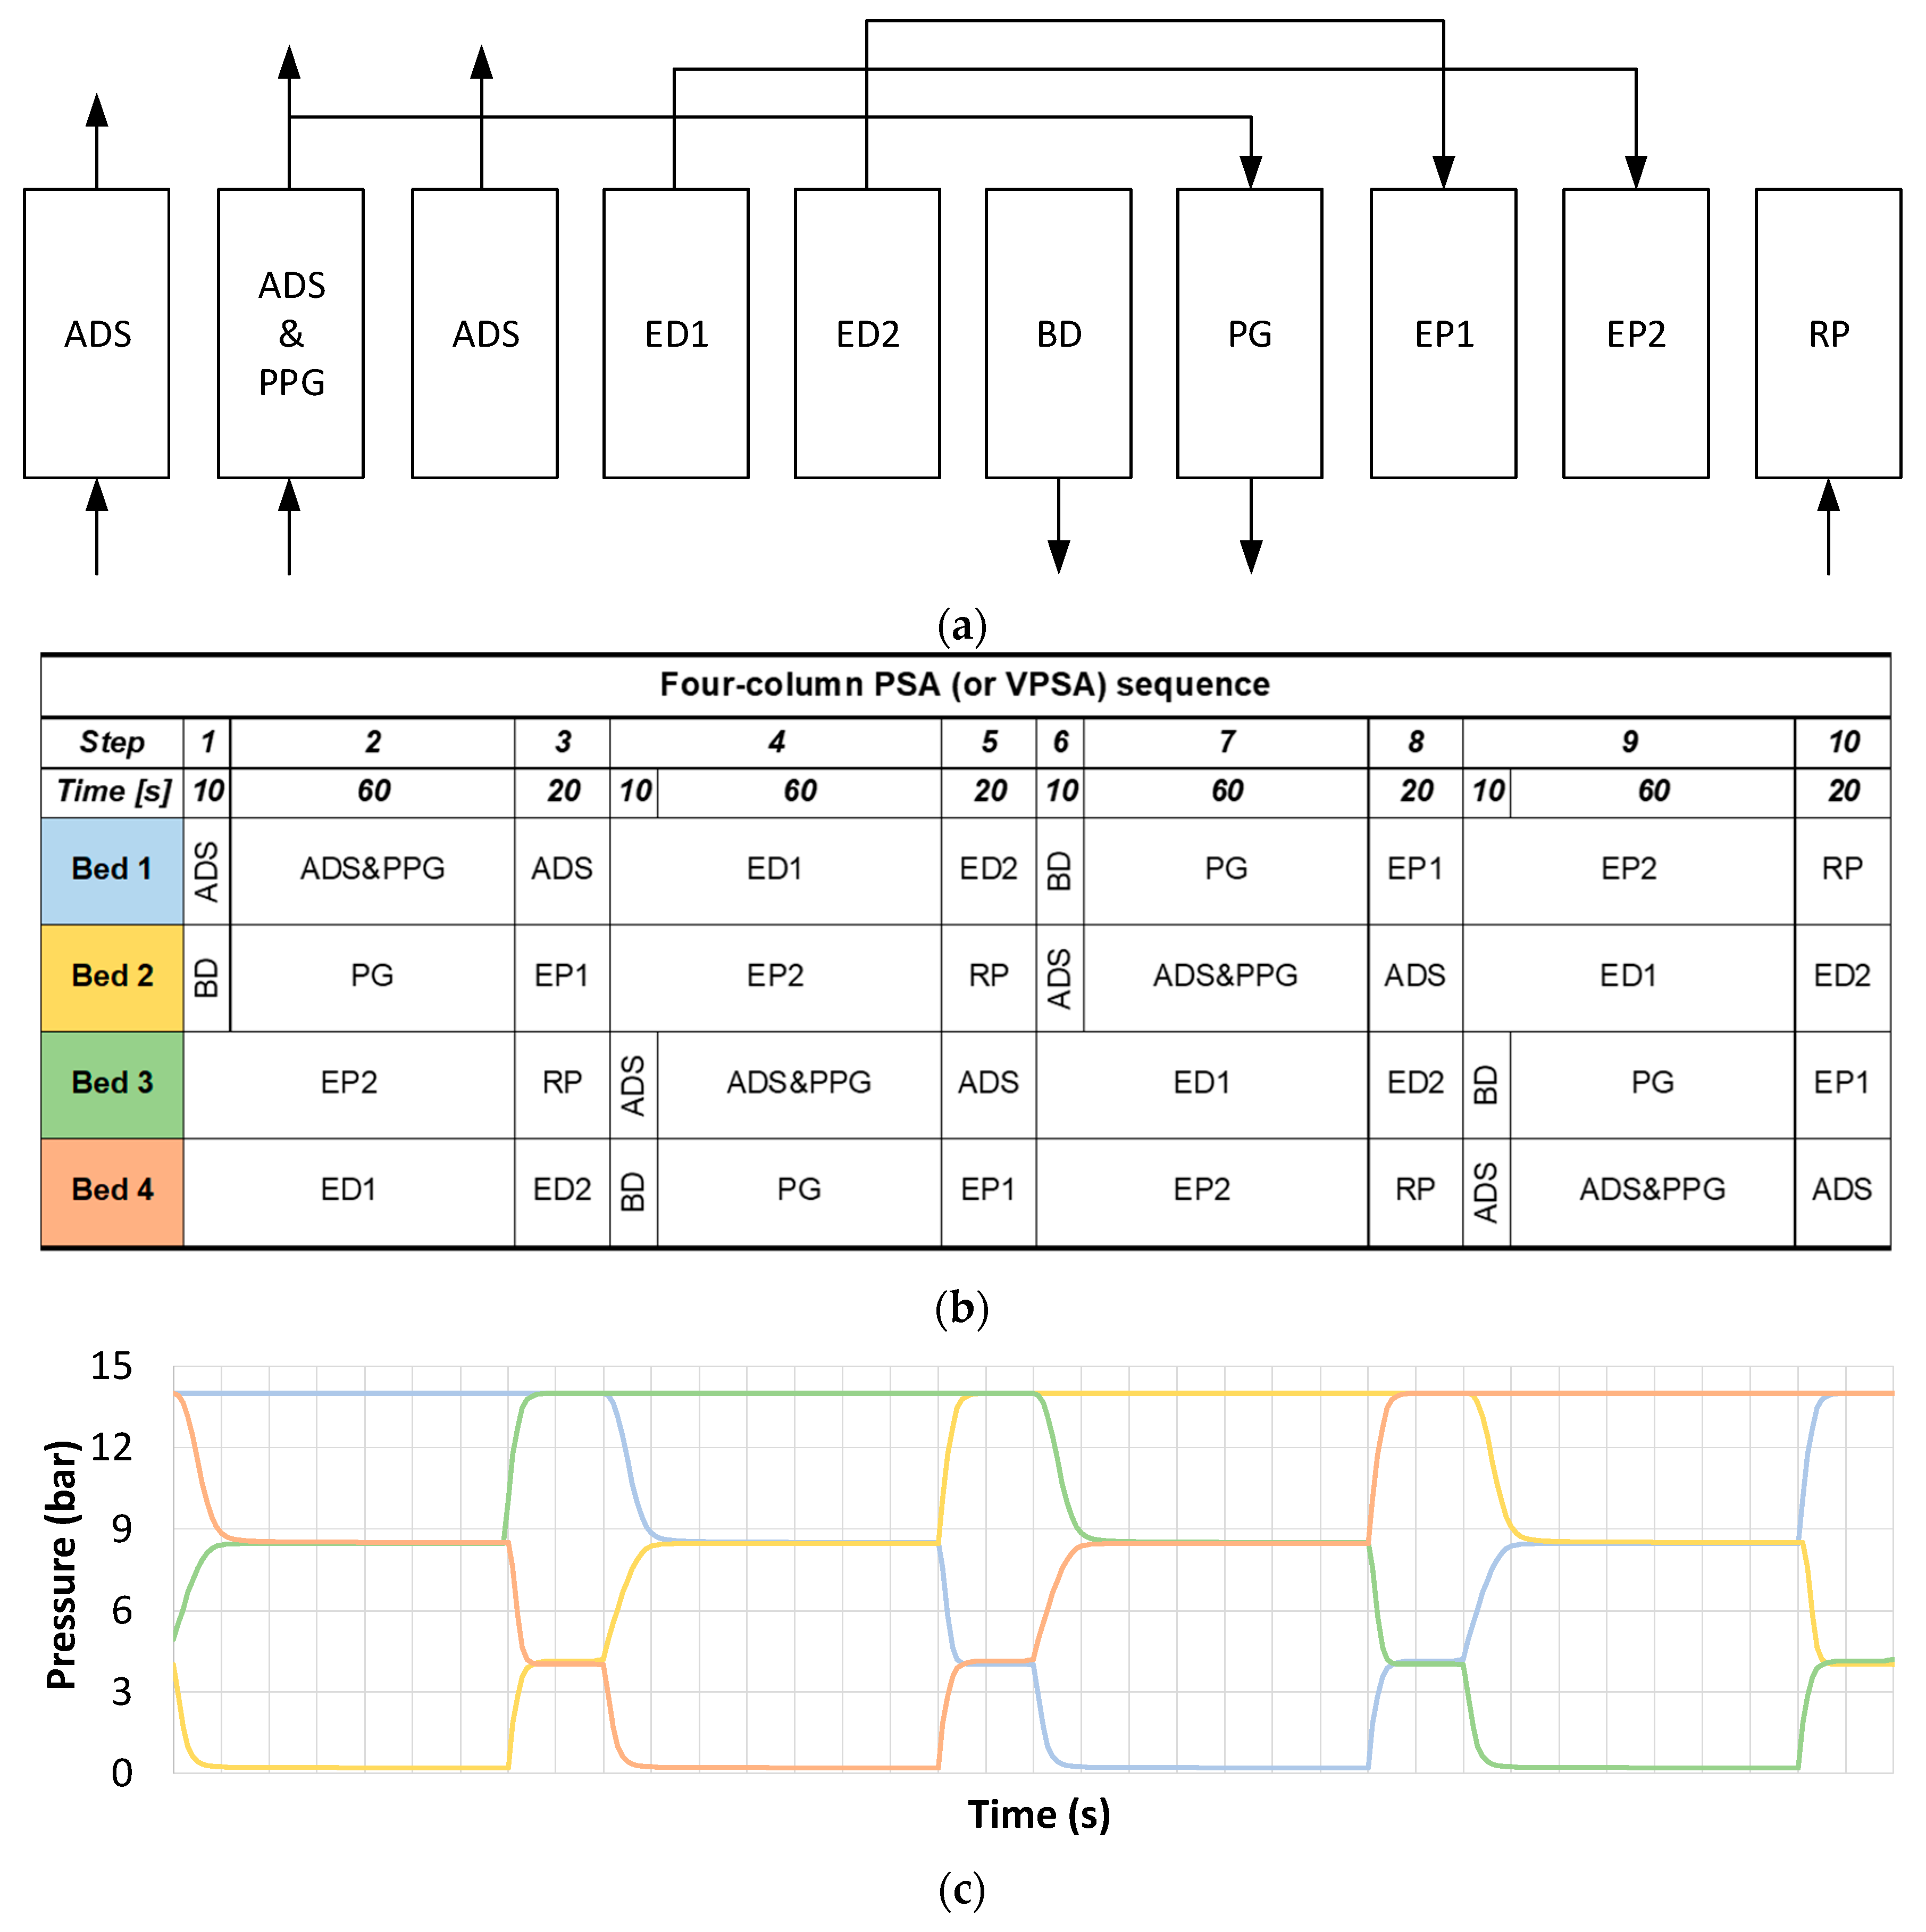
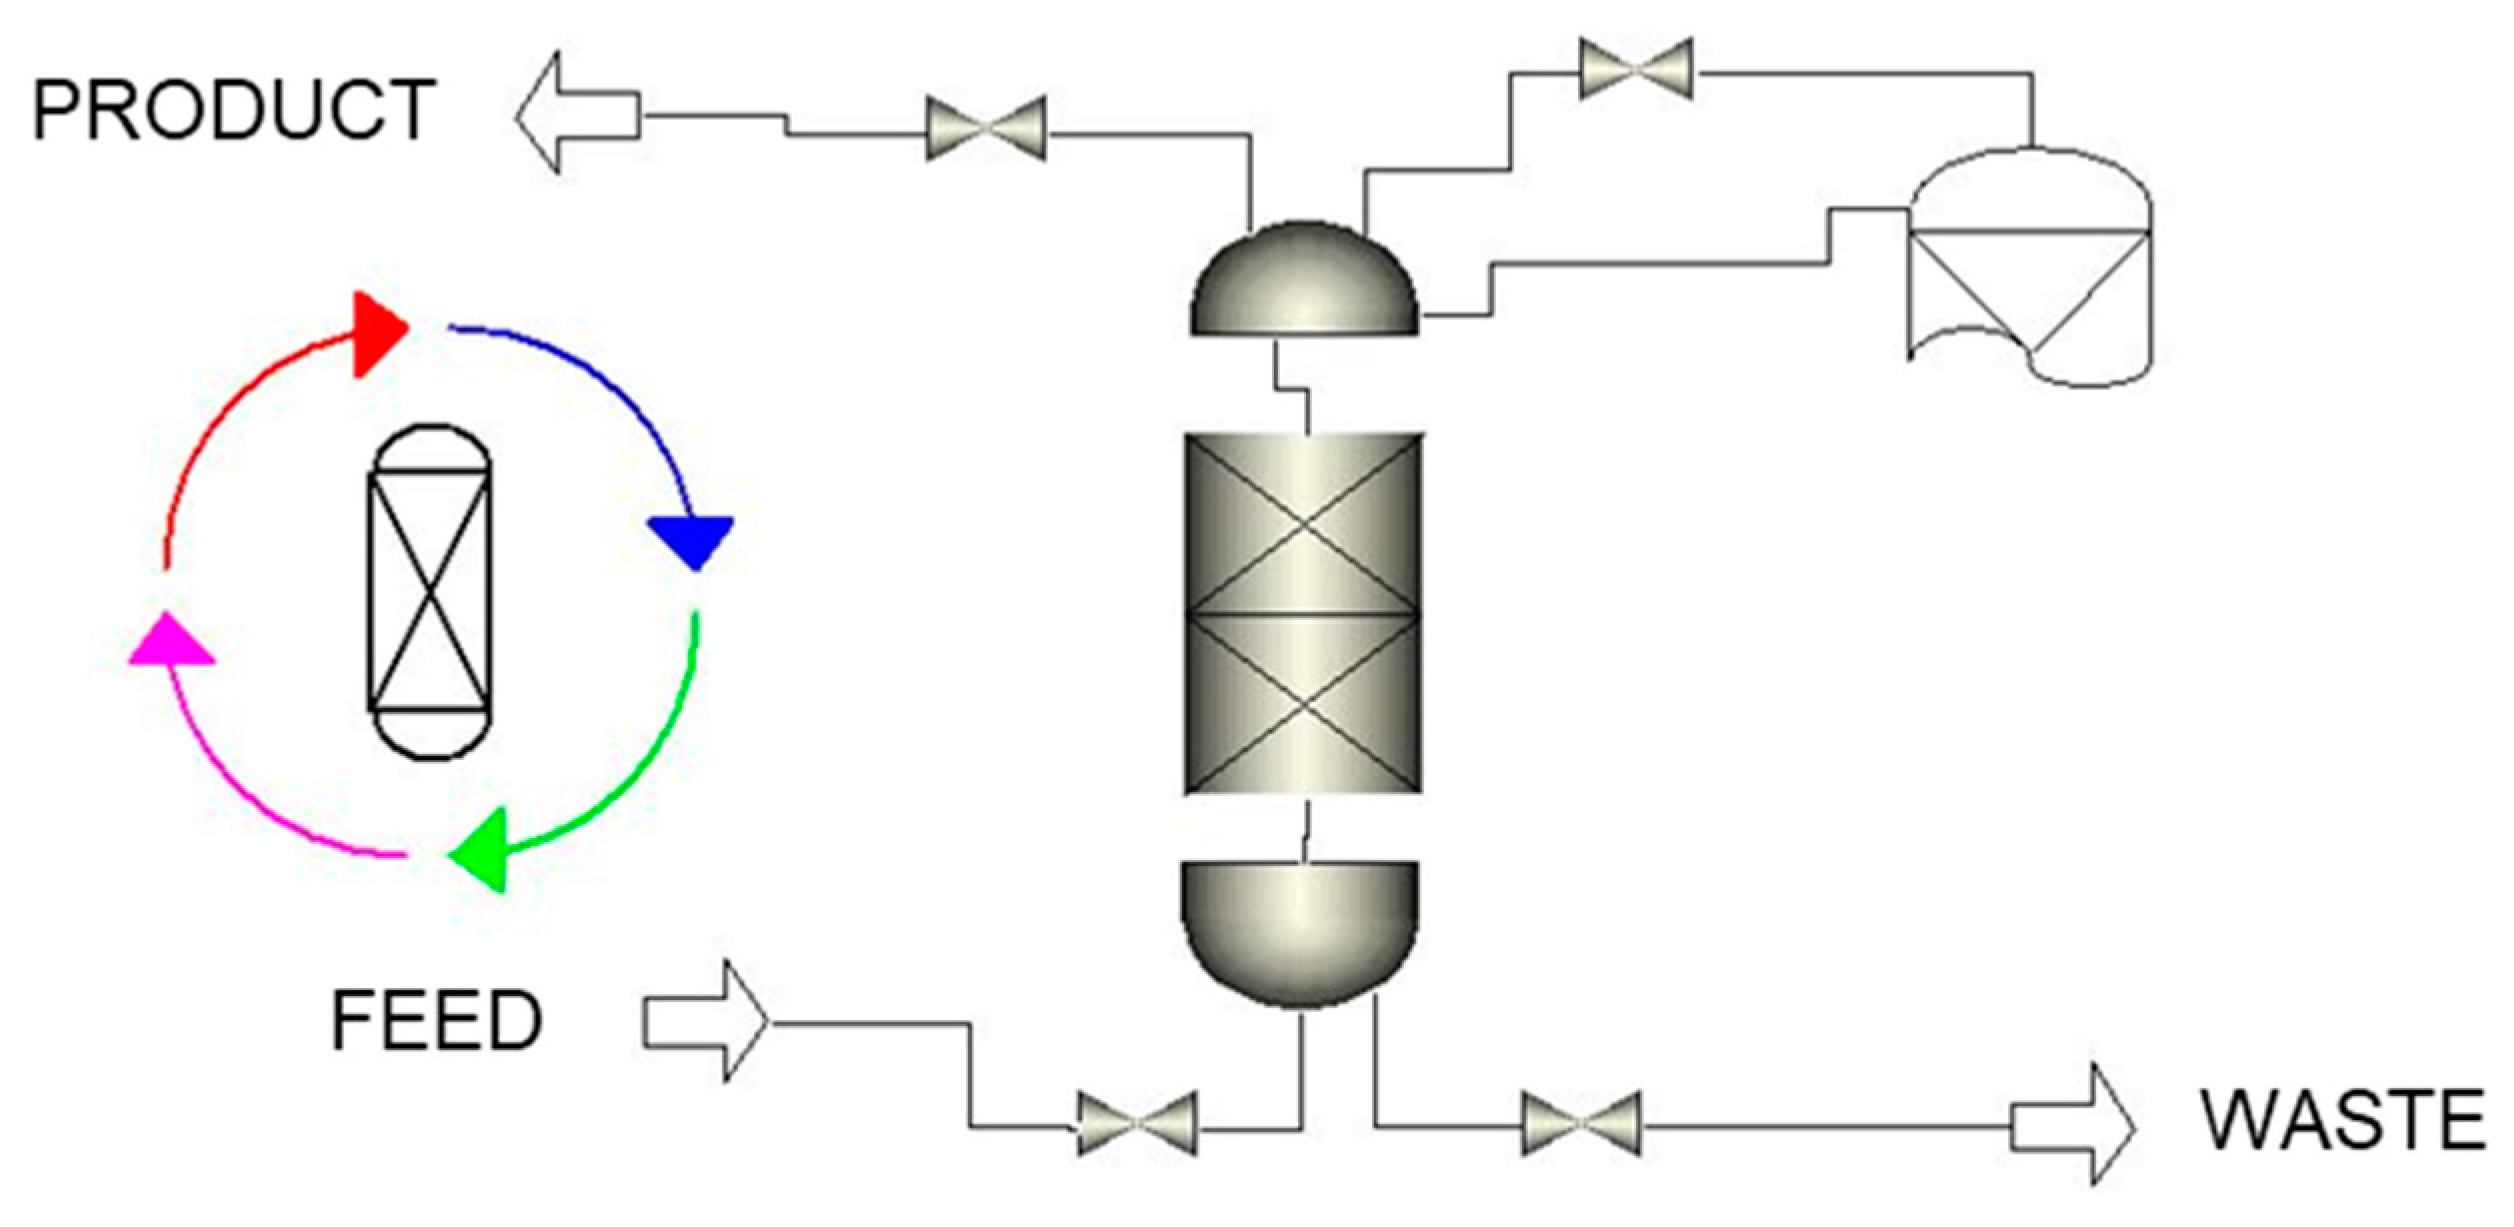
A typical cyclic sequence for the four-bed PSA or VPSA, reported in Figure 4, consists of 10 steps:
(1)
Adsorption (ADS): adsorption takes place in one column. Part of the H2-rich product stream is used to purge the other columns.
(2)
Adsorption and providing purge (ADS&PPG): part of the produced hydrogen is used to regenerate the bed undergoing the purge step.
(3)
Adsorption (ADS): adsorption takes place in one column at low pressure. Part of the H2-rich product stream is used to purge the other columns.
(4)
First depressurization (ED1): the column is co-currently depressurized to medium pressure level. The produced hydrogen is used to pressurize another column undergoing step (EP2).
(5)
Second depressurization (ED2): pressure is further reduced by using the produced hydrogen to re-pressurize the column undergoing step (EP1).
(6)
Blow down (BD): the column is counter-currently depressurized to the minimum pressure (atmospheric for PSA or sub-atmospheric for VPSA). The effluent gas is wasted.
(7)
Purge (PG): the column is purged with H2 produced in step 2).
(8)
First pressurization (EP1).
(9)
Second pressurization (EP2).
(10)
Feed pressurization (RP): the bed is co-currently pressurized with feed entering from the bottom of the column.
For each simulation, the time step has been optimized to meet the hydrogen purity requirement. The two-bed PSA sequence follows the same general concept, with the main difference of having only one pressure equalization (hence lower number of steps) and different steps timing.
The ideal Langmuir isotherm model can be extended to multicomponent systems by incorporating the effect of the other species on the adsorption process and on the adsorbent material. An extended Langmuir model is adopted, and the loading (defined as the number of moles of the i-th component adsorbed over the mass of adsorbent), is expressed as follows:
q i = q m i B i p i 1 + j = 1 n B j p j
where pi is the partial pressure of the i-th component.
The adsorption equilibrium parameters, for activated carbon and zeolites 5a as a function of operating pressure at 35 °C, were taken from [19].
The pressure swing adsorption system have to be designed and optimized with different compositions of feed gases, which are a function of biogas feed and plant layout (SR or ATR). Stream results are reported in Table 6. The composition differs between the steam reforming and the autothermal reforming, due to the oxidation of part of the methane with air in the autothermal reforming reactor. The difference in composition for the ATR case between landfill and anaerobic digestion biogas is almost negligible: for the same system pressure, hydrogen molar fraction for the former is around 2% lower than the second one, while CO2 and N2 differ by around 1%. On the other hand, differences in composition in the SR case are more evident. For the AD biogas, hydrogen molar fraction is 6% higher, carbon dioxide is present in slightly lower amount, while nitrogen is almost negligible: recovery is expected to be higher, thanks to lower impurities in the gas, especially nitrogen, which is the main cause of purity reduction.
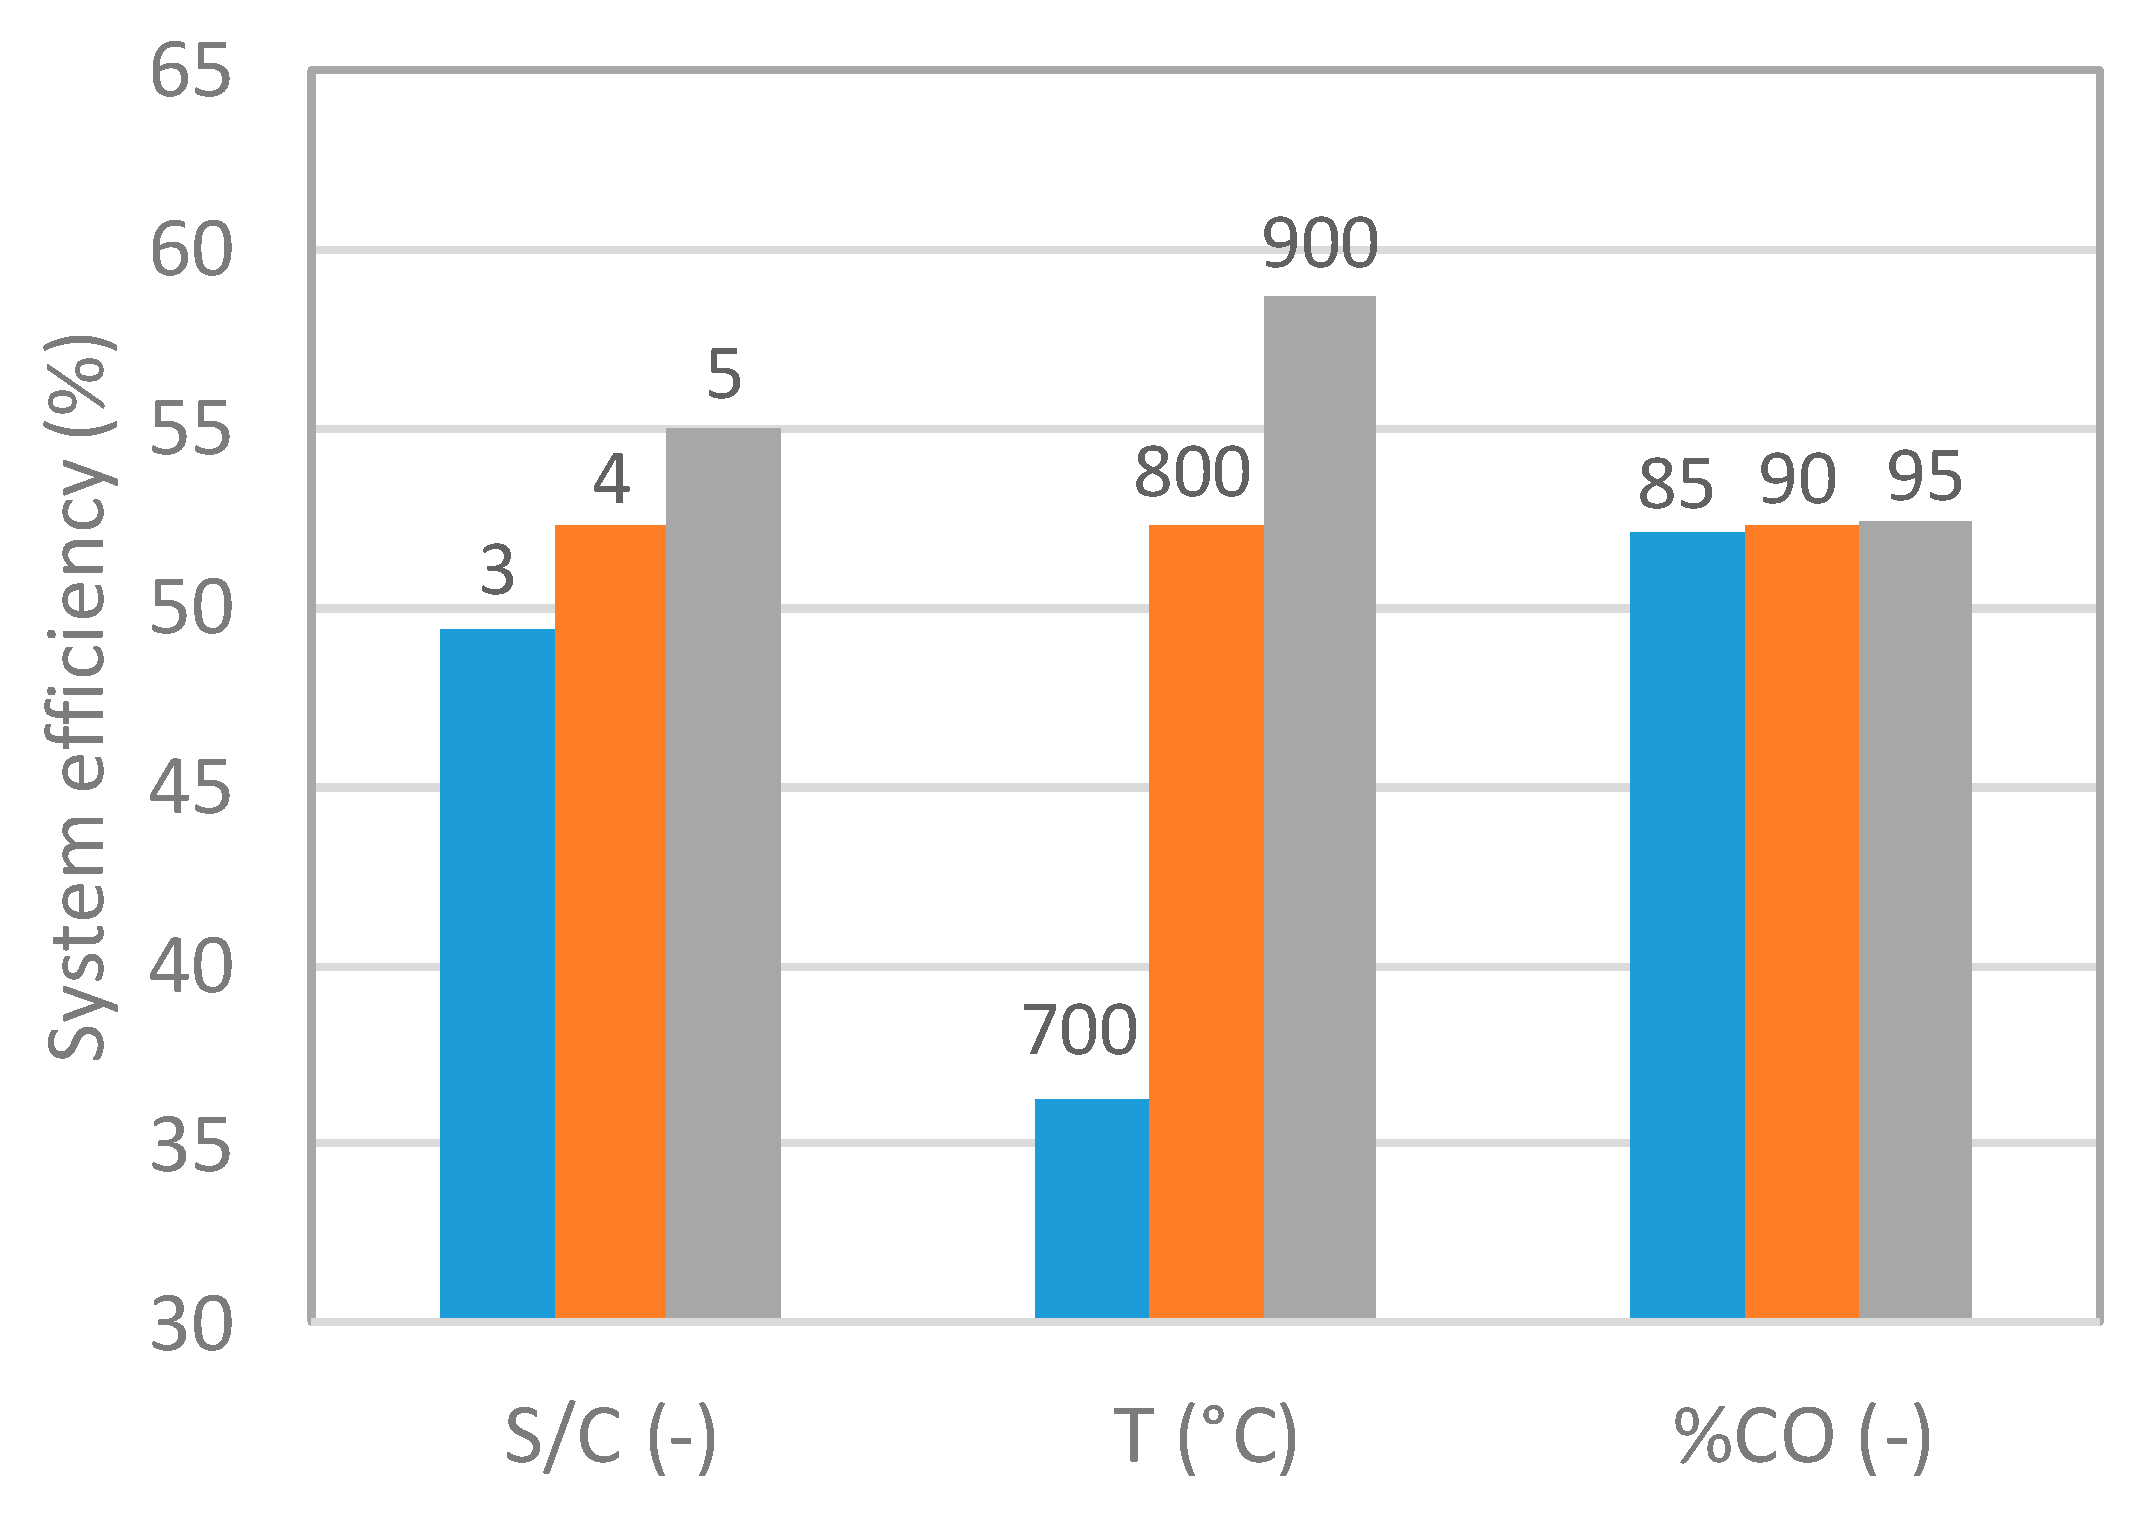
The effect of pressure on methane conversion into hydrogen shows two opposite trends for SR and ATR. For the SR layout, the molar fraction of hydrogen decreases with increasing pressure, while methane content increases: steam reforming reaction increases the number of moles, hence the equilibrium shifts towards the reactants when the pressure is increased. On the contrary, hydrogen content in the ATR layout increases at increasing system pressure.
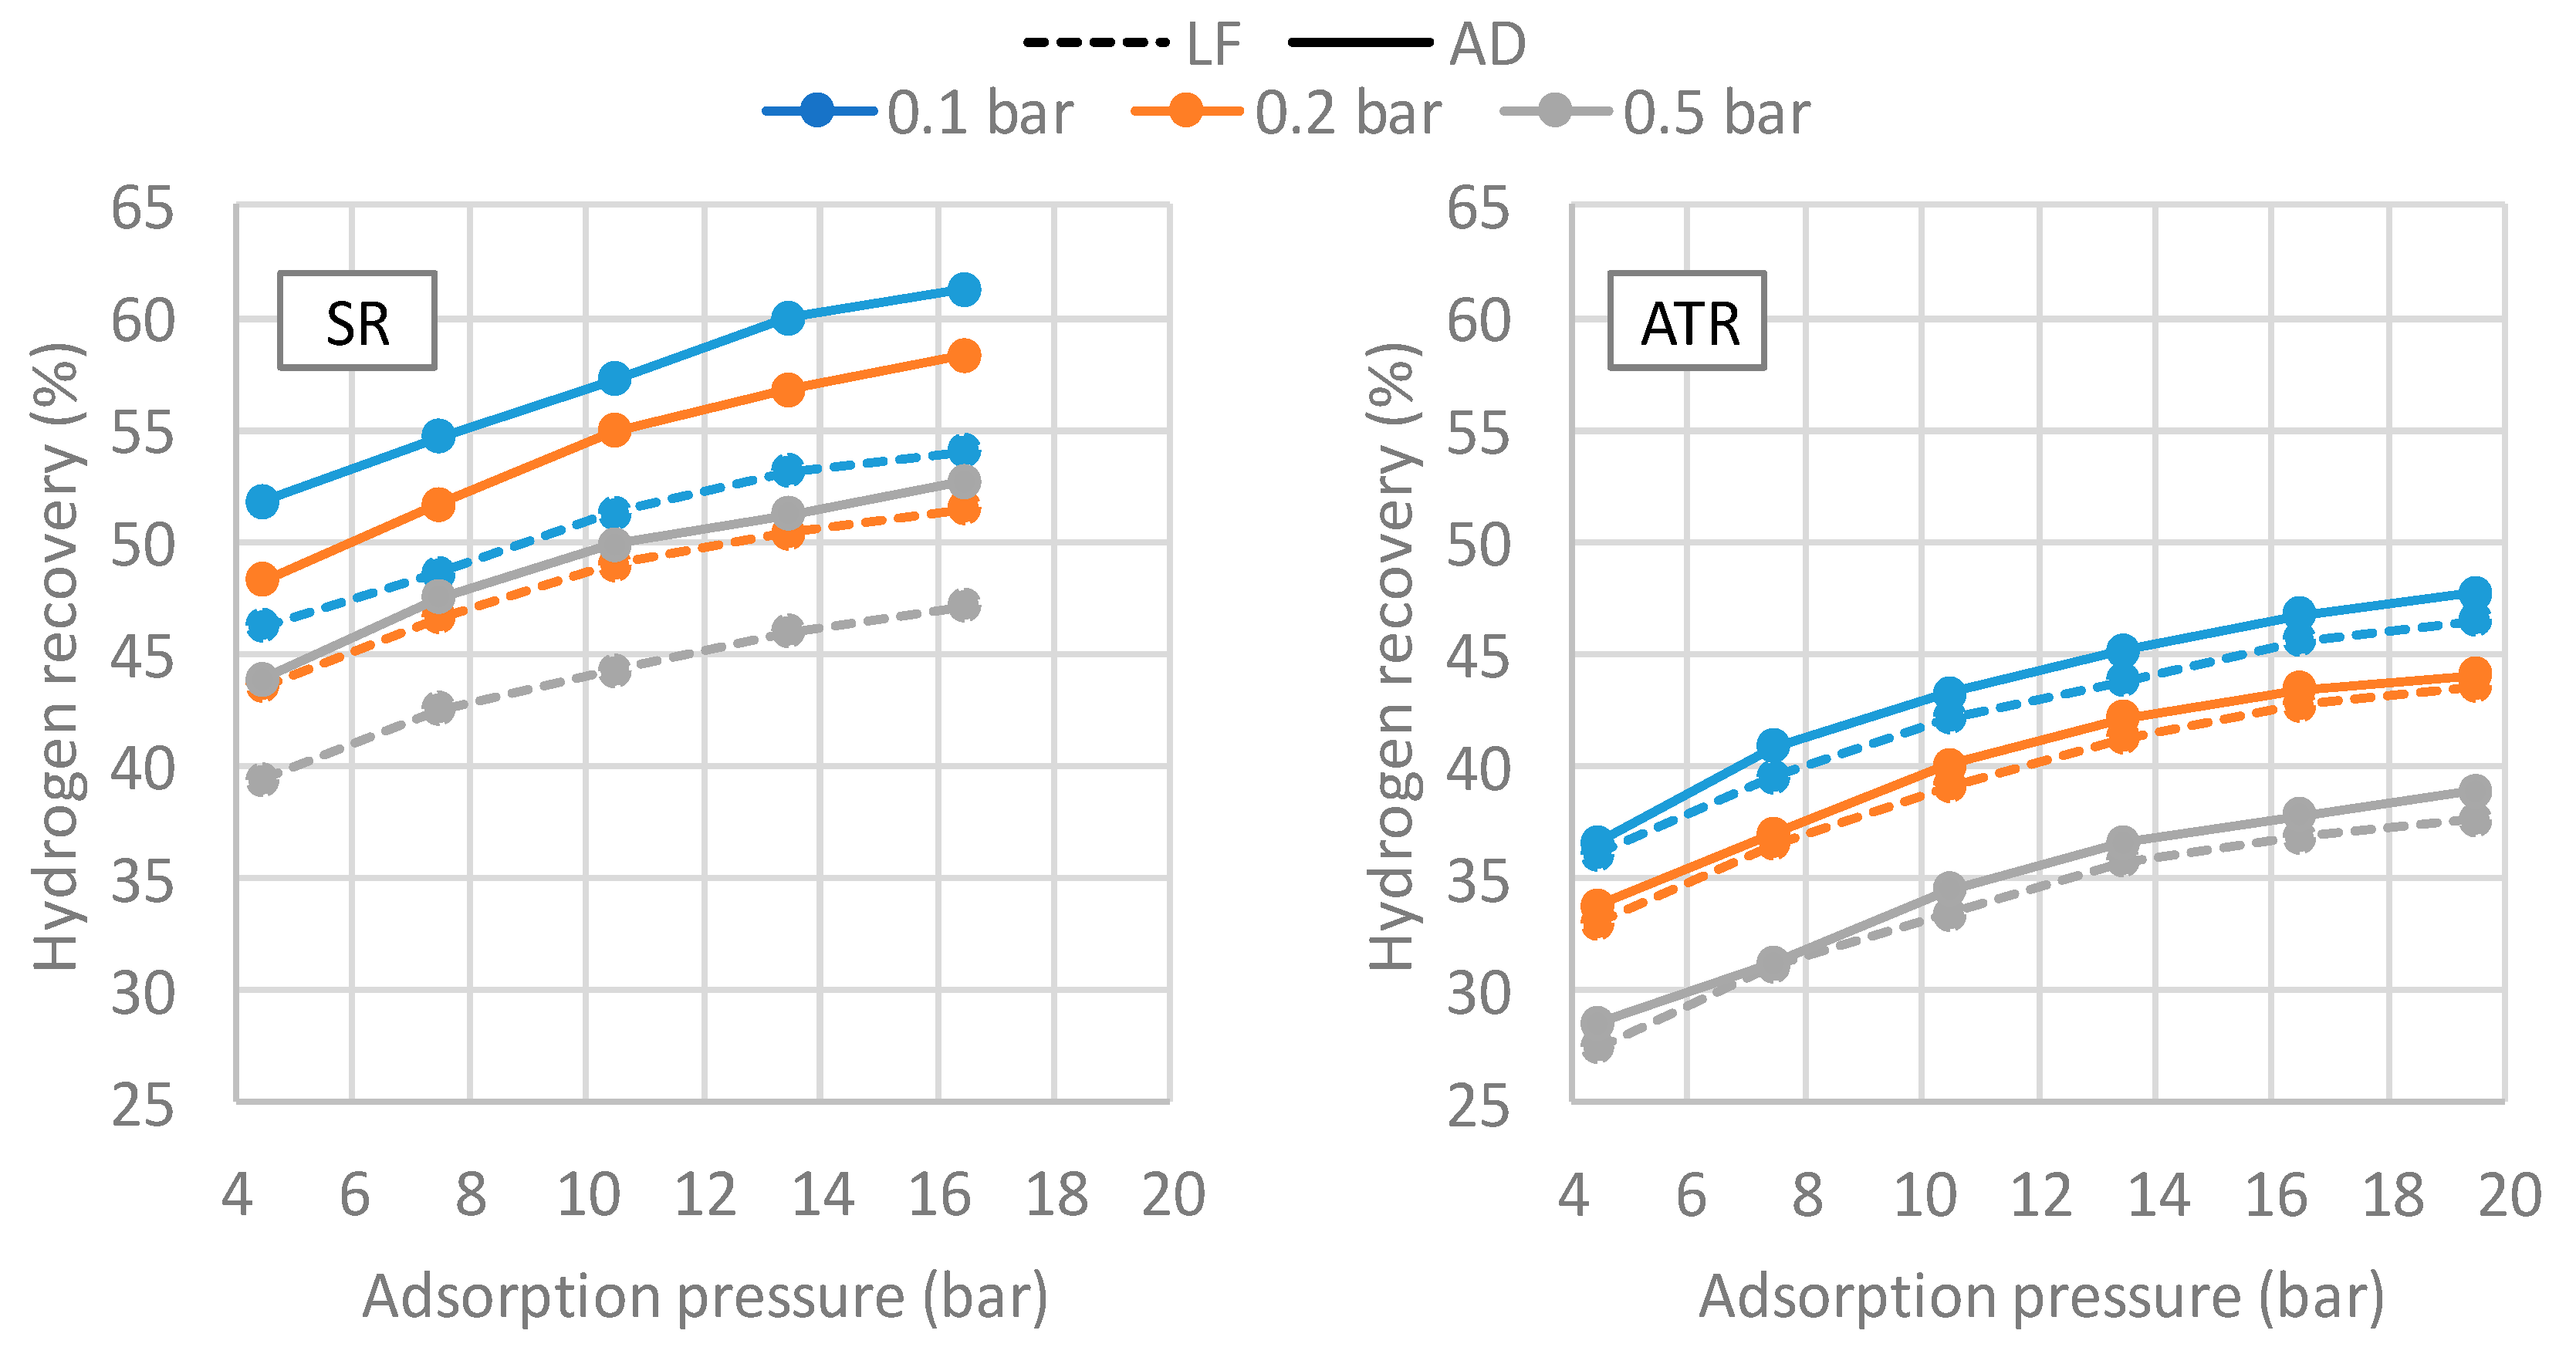
3.3. Two-Bed and Four-Bed PSA Results

As discussed above, small-scale PSA systems are characterized by poor performance, due to the limited number of beds. The critical step for both the two- and four-bed PSA configuration is the purge one, as a large amount of the produced hydrogen is recirculated for the impurity-saturated column regeneration, hence drastically reducing the system recovery. This effect is partially overcome in the VPSA by using vacuum, which makes impurity desorption more effective, requiring also less hydrogen. Table 7 reports the two-bed PSA had the best combination of purity and recovery for three operative pressures. The single pressure equalization step significantly affects recovery, due to two detrimental effects: (i) the increased amount of feed required for pressurizing the column, and (ii) the reduced amount of hydrogen recirculated during the equalization steps, that increases the one wasted during the blow down. The purity constraint is not met, and the recovery is drastically reduced for higher purities, due to the inverse proportionality between the two parameters.
Figure 5 shows the four-bed PSA recovery, with a hydrogen purity of 4.0. The highest recovery value is equal to 38.7%, and it is reached with anaerobic digestion gas. The four-bed PSA is able to reach a higher purity with respect to the two-bed configuration without affecting so much the recovery. However, the BIONICO purity requirement is not met. The low values of recovery make the two- and four-bed systems uneconomical at such small scales.

3.4. VPSA Results

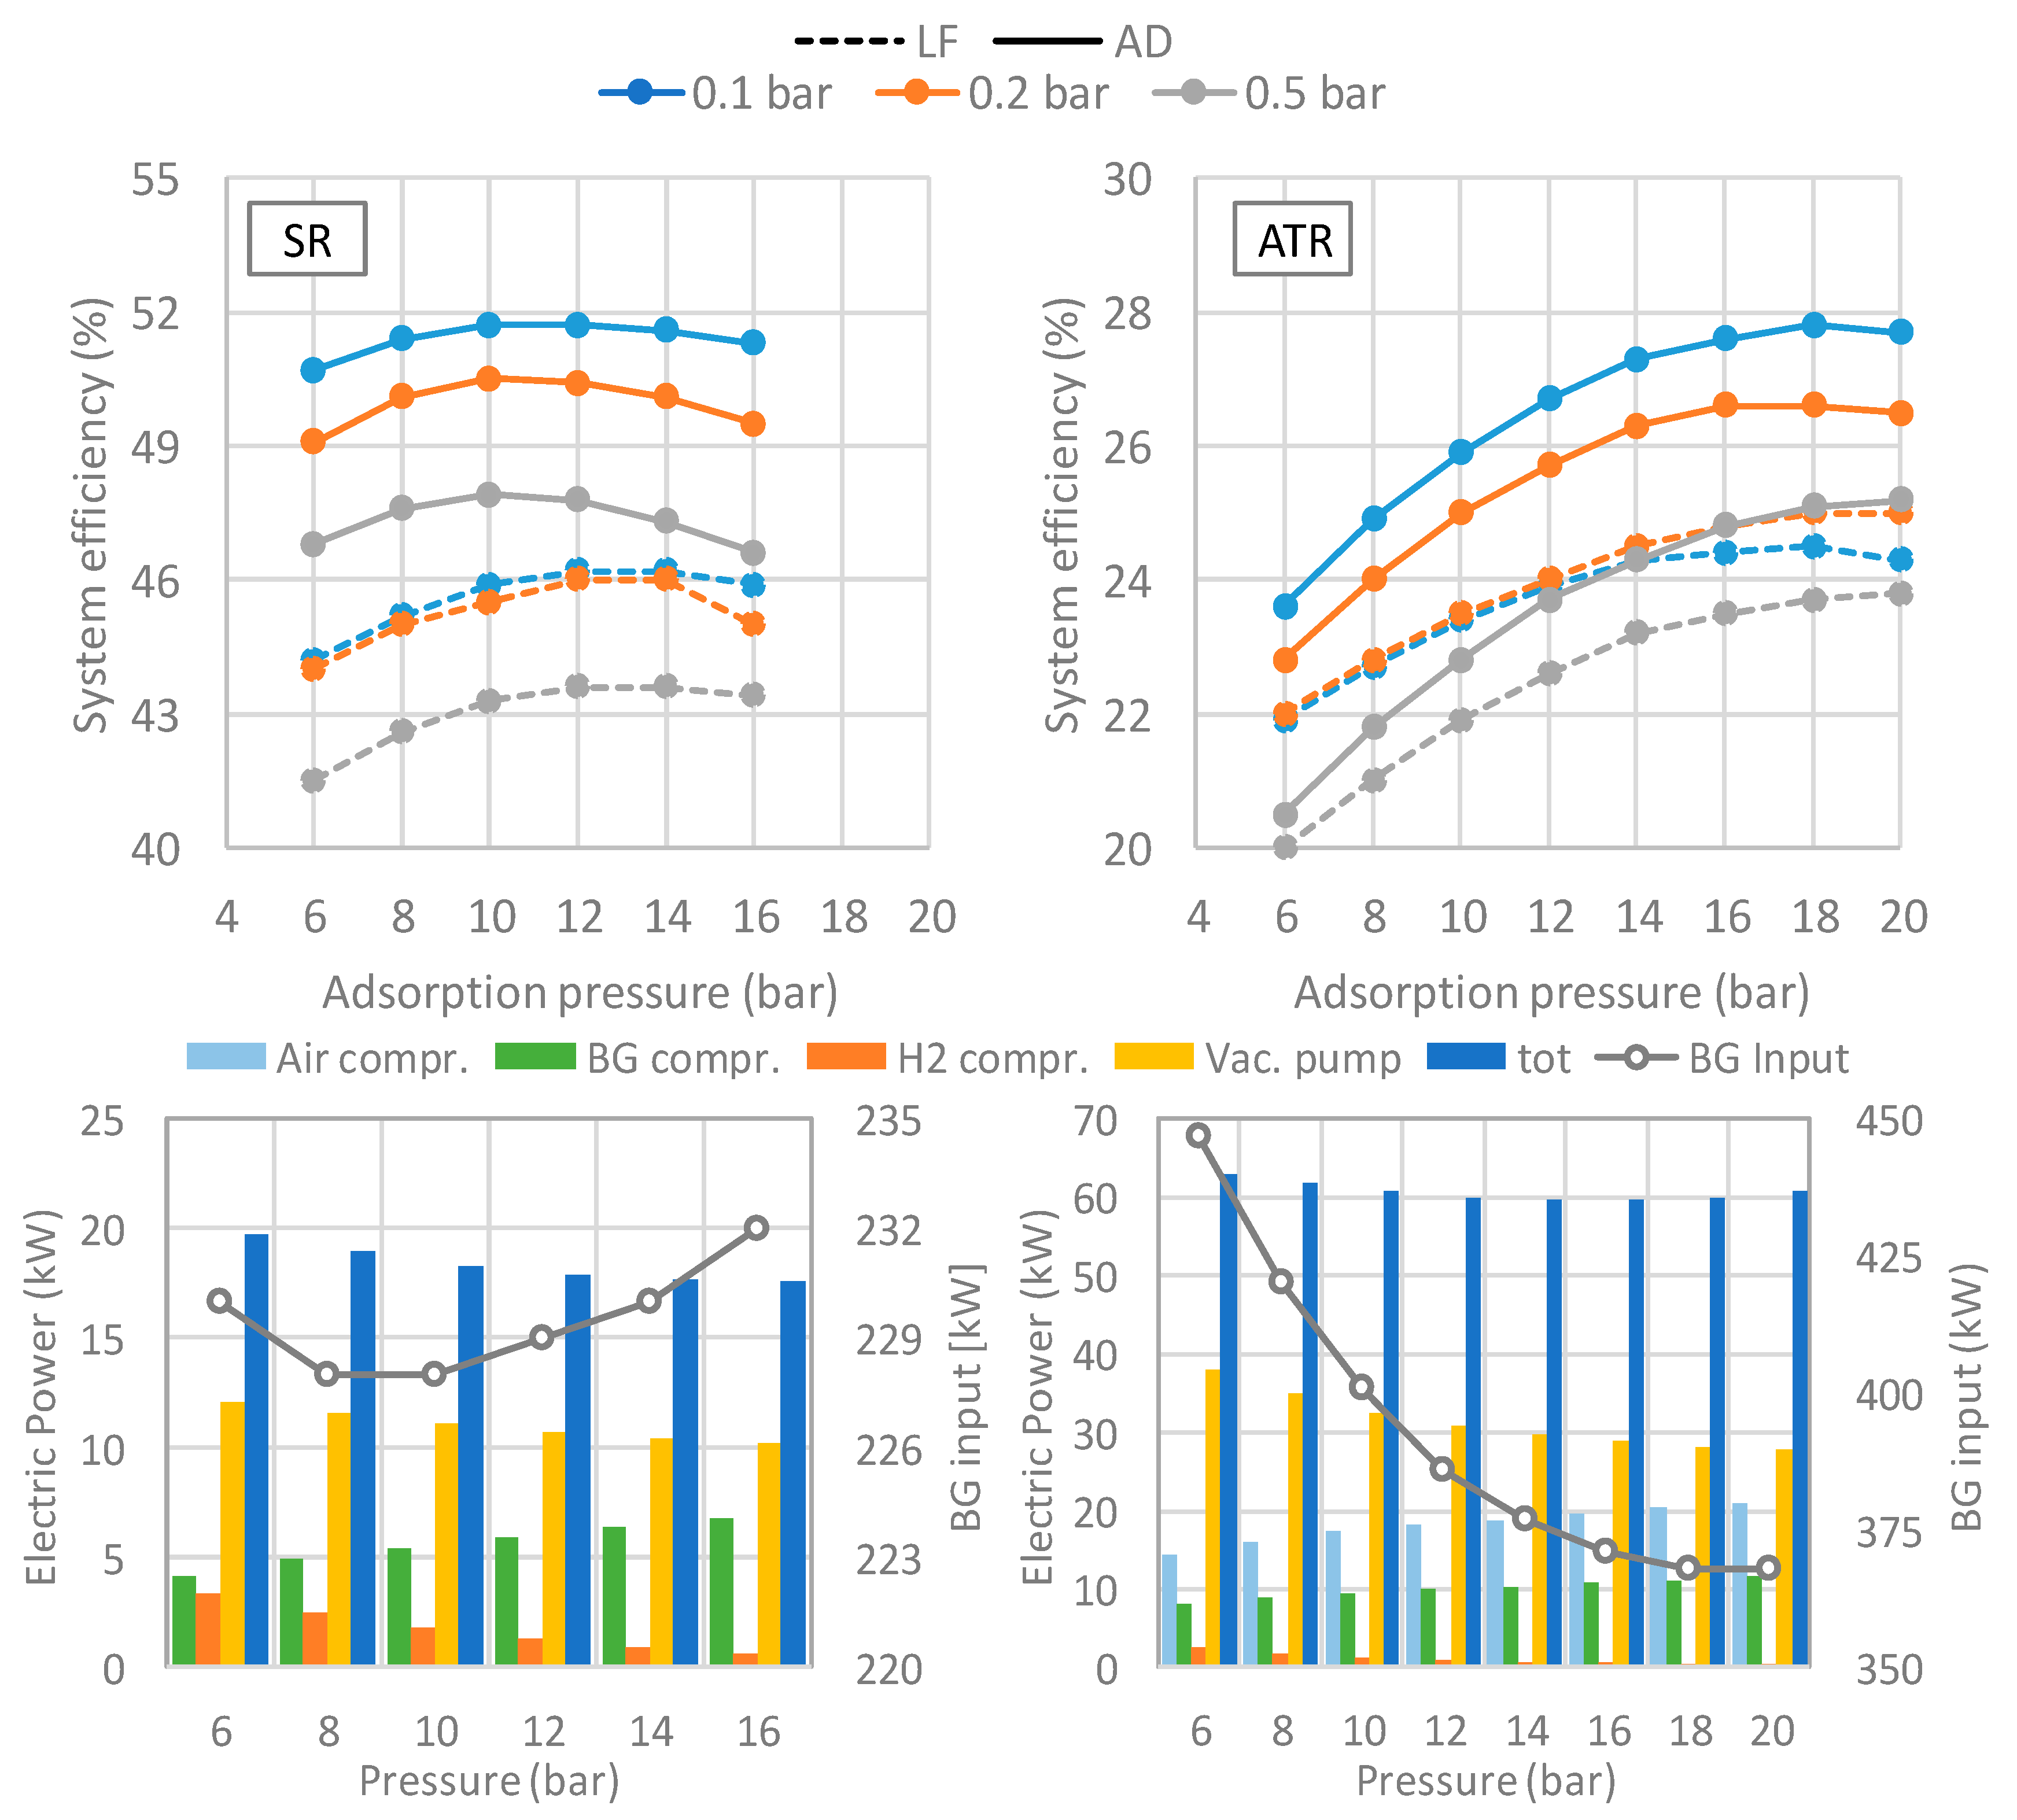
Figure 6 shows the recoveries of the VPSA system for the four different compositions analyzed. The reported pressures take into account also the pressure drops in the plant upstream in the VPSA. The three curves represent three different vacuum levels during the purge step: 0.1, 0.2, and 0.5 bar. The recoveries curve for all the cases reported here are calculated at a purity level equal to 99.999% (5.0), according to the requirements of the BIONICO.
The resulting recovery–pressure curves are then implemented in the overall system model. As it is possible to notice, the highest recovery is always obtained for the lowest vacuum pressure (0.1 bar). The gas composition is the parameter that mostly affects the performance of the system. In particular, the higher the hydrogen content in the feed stream, the higher the recovery, since lower impurities have to be purged when regenerating the column. The two recoveries for the syngas produced by the autothermal plant layout are almost identical, since the composition of the feed gas is very similar as previously described: their recoveries, however, are significantly lower with respect to the SR cases, as the high amount of nitrogen and carbon dioxide requires a large quantity of hydrogen for purging the impurity-filled column. For all the cases, nitrogen represents the main impurity in the product stream, while the amount of carbon dioxide, carbon monoxide, and methane is almost negligible.

4. System Performance

Thermodynamic results of the two cases fed with LF and AD biogases are represented in Figure 7, taking into account both different operating pressure of VPSA and reactors.
The system efficiency is always maximum when VPSA operating pressure is equal to 0.1 bar, that corresponds to the best performance of the VPSA system. It also corresponds to the highest electric consumption of the vacuum pump, but the gain in system efficiency thanks to the higher recovery of the VPSA is greater with respect to the effect of a lower energy consumption for the cases of 0.2 bar and 0.5 bar. Regarding SR, for example, the reduction of efficiency caused by the vacuum pressure higher than 0.1 bar is around 1.5% and 3.5%, for 0.2 bar and 0.5 bar, respectively.
The SR layout shows that, using landfill gas, the optimal working pressure, from an efficiency point of view, is 14 bar, while for the system that consumes anaerobic digester gas, the optimal working pressure is 12 bar. The highest efficiency reached by the plant that uses anaerobic digester gas is 51.7%, which is significantly higher with respect to the value of 46.2% of the case using landfill gas, due to the higher methane content. The highest efficiency value is mainly due to the minimum value of the biogas energy input, which is the result of two counteracting effects in the reformer and in the VPSA. At low pressures, in fact, the methane conversion in the reformer is higher: this can be seen looking at the composition of the reformed gas at the inlet of the VPSA, where for the LF gas case, for example, molar fraction of CH4 increases from 0.3 to 2.1, while the one of H2 reduces from 63.8% to 61.3%. On the other hand, the VPSA recovery increases at increasing pressures, due to the reduced adsorbing capacity of the beds when the pressure is low.
The main contribution to the total consumption is due to the vacuum pump, with a compression ratio equal to 10. The decreasing trend at increasing system pressure is due to lower mass flowrate processed by the pump: the higher VPSA recovery, in fact, implies a lower amount of biogas (and fluids circulating in the system), to produce the required daily amount of hydrogen, hence a lower consumption. The biogas compressor consumption increase is mainly due to the higher compressor ratio, and only in small part to the variation of biogas composition.
Performance of the ATR configuration is significantly worse with respect to the SR, mainly due to the VPSA recoveries: the average decrease in system efficiency is around 30%. The system using AD biogas has a higher efficiency at the same vacuum pressure with respect to the one using landfill gas. The VPSA system, however, does not significantly affect the overall efficiency, because the recoveries for the two biogases are quite similar: this is due to the fact that the composition of the reformate stream entering the VPSA is very similar for both LF and AD biogases. Hence, the differences in the overall ATR plant efficiency for the two biogases are mainly attributed to the composition of the feed biogas and auxiliary consumption, which differ between the two cases. The main parameter affecting the efficiency is the amount of biogas required: the plant using landfill biogas requires a higher amount of input energy, because a larger quantity of biogas needs to be fed, in order to meet the total of hydrogen production requirement. The causes for the higher input energy can be found in the composition and the heating value of the biogas. The amount of biogas required, in fact, is strictly dependent on its quality, meaning that the higher the quantity of impurities, the less effective the conversion into hydrogen will be. Moreover, the lower LHV of the landfill gas leads to a higher quantity of biogas that undergoes oxidation in the autothermal reforming reactor, hence having an additional detrimental effect on efficiency. Vacuum pump has the highest electric consumption among all the auxiliaries, being around 70% of the total power required. Compared to the steam reforming layout, its consumption is more than 20 kW higher, as the pump has to develop a higher off-gas flowrate, due to both a lower VPSA recovery and the additional air fed. The vacuum pump consumption decreases at increasing operating pressure, thanks to a higher VPSA recovery, while the air and biogas compressor show the opposite trend, as the compression ratio increases.
Main results of the best cases in terms of system efficiency are reported in Table 8. System efficiency at 350 bar and 700 bar are also reported in Table 8.

Sensitivity Analyses

A sensitivity analysis has been performed on the most important operating parameters of the steam reforming plant, in order to check their influence on the overall system efficiency and final hydrogen cost, validating the assumptions made for the plants modeling. The impact of the reforming temperature, the S/C ratio, and the WGS conversion, together with the reactor and VPSA pressure, was analyzed for the SR plant with anaerobic digester biogas.
Figure 8 reports the effect of each parameter on the system efficiency, from the most to the least important. The maximum reforming temperature for this analysis has been set to 900 °C as typical upper limit for steam reforming [34]. An increase of the operating temperature of the SR reactor enhances system efficiency, thanks to the higher methane conversion. On the opposite side, a lower methane conversion, thus a higher amount of biogas, at operating temperature below 800 °C strongly decreases the system efficiency. A S/C ratio value equal to 3 has a detrimental effect on the conversion of methane in the reformer, along with the higher probability of coke formation; on the other hand, an increase of S/C ratio causes an increase of the global efficiency, due to the reduction of the methane slip from the SR reactor. Although higher S/C ratio and temperature enhance the system performance, the impact on the final hydrogen production cost should be taken into account. The methodology and all the assumptions adopted for the economic analysis are discussed in Section 5. If a higher SR reactor operating temperature is assumed, the use of a temperature-resistant alloy for the reactor, such as Incoloy 800 (iron–nickel–chromium alloy), that is more expensive than the previously assumed Hastelloy, is required.
Results of economic analysis in Table 9 reveals that all the analyzed cases have a higher hydrogen production cost with respect to the reference configuration with S/C 4 and 800 °C. The assumptions made in Section 2 are thus the ones that minimize the hydrogen cost.
The higher material cost adopted at 900 °C (26.3 k€ vs 78 k€) overturns the thermodynamic advantages related to the higher reaction yield. On the other hand, the decrease in the reforming temperature increases the variable costs (amount of biogas feed, auxiliary consumptions). Also, the S/C ratio variation from the reference case equal to 4 does not produce a beneficial effect.

5. Economic Analysis

5.1. Methodology

Starting from the thermodynamic results, an economic model is developed to evaluate the final hydrogen production cost (€/kg), where consumables, auxiliaries, and fixed costs are added to the total plant cost (TPC), as expressed in Equation (7):
L C O H = ( T P C C C F ) + C O & m f i x + ( C o & m v a r h e q )   k g H 2 ( o r   N m H 2 3 )
where the operating hours of the plant have been taken equal to 7500, while the capital charge factor (CCF) have been taken equal to 0.16 [35]. The methodology used is similar to the one adopted in [9,35,36] on similar plants. The total plant cost is calculated with the bottom-up approach, breaking down the power plant into the basic components or equipment, and then adding installation costs (TIC), indirect costs (IC), and owner’s and contingencies costs (C&OC) [37], as defined in Equation (8).
T P C = [ ( i C i , 2017 · ( 1 + % T I C ) ) · ( 1 + % I C ) ] · ( 1 + % C & O C )
where C i , 2017 is the equipment cost, and % T I C = 0.8, % I C = 0.14, % C & O C = 0.15.
The component costs, obtained from several literature sources, quotes, and reports, are then scaled and actualized as defined in Equation (9), where the year cost Ci,y has been then derived from the cost Ci,0 of a reference component of size Si,0 with the actual size S and the scale factor f. Moreover, in order to actualize the cost of the component, the CEPCI index is applied (where the CEPCI index of 2017 is equal to 562.1). The equipment costs and their relative CEPCI index are summarized in Table 10.
C i , 2017 = ( C i , 0 ( S i S i , 0 ) f ) y × C E P C I 2017 C E P C I y
Reactor volume and weight has been determined with the standard gas hourly space velocity (GHSV) approach, using internal pressurized vessel in Haynes 550 for high temperature reactors (SR and ATR) and T316 stainless steel for low temperature reactors (WGGs). The heat exchangers price corresponds to the type modelled in Aspen Plus: counter-current configuration with hot gas flow externally to staggered stainless steel tubes bundle. The exchange areas have been calculated, starting from the temperatures and exchanged powers obtained from the simulations, using typical heat transfer coefficients for gas–gas, gas–liquid (see Table 2).
Concerning the O&M fixed and variable, costs of the consumables, auxiliaries, maintenance, insurance, and personnel are reported in Table 11. The cost of landfill gas is smaller than anaerobic digester, since the plant investment cost necessary to produce it is lower. Labor cost accounts for two operators with a construction time of one year. The volume of catalyst of each reactor has been calculated from GHSV values.

5.2. Results

Values of the most interesting cases in terms of final hydrogen production cost are reported in Table 12. Figure 9 summarizes the equipment cost of the two best cases with AD biogas, while Figure 10 summarizes the main contributes of O&M variable costs.
Analyzing the total equipment costs, VPSA unit, reactors, and heat exchangers, together with the additional H2 compressors (up to 700 bar), constitute the majority of total equipment cost (TEC, both using landfill gas and anaerobic digester gas for SR and ATR configurations. The additional H2 compressor, for refueling station application, has the same cost, since the hydrogen delivery pressure for all the cases is fixed at 20 bar. The VPSA unit, including the vacuum pump, is the most expensive component of the plant, due to its complexity, and has a higher impact on the ATR layout, where the flowrate of process gas is higher. On the other hand, heat exchanger costs are smaller for the ATR case, where the thermal integration allows reduction of the required surface area, while reactor costs are quite similar.
The conventional SR is the solution that implies the lower amount of variable cost, due to the low electric energy required not only by the auxiliaries, but also by the biogas, due to the low hydrogen recovery for the ATR cases. When dealing with ATR, the costs of electric energy are higher, due to the air and biogas compressor. For all the cases, the electric energy consumption takes into account the compression up to 700 bar. Even if the biogas feed decreases using AD biogas, the lower cost of biogas production from landfill is reflected on a higher variable cost for AD layouts. The deionization resin and the process water constitute only a minor contribution of the total variable costs. The levelized costs of hydrogen, according to Equation (7), are reported in Table 13.
The final cost of hydrogen is higher for ATR configuration with respect to SR at any value of reforming pressure, due to its lower efficiency, reflected also on the total plant cost and on the fixed and variable O&M costs. The impact of the H2 compression on the final cost of hydrogen is not negligible. If hydrogen were used for other applications that require lower pressure, probably its price would be in competition with the production cost of large scale plants. Finally, the higher methane content of the AD biogas makes this solution more convenient than the LF case.

6. Conclusions

This paper discussed a detailed techno-economic assessment of conventional technologies for the production of 100 kg/day of hydrogen with a purity of 5.0 using raw biogas as feedstock. The considered systems include a reforming reactor (either ATR or SR), two water gas shift reactors, and a pressure swing adsorption unit for hydrogen purification. Two different biogas compositions, featuring typical landfill and anaerobic digestion cases were considered, to assess their impact on overall system design, performance, and costs. The only system able to reach the targeted value of purity is the vacuum PSA (VPSA), due to the very low flowrate of process gas and the very small plant size. However, the recovery that the VPSA system allows is lower with respect to the typical values of large PSA units (about 80–90%) that use 10–12 beds. For the considered systems, the maximum efficiency of 52% is obtained with the SR system operating at 12 bar fed with AD biogas. A sensitivity analysis has also been performed, in order to demonstrate that the assumptions made for the modelization of the conventional plants were correct. In fact, it has been decided to change some operating parameters, such as the reforming temperature, the S/C ratio, or the WGS conversion, but the final hydrogen production cost was, in all the cases, higher.
From an economic perspective, it has been determined the hydrogen production cost, which was equal to 5 €/kg of the best case with the traditional reforming system.
Future work will focus on the comparison of the considered reforming systems with an innovative catalytic membrane reformer developed within the BIONICO project.

Acknowledgments

The BIONICO project leading to this application has received funding from the Fuel Cells and Hydrogen 2 Joint Undertaking under grant agreement No 671459. This Joint Undertaking receives support from the European Union’s Horizon 2020 research and innovation programme, Hydrogen Europe and N.ERGHY.

Author Contributions

Giampaolo Manzolini, Marco Binotti and Gioele Di Marcoberardino conceived the study. Dario Vitali and Francesco Spinelli performed the numerical simulations and designed the system model together with Gioele Di Marcoberardino. All authors discussed the results and contributed to the final version of the manuscript. Gioele Di Marcoberardino wrote the manuscript with support from Dario Vitali and Francesco Spinelli. Giampaolo Manzolini and Marco Binotti supervised the project.

Conflicts of Interest

The authors declare no conflict of interest.

Annexes

Nomenclature 

Δ H 298   K 0 Heat of reaction in standard conditions, kJ/mol
B i Langmuir parameter, 1/bar
n ˙ i Molar flow, kmol/s
pPressure, bar
p i Partial pressure, bar
q i Loading (Amount adsorbed of species on the solid adsorbent), kmol/kgads
q m i Langmuir parameter, kmol/kgads
TTemperature, °C
t a d s Adsorption time, s
t c y c l e Cycle time, s
W a u x Electric auxiliary consumptions, kW
x i Molar fraction, -
Acronyms
ADAnaerobic digester
ADSVPSA Adsorption step
ATRAutothermal reformer
BDVPSA Blow down step
BGBiogas
BSRBiogas steam reforming
C&OCOwner’s and contingencies costs
CCFCapital charge factor
EDVPSA Depressurization step
EPVPSA Pressurization step
EUEurope
GHSVGas hourly space velocity, h−1
HTHigh temperature
HXHeat exchanger
ICIndirect costs, €
L/DAspect Ratio: Reactor Length/Diameter
LCOHLevelized cost of hydrogen, €/kg
LFLandfill
LHVLow heating value
LTLow temperature
NGNatural gas
O&MOperation and Maintenance costs, €
PPump
P/FPurge to feed ratio
PGVPSA Purge step
PPGVPSA Providing Purge step
PSAPressure swing adsorption unit
RPVPSA Pressurization step
S/CSteam to carbon molar ratio, -
SRSteam reformer
TECTotal Equipment Cost, €
TICInstallation costs, €
TPCTotal Plant Cost, €
TSATemperature swing adsorption unit
VPSAVacuum Pressure swing adsorption unit
WGSWater gas shift
Greek letters
ηsysSystem efficiency in terms of LHV of hydrogen, %
λATRAir to flow to ATR inlet ratio, -
ηel,refAverage electric efficiency of the power generating park, %

References

  1. Ball, M.; Wietschel, M. The Hydrogen Economy: Opportunities and Challenges; Cambridge University Press: New York, NY, USA, 2009. [Google Scholar]
  2. Sumbramani, V.; Basile, A.; Verizoglu, N.T. Compendium of Hydrogen Energy: Hydrgoen Production and Purification; Elsevier Science & Technology: Amsterdam, The Netherlands, 2015. [Google Scholar]
  3. Nikolaidis, P.; Poullikkas, A. A comparative overview of hydrogen production processes. Renew. Sustain. Energy Rev. 2017, 67, 597–611. [Google Scholar] [CrossRef]
  4. Hosseini, S.E.; Wahid, M.A. Hydrogen production from renewable and sustainable energy resources: Promising green energy carrier for clean development. Renew. Sustain. Energy Rev. 2016, 57, 850–866. [Google Scholar] [CrossRef]
  5. Dincer, I.; Acar, C. Review and evaluation of hydrogen production methods for better sustainability. Int. J. Hydrogen Energy 2015, 40, 11094–11111. [Google Scholar] [CrossRef]
  6. Albrecht, U.; Altmann, M.; Barth, F.; Bünger, U.; Fraile, D.; Lanoix, J.-C.; Pschorr-Schoberer, E.; Vanhoudt, W.; Weindorf, W.; Zerta, M.; et al. Study on Hydrogen from Renewable Resources in the EU; Final Report; FCH: Brussels, Belgium, 2015. [Google Scholar]
  7. European Biogas Association. EBA Annual Report 2015; European Biogas Association: Brussels, Belgium, 2015. [Google Scholar]
  8. EurObserv’ER. The State of Renewable Energies in Europe; European Union: Brussels, Belgium, 2016; Available online: http://www.eurobserv-er.org/pdf/bilan11.asp (accessed on 12 January 2017).
  9. Braga, L.B.; Silveira, J.L.; da Silva, M.E.; Tuna, C.E.; Machin, E.B.; Pedroso, D.T. Hydrogen production by biogas steam reforming: A technical, economic and ecological analysis. Renew. Sustain. Energy Rev. 2013, 28, 166–173. [Google Scholar] [CrossRef]
  10. Holladay, J.D.; Hu, J.; King, D.L.; Wang, Y. An overview of hydrogen production technologies. Catal. Today 2009, 139, 244–260. [Google Scholar] [CrossRef]
  11. Smestad, G.P.; Steinfeld, A. Review: Photochemical and thermochemical production of solar fuels from H2O and CO2 using metal oxide catalysts. Ind. Eng. Chem. Res. 2012, 51, 11828–11840. [Google Scholar] [CrossRef]
  12. Binotti, M.; di Marcoberardino, G.; Biassoni, M.; Manzolini, G. Solar hydrogen production with cerium oxides thermochemical cycle. AIP Conf. Proc. 2017, 1850, 100002. [Google Scholar] [CrossRef]
  13. Göransson, K.; Söderlind, U.; He, J.; Zhang, W. Review of syngas production via biomass DFBGs. Renew. Sustain. Energy Rev. 2011, 15, 482–492. [Google Scholar] [CrossRef]
  14. Alves, H.J.; Junior, C.B.; Niklevicz, R.R.; Frigo, E.P.; Frigo, M.S.; Coimbra-Araújo, C.H. Overview of hydrogen production technologies from biogas and the applications in fuel cells. Int. J. Hydrogen Energy 2013, 38, 5215–5225. [Google Scholar] [CrossRef]
  15. Ugarte, P.; Durán, P.; Lasobras, J.; Soler, J.; Menéndez, M.; Herguido, J. Dry reforming of biogas in fluidized bed: Process intensification. Int. J. Hydrogen Energy 2017, 42, 13589–13597. [Google Scholar] [CrossRef]
  16. Ohkubo, T.; Hideshima, Y.; Shudo, Y. Estimation of hydrogen output from a full-scale plant for production of hydrogen from biogas. Int. J. Hydrogen Energy 2010, 35, 13021–13027. [Google Scholar] [CrossRef]
  17. Araki, S.; Hino, N.; Mori, T.; Hikazudani, S. Autothermal reforming of biogas over a monolithic catalyst. J. Nat. Gas Chem. 2010, 19, 477–481. [Google Scholar] [CrossRef]
  18. Araki, S.; Hino, N.; Mori, T.; Hikazudani, S. Durability of a Ni based monolithic catalyst in the autothermal reforming of biogas. Int. J. Hydrogen Energy 2009, 34, 4727–4734. [Google Scholar] [CrossRef]
  19. Ahn, S.; You, Y.W.; Lee, D.G.; Kim, K.H.; Oh, M.; Lee, C.H. Layered two- and four-bed PSA processes for H2 recovery from coal gas. Chem. Eng. Sci. 2012, 68, 413–423. [Google Scholar] [CrossRef]
  20. Golmakani, A.; Fatemi, S.; Tamnanloo, J. Investigating PSA, VSA, and TSA methods in SMR unit of refineries for hydrogen production with fuel cell specification. Sep. Purif. Technol. 2017, 176, 73–91. [Google Scholar] [CrossRef]
  21. Yang, J.; Lee, C.H.; Chang, J.W. Separation of Hydrogen Mixtures by a Two-Bed Pressure Swing Adsorption Process Using Zeolite 5A. Ind. Eng. Chem. Res. 1997, 36, 2789–2798. [Google Scholar] [CrossRef]
  22. AspenTech. Aspen Plus, (n.d.). Available online: http://www.aspentech.com/products/aspen-plus.aspx (accessed on 12 January 2017).
  23. Foresti, S.; Manzolini, G. Performances of a micro-CHP system fed with bio-ethanol based on fluidized bed membrane reactor and PEM fuel cells. Int. J. Hydrogen Energy 2016, 41, 9004–9021. [Google Scholar] [CrossRef]
  24. Di Marcoberardino, G.; Manzolini, G. Investigation of a 5 kW micro-CHP PEM fuel cell based system integrated with membrane reactor under EU natural gas quality. Int. J. Hydrogen Energy 2017, 42, 13988–14002. [Google Scholar] [CrossRef]
  25. Di Marcoberardino, G.; Roses, L.; Manzolini, G. Technical assessment of a micro-cogeneration system based on polymer electrolyte membrane fuel cell and fluidized bed autothermal reformer. Appl. Energy 2016, 162, 231–244. [Google Scholar] [CrossRef]
  26. Peng, D.Y.; Robinson, D.B. New two-constant equation of state. Ind. Eng. Chem. Fundam. 1976, 15, 59–64. [Google Scholar] [CrossRef]
  27. Rackett, H.G. Equation of state for saturated liquids. J. Chem. Eng. Data 1970, 15, 514–517. Available online: http://www.scopus.com/inward/record.url?eid=2-s2.0-33947293984&partnerID=tZOtx3y1 (accessed on 12 January 2017). [CrossRef]
  28. Haar, L.; Gallagher, J.; Kell, G.S. NBS/NRC Steam Tables: Thermodynamic and Transport Properties and Computer Programs for Vapor and Liquid States of Water in S.I. Units; Hemisphere Publishing Corporation: Washington, DC, USA, 1984. [Google Scholar]
  29. Ribeiro, A.M.; Grande, C.A.; Lopes, F.V.S.; Loureiro, J.M.; Rodrigues, A.E. A parametric study of layered bed PSA for hydrogen purification. Chem. Eng. Sci. 2008, 63, 5258–5273. [Google Scholar] [CrossRef]
  30. Lopes, D.G.; da Silva, E.P.; Pinto, C.S.; Neves, N.P.; Camargo, J.C.; Ferreira, P.F.P.; Furlan, A.L.; Lopes, D.G. Technical and economic analysis of a power supply system based on ethanol reforming and PEMFC. Renew. Energy 2012, 45, 205–212. [Google Scholar] [CrossRef]
  31. Jiang, L.; Fox, V.G.; Biegler, L.T. Simulation and optimal design of multiple-bed pressure swing adsorption systems. AIChE J. 2004, 50, 2904–2917. [Google Scholar] [CrossRef]
  32. HyGear, H.Y. GEN On-Site Hydrogen Generation System, (n.d.). Available online: http://hygear.com/technologies/hy-gen/ (accessed on 12 January 2017).
  33. Sircar, S.; Golden, T.C. Purification of Hydrogen by Pressure Swing Adsorption. Sep. Sci. Technol. 2000, 35, 667–687. [Google Scholar] [CrossRef]
  34. Guandalini, G.; Campanari, S.; Valenti, G. Comparative assessment and safety issues in state-of-the-art hydrogen production technologies. Int. J. Hydrogen Energy 2016, 41, 18901–18920. [Google Scholar] [CrossRef]
  35. Spallina, V.; Pandolfo, D.; Battistella, A.; Romano, M.C.; Annaland, M.v.; Gallucci, F. Techno-economic assessment of membrane assisted fluidized bed reactors for pure H2 production with CO2 capture. Energy Convers. Manag. 2016, 120, 257–273. [Google Scholar] [CrossRef]
  36. Sjrdin, M.; Damen, K.; Faaij, A. Techno-economic prospects of small-scale membrane reactors in a future hydrogen-fuelled transportation sector. Energy 2006, 31, 2523–2555. [Google Scholar] [CrossRef]
  37. Gerdes, K.; Summers, W.M.; Wimer, J. Cost Estimation Methodology for NETL Assessments of Power Plant Performance; DOE/NETL-2011/1455; United States Department of Energy: Washington, DC, USA, 2011; Volume 26. Available online: http://www.netl.doe.gov/File Library/research/energy analysis/publications/QGESSNETLCostEstMethod.pdf (accessed on 12 January 2017).
  38. Chemical Engineering Magazine, (n.d.). Available online: http://www.chemengonline.com/the-magazine/ (accessed on 12 January 2017).
  39. International Renewable Energy Agency (IRENA). Biomass for Power Generation; International Renewable Energy Agency: Abu Dhabi, United Arab Emirates, 2012. [Google Scholar]
  40. European Commission. EuroStat—Statistics Explained. 2015. Available online: http://ec.europa.eu/eurostat/statistics-explained/index.php/Main_Page (accessed on 12 January 2017).
Figure 1. Layout of the SR reference case (SR: steam reforming; HX: heat exchanger; BG: biogas; SH: superheater; EV: evaporator; LT: low temperature; WGS: water gas shift; HT: high temperature; SEP: water separator CMP: compressor; PSA: pressure swing adsorption).
Processes 06 00019 g001
Figure 2. Layout of the ATR reference case (ATR: autothermal reforming).
Processes 06 00019 g002
Figure 3. Scheme of VPSA in the Aspen Adsorption flowsheet.
Processes 06 00019 g003
Figure 4. VPSA four-bed cycle: steps flow diagram (a), sequence of each beds (b), steps operating pressure (c).
Processes 06 00019 g004
Figure 5. Four-bed PSA recovery for SR AD biogas (solid line) and LF biogas (dashed line). (AD: anaerobic digester; LF: Landfill).
Processes 06 00019 g005
Figure 6. VPSA hydrogen recovery for SR (left) and ATR (right) layouts with different biogas composition (LF dashed lines, AD solid lines).
Processes 06 00019 g006
Figure 7. System efficiency for SR (left) and ATR (right) cases. Top: influence of biogas composition (LF dashed lines, AD solid lines) and VPSA operating pressure. Bottom: auxiliary consumptions for the best case with AD BG and VPSA pressure 0.1 bar.
Processes 06 00019 g007
Figure 8. Sensitivity analyses results for SR AD case at S/C4, 12 bar, 800 °C, and VPSA 0.1 bar.
Processes 06 00019 g008
Figure 9. TEC of SR and ATR plant using AD BG.
Processes 06 00019 g009
Figure 10. O&M variable costs of the different layouts.
Processes 06 00019 g010
Table 1. Investigated biogas compositions.
SpeciesUnitsLandfillAnaerobic Digester
CH4% mol44.258.1
CO234.033.9
N216.03.8
O22.71.1
H20.0165-
CO0.0006-
H2OSaturatedSaturated
p, Tbar, °C1.013, 251.013, 25
LHVMJ/kg12.717.8
Table 2. Reference case model assumptions and design parameters (ATR: autothermal reforming; SR: steam reforming; WGS: water gas shift; VPSA: vacuum pressure swing adsorption unit).
ParameterUnitsValue
Feed & operating conditions
Pressure reaction sidebar6–16 for SR
8–20 for ATR
S/C ratio-4 @ SR
3 @ ATR
λATR (air to ATR)-0.3
%O2,dry in exhaust%mol3
Ambient temperature°C15
Vented gas temperature°C60
H2 production targetkg/day100
Hydrogen delivery pressurebar20
H2 purity%99.999
Reactors temperatures and pressure drops
SR°C/bar800 °C/0.10
ATR°C/bar800 °C/0.10
High temperature WGS°C/bar350 °C/0.05
Low temperature WGS°C/bar200 °C/0.05
Reactor gas hourly space velocity SR/ATR or WGSh−12800/6600
Reactor Aspect ratio (L/D) SR/ATR or WGS-6/5
Vacuum pressure swing adsorption
VPSA efficiency-f(xi,ref,p)
Vacuum pressurebar0.1/0.2/0.5
H2 side pressure dropbar0.5
H2 max delivery pressurebar20
Heat exchangers and reactors design
Δp heat exchangers reactorsbar0.05–0.15
Design minimum ∆T in exchangers gas/gas°C30
Design minimum ∆T in exchangers gas/liquid or bi-phase°C10
Heat losses in heat exchangers (fraction of thermal duty)%1–5
Heat transfer coefficient gas/gasW/m2K60
Heat transfer coefficient gas/liquid or biphaseW/m2K70
Auxiliaries & controls
Pumps hydraulic efficiency%70
Compressors/fans isentropic efficiency%70
Electric motors efficiency%95
Controller consumption (% of total auxiliaries consumptions)W10%
Table 3. SR case: stream properties at in/exit of reactors (@pressure and T).
StreamFlowT (°C)P (bar)Composition (% Molar Basis)
Molar (mol/s)Mass (g/s)CH4H2COCO2H2OO2N2
10.648181501444.2<0.1<0.134.03.22.516.0
21.1452115.114.1----100.0--
32.3443980023.950.935.09.611.538.5-4.5
42.34439391.113.90.943.7120.129.8-4.5
52.34439209.913.850.944.5<0.121.029.0-4.5
60.57311520-99.999----<0.1
72.55776601.1---21.218.32.559.4
Table 4. ATR case: stream properties at in/exit of reactors (@pressure and T).
StreamFlowT (°C)P (bar)Composition (% Molar Basis)
Molar (mol/s)Mass (g/s)CH4H2COCO2H2OO2N2
11.139321501844.2<0.1<0.134.03.22.516.0
21.5112715.218.15----100.0--
34.81310180017.950.422.47.311.732.8-16.0
44.813101425.117.90.427.02.816.328.2-25.4
54.813101228.917.850.429.50.318.825.7-25.4
60.57811520-99.999----<0.1
75.270155601.1---17.415.72.564.4
Table 5. Main feature of the pressure swing adsorption column.
ParameterUnitValue
Column diameterm0.38
Operative pressures (landfill gas)bar4–16
Operative pressures (anaerobic digester gas)bar4–20
Feed temperature°C25
Activated carbon heightm1.4
Vacuum pressure (VPSA)bar0.1/0.2/0.5
Column height (2-bed)m2
Column height (4-bed)m2.8
Carbon-to-zeolite ratio (2-bed)-70:30
Carbon-to-zeolite ratio (4-bed)-50:50
Table 6. VPSA inlet composition of SR configuration.
BG Type LFAD
Layout-SRATRSRATRSRATRSRATRSRATRSRATR
pin VPSAbar8141781417
CH4% mol0.60.11.50.32.10.51.40.23.20.64.10.9
CO229.124.629.324.929.525.027.923.228.223.528.323.6
CO0.50.30.50.30.50.30.60.40.50.40.60.4
H263.437.162.037.861.337.968.739.766.640.465.540.4
O2------------
H2O0.20.20.10.10.10.10.20.20.10.10.10.1
N26.237.76.436.66.636.21.236.31.335.11.434.6
Table 7. Purity and recovery of two-bed PSA system with SR landfill reformed gas.
ParameterUnitsSR LF
pbar51015
H2 Purity%94.5397.1598.57
H2 Recovery%88.4773.7358.60
Table 8. Simulations results for the conventional systems at different delivery pressures.
ParameterUnitsSRATR
BG Composition-LFADLFAD
S/C-4433
pbar14121818
H2 productionkg/day100100100100
p VPSAbar0.10.10.10.1
BG FeedNm3/h56.139.592.463.5
BG InputkW247229407368
BG compressorkW9.05.916.411.2
VPSA vacuum pumpkW14.410.734.428.2
Air compressorkW--21.920.3
H2 compressor (20 bar)kW0.91.30.30.3
H2 compressor (350 bar)kW9.39.78.78.7
H2 compressor (700 bar)kW16.016.415.415.4
System efficiency (20 bar)%46.251.724.527.8
System efficiency (350 bar)%43.548.423.726.8
System efficiency (700 bar)%41.646.023.126.0
Table 9. Influence of sensitivity analysis on the hydrogen production cost.
ResultsUnitsS/C 4; T SR 800 °CS/CT SR
35700 °C900 °C
Biogas variable costk€/y20.5222.8220.3731.1718.87
Electric energyk€/y27.3929.5128.3733.3827.67
Total variable costsk€/y56.2959.9056.9975.055.72
Reactor costk€7.838.087.818.8726.29
TPCk€175.1175.2176.8194.1209.2
LCOH€/kg5.1905.3005.2135.9035.321
Table 10. Cost assumption for plant components.
ComponentsScaling ParameterS0C0 (k€)fYear CostCEPCI
SRWeight (lb)130,00070.320.32007525.4
WGSWeight (lb)130,0007.320.32007525.4
ATRWeight (lb)130,00070.320.32007525.4
Heat exchangerExchange area (m2)215.50.592007525.4
Biogas compressorPower (kW)53.30.822006499.6
Air compressorPower (MW)0.683.420.672009521.9
Water demineralizerWater flowrate (lH2O/h)902.10.682011585.7
Water pumpWater flowrate (lH2O/h)901.20.72011585.7
H2 compressorPower (HP)10.120.31987324
H2 compressor 700 barInlet flowrate (kg/h)4.79220.822006499.6
Vacuum pump [38]----1986318
VPSA unitInlet flowrate (kmol/h)17.06927.950.62007525.4
Burner [38]----2013567.3
Table 11. O&M fixed and variable costs.
ComponentsUnitsCost
SR or ATR atalyst [35]k€/m350 (Lifetime 5 years)
WGS catalyst [35]k€/m314 (Lifetime 5 years)
Deionisation Resin€/y447 (Lifetime 5 years)
Landfill Biogas [39]€/GJ1.50
Anaerobic Digester [39]€/GJ3.46
Electric energy [40]€/kWh0.12
Process water€/m30.35
Maintenance-2% TPC
Insurance-2.5% TPC
Labour cost60,000
Table 12. TEC and TP of the different layouts considered. All the costs are reported in k€.
Values in k€SR LFSR ADATR LFATR AD
Pressure (bar)8141214
Reactors7.848.218.768.11
WGS reactors1.802.012.502.46
VPSA Unit16.9814.6022.7422.77
Heat exchangers12.1911.577.788.17
Biogas compressor5.014.358.916.69
Air compressor000.350.34
H2 compressor0.250.160.170.15
Water demineralizer0.930.850.670.61
Water pump1.090.991.281.15
Vacuum pump7.075.1111.6710.95
Burner4.954.959.919.91
H2 compressor 700 bar22.0822.0822.0822.08
TEC80.2074.8796.8193.39
TPC189.26176.67228.45220.37
Table 13. Comparison of levelized cost of hydrogen for the different analyzed cases at 20 and 700 bar.
UnitsSRATR
Pressurebar6810146101418
LCOH (@20 bar)LF€/kg4.2474.2504.2554.2926.4196.3816.4366.596
AD4.2384.2224.2084.2096.4726.4076.3736.411
LCOH (@700 bar)LF€/kg5.0405.0435.0485.0857.1467.1087.1637.323
AD5.0034.9874.9734.9747.1977.1327.0987.136

