Article

Laboratory Investigation of Granite Permeability after High-Temperature Exposure

State Key Laboratory for Geomechanics & Deep Underground Engineering, China University of Mining and Technology, Xuzhou 221116, China
*
Author to whom correspondence should be addressed.
Processes 2018, 6(4), 36; https://doi.org/10.3390/pr6040036
Submission received: 13 March 2018 / Revised: 13 April 2018 / Accepted: 17 April 2018 / Published: 19 April 2018
(This article belongs to the Special Issue Fluid Flow in Fractured Porous Media)

Abstract

:
This study experimentally analysed the influence of temperature levels (200, 300, 400, 500, 600, and 800 °C) on the permeability of granite samples. At each temperature level, the applied confining pressure was in the range of 10–30 MPa, and the inlet hydraulic pressure varied below the corresponding confining pressure. The results are as follows: (i) With an increase in the temperature level, induced micro-fractures in the granites develop, and the decrement ratios of both the P-wave velocity and the density of the granite increase; (ii) The relationship between the volume flow rate and the pressure gradient is demonstrably linear and fits very well with Darcy’s law. The equivalent permeability coefficient shows an increasing trend with the temperature, and it can be best described using the mathematical expression K0 = A × 1.01T; (iii) For a given temperature level, as the confining pressure increases, the transmissivity shows a decrease, and the rate of its decrease diminishes gradually.

1. Introduction

Rock properties that are related to high-temperature exposure are involved in many fields, such as the disposal of nuclear wastes, underground coal gasification, and the exploitation and utilization of geothermal resources [1,2,3,4]. In the case of nuclear wastes disposal, the rock mass is subjected to a high-temperature environment and is affected by the temperature gradient. Numerous studies have demonstrated that both the physical and mechanical properties of rocks are affected by temperature exposure [5,6,7]. With an increase in temperature from 25 °C to 900 °C, the average mass loss rate of sandstone increases from 0 to 2.97% [8]. The thermal destruction can be significantly observed by scanning electron microscope (SEM) [8]. Yong et al. [9] quantify thermal cracking in granite as a function of thermal stresses. Additionally, researchers investigate thermal cracking in granite, which is monitored or quantified in different ways [10,11,12]. In the range of temperature exposure from 25 °C to 850 °C, the density and P-wave velocity of granite show decreases of 4.92% and 79.17%, respectively [13]. The tensile strength decreases from 12.8 MPa to 1.37 MPa at different rates [13]. The mechanical properties, including the peak strength and the elastic modulus of marble fluctuate when the temperature is lower than 400 °C, and gradually decrease when the temperature is greater than 400 °C [14].
Thermal damages result in changes in micro-characteristics, such as porosity, pore throat geometry, and the pore connectivity of rocks, which would directly affect the corresponding permeability [15]. Zoback et al. [16] investigate the influence of micro-fracturing on permeability generally. The permeability of sandstone after high-temperature exposure slowly decreases when the temperature is below 400 °C, and increases rapidly as the temperature increases from 400 °C to 600 °C [17]. The initial permeability of granite shows small changes when the temperature is below 300 °C, which is a slight increase from 300 °C to 500 °C, but a significant increase when the temperature exceeds 500 °C [18]. Although many studies have been reported, the effects of temperature and the confining pressure on the permeability have not been fully understood.
The purpose of this paper is to investigate the permeability of granites after high-temperature exposure. First, cylindrical granite samples were prepared and exposed to various temperature levels (200, 300, 400, 500, 600, and 800 °C). Next, a series of hydro-mechanical tests with respect to different inlet hydraulic pressures and increasing confining pressures from 10 MPa to 30 MPa were conducted. The equivalent permeability of granites as a function of temperature and confining pressure was analysed.

2. Experimental Methodology

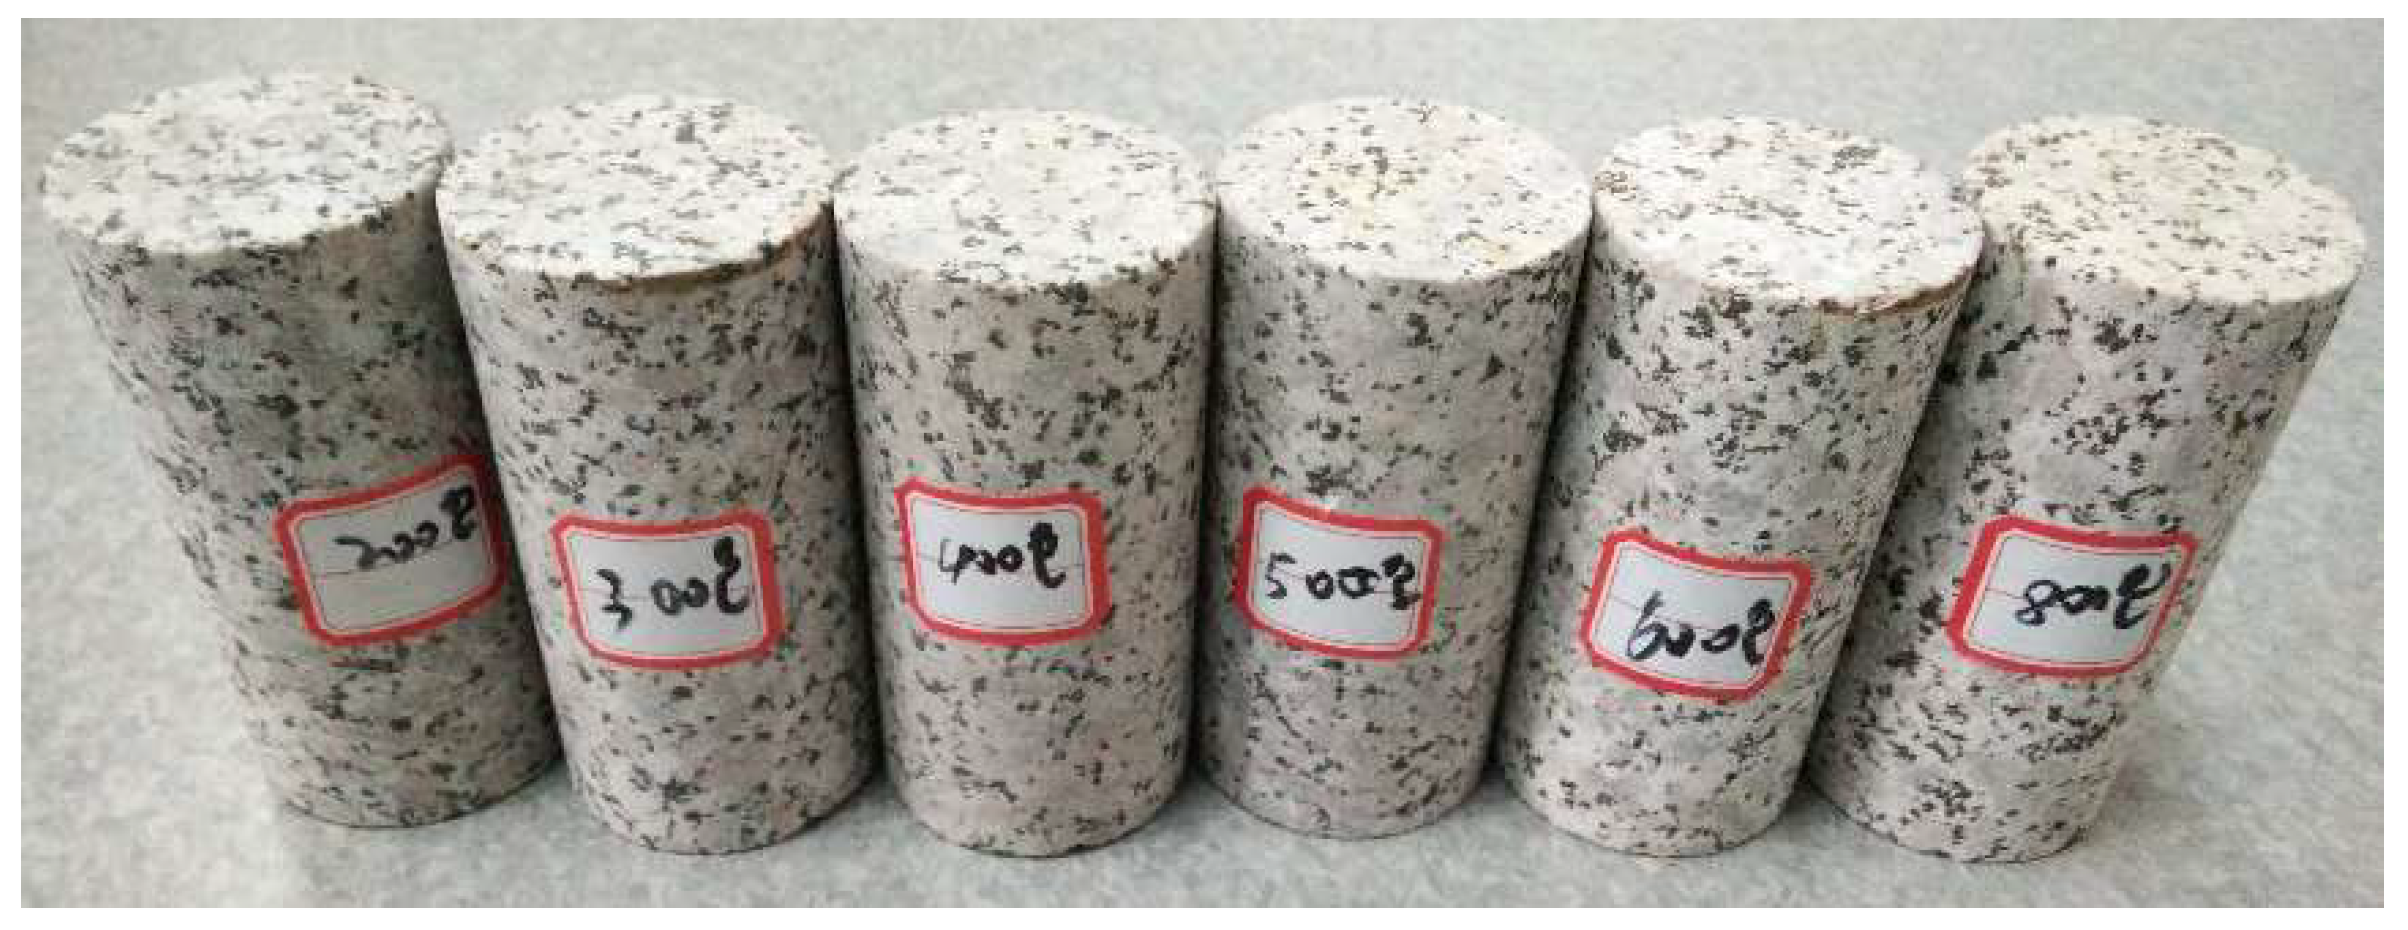
2.1. Sample Preparation

The coarse granites for the experiment were taken from a single rock block in Rizhao, Shandong, China. The granites are fine-grained and composed mainly of quartz, feldspar, and calcite, containing abundant large phenocrysts and having an average density of approximately 2.68 g/cm3. In addition, the granite materials have no surface texture that is visible to the naked eye, and are gray in color in the natural state. This kind of granite has an initial uniaxial compressive strength of approximately 104.00 MPa. The cohesive force and the internal friction angle are 19.57 MPa and 49.17°, respectively. Based on the ISRM (International Society for Rock Mechanics) standard [19], a series of cylindrical samples with lengths of 100 mm and diameters of 50 mm were machined. Both ends of the samples were polished to achieve smooth surfaces for tests.
Then, by using a high-temperature furnace, the granite samples were exposed to high temperatures (200, 300, 400, 500, 600, and 800 °C). The heating rate was 10 °C/min until the set temperature level, and this temperature was maintained for 2 h to ensure that the samples heated evenly. When considering the heating rate of 10 °C/min, we assume that the heat travels fast in solids [20]. Finally, the samples were naturally cooled to room temperature. The samples after high-temperature exposure are shown in Figure 1.

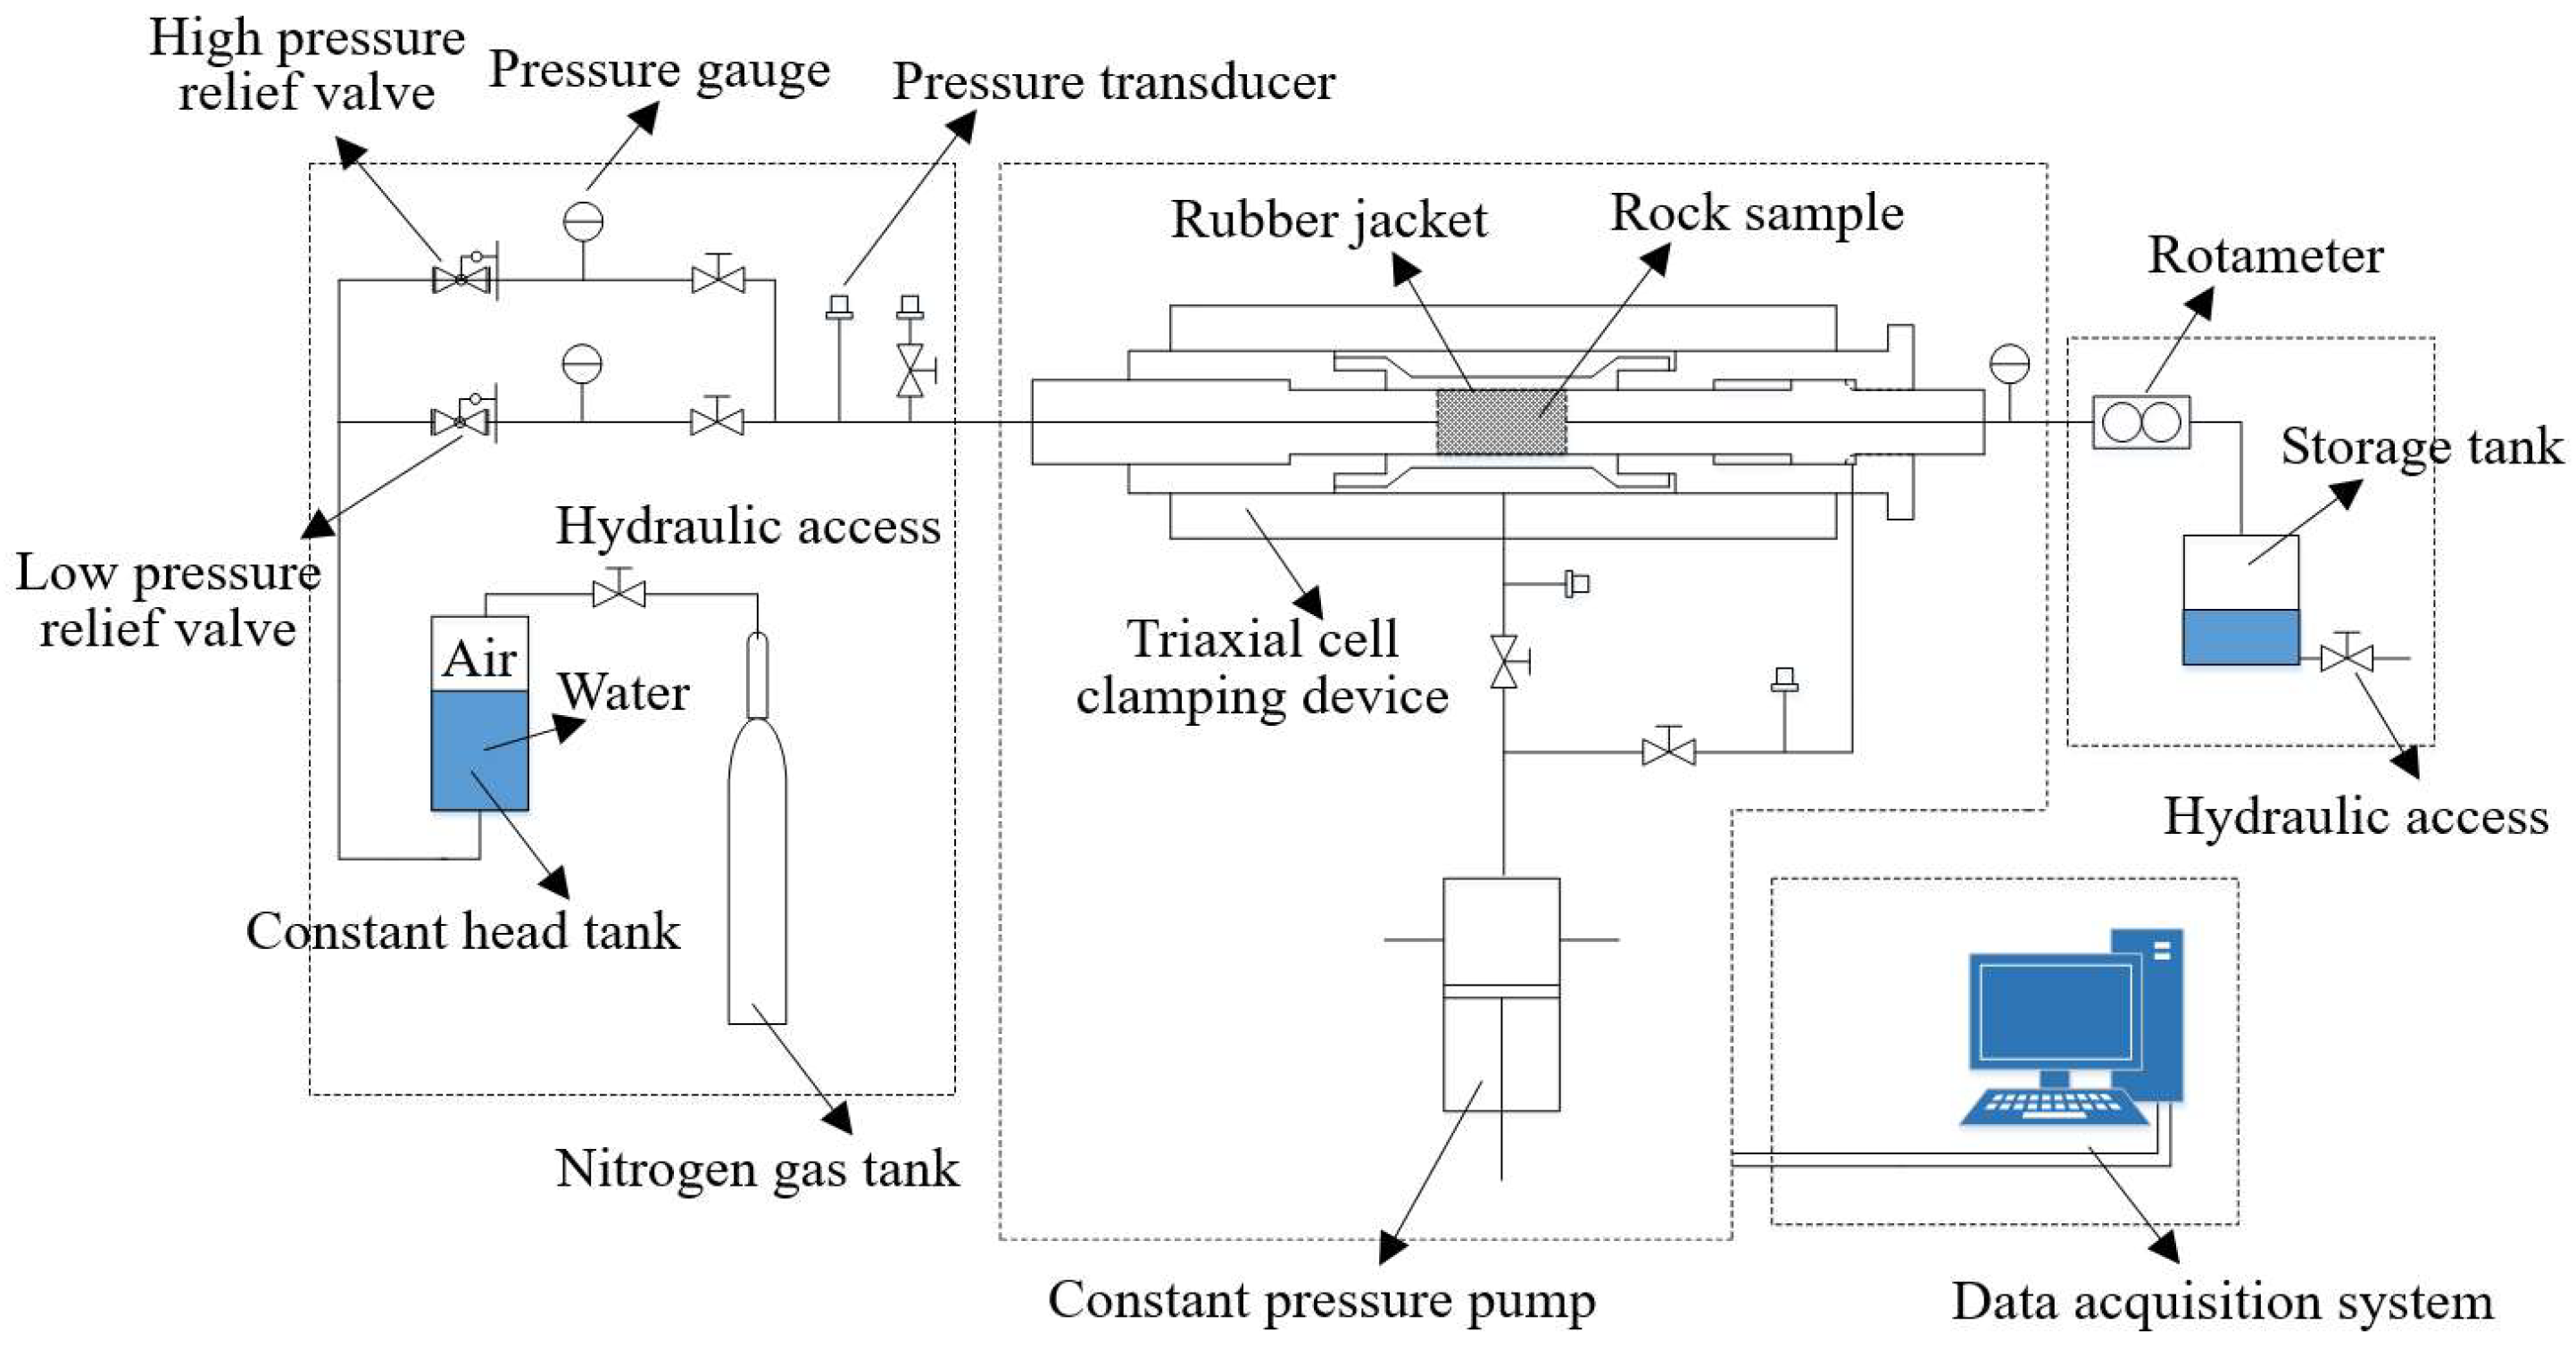
2.2. Fluid Flow Test Procedure

The granite samples after high-temperature exposure were used to conduct fluid flow tests at room temperature using the LDY-50 permeability testing system (Haian county petroleum research instrument co. LTD, Nantong, China) (Figure 2). The maximum confining pressure of the system is 50 MPa. The system consists mainly of the following four units: (1) a water supplying system; (2) a triaxial cell clamping device; (3) a speed constant pressure pump; and, (4) a water measurement and collection system. Before testing, the samples were enclosed by a 3-mm-thick rubber jacket. Then, the samples were inserted into the triaxial cell clamping device with two porous stone platens over the ends to ensure an even distribution of the water pressure. Then, the water was fed using a fluid pump to the left side of the rock sample, flowed to the right side, and finally exited via a stainless steel tube.
During the tests, for a given rock sample, the confining pressure pc was increased from 10 MPa to 30 MPa at 5MPa intervals. For a given pc, a wide range of inlet hydraulic pressures Pi lower than the designated pc was adopted repeatedly. The hydraulic difference Ps was defined as the difference between the inlet hydraulic pressure Pi and the outlet hydraulic pressure Po on the other end of the sample. In the experiment, Ps was continuously recorded using a differential pressure gauge, which had a resolution of 0.01 MPa. When the volume flow rates at the two sides of the samples were equal and stable for approximately ten minutes under a given Ps lower than pc, the samples were considered to be water-saturated, and the fluid flow was considered in a steady state; the equivalent permeability coefficient could then be obtained. By this method, the effects of the confining pressure and high temperatures on granite permeability can be discussed.

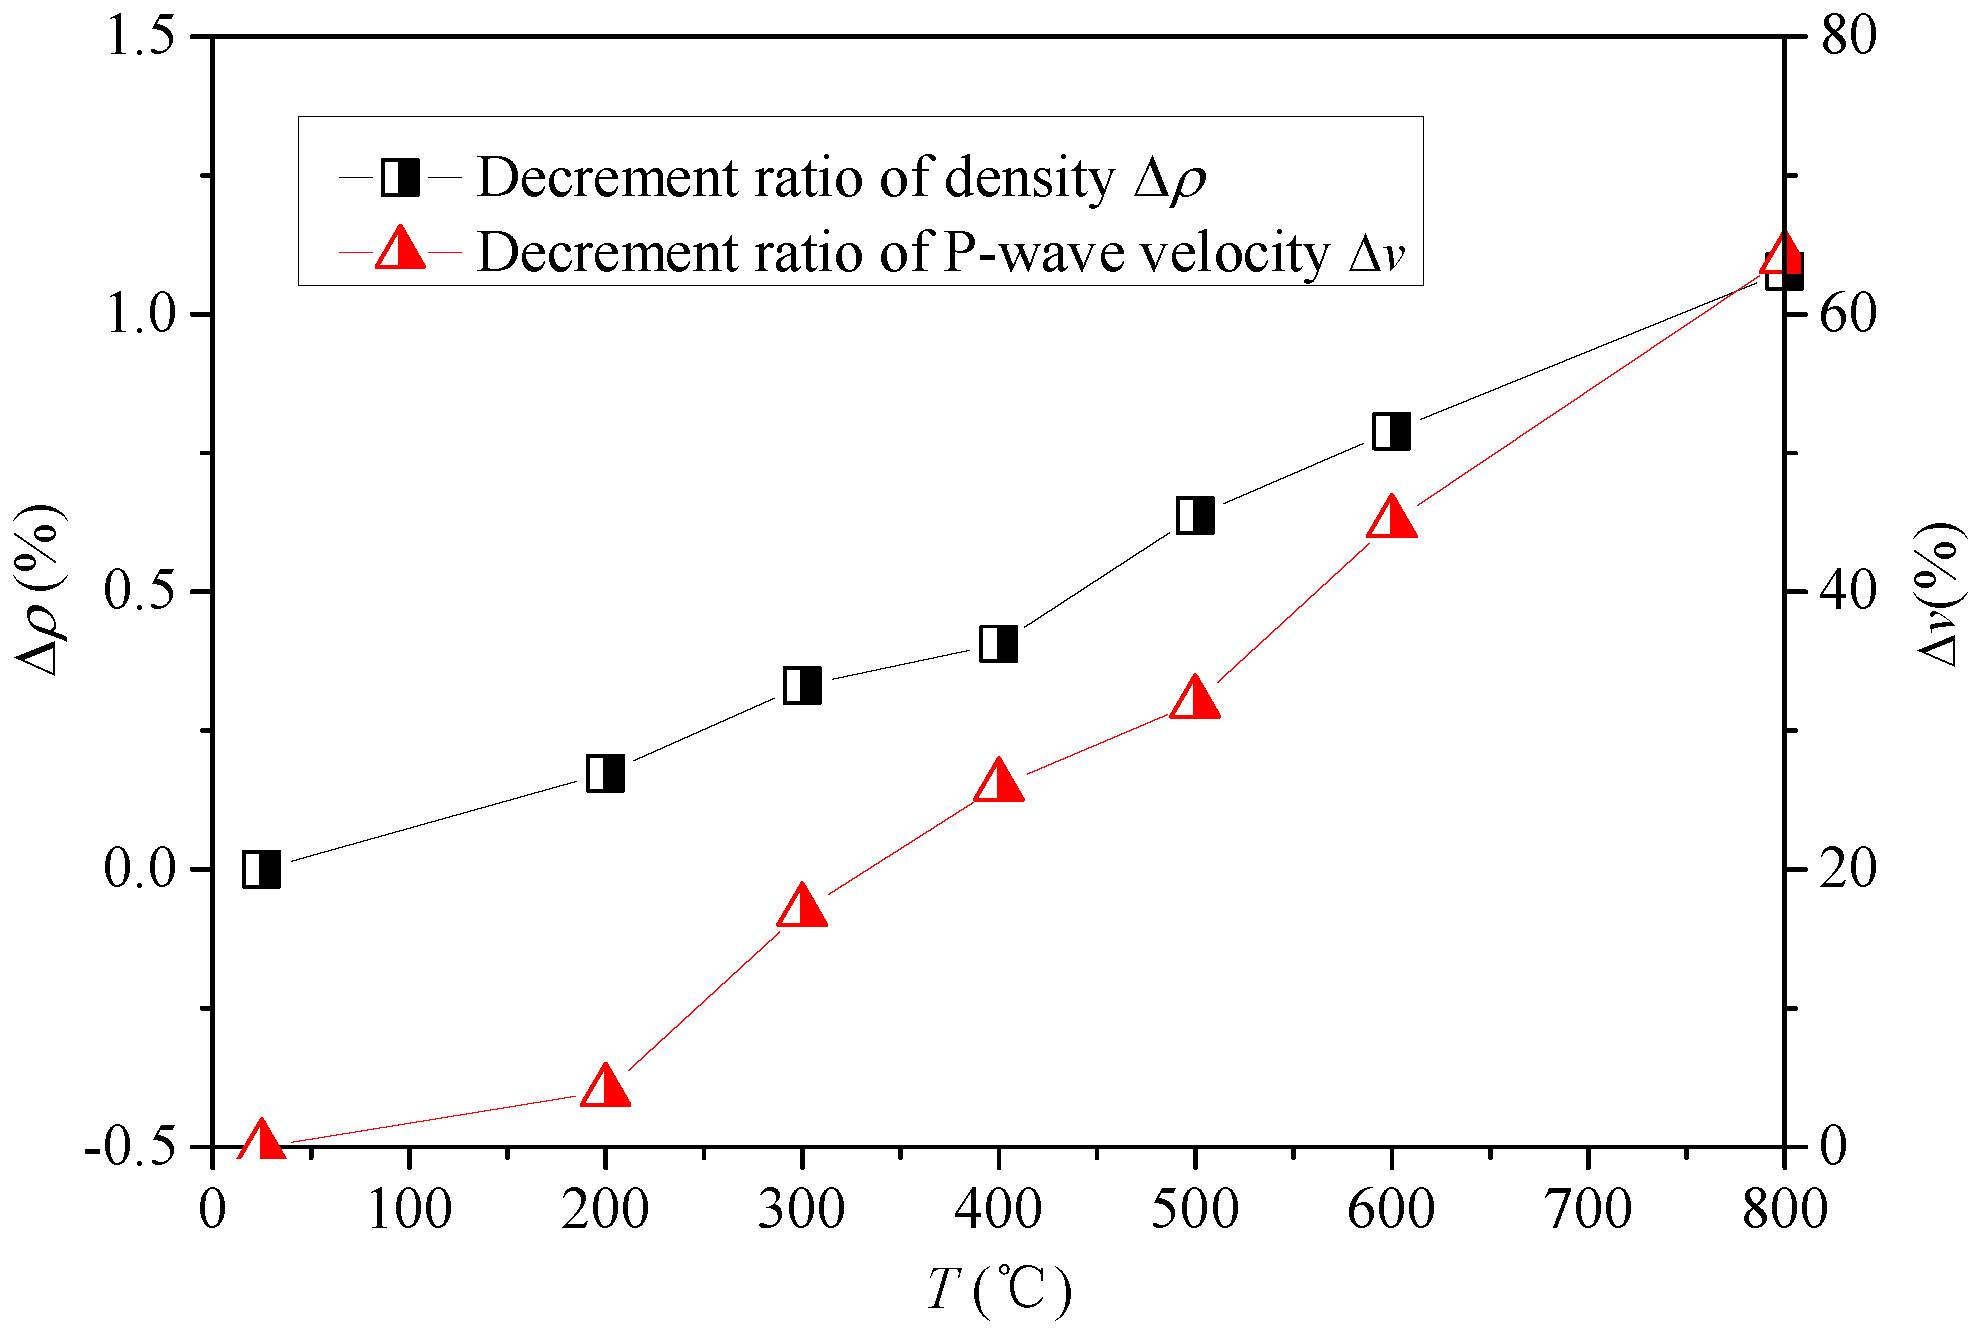
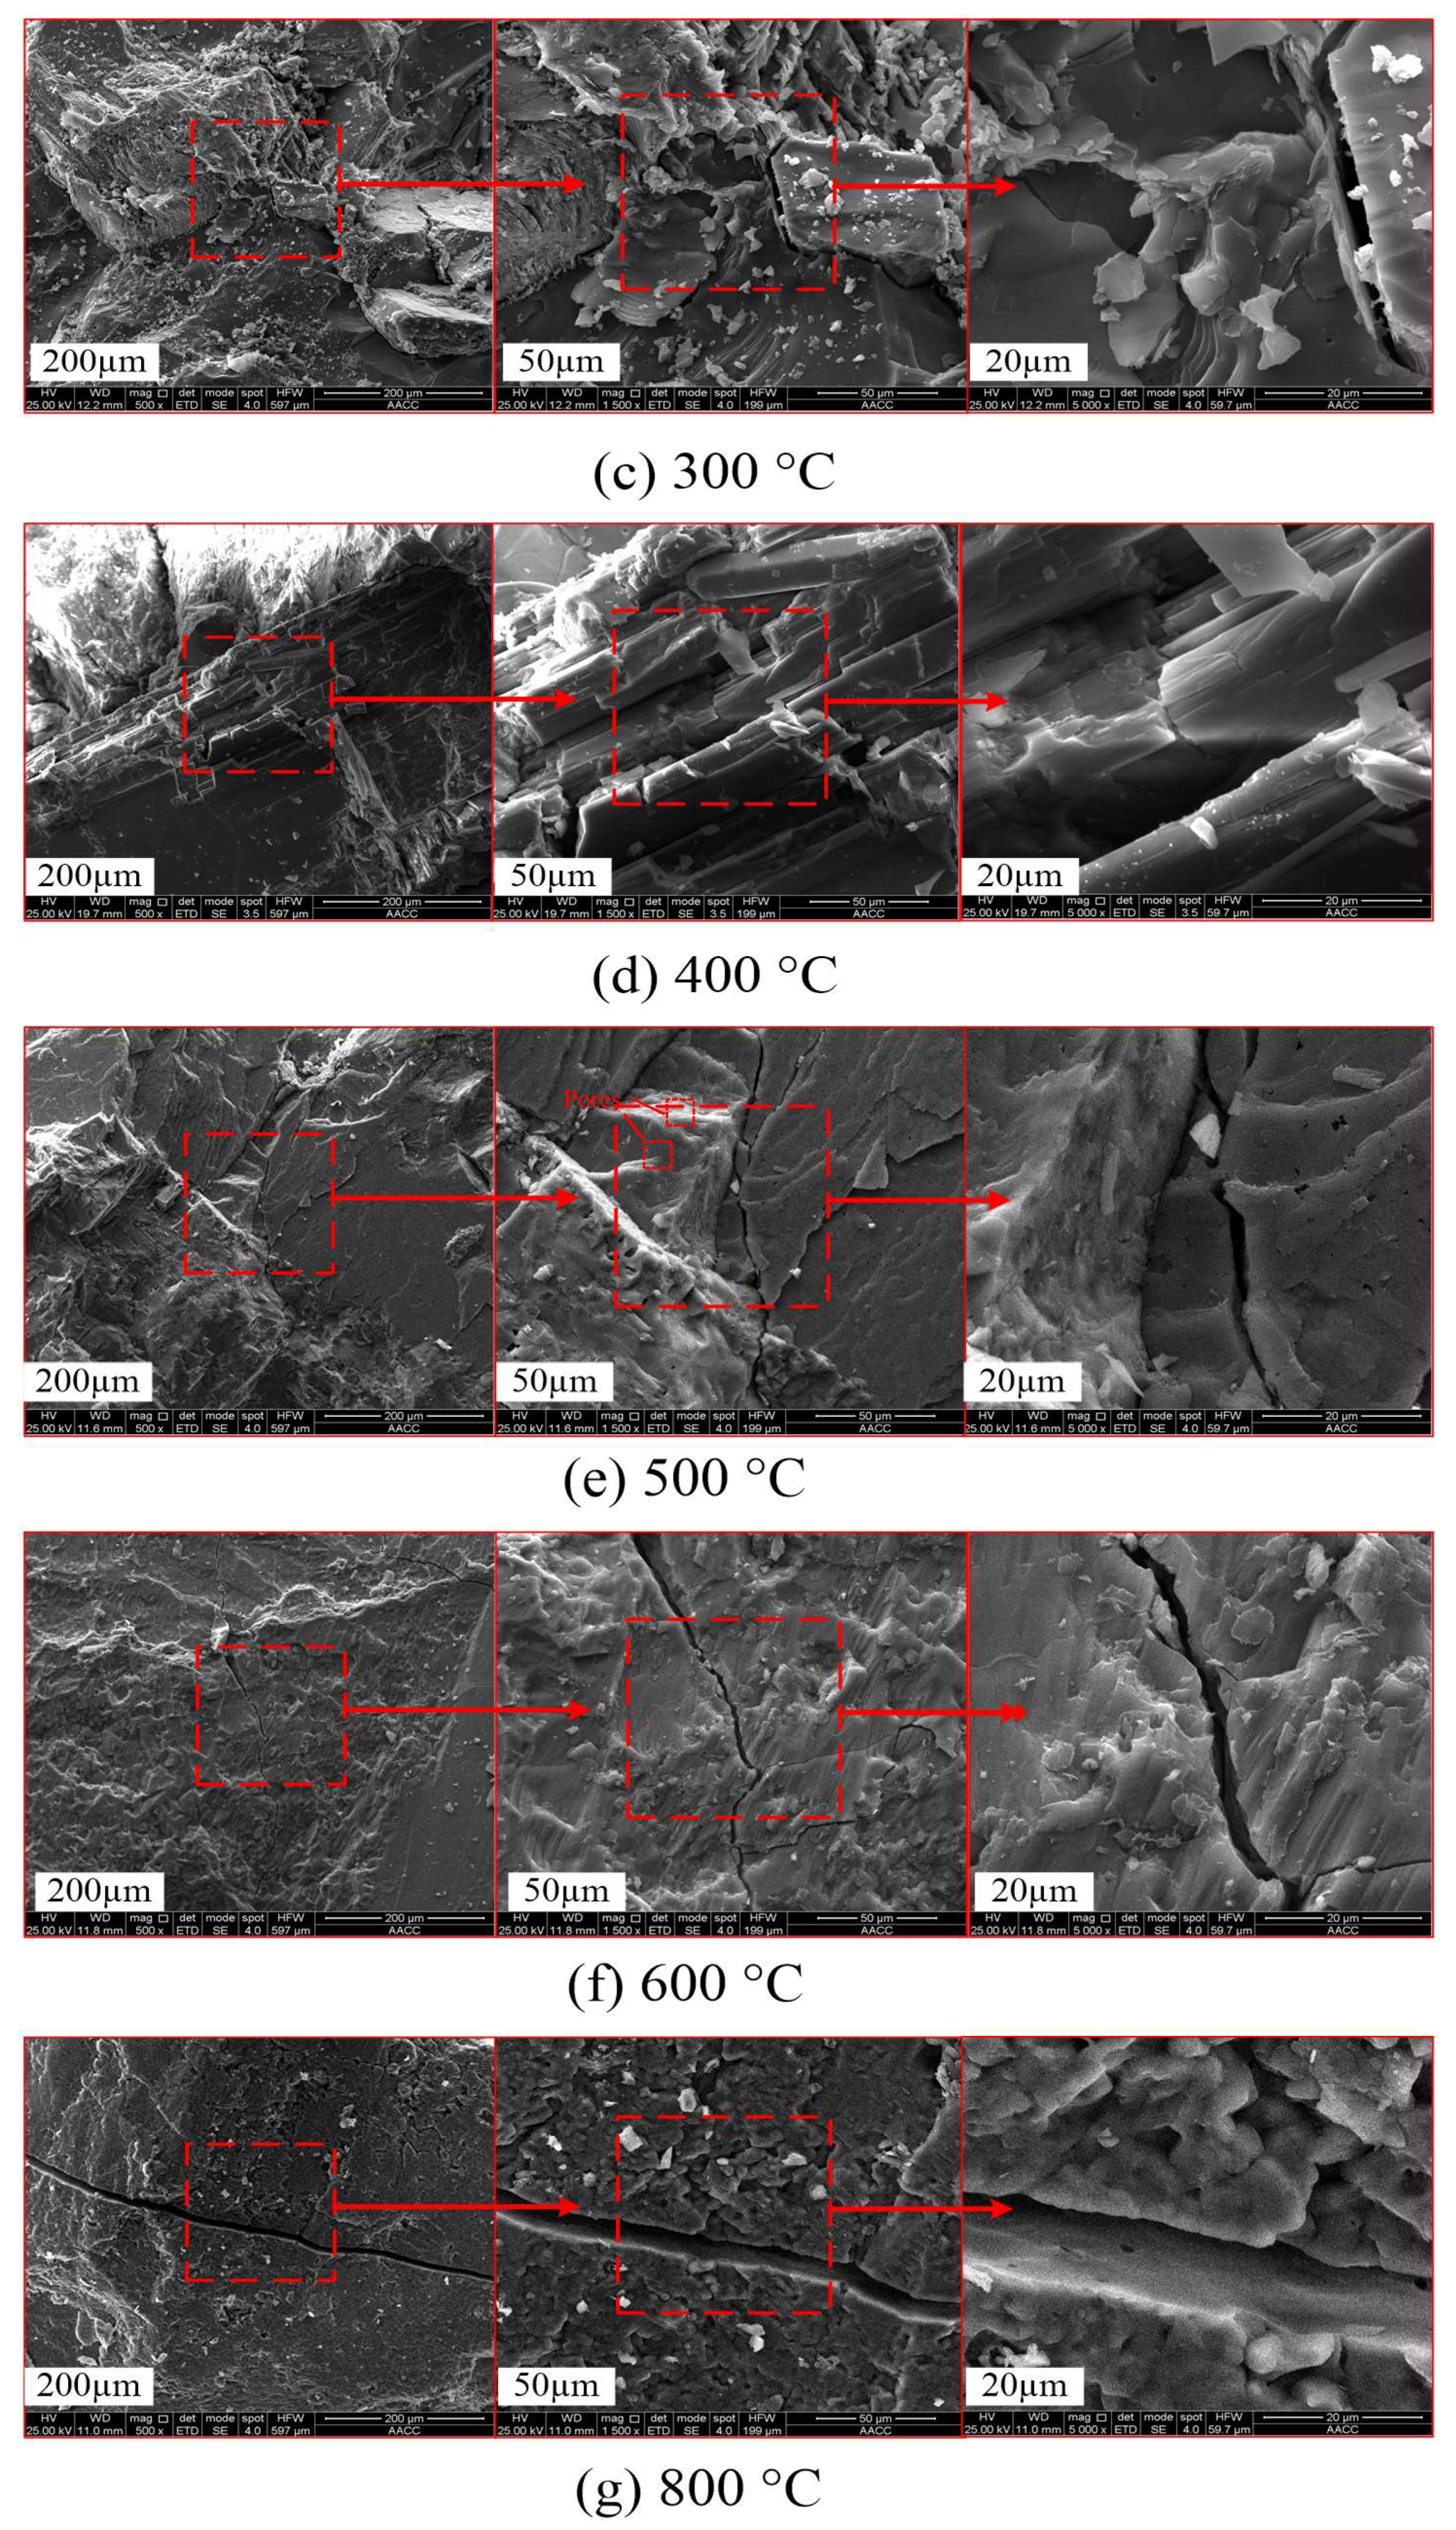
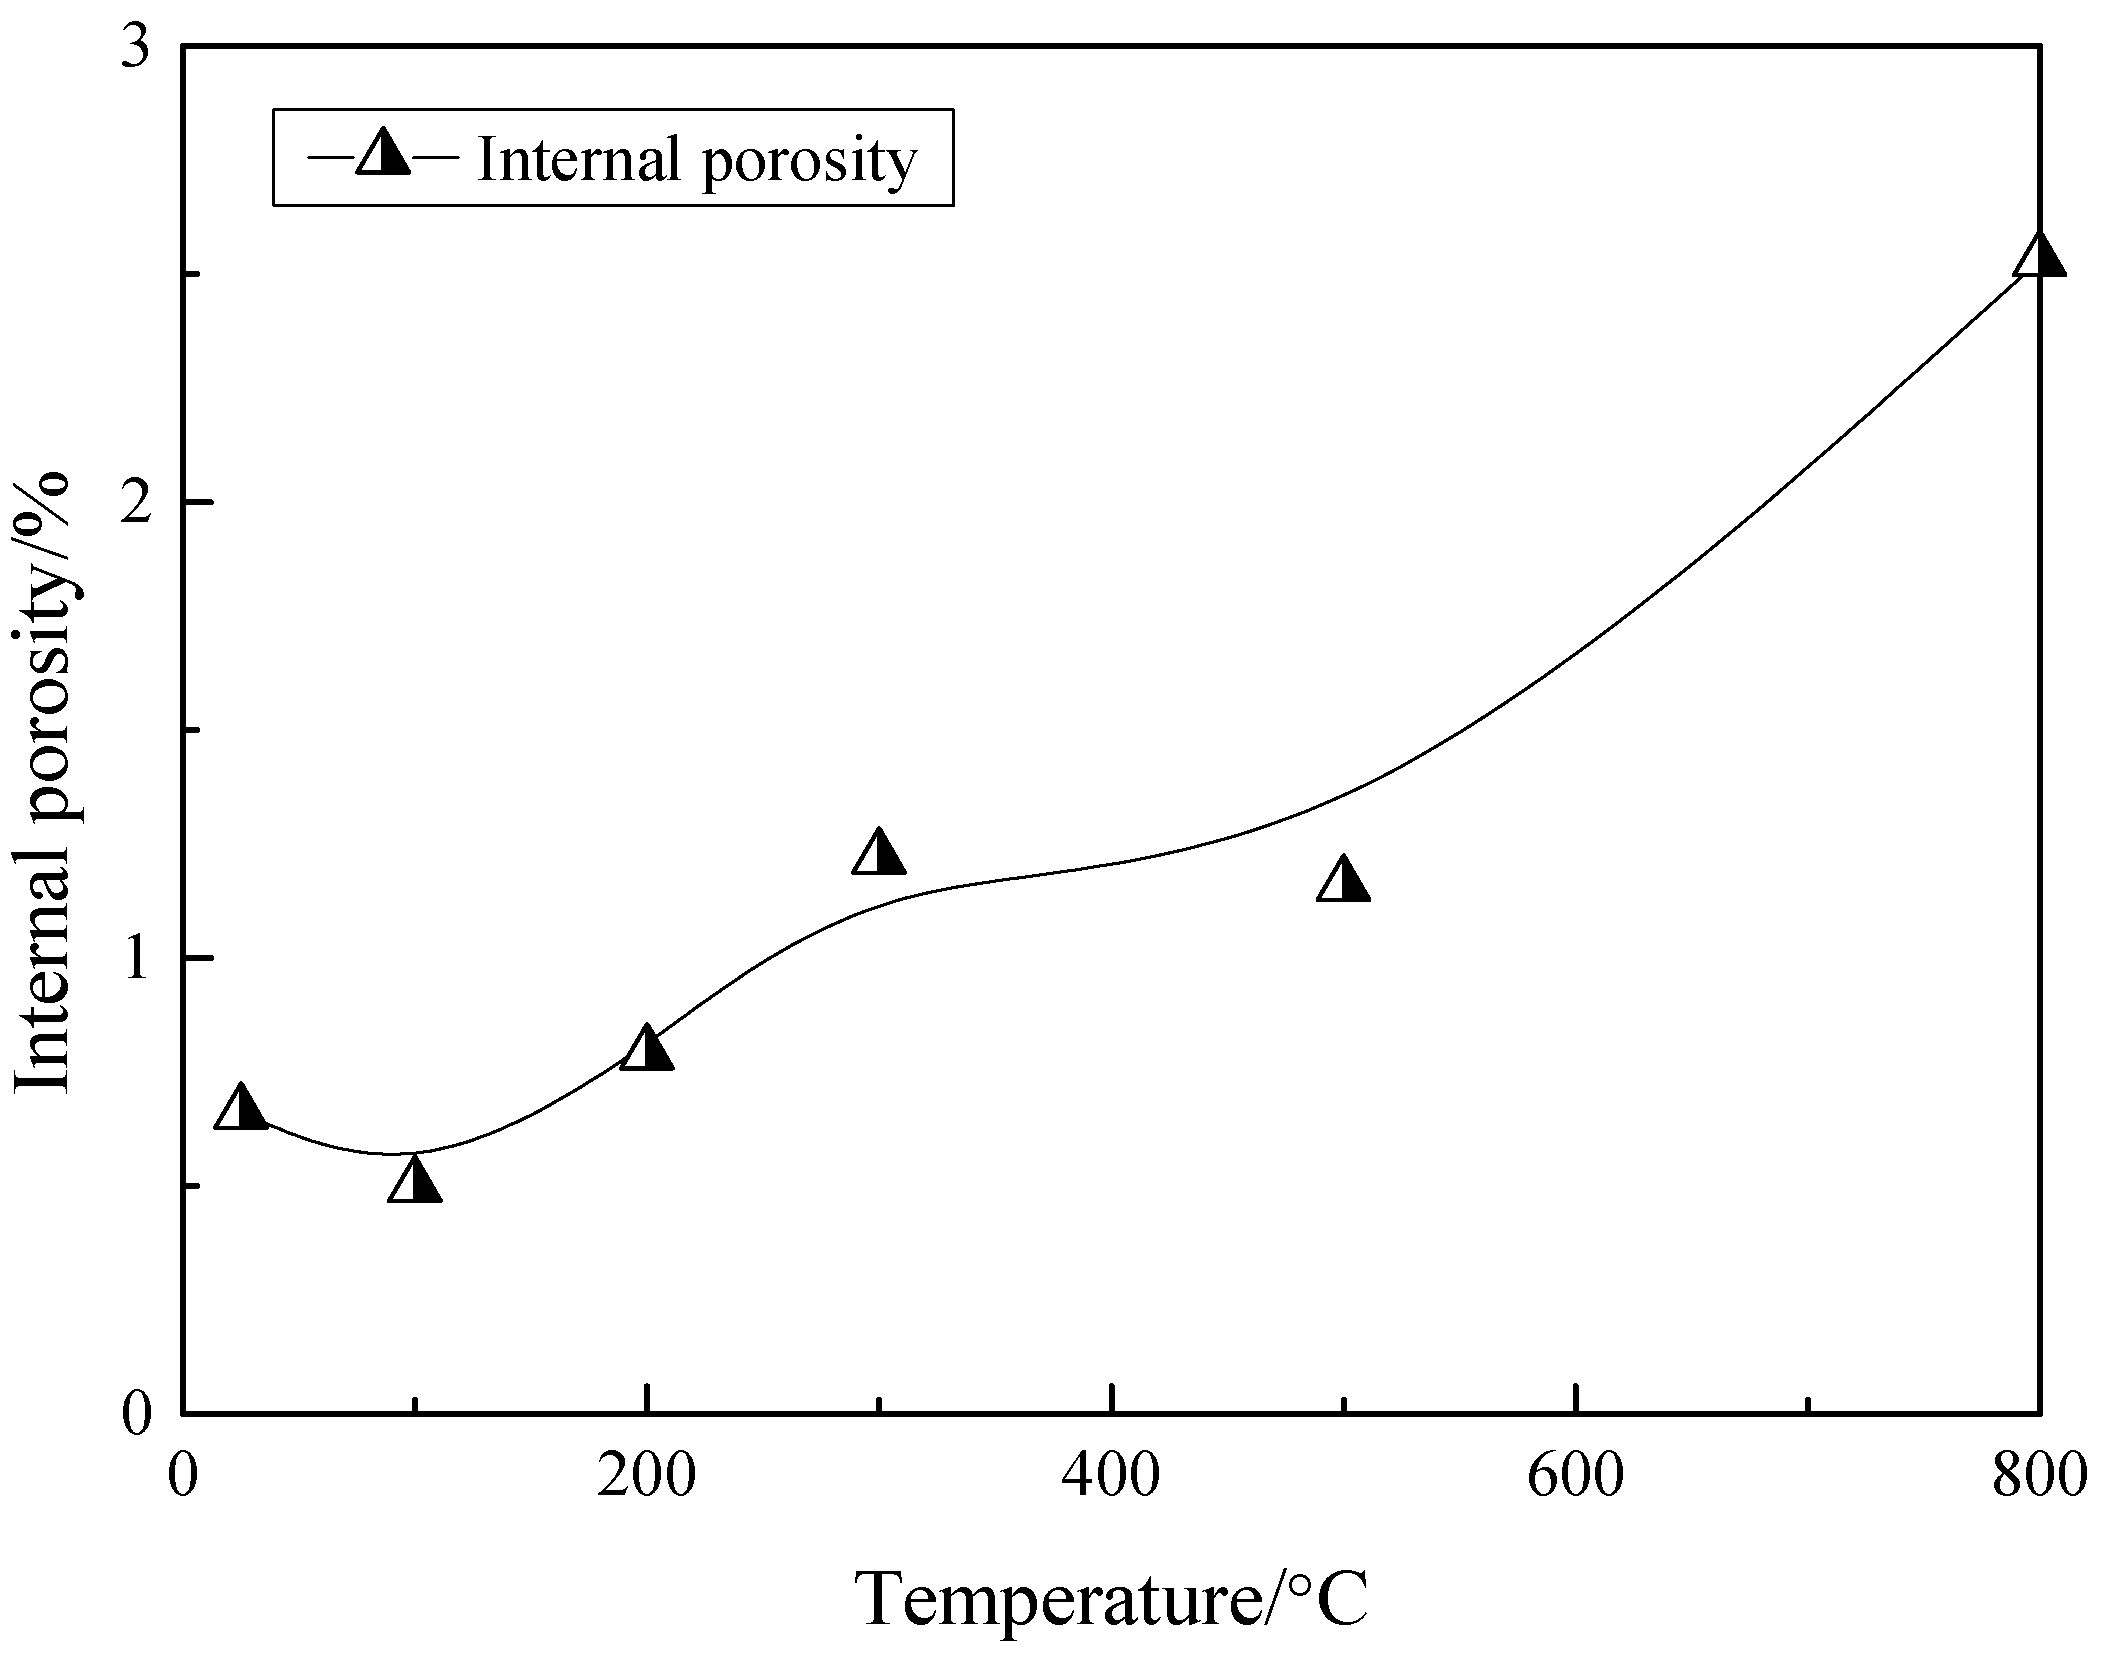
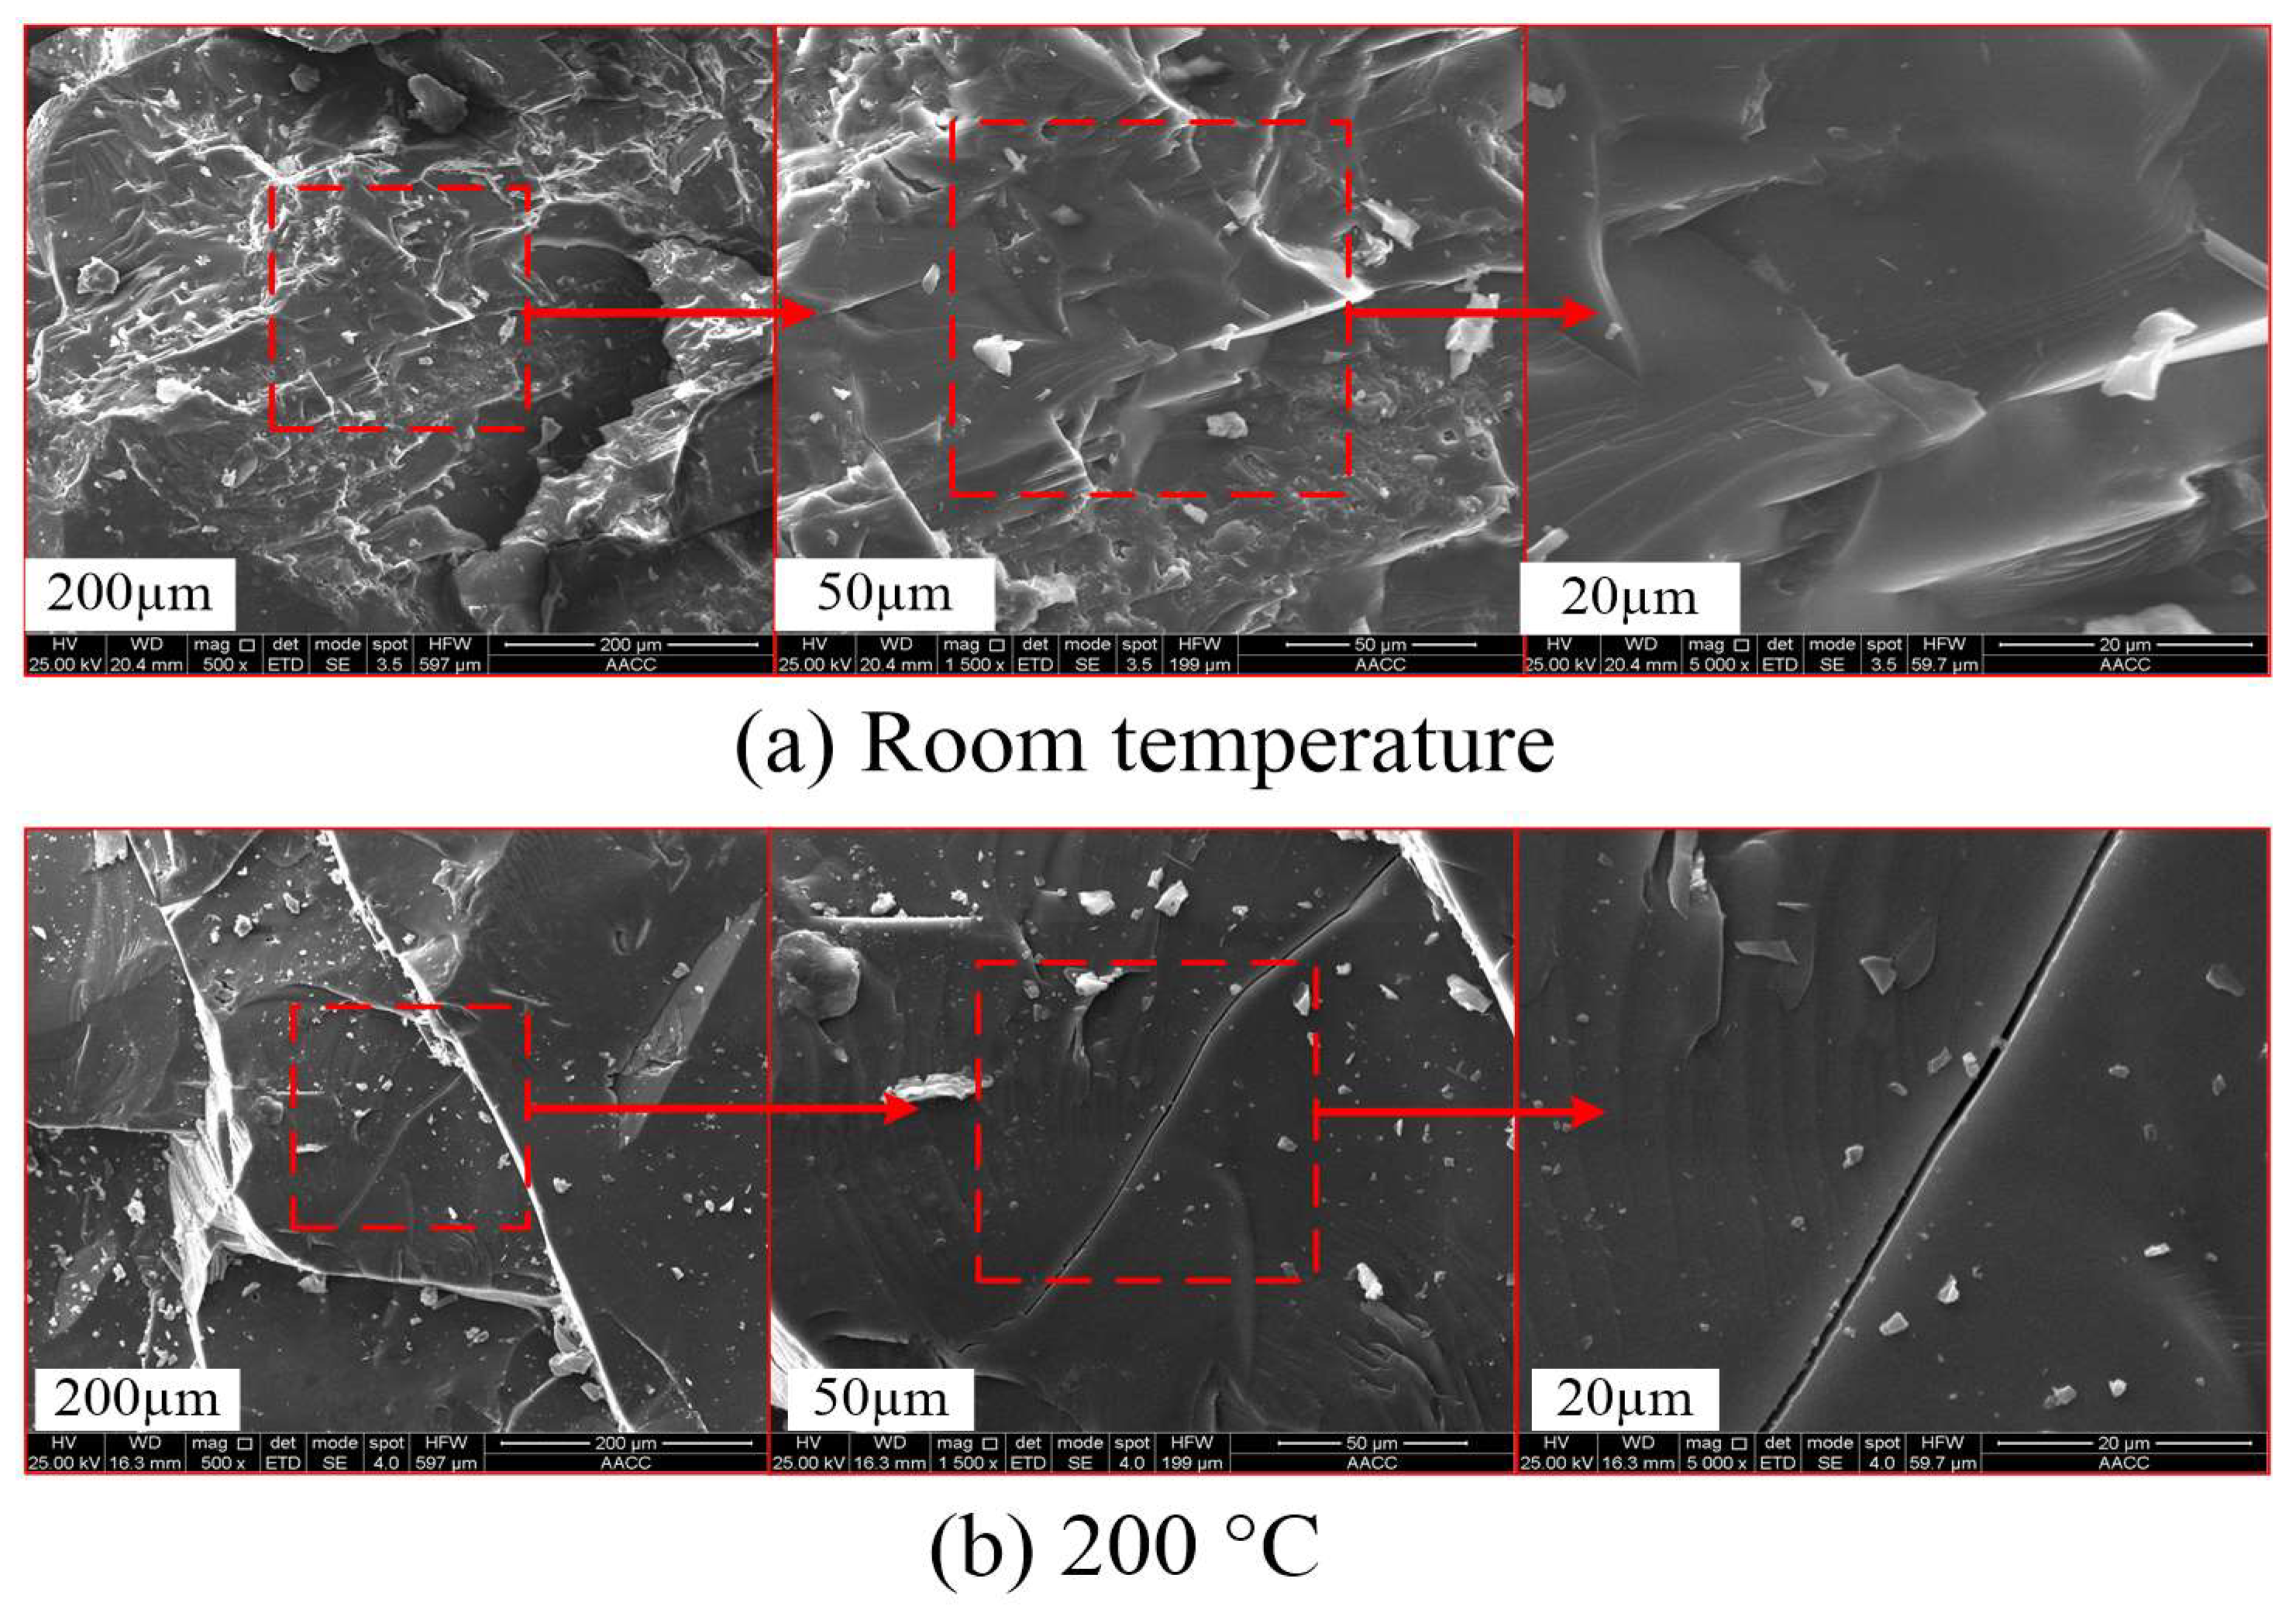
3. Physical Properties of Granites after High-Temperature Exposure

The ultrasonic velocity is an effective index to characterize the overall damage in the thermally-cracked granite [21]. The velocities of the compressional waves in the tested granite samples were measured at room conditions using a PDS-SW sonic detector (Wuhan Geostar Scientific & Technological Co., Ltd., Wuhan City, Hubei Province, China). Physical properties of samples after high-temperature treatment, including P-wave (P-wave is one of the two main types of elastic body waves, called seismic waves in seismology, the first signal from an earthquake to arrive at a seismograph. It may be transmitted through gases, liquids, or solids.) velocity and density, were measured, as listed in Table 1.
Figure 3 presents the variations in density and P-wave velocity for the granite samples after high-temperature exposure, in which Δρ and Δv denote the decrement ratios of the density and P-wave velocity, respectively, and can be calculated, as follows:
Δ ρ = ρ ρ ρ
Δ v = v v v
in which ρ and ρ′ are the densities of rock samples in natural state (25 °C) and after high-temperature exposure, respectively, and v and v′ are the corresponding P-wave velocities.
From Figure 3, in the range of temperature (T) from 200 °C to 800 °C, Δρ increases from 0.17% to 1.08%, and Δv increases from 4.0% to 64.0%. There is a negative correlation between P-wave and temperature. A relatively weak decrease of velocity occurs at a low temperature level. However, it decreases significantly with a continuous increase in the temperature, especially after 500 °C. These results suggest that a great many new, thermally induced cracks were generated during the thermal treatment. These cracks form mainly because, with an increase in the heating temperature, the loss of interlayer water and bound water, as well as a transformation in the mineral composition, occurs in the granites, resulting in the degradation of the density and the P-wave velocity [20,22]. Through mercury injection testing, Zhang [23] studied the development of the internal porosity of granites with in heating temperature and found that the internal porosity shows an increase with a magnitude of 2.83 as T increases from 25 °C to 800 °C (Figure 4). Similar to Figure 3, the internal porosity experienced a slight increase from 100 °C to 500 °C. After that, the figures for porosity grow significantly above 500 °C, with a large increase of thermally induced cracks.
Then, scanning electron microscope (SEM) tests were conducted on the sample granites. Blocks with a size of approximately 8.0 × 8.0 × 5.0 mm3 were cut from the thermally damaged samples. To achieve a better comparison, SEM was also conducted on the samples at room temperature. Magnifications of 500, 1500, and 5000 were selected in the present study. During the scanning electron microscope observation, we first observed the fracture development from different angles in the sample, and then, the representative points were selected for scanning. Figure 5 shows the typical SEM images of the thermally damaged granites. For T = 25 °C, there exist almost no micro-fractures in the granite. In the range of 200–400 °C, the quantity of the micro-cracks inside and across the aggregates increases slightly. However, as T increases from 400 °C to 800 °C, thermally induced cracks were developed along inter-crystalline boundaries and the surrounding crystals. Both of the cracks opening at the boundaries of aggregates and the number of internal pores in the rock increased greatly (Figure 5e). As analysed by Zhang et al. [24], thermally induced cracks are the result of strong bound water loss, dihydroxylation loss of constituent water, and solid mineral expansion in the temperature range of 100–500 °C. Intra-granular cracks in feldspar and quartz crystal appeared successively at temperatures higher than the second threshold, 573 °C [18]. During the heating process, physical properties present significant changes at the temperature of about 573 °C, where the α-β transition occurs. Inner cracks extend quickly and the porosity increases, leading to a reduction of the density and an increase of the conductivity [25]. It is presumed that the increase in the inter-granular thermal stress significantly induced more inter-granular and more trans-granular cracks, for the anisotropic expansion that is linked to the α/β phase transformation of quartz, which is abundant in granite, at 573 °C led to 5% volume growth in quartz [26,27]. Griffiths et al. [28] provided a Python-based open source tool for quantifying micro-cracks in the two-dimensional (2D) micro-crack density of granite samples using a newly developed algorithm and suggested that the continued evolution of physical properties at temperatures of 600 °C and above is due to a widening of the existing micro-cracks rather than their formation or propagation. The existence of these pores and cracks doubtlessly affects the permeability of granites [29]. Therefore, it is of great significance to quantitatively evaluate the permeability characteristics of granites after high-temperature exposure.

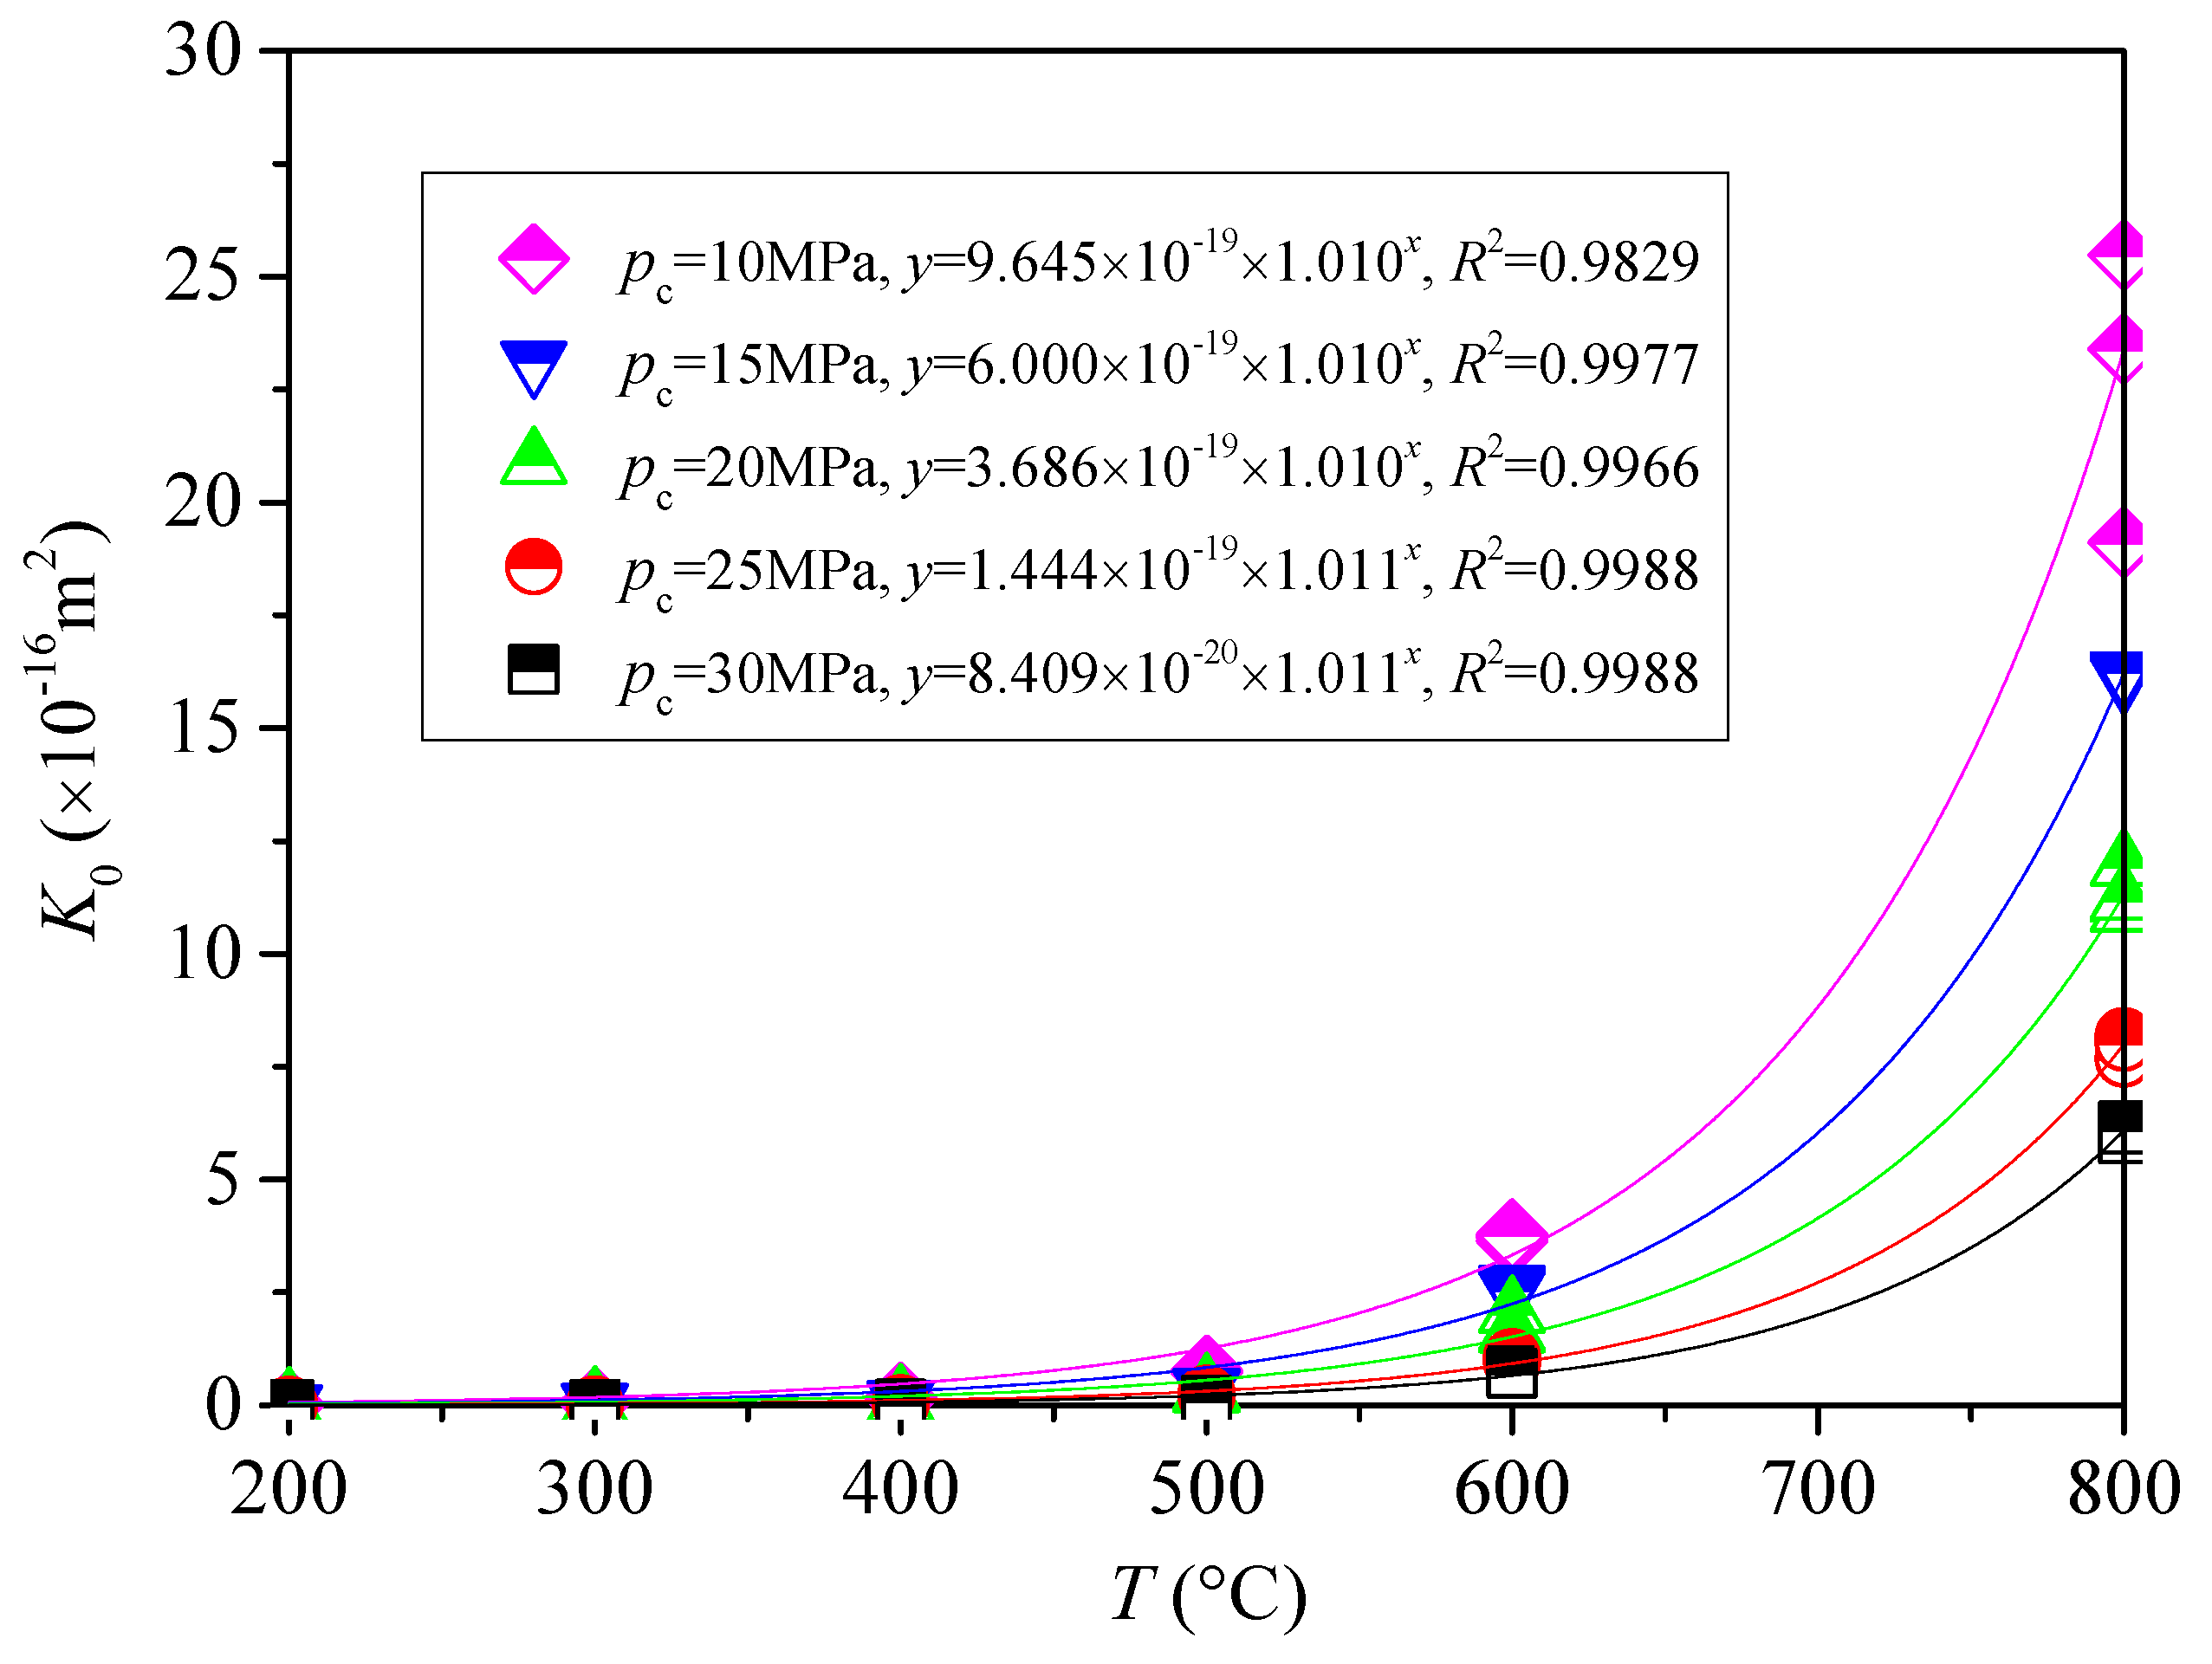
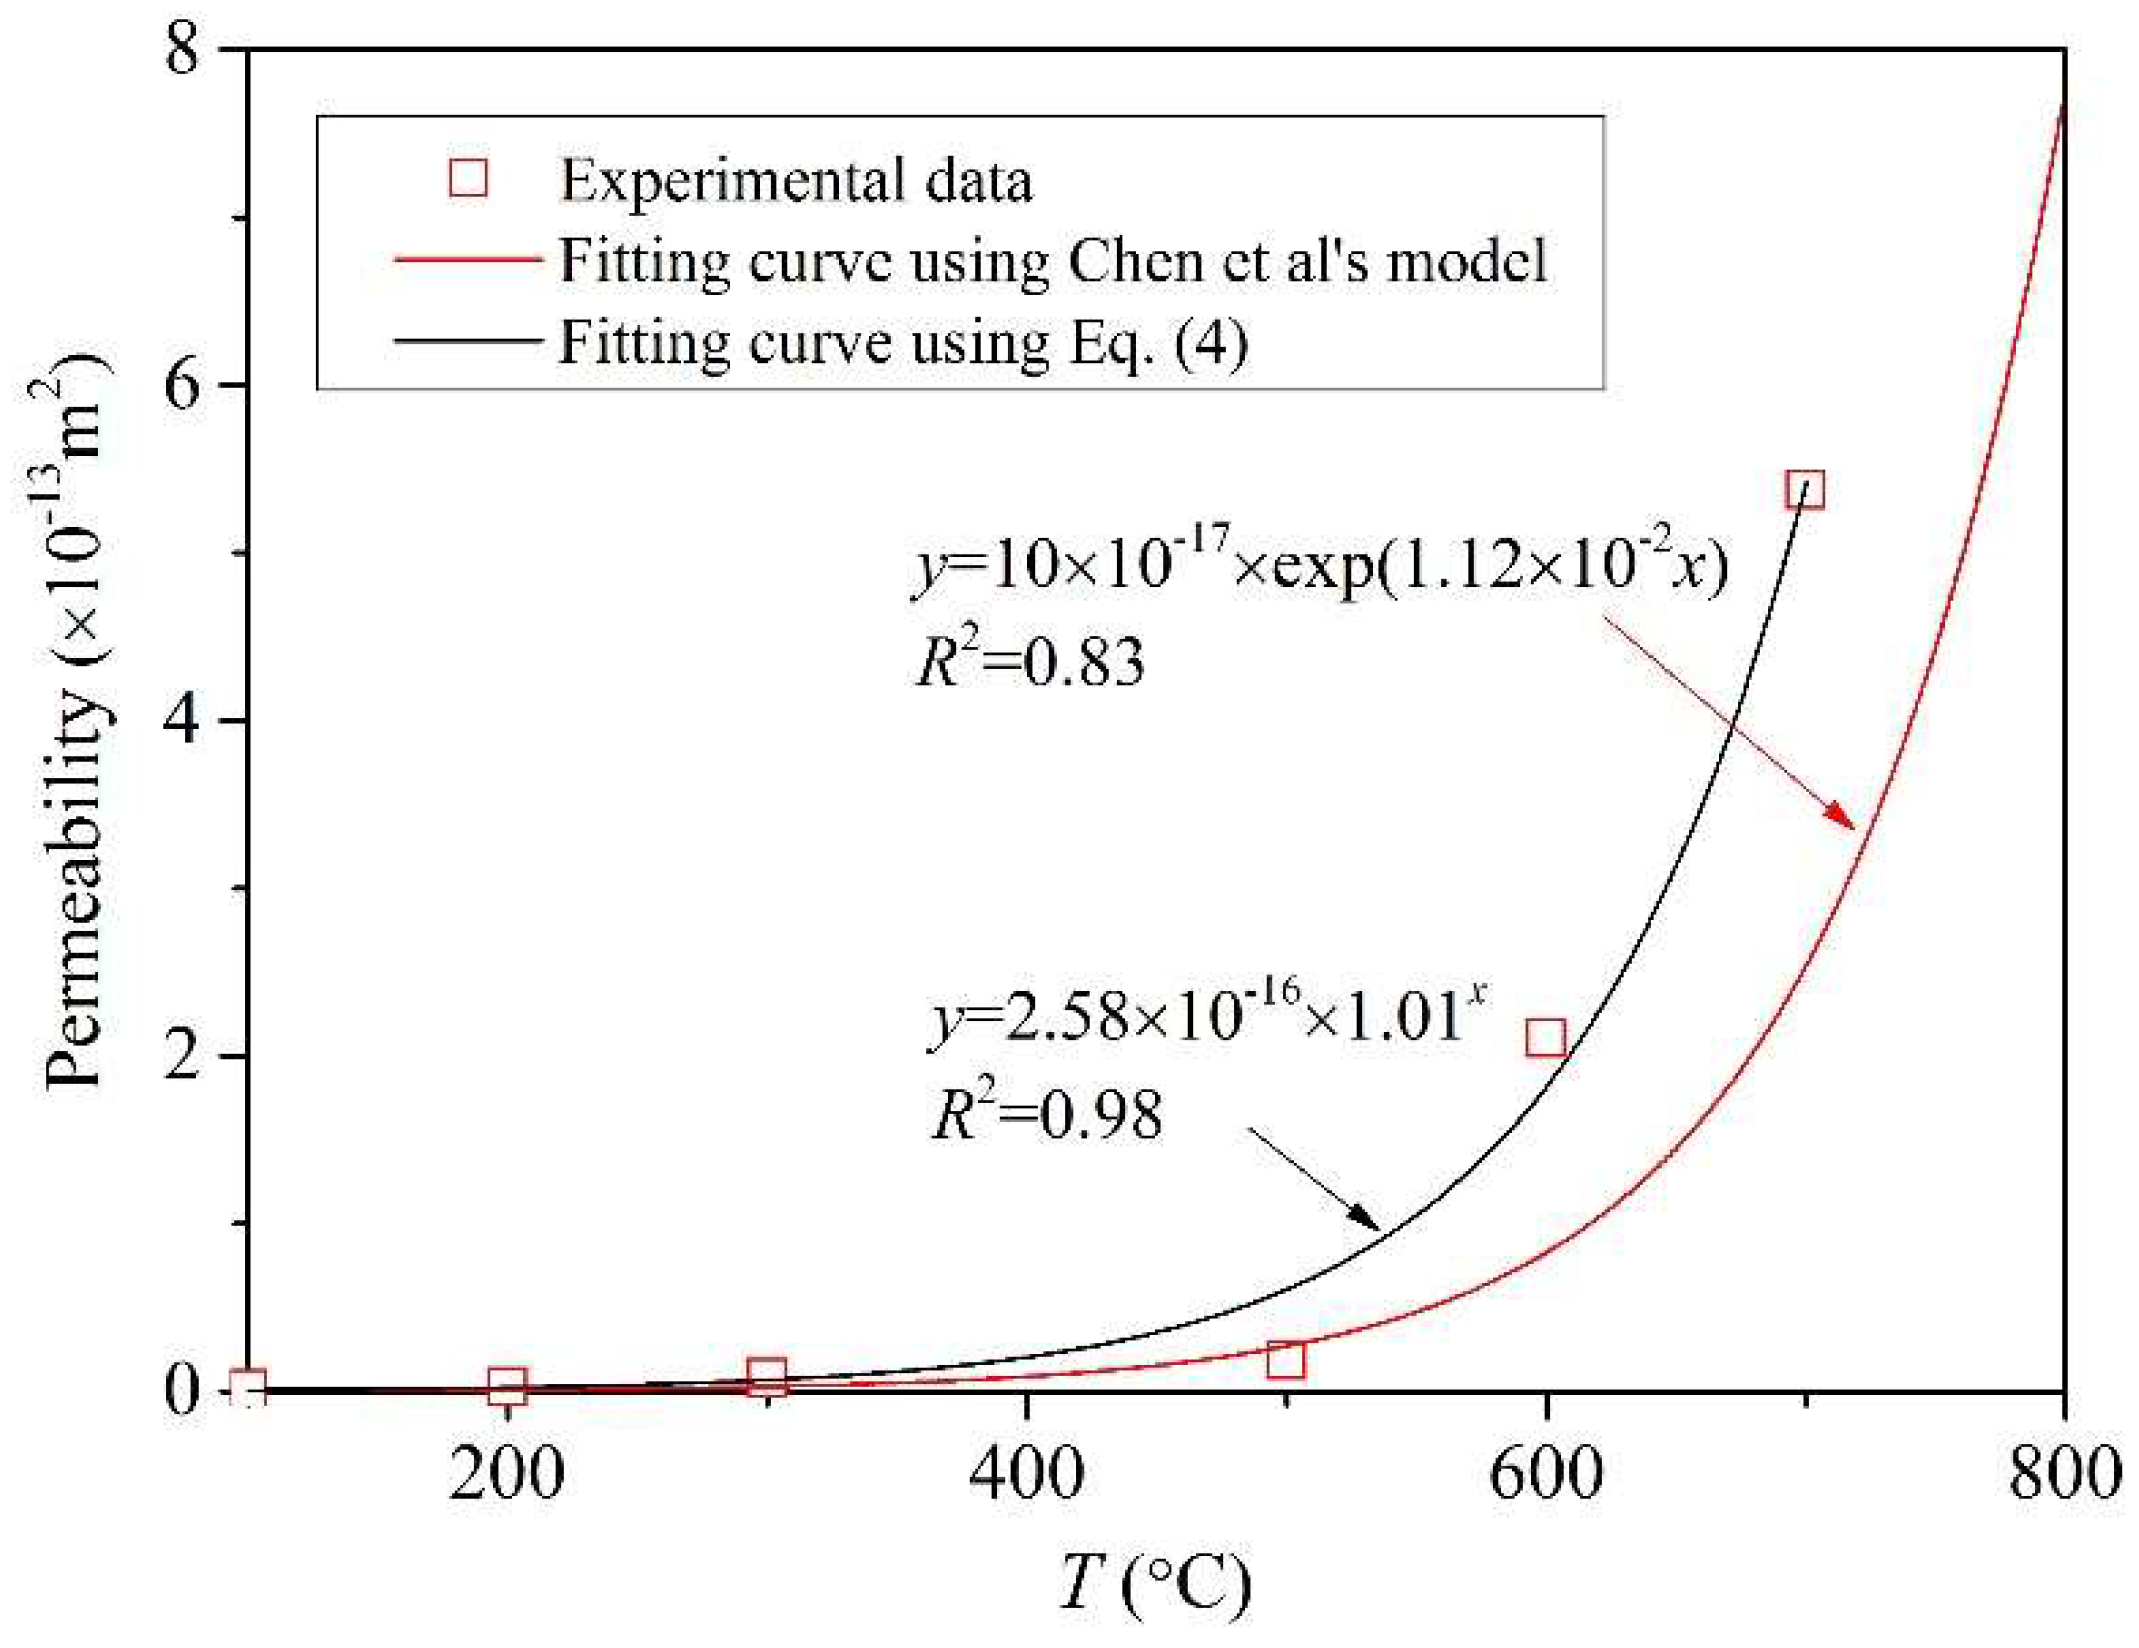
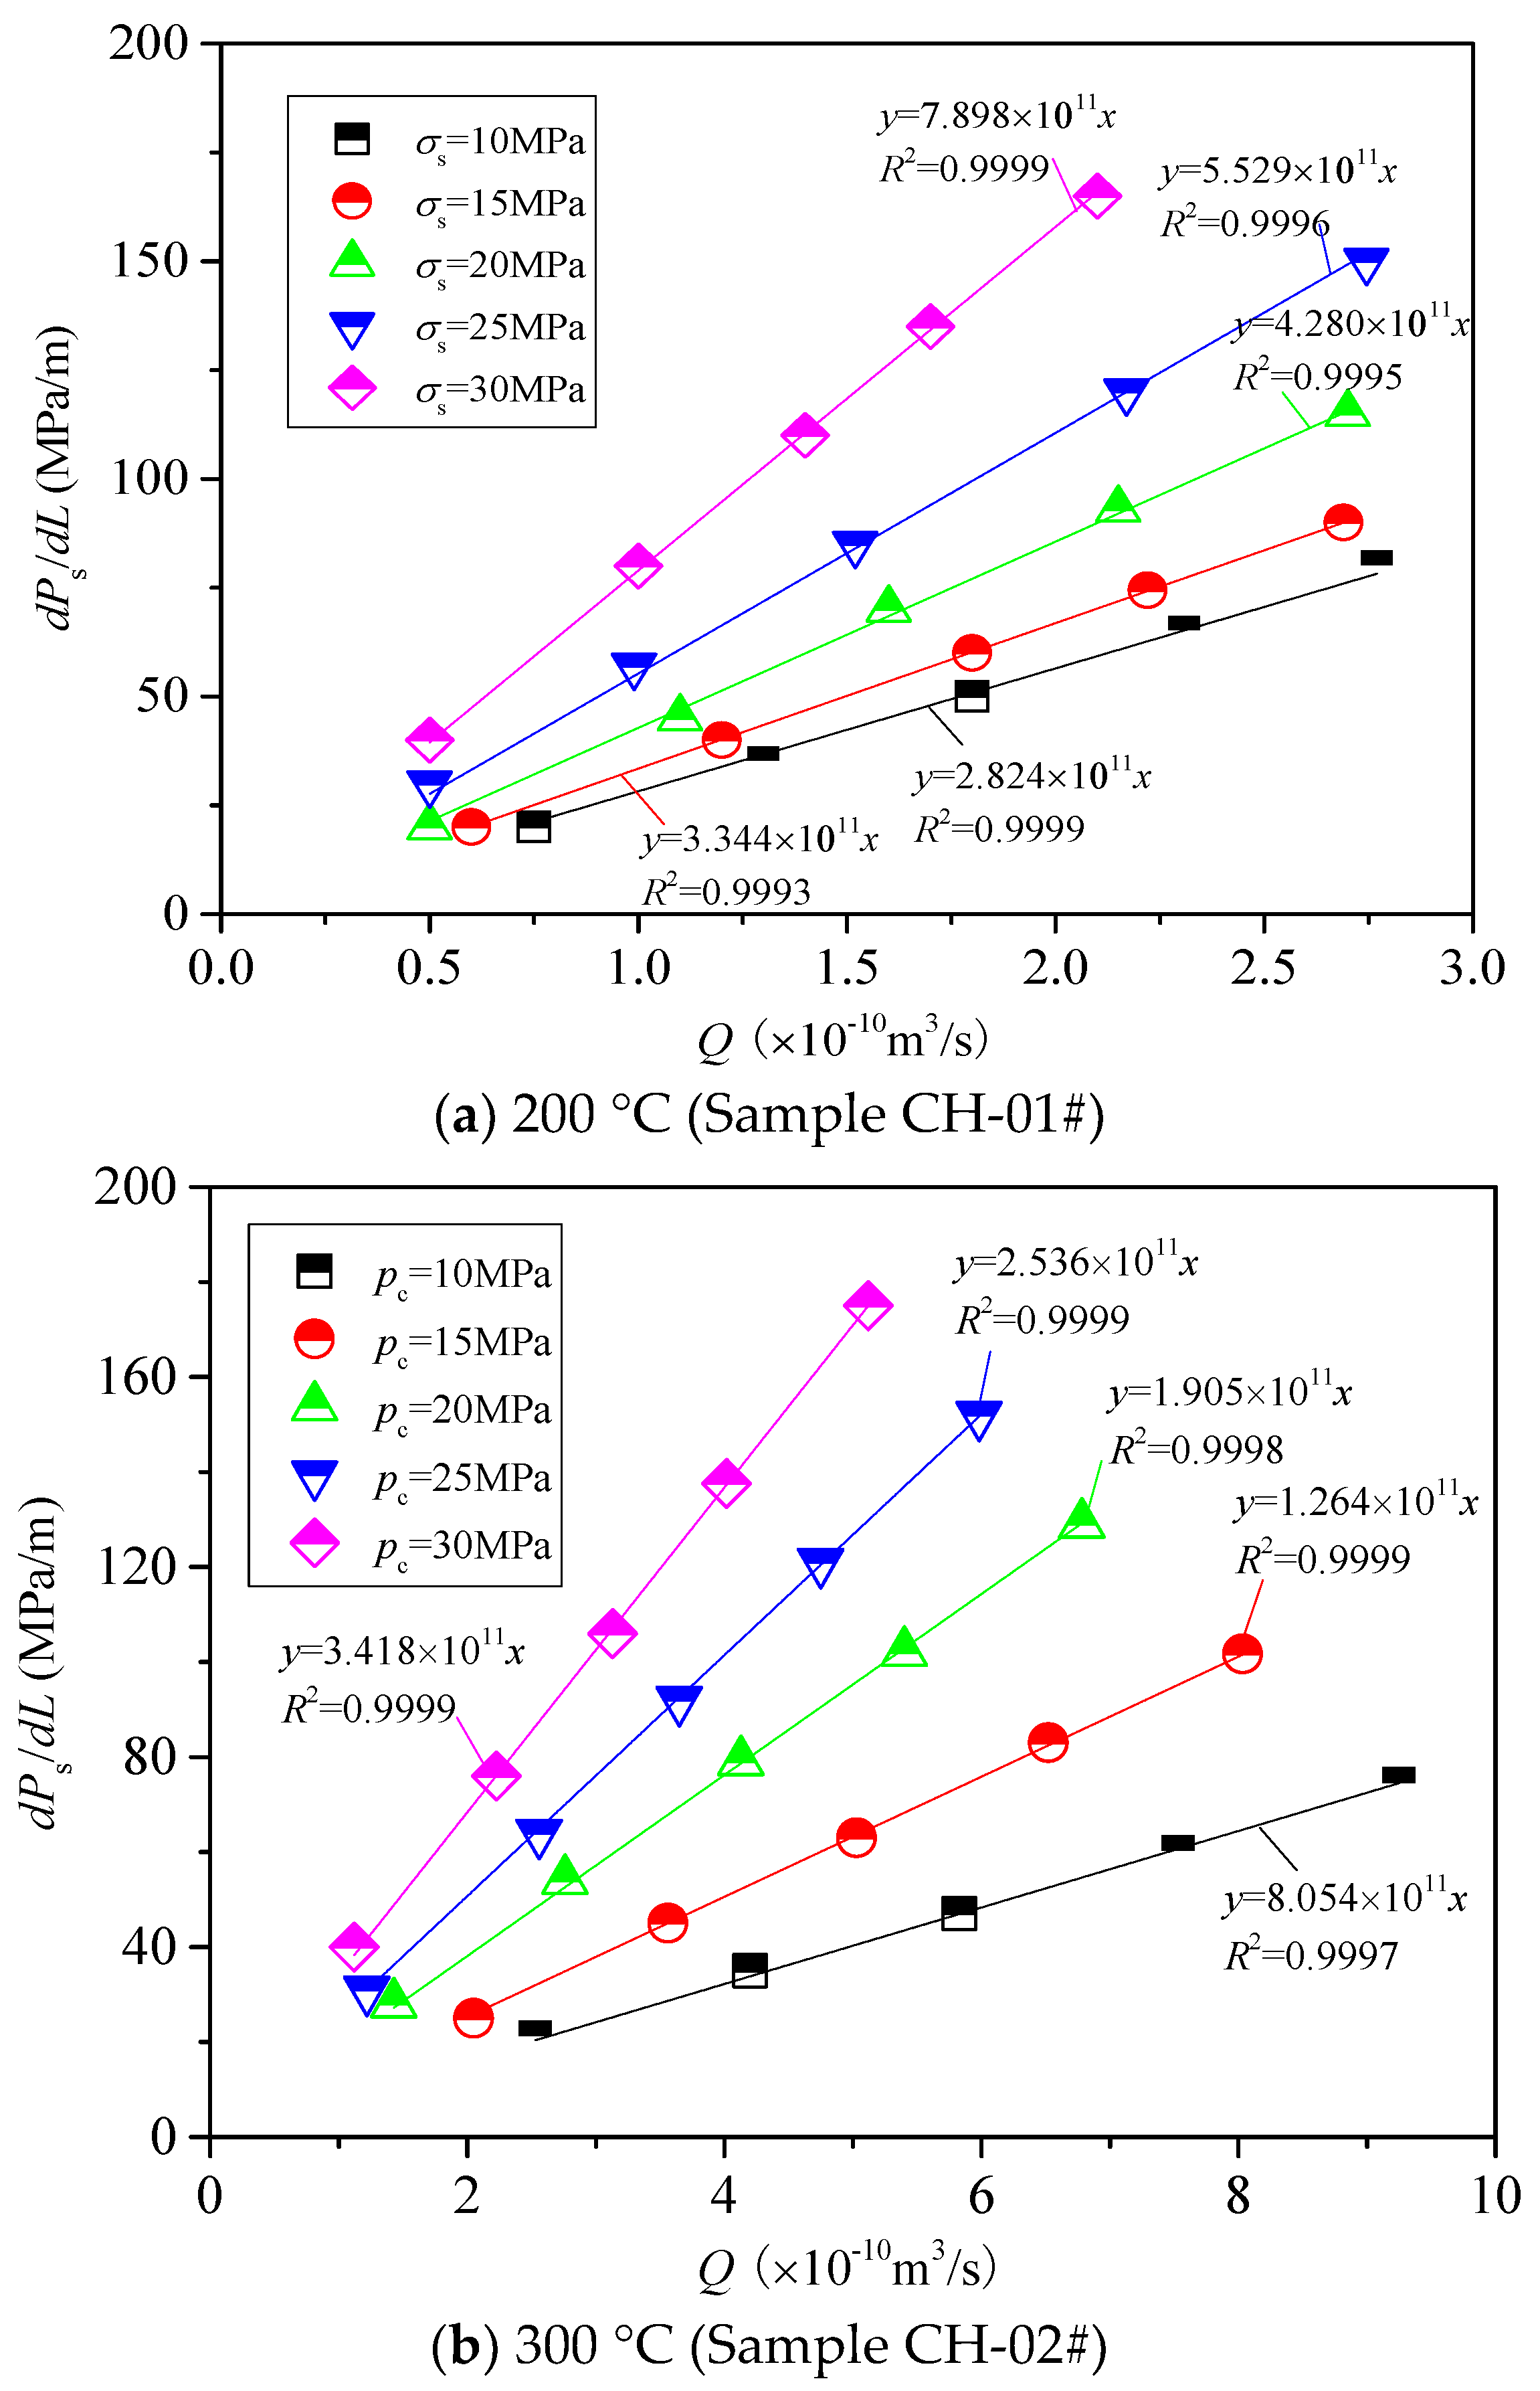
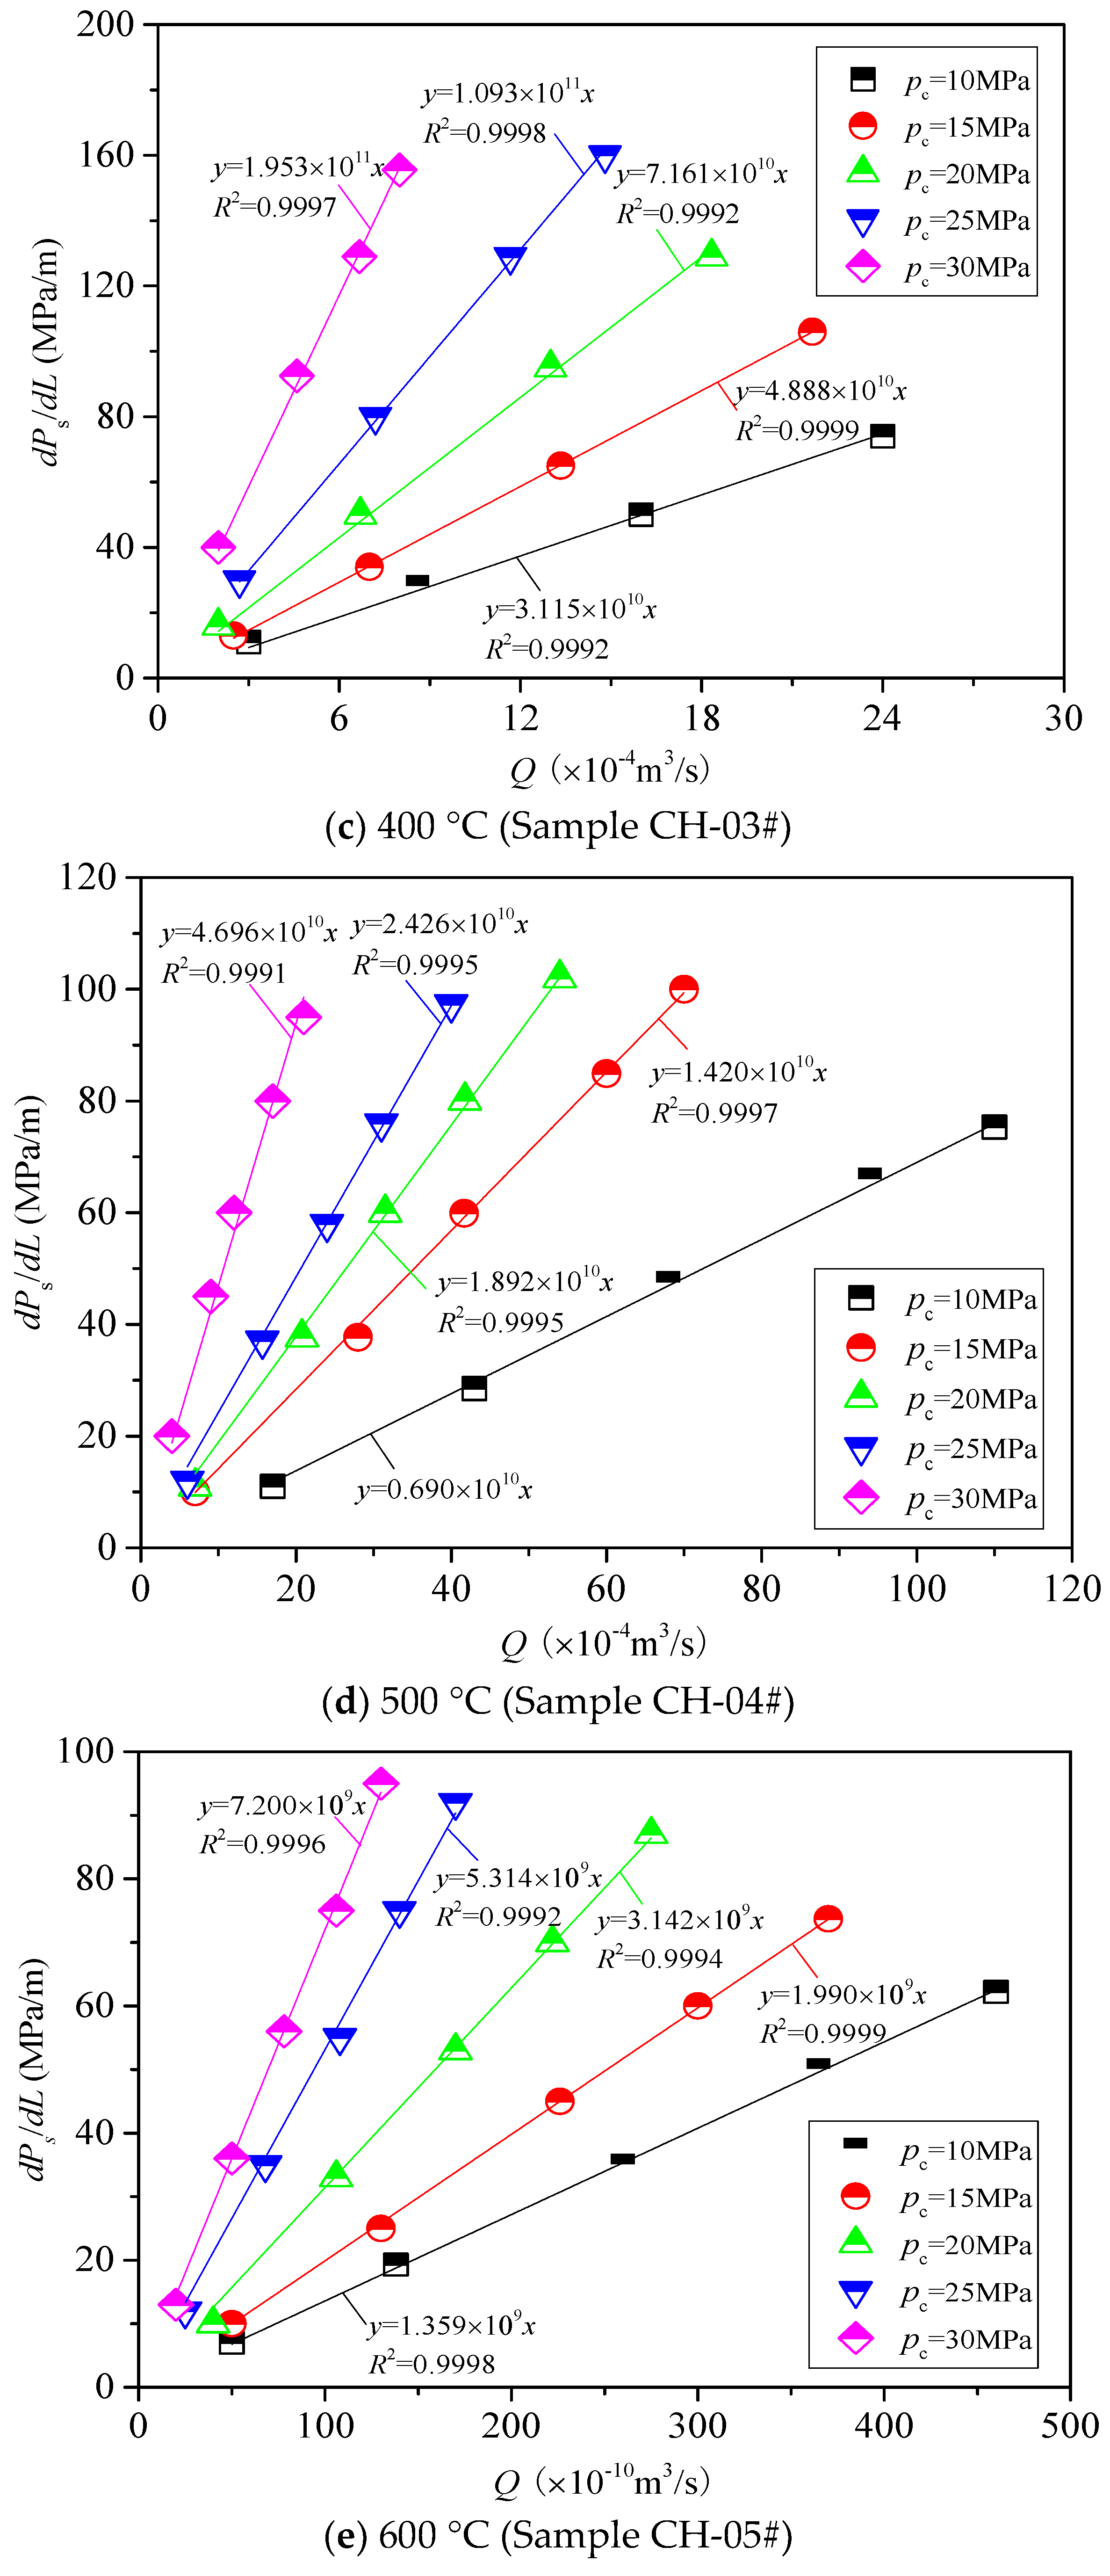
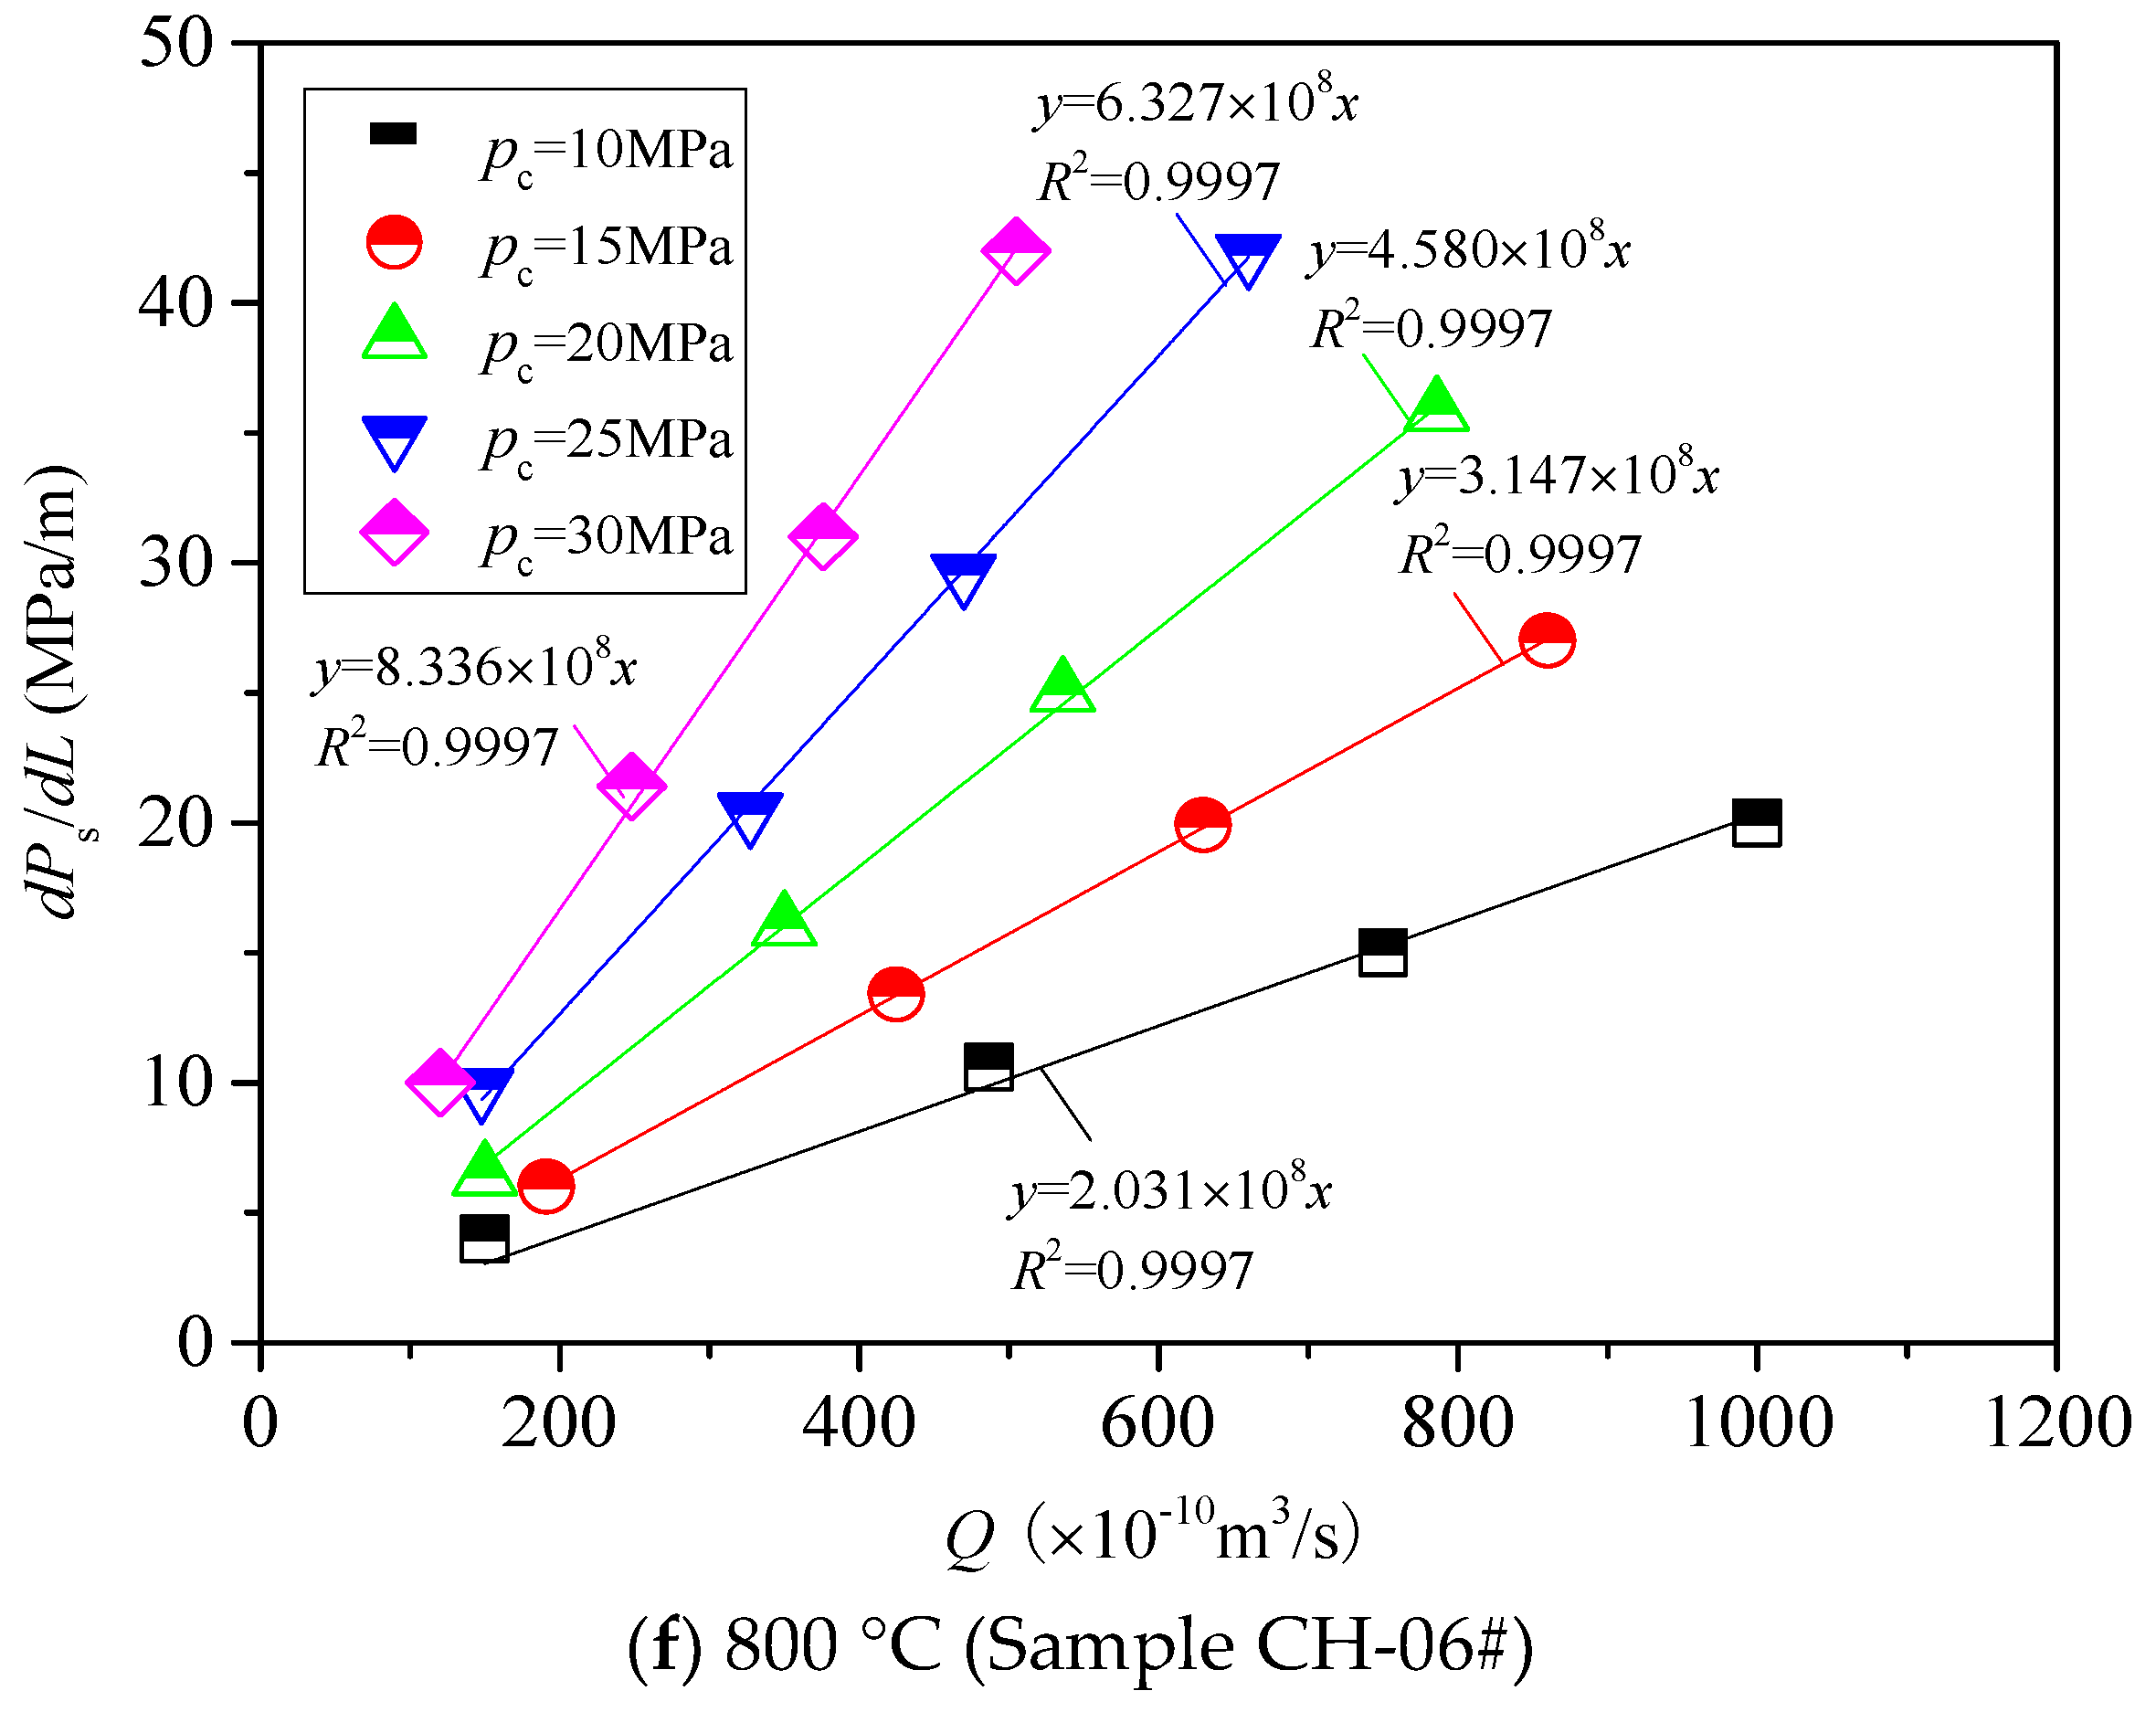
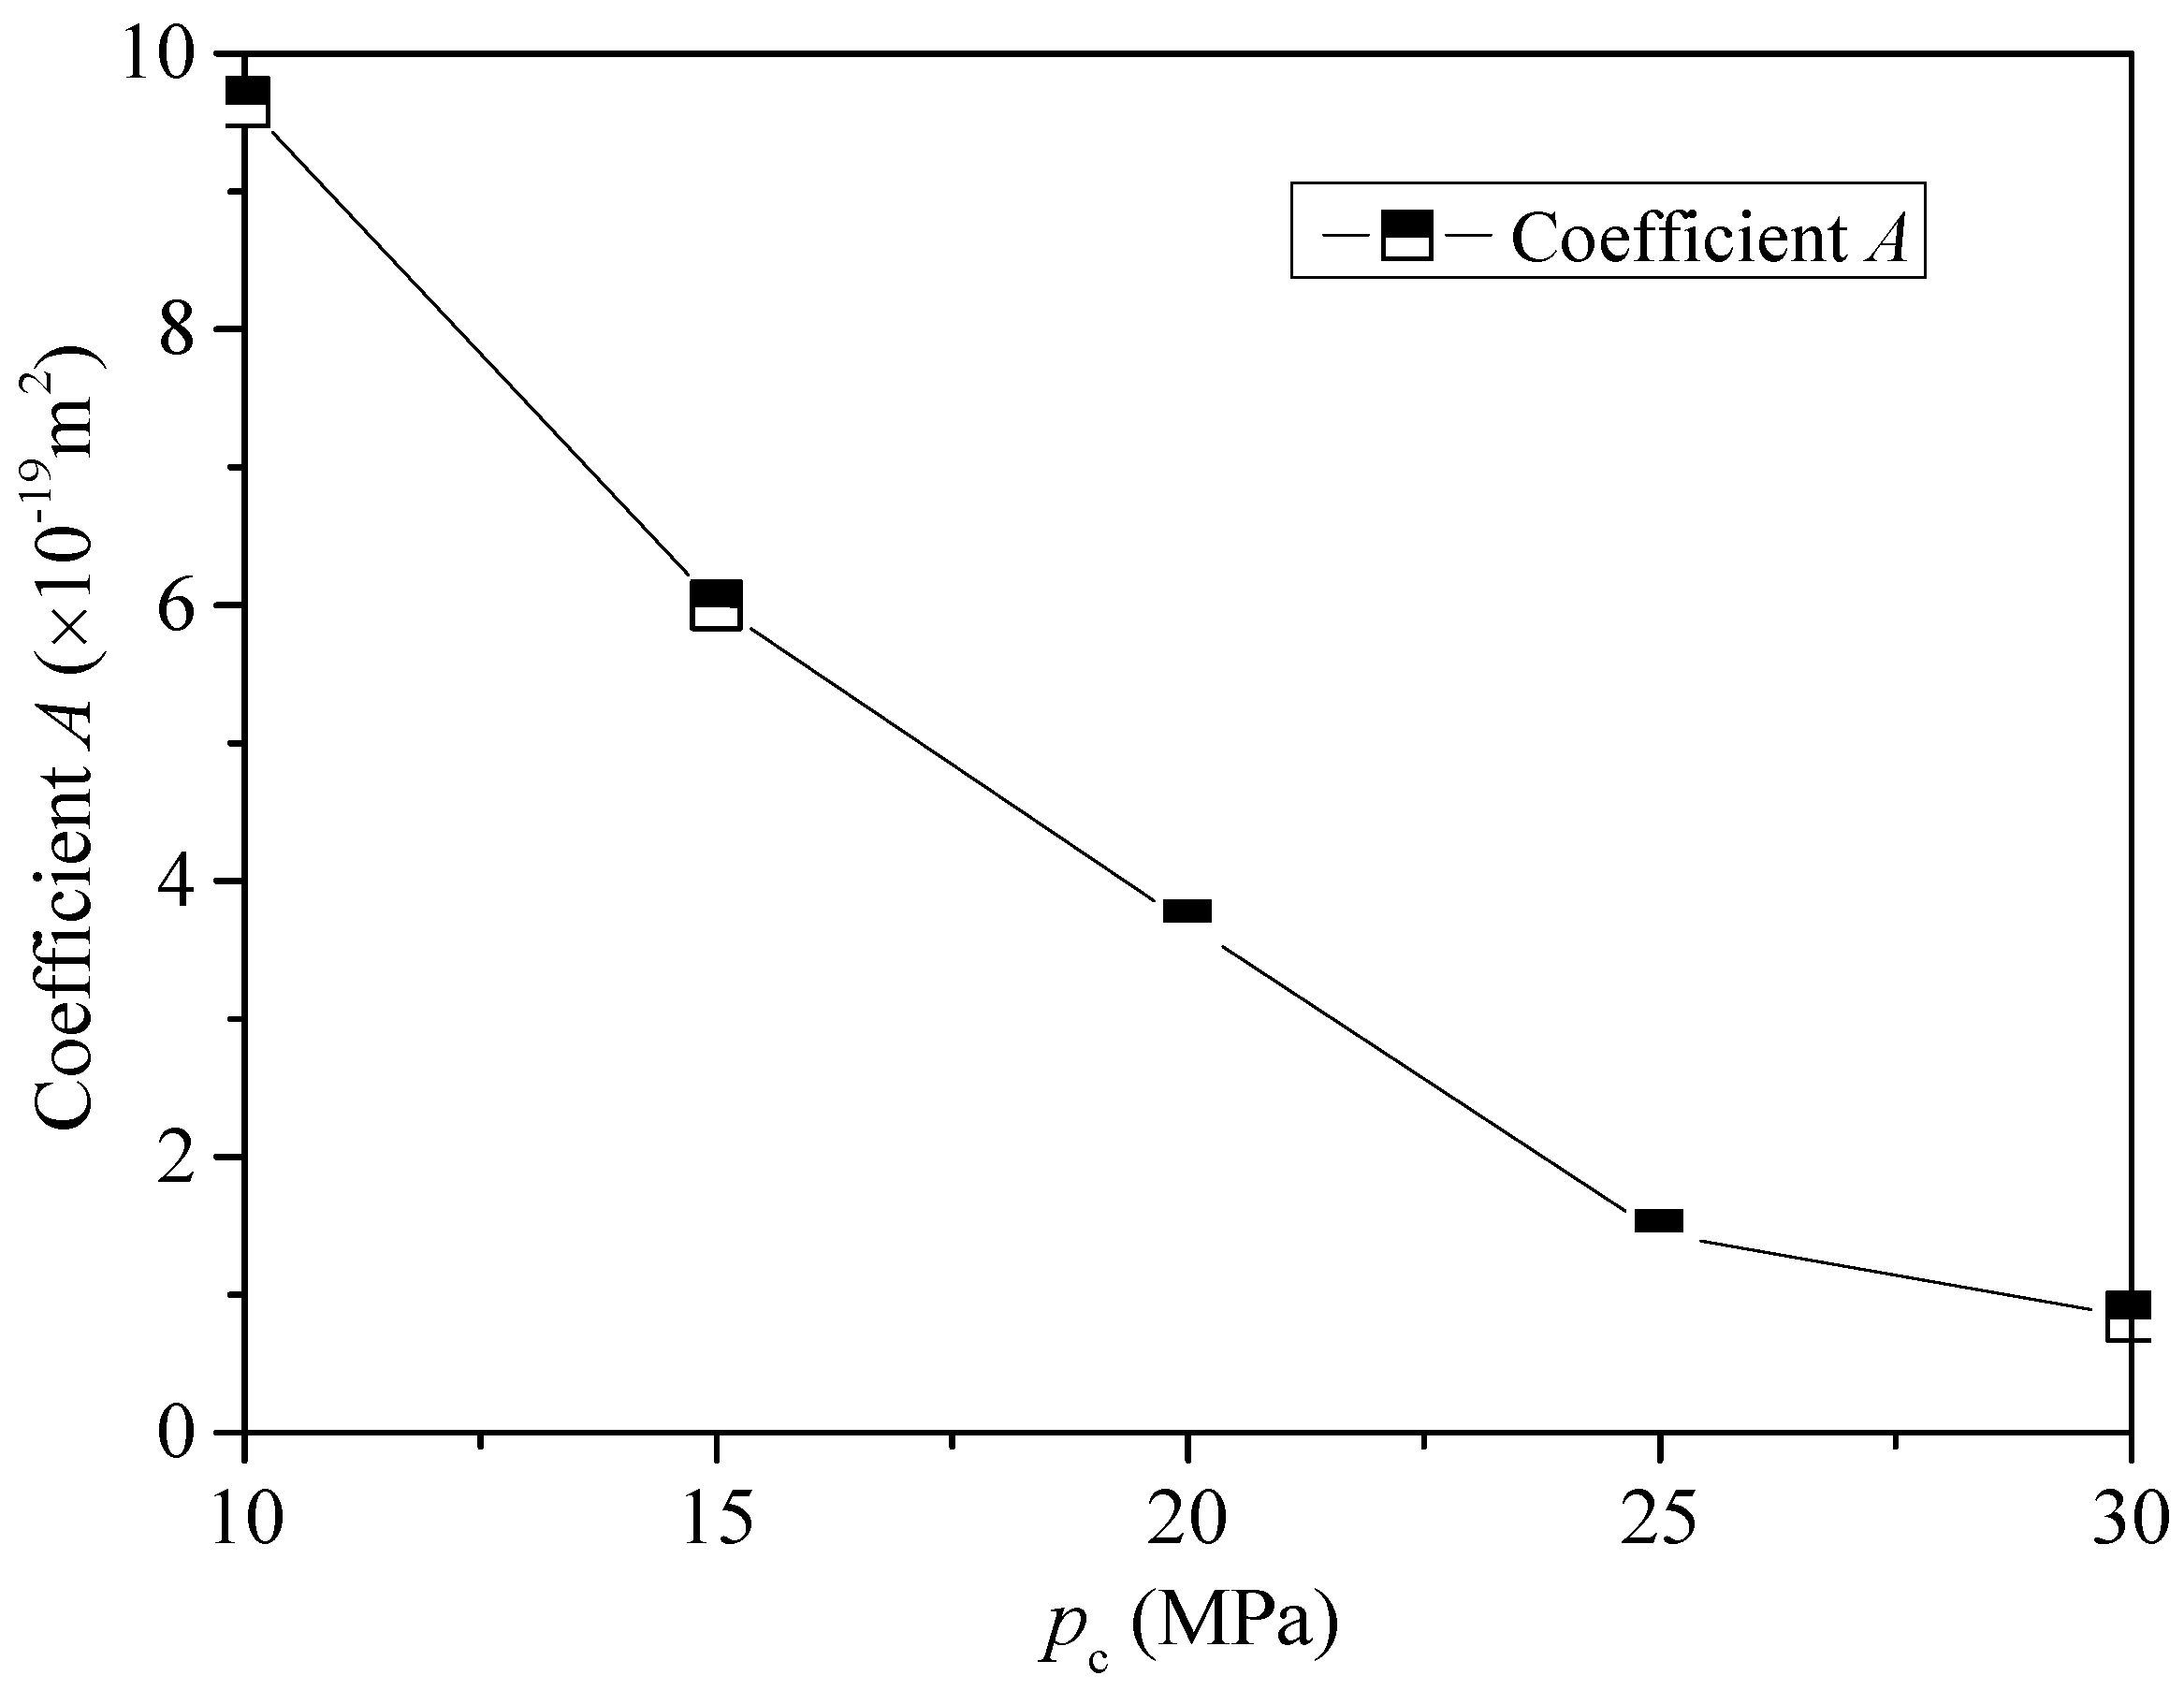
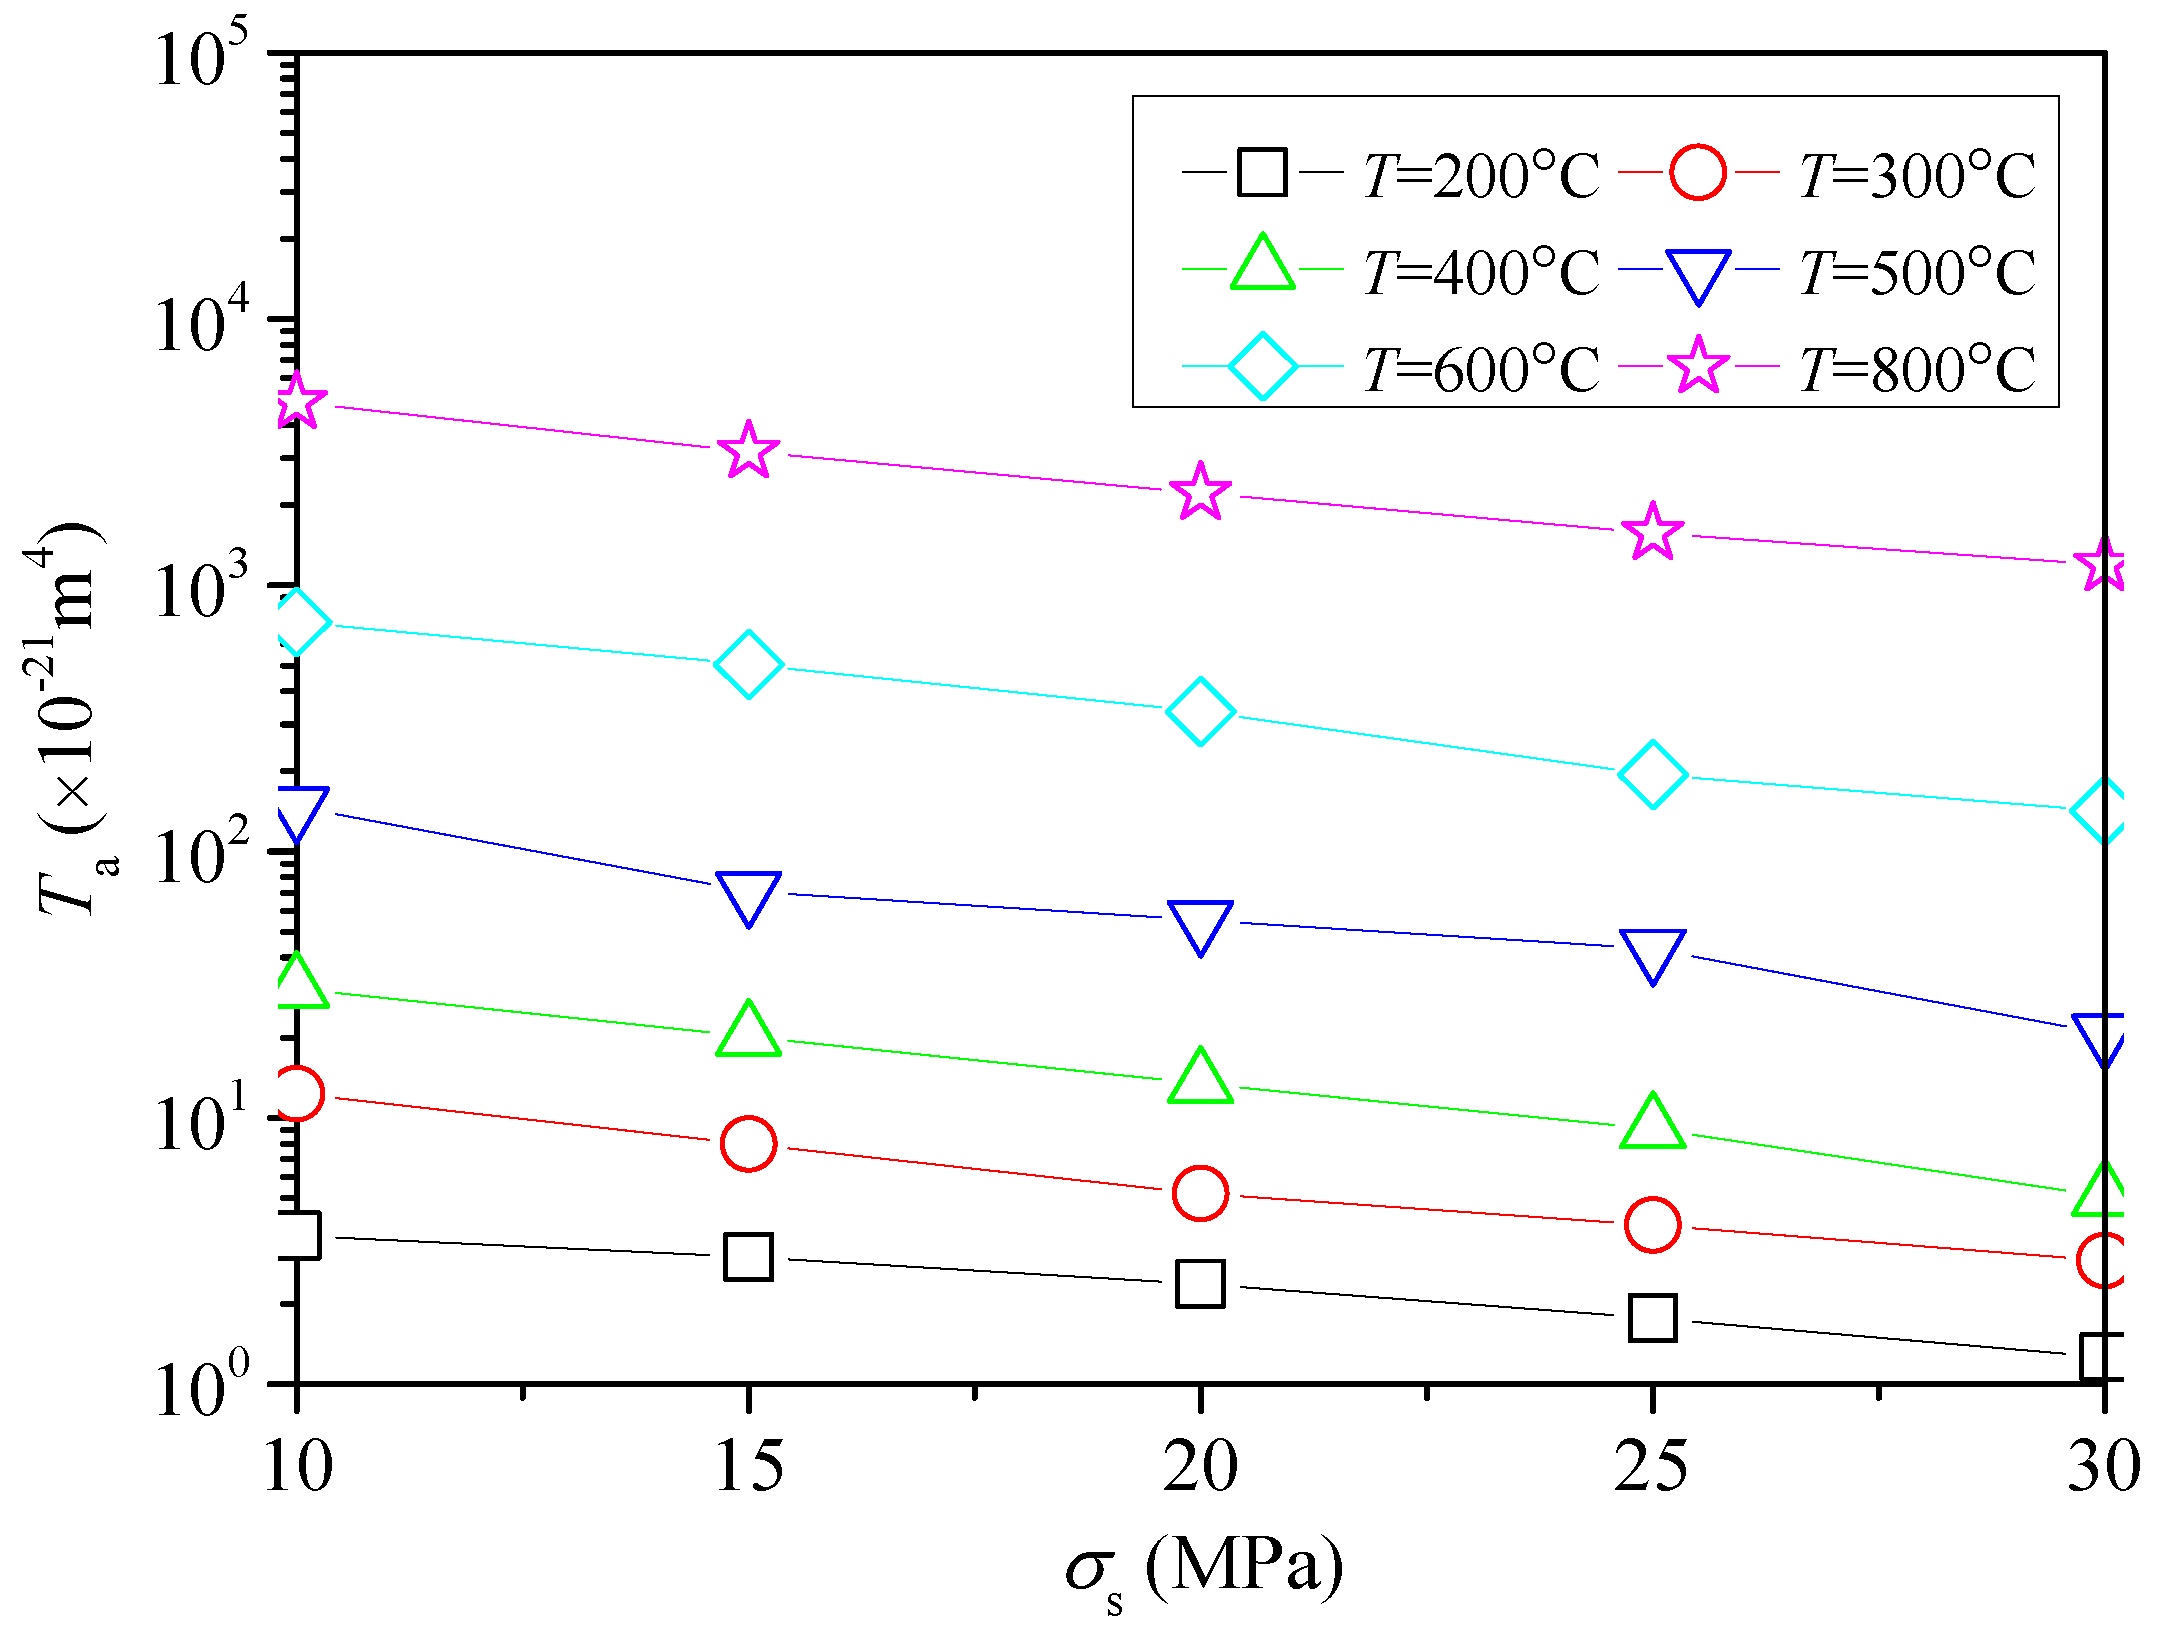
4. Fluid Flow Behaviours of Granites after High-Temperature Exposure

For all of the test cases, as the pressure gradient dPs/dL increases, the volume flow rate Q flowing out of the sample shows an increasing trend. The relations between dPs/dL and Q can be well described using a zero-intercept linear function, and are shown by the solid lines in Figure 6, in which L denotes the length of the sample. From Figure 6, the correlation coefficients or the R2 values are all larger than 0.99, indicating that the linear Darcy’s law fits the raw experimental data very well, and that the fluid flow is laminar. In addition, the increase in pc does not change the linearity of the fluid flow through the samples, but the slopes of the dPs/dL-Q fitting curves become steeper with the increase in pc due to the closure of defects, indicating a higher flow resistance. However, for a given pc, the slopes of the fitting curves show decreases with increases in T.
The equivalent permeability is one of the most important parameters to assess the hydraulic properties of fractured rock masses [30,31]. Using the linear Darcy’s law, the equivalent permeability coefficient K0 of the samples after high-temperature exposure can be calculated using Equation (3), and are listed in Table 2:
d P s d L = μ K 0 A 0 Q
in which μ is the dynamic viscosity, 10−3 Pa·s, and A0 is the cross-sectional area of the sample, m2. Here, the water was assumed to be viscous and incompressible.
Variations of K0 as a function of T are displayed in Figure 7. For a given σs, as T increases, all K0 exhibit nonlinear increasing trends, and the variation process can be divided into the following two stages.
In the range of 200–400 °C, K0 increases slowly. For T = 200 °C, the K0 values for the samples are 1.84 × 10⁻¹⁸ (pc = 10 MPa), 1.53 × 10⁻¹⁸ (pc = 15 MPa), 1.21 × 10⁻¹⁸ (pc = 20 MPa), 8.90 × 10⁻¹⁹ (pc = 25 MPa), and 6.43 × 10⁻¹⁹ m2 (pc = 30 MPa). However, for T = 400 °C, the K0 values are 1.56 × 10⁻¹⁷ (pc = 10 MPa), 1.03 × 10⁻¹⁷ (pc = 15 MPa), 6.85 × 10⁻¹⁸ (pc = 20 MPa), 4.62 × 10⁻¹⁸ (pc = 25 MPa), and 2.58 × 10⁻¹⁸ m2 (pc = 30 MPa), showing increases by factors of 7.47, 5.74, 4.66, 4.14, and 3.02, respectively. From the SEM results in Figure 5, as T increases from 200 °C to 400 °C, several micro-cracks occur in the granites, but the cracks are not fully developed, which leads to a slight increase in the conductivity of the samples.
In the range of 400–800 °C, K0 increases sharply. For T = 800 °C, the K0 values for the samples are 2.34 × 10¹⁵ (pc = 10 MPa), 1.62 × 10¹⁵ (pc = 15 MPa), 1.13 × 10¹⁵ (pc = 20 MPa), 7.99 × 10⁻¹⁶ (pc = 25 MPa), and 6.08 × 10⁻¹⁶ m2 (pc = 30 MPa), increasing by factors of 148.82, 156.37, 163.90, 171.82, and 234.36, respectively, over the values for T = 400 °C. The main reasons for the variations are as follows. At temperatures between 400 °C and 800 °C, thermal expansion and ion transformation occur in the granites. The samples undergo irreversible thermal damage. The interior cracks of the rocks extend quickly, and the porosity increases, resulting in a sharp increase in the conductivity.
From the experimental results that are discussed above, as T increases from 200 °C to 800 °C, variations of K0 against T can be well described using the following exponential function:
K 0 = A × 1.01 T
in which A is a fitting coefficient, m2, representing the sensitivity of changes in the permeability coefficient to the confining pressure.
Chen et al. [18] studied the evolution of thermal damage and the permeability of the Beishan granite, and found that the permeability of granite samples after different temperature treatments and under a hydrostatic pressure of 5 MPa can be described using an exponential function (Figure 8). Generally, the evolution characteristics of permeability are consistent with the experimental results that are obtained here in this study. Then, the permeability in Chen et al.’s study as a function of temperature was evaluated using Equation (4). The comparison results are displayed in Figure 8. It shows that the fitting quality using Equation (4) is more suitable, with a correlation coefficient R2 of 0.98.
Figure 9 shows the variations of coefficient A with an increase in pc. In the range of 10–30 MPa, A shows a decrease from 9.65 × 10⁻¹⁹ to 8.41 × 10²⁰ m2, or by 91.28%. From Equation (4), for granite samples in the natural state (T = 25 °C), the K0 values of the samples are 1.24 × 10⁻¹⁸ (pc = 10 MPa), 7.69 × 10⁻¹⁹ (pc = 15 MPa), 4.73 × 10⁻¹⁹ (pc = 20 MPa), 1.90 × 10⁻¹⁹ (pc = 25 MPa), and 1.10 × 10⁻¹⁹ m2 (pc = 30 MPa). In the range of pc from 10 MPa to 30 MPa, K0 shows a decrease of 91.06%, which is consistent with some previous results [32].
To evaluate the migration law for fluid in a fractured porous medium, the transmissivity (Ta) was defined [33,34,35].
d P s d L = μ T a Q
Combinations of Equations (3) and (5) yield the following Equation (6):
T a = K 0 A 0
in which, Ta is the transmissivity, m4.
The variations in Ta as a function of pc are displayed in Figure 10. As pc increases, Ta shows a decrease. However, Ta shows an increase with the heating temperature, and the extent of increase gradually increases. For smaller pc values (10, 15 and 20 MPa), Ta is sensitive to pc due to pore/crack closure, especially for samples at higher temperature levels. However, for larger pc values, the reduction rate for Ta gradually decreases, because the induced cracks that are due to thermal damage generally reach their residual crack apertures.

5. Conclusions

From the SEM results, thermal damages, such as micro-cracks and pores, initiate in the granites as a result of high-temperature exposure. As the temperature increases, both the density and the P-wave velocity show degradation.
The relationships between the volume flow rate and the pressure gradient in granite samples after high temperatures at various confining pressures can be well described using Darcy’s law. The equivalent permeability coefficients of the samples show an increase with the temperature, and the variation process can be described using the mathematical expression K0 = A × 1.01T.
As the confining pressure increases, the conductivity of the samples shows a decrease due to crack/pore closure, especially for samples after higher temperature treatment. In the range of confining pressure from 10 MPa to 30 MPa, the transmissivity shows a decrease of 65.12%–85.99%. These results are useful for research and applications that are involved in many areas, such as the disposal of nuclear wastes.

Acknowledgments

This work was supported by the National Key Basic Research and Development Program of China, China (No. 2017YFC0603001), National Natural Science Foundation of China, China (No. 51734009).

Author Contributions

Lixin He and Hongwen Jing conceived and designed the experiments; Lixin He performed the experiments; Qian Yin and Lixin He analyzed the data; Qian Yin contributed reagents/materials/analysis tools; Lixin He wrote the paper.

Conflicts of Interest

The authors declare no conflict of interest.

References

  1. Wang, J.S.Y.; Mangold, D.C.; Tsang, C.F. Thermal impact of waste emplacement and surface cooling associated with geologic disposal of high-level nuclear waste. Environ. Geol. Water Sci. 1988, 11, 183–239. [Google Scholar] [CrossRef]
  2. Nicholson, K. Environmental protection and the development of geothermal energy resources. Environ. Geochem. Health 1994, 16, 86–87. [Google Scholar] [CrossRef] [PubMed]
  3. Luo, J.A.; Wang, L.G.; Tang, F.R.; Zheng, L. Variation in the temperature field of rocks overlying a high-temperature cavity during underground coal gasification. Min. Sci. Technol. 2011, 21, 709–713. [Google Scholar] [CrossRef]
  4. Liu, R.; Li, B.; Jiang, Y.; Yu, L. A numerical approach for assessing effects of shear on equivalent permeability and nonlinear flow characteristics of 2-D fracture networks. Adv. Water Resour. 2018, 111, 289–300. [Google Scholar] [CrossRef]
  5. Zhao, Y.S.; Wan, Z.J.; Feng, Z.J.; Yang, D.; Zhang, Y.; Qu, F. Triaxial compression system for rock testing under high temperature and high pressure. Int. J. Rock Mech. Min. Sci. 2012, 52, 132–138. [Google Scholar] [CrossRef]
  6. Ozguven, A.; Ozcelik, Y. Effects of high temperature on physico-mechanical properties of Turkish natural building stones. Eng. Geol. 2014, 183, 127–136. [Google Scholar] [CrossRef]
  7. Shao, S.; Ranjith, P.G.; Wasantha, P.L.P.; Chen, B.K. Experimental and numerical studies on the mechanical behaviour of Australian Strathbogie granite at high temperatures: An application to geothermal energy. Geothermics 2015, 54, 96–108. [Google Scholar] [CrossRef]
  8. Sun, H.; Sun, Q.; Deng, W.; Zhang, W.; Lü, C. Temperature effect on microstructure and p-wave propagation in Linyi sandstone. Appl. Therm. Eng. 2017, 115, 913–922. [Google Scholar] [CrossRef]
  9. Yong, C.; Wang, C.Y. Thermally induced acoustic emission in Westerly granite. Geophys. Res. Lett. 1980, 7, 1089–1092. [Google Scholar] [CrossRef]
  10. Griffiths, L.; Lengliné, O.; Heap, M.J.; Baud, P.; Schmittbuhl, J. Thermal cracking in Westerly Granite monitored using direct wave velocity, coda wave interferometry and acoustic emissions. J. Geophys. Res. Solid Earth 2018. [Google Scholar] [CrossRef]
  11. Freire-Lista, D.M.; Fort, R.; Varas-Muriel, M.J. Thermal stress-induced microcracking in building granite. Eng. Geol. 2016, 206, 83–93. [Google Scholar] [CrossRef]
  12. Wang, H.F.; Bonner, B.P.; Carlson, S.R.; Kowallis, B.; Heard, H.C. Thermal stress cracking in granite. J. Geophys. Res. 1989, 94, 1745–1758. [Google Scholar] [CrossRef]
  13. Yin, T.B.; Li, X.B.; Cao, W.Z.; Xia, K.W. Effects of thermal treatment on tensile strength of Laurentian granite using Brazilian test. Rock Mech. Rock Eng. 2015, 48, 2213–2223. [Google Scholar] [CrossRef]
  14. Zhang, L.Y.; Mao, X.B.; Lu, A.H. Experimental study on the mechanical properties of rocks at high temperature. Sci. China 2009, 52, 641–646. [Google Scholar] [CrossRef]
  15. Chaki, S.; Takarli, M.; Agbodjan, W.P. Influence of thermal damage on physical properties of a granite rock: Porosity, permeability and ultrasonic wave evolutions. Constr. Build. Mater. 2008, 22, 1456–1464. [Google Scholar] [CrossRef]
  16. Zoback, M.D.; Byerlee, J.D. The effect of microcrack Dilatancy on the permeability of Westerly granite. J. Geophys. Res. 1975, 80, 752–755. [Google Scholar] [CrossRef]
  17. Ding, Q.L.; Ju, F.; Mao, X.B.; Ma, D.; Yu, B.Y. Experimental investigation of the mechanical behavior in unloading conditions of sandstone after high-temperature treatment. Rock Mech. Rock Eng. 2016, 49, 2641–2653. [Google Scholar] [CrossRef]
  18. Chen, S.W.; Yang, C.H.; Wang, G.B. Evolution of thermal damage and permeability of Beishan granite. Appl. Therm. Eng. 2017, 110, 1533–1542. [Google Scholar] [CrossRef]
  19. Verma, A.K.; Jha, M.K.; Maheshwar, S.; Singh, T.N.; Bajpai, R.K. Temperature-dependent thermophysical properties of Ganurgarh shales from Bhander group, India. Environ. Earth Sci. 2016, 75, 1–11. [Google Scholar] [CrossRef]
  20. Yin, Q.; Ma, G.W.; Jing, H.W. Experimental study on mechanical properties of sandstone specimens containing a single hole after high-temperature exposure. Géotech. Lett. 2015, 5, 43–48. [Google Scholar] [CrossRef]
  21. Hu, D.W.; Zhou, H.; Zhang, F.; Shao, J.F. Evolution of poroelastic properties and permeability in damaged sandstone. Int. J. Rock Mech. Min. Sci. 2010, 47, 962–973. [Google Scholar] [CrossRef]
  22. Kumari, W.G.P.; Ranjith, P.G.; Perera, M.S.A.; Chen, B.K.; Abdulagatov, I.M. Temperature-dependent mechanical behaviour of Australian Strathbogie granite with different cooling treatments. Eng. Geol. 2017, 229, 31–44. [Google Scholar] [CrossRef]
  23. Zhang, W. Study on the Microscopic Mechanism of Rock Thermal Damage and the Evolution Characteristics of Macroscopic Physical and Mechanical Properties; China University of Mining and Technology: Xuzhou, China, 2017. [Google Scholar]
  24. Zhang, W.; Sun, Q.; Hao, S.; Geng, J.; Lv, C. Experimental study on the variation of physical and mechanical properties of rock after high temperature treatment. Appl. Therm. Eng. 2016, 98, 1297–1304. [Google Scholar] [CrossRef]
  25. Pereira, A.H.A.; Miyaji, D.Y.; Cabrelon, M.D.; Medeiros, J.; Rodrigues, J.A. A study about the contribution of the α-β phase transition of quartz to thermal cycle damage of a refractory used in fluidized catalytic cracking units. Cerâmica 2014, 60, 449–456. [Google Scholar] [CrossRef]
  26. Géraud, Y. Variations of connected porosity and inferred permeability in a thermally cracked granite. Geophys. Res. Lett. 1994, 21, 979–982. [Google Scholar] [CrossRef]
  27. Xi, D.Y. Physical characteristics of mineral phase transition in the granite. Acta Mineral. Sin. 1994, 14, 223–227. [Google Scholar]
  28. Griffiths, L.; Heap, M.J.; Baud, P.; Schmittbuhl, J. Quantification of microcrack characteristics and implications for stiffness and strength of granite. Int. J. Rock Mech. Min. Sci. 2017, 100, 138–150. [Google Scholar] [CrossRef]
  29. David, C.; Menéndez, B.; Darot, M. Influence of stress-induced and thermal cracking on physical properties and microstructure of La Peyratte granite. Int. J. Rock Mech. Min. Sci. 1999, 36, 433–448. [Google Scholar] [CrossRef]
  30. Liu, R.; Jiang, Y.; Li, B.; Wang, X. A fractal model for characterizing fluid flow in fractured rock masses based on randomly distributed rock fracture networks. Comput. Geotech. 2015, 65, 45–55. [Google Scholar] [CrossRef]
  31. Liu, R.; Li, B.; Jiang, Y. A fractal model based on a new governing equation of fluid flow in fractures for characterizing hydraulic properties of rock fracture networks. Comput. Geotech. 2016, 75, 57–68. [Google Scholar] [CrossRef]
  32. Takada, M.; Fujii, Y.; Jun-lchi, K. Study on the effect of confining pressure on permeability of rock in triaxial compression failure process. J. MMIJ 2012, 127, 151–157. [Google Scholar] [CrossRef]
  33. Zhang, Z.; Nemcik, J. Fluid flow regimes and nonlinear flow characteristics in deformable rock fractures. J. Hydrol. 2013, 477, 139–151. [Google Scholar] [CrossRef]
  34. Li, B.; Liu, R.; Jiang, Y. Influences of hydraulic gradient, surface roughness, intersecting angle, and scale effect on nonlinear flow behavior at single fracture intersections. J. Hydrol. 2016, 538, 440–453. [Google Scholar] [CrossRef]
  35. Yin, Q.; Ma, G.W.; Jing, H.W.; Su, H.J.; Wang, Y.C.; Liu, R.C. Hydraulic properties of 3D rough-walled fractures during shearing: An experimental study. J. Hydrol. 2017, 555, 169–184. [Google Scholar] [CrossRef]
Figure 1. Tested granite samples after high-temperature exposure.
Processes 06 00036 g001
Figure 2. Schematic diagram of the rock permeability test system.
Processes 06 00036 g002
Figure 3. Effect of temperature on the decrement ratio of density and P-wave velocity of the tested granites.
Processes 06 00036 g003
Figure 4. Variations of internal porosity of granites with temperature.
Processes 06 00036 g004
Figure 5. Scanning electron microscope (SEM) images of granites at room-temperature and after high-temperature exposure. (a) Room temperature; (b) 200 °C; (c) 300 °C; (d) 400 °; (e) 500 °C; (f) 600 °C; (g) 800 °C.
Processes 06 00036 g005aProcesses 06 00036 g005b
Figure 6. Volume flow rate Q as a function of pressure gradient dPs/dL of the granite samples after high-temperature exposure. (a) 200 °C (Sample CH-01#); (b) 300 °C (Sample CH-02#); (c) 400 °C (Sample CH-03#); (d) 500 °C (Sample CH-04#); (e) 600 °C (Sample CH-05#); (f) 800 °C (Sample CH-06#).
Processes 06 00036 g006aProcesses 06 00036 g006bProcesses 06 00036 g006c
Figure 7. Variation in the equivalent permeability coefficients of granite samples with temperature.
Processes 06 00036 g007
Figure 8. Evolution of permeability versus heat treatment temperature.
Processes 06 00036 g008
Figure 9. Variations in coefficient A with the confining pressure.
Processes 06 00036 g009
Figure 10. Transmissivity as a function of the confining pressure.
Processes 06 00036 g010
Table 1. Physical properties of granite samples.
SamplesT (°C)ρ (g/cm3)ρ′ (g/cm3)Δρ (%)v (km/s)v′ (km/s)Δv (%)
CH-01#2002.682.670.174.704.504
CH-02#3002.682.670.334.944.1017
CH-03#4002.672.660.414.973.7026
CH-04#5002.682.660.644.543.0832
CH-05#6002.672.650.794.702.6045
CH-06#8002.672.641.084.701.7064
Table 2. Equivalent permeability after different temperature under different confining pressure.
Temperature (°C)Average Equivalent Permeability (×10−18 m2)
pc = 10 MPapc = 15 MPapc = 20 MPapc = 25 MPapc = 30 MPa
2001.841.531.210.90.64
3006.264.062.652.021.48
40015.6010.296.854.632.58
50075.1736.1328.1621.9610.53
600371.13257.25170.7298.972.38
8002336.461619.231130.04799.18608.17

