A Blended Risk Index Modeling and Visualization Based on Hierarchical Fuzzy Logic for Water Supply Pipelines Assessment and Management


Department of Computer Engineering, Jeju National University, Jeju 63243, Korea
*
Author to whom correspondence should be addressed.
Processes 2018, 6(5), 61; https://doi.org/10.3390/pr6050061
Submission received: 2 April 2018
/
Revised: 14 May 2018
/
Accepted: 15 May 2018
/
Published: 22 May 2018
Abstract
:Critical infrastructure such as power and water delivery is growing rapidly in the developing world and there are developed assets that must be maintained in developed nations. One underground component that is difficult to inspect is water supply pipelines. Most of the water line accidents occur in buildings is due to pipeline damage. To minimize accidental loss, a risk assessment method is needed to continuously assess risk and report any abnormality for preventative maintenance. In this work, a blended hierarchical fuzzy logic model for water supply pipeline risk index assessment is proposed. Four important parameters are inputs to the proposed blended hierarchical fuzzy logic model. The blended hierarchical fuzzy logic model dramatically reduces the number of conditions in the rule base. Rule reduction is important because the transparency and interpretation are compromised by an overly large set. Further, it is challenging to accurately design a large number of rules because rule design requires expert knowledge and uncertainty in predictions can lead to unforeseen incidents. A blended hierarchical fuzzy model is designed with a structure that takes fewer rules as compared to conventional fuzzy logic. For the four parameters, the proposed model takes 85 rules and for the same four parameters, the conventional fuzzy logic approach requires 900 rules. In this paper, four parameters are considered because these are available measurements. The proposed reduction method is also applicable for systems with more parameters. The numbers of rules increase exponentially in the conventional fuzzy logic as new parameters enter into the system. The blended hierarchical fuzzy logic is deployed on a water distribution network to compute the risk index of supply pipelines. The results indicate improved performance of the blended hierarchical fuzzy logic. This approach is usable in practical applications where the calculated risk index values of the water supply pipeline are plotted on a geographic information system (GIS) map to provide a graphical interface for the caretaker. The risk index visualization is necessary to trace the risk index location and to take preemptive measures to avoid failures.
1. Introduction
The concept of risk was initially introduced in the field of economy at the end of the 19th century. Recently it has been commonly used in almost all fields, such as environmental science, natural disasters, society, and architectural engineering. Risk is the probability of failure and it is closely related to uncertainty. Nowadays, risk assessment is widely used for underground structures, including different underground facilities such as water supply pipelines, sewerage supply pipelines, and metro structures. Among these, the most important facility is underground water supply pipelines, which greatly contribute to underground risk and eventually risk to buildings. Water is an important part of human life and water provision facilities are dependent on water pipes. In the recent age, cities become congested and in order to supply water, bundle of pipes are installed underground. These water supply pipes represent a serious threat to buildings [1,2].
Different parameters that can affect water supply pipelines are age, leakage, depth and height, soil temperature, water temperature, soil moisture, soil electrical resistivity, etc. [3,4,5,6]. Ageing is an important factor for estimating the water supply pipeline risk. A pipeline’s fitness may degrade with the passage of time. In this study, we considered the leakage, depth, age, and length factors, because these are the most important parameters that may cause water supply pipeline failure. This degradation can cause serious damage to the underground structure; hence, it is very necessary to repair water supply pipelines in a timely fashion and thus minimize the chance of the occurrence of accidents.
The leakage of water supply pipelines is a very significant factor for unexpected underground hazards such as abrupt roadside subsidence and urban sinkhole. The leakages in water supply pipelines slowly damage the underground structure near buildings, railways, subways, bridges, etc., and due to this reason, underground facilities always remain under serious threat [7]. The depth of water supply pipelines also contributes to water supply pipeline failure and eventually causes underground structural failure. Normally when a pipe is buried deeper in the ground, it is not affected by surface activities, such as vehicle force, etc. However, if the water supply pipeline is near the surface, activity over the ground where the pipe is installed affects the pipe and a serious force can even break it. The sudden breakage of water supply pipelines can cause a serious damage to nearby facilities. Similarly, length is another parameter that plays a vital role in the safety of water supply pipelines and underground risk [8]. Many attempts have been made by researchers who have suggested different techniques to assess water supply risks. Many accidents, such as failure in structure facilities, usually occur due to the lack of quality risk assessment mechanisms. Hence, water supply pipeline risk assessment is extremely necessary to avoid such accidents.
Fuzzy inference system (FIS) has been used to assess and analyze risk and has been applied in many areas for risk measurement [9,10]. FIS can be applied when we have to deal with partial truth [11]. Many researchers have made efforts to propose an FIS with the distinctive structure to tackle the curse of the dimensionality problem. The hierarchical fuzzy inference system is comprised of many partial modules; the results of these modules are then integrated to find the overall solution for a system. The working methodology of the hierarchical fuzzy logic can be described as some input variables that are inputted to low-level modules, while the outputs of the low-level modules are used as inputs to high-level modules. The outputs of the top-input modules are further used as inputs to the final module, where the integration of all these modules is done to find the complete risk. The motivation behind the construction of the hierarchical fuzzy model is the reduction of rules, because in conventional fuzzy logic when new variables are entered into the system, the size of the rules increases exponentially. As a result, it becomes very difficult to design rules and the computation complexity also increases. Even for a medium number of input parameters, it could take days to compute, and if the input parameters are greater in number, the computation time would be very high. In order tackle this problem, we recommended a hierarchal fuzzy logic model for water supply pipeline risk index assessment [10].
The occurrence of water supply pipeline failure is an important factor, but due to the lack of data correlated to the chance of their occurrence, it is very difficult to assess the risk of accidents with certainty. To assess the risk index of water supply pipelines normally, help is obtained from the knowledge of experts. However, it is very difficult to find such experts with knowledge of this subject and this method is also very expensive. In order to tackle this problem, different risk assessment methods in different areas have been deployed.
GIS is a system used for capturing, storing, manipulating, analyzing, managing, and presenting spatial or geographic data. GIS has extensively been used in different applications and different fields, such as in engineering, management, transport and planning, telecommunications, etc. The development of GIS has been carried out in many areas, such as GIS and fuzzy inference systems that are integrated for groundwater vulnerability and risk mapping in Reference [5]. Christodoulou et al. in Reference [12] used GIS for risk-based management of water piping networks in combination with neuro-fuzzy systems. Fuzzy set theory and analytic hierarchy process (AHP) for water distribution were used to calculate the risk of water distribution service failure in Reference [13]. The outcome results were plotted on GIS, thus permitting one to trace the defective nodes across the network and providing an overview of the spatial and temporal distribution of the complete risk.
Previously, we developed an integrated hierarchical fuzzy logic model for underground risk index assessment with the same structure as a blended hierarchal fuzzy logic model [14]. The integrated hierarchical fuzzy logic model has eight input parameters, namely pipeline risk probability, pipeline risk severity, sewerage risk probability, sewerage risk severity, metro risk probability, metro risk severity, geo-environmental risk probability, and geo-environmental risk severity. The data that were used to compute the underground risk index values were simulated data generated through different exponential functions. Two rules designing methods, namely max-based and average-based methods, were used to design rules in the integrated hierarchical fuzzy logic model.
In this paper, we propose a model for underground risk index assessment and visualization. The objective of the proposed work is three-fold: (1) to design a fuzzy logic model with a special structure to reduce the dimensionality (number of rules) for the proposed system with four parameters; (2) to test the accuracy of the proposed model on real data; and (3) to provide a graphical user interface for the caretaker. In order to acquire the desired objectives, we designed a hierarchical fuzzy logic model that requires fewer rules as compared to the conventional fuzzy logic model on provided dataset parameters. The proposed model was applied to the real dataset provided by the Electronics and Telecommunications Research Institute (ETRI) organization, which was collected from 1989 to 2010 for water supply pipelines installed at various locations in Seoul, Republic of Korea. The blended hierarchical fuzzy logic model for water supply pipelines risk index assessment is coupled with a GIS in order to provide a graphical interface for the caretaker. The risk index visualization is necessary to trace the risk index location and to take preemptive measures to avoid failures.
Regarding the organization of this paper, the introduction is given first, the literature review is given in Section 2, and the proposed water supply risk index assessment and visualization model based on hierarchical fuzzy logic and a GIS map are discussed in detail in Section 3. The experimental results and discussion are given in Section 4 and the conclusion is given in Section 5.
2. Related Work
Many attempts have been reported in the literature regarding water supply risk assessment and many risk assessment methodologies have also been reported in different fields. The designing, construction and operation of water supply pipelines are in open environments; hence, water supply pipes are predictably exposed to many hazards. Some of risk assessment methodologies for water supply pipelines and some risk assessment methods in other fields are reported here in detail.
Li et al. [15] proposed an approach based on fuzzy similarity and triangle fuzzy number as well as the quantitative risk assessment based on the fuzzy comprehensive evaluation method for a long-distance water transmission pipeline (LDWTP) to recognize and avoid risk occurrence. This method was proposed in order to ensure the usual operation of water supply projects. Zhang et al. [16] proposed a method based on fuzzy compressive evaluation in order to assess the risk index to control unexpected accidents. The water hammer is calculated under several conditions, which is the most severe risk, in order to remove the risks of possible burst pipes.
Different authors have used different methods for water supply pipeline risk assessment. Shamir et al. [17] proposed a method based on regression analysis to develop an exponential model to assess the breakage rate of a pipe as a function of time. Walski et al. [18] improved the exponential model and added two factors explicitly; the ratio of break frequency with previous breaks to the entire break frequency for cast-iron and the ratio of break frequency for 500-mm diameter to the entire break frequency for pit cast pipes. Kettler et al. [19] found a way to calculate the correlation between annual break rate and pipe age based on a sample of pipes installed within a 10-year period. They proposed a linear association between pipes breaks and age. A method was proposed by Clarks et al. [20] to use a proportional hazard model to predict water main breaks by calculating the probability of the time duration between consecutive breaks.
Image processing is also a very important method, which used in almost all fields for different purposes. Kleta et al. [21] used an image processing tool to monitor the technical condition of underground infrastructure. Tough underground working circumstances make it very difficult to monitor the growth of damage. In many circumstances, it is very hard to directly access the surface of the lining. In order to tackle this, the image processing technique has been used, in which a video recording of the surface is carried out and analyses are made automatically in offline or online modes. Different possible methods and criteria have been discussed in detail in order to detect different damages of different sizes. Currently, the simple method to detect damage is color enhancement. Similarly, many other examples have been given for damage detection and analysis. Many researchers have utilized different image processing methods to monitor underground facilities, for example, structural health monitoring [22,23], monitoring of displacement [24], and monitoring of cracks and underground structure [25,26].
Several risk assessments schemes have been developed in numerous fields. Road tunnel assessment is a problem of central interest and a lot of research work has been carried out on this topic. The road tunnels of urban areas are continuously full of traffic, therefore the monitoring of different operations of urban area road tunnels is quite a difficult task. A scheme called Quantity Risk Assessment (QRA) was developed for urban areas road tunnels risk assessment. For urban areas road risk assessment, six events have been used by QRA: flooding, collision, chain, tunnel collapse, spillage, and explosion [16,27]. An improved version of QRA was suggested by Meng et al. in Reference [28] to measure the urban road tunnels risk due to the non-applicability of current QRA models in road tunnels. This new QRA model is based on a technique called the technical segmentation principle. In this method, the urban area road tunnel is segmented into several segments with the same characteristics. The calculation of each section is carried out and then from these partial risks the total risk is calculated. Duzgun et al. [29] suggested an approach that analyzes risk and makes the decision to assess and manage risk related to mine roof falls in underground coal mines. The probability, possible outcomes, and cost of outcomes have been used for the risk calculation. Nyvlt et al. [30] proposed a method to preserve the safety level for building and refurbishing cost minimization. Risk assessment can help decision-makers rank the existing risk to take appropriate action accordingly. Sari et al. [31] proposed a methodology for mine management to tackle uncertainty and avoid the occurrence of accidents in coal mines. Although by using this method the quantity of accidents has been reduced significantly, the exact risk calculation is still an issue of high concern for mine management. Many other assessment methods also exist, such as Monto Carlo simulation, event trees, fault trees, failure mode and effective analysis, fuzzy set, game theory, multi-criteria verbal analysis, and Grey Systems [32].
The most-used and most efficient way to achieve risk assessment is through a fuzzy logic-based inference system. Many researchers have significantly developed fuzzy inference systems to tackle the problem of risk assessment in various fields. Blockley et al. [33] first used the concept of fuzzy logic in structural engineering. Cho et al. [34] proposed a risk assessment approach in order to deal with uncertainties using fuzzy logic concept. In their paper, they also presented a new type of membership function curve. Fujino et al. [35] presented the deployment of fuzzy fault tree analysis to some simple situations of construction side accidents in Japan. Wang et al. [36] suggested a methodology for bridge risk assessment and in their proposed method of an Adaptive Neuro-Fuzzy System (ANFIS). This scheme is very significant and can help the Highway Agency to handle risks in real time.
Christodoulou et al. [12] proposed a method based on the neuro-fuzzy decision-support system in order to perform multi-forced risk-of-failure analysis and to manage assets allied to water supply networks. The two datasets that were used in this study were taken from New York City, USA and from the city of Limassol, Cyprus. Analytical and numerical techniques and artificial methods such as Artificial Neural Network (ANN) and fuzzy inference system were applied to the data. The aim of developing this methodology was to assess the water main breaks in the urban water distribution network. Christodoulou et al. [37] presented numerical results of degradation modeling for water supply systems in urban areas. The data that was used in this work was collected from New York City, and parametric and non-parametric statistical methods were deployed on the collected data. ANN was also used to identify the primary risk factors and their correlation to the water core breaks. Many factors such as pipeline age, width, material, site, previous damages, etc., were considered herein for risk assessment. The key goal of the research work was to develop a framework of risk assessment models for the degradation of water distribution systems. Further, it was combined with GIS to assist the caretaker in the maintenance of large water distribution networks in urban areas. Christodoulou et al. [4] proposed an optimistic risk-based integrity-monitoring approach in order to manage the water distribution networks. Their suggested framework is a blend of ANN, parametric, and nonparametric survival analyses, and it is deployed in order to estimate the time-to-failure for pipe networks.
3. Proposed Model for Water Supply Pipeline Risk Index Assessment and Visualization
Many authors applied fuzzy logic for risk assessment in different fields, but the central problem with simple fuzzy logic is the curse of dimensionality. The main challenging task while designing hierarchical fuzzy logic is to design a full structure fuzzy logic with minimum rules. Water supply pipeline risk assessment is a challenging task because numerous factors are involved in assessing the water supply pipeline risk. For accurate risk assessment, many parameters are normally considered. As new parameters enter into the system, rules in the rule base also increase exponentially in conventional fuzzy logic. It is very necessary to tackle the curse of dimensionality because it is tedious to design hundreds or thousands of rules precisely. Rule designing requires extensive concentration and any incorrect rule may lead to unforeseen results. Hence, it is necessary to design a fuzzy logic-based model with a minimum number of rules. In this study, we designed a fuzzy logic model for water supply pipeline risk assessment based on hierarchical fuzzy logic with a special structure, named the blended hierarchical fuzzy logic model. In this study, we applied the blended hierarchical fuzzy logic to real data in order to test its accuracy. Further, the blended hierarchical fuzzy logic is combined with GIS in order to visualize the risk index calculated through the blended hierarchical fuzzy logic model. The key purpose of using GIS in the proposed method is to provide a graphical interface for the caretaker. The risk index visualization is necessary to trace the risk index location and to obtain quick measurements before any accident.
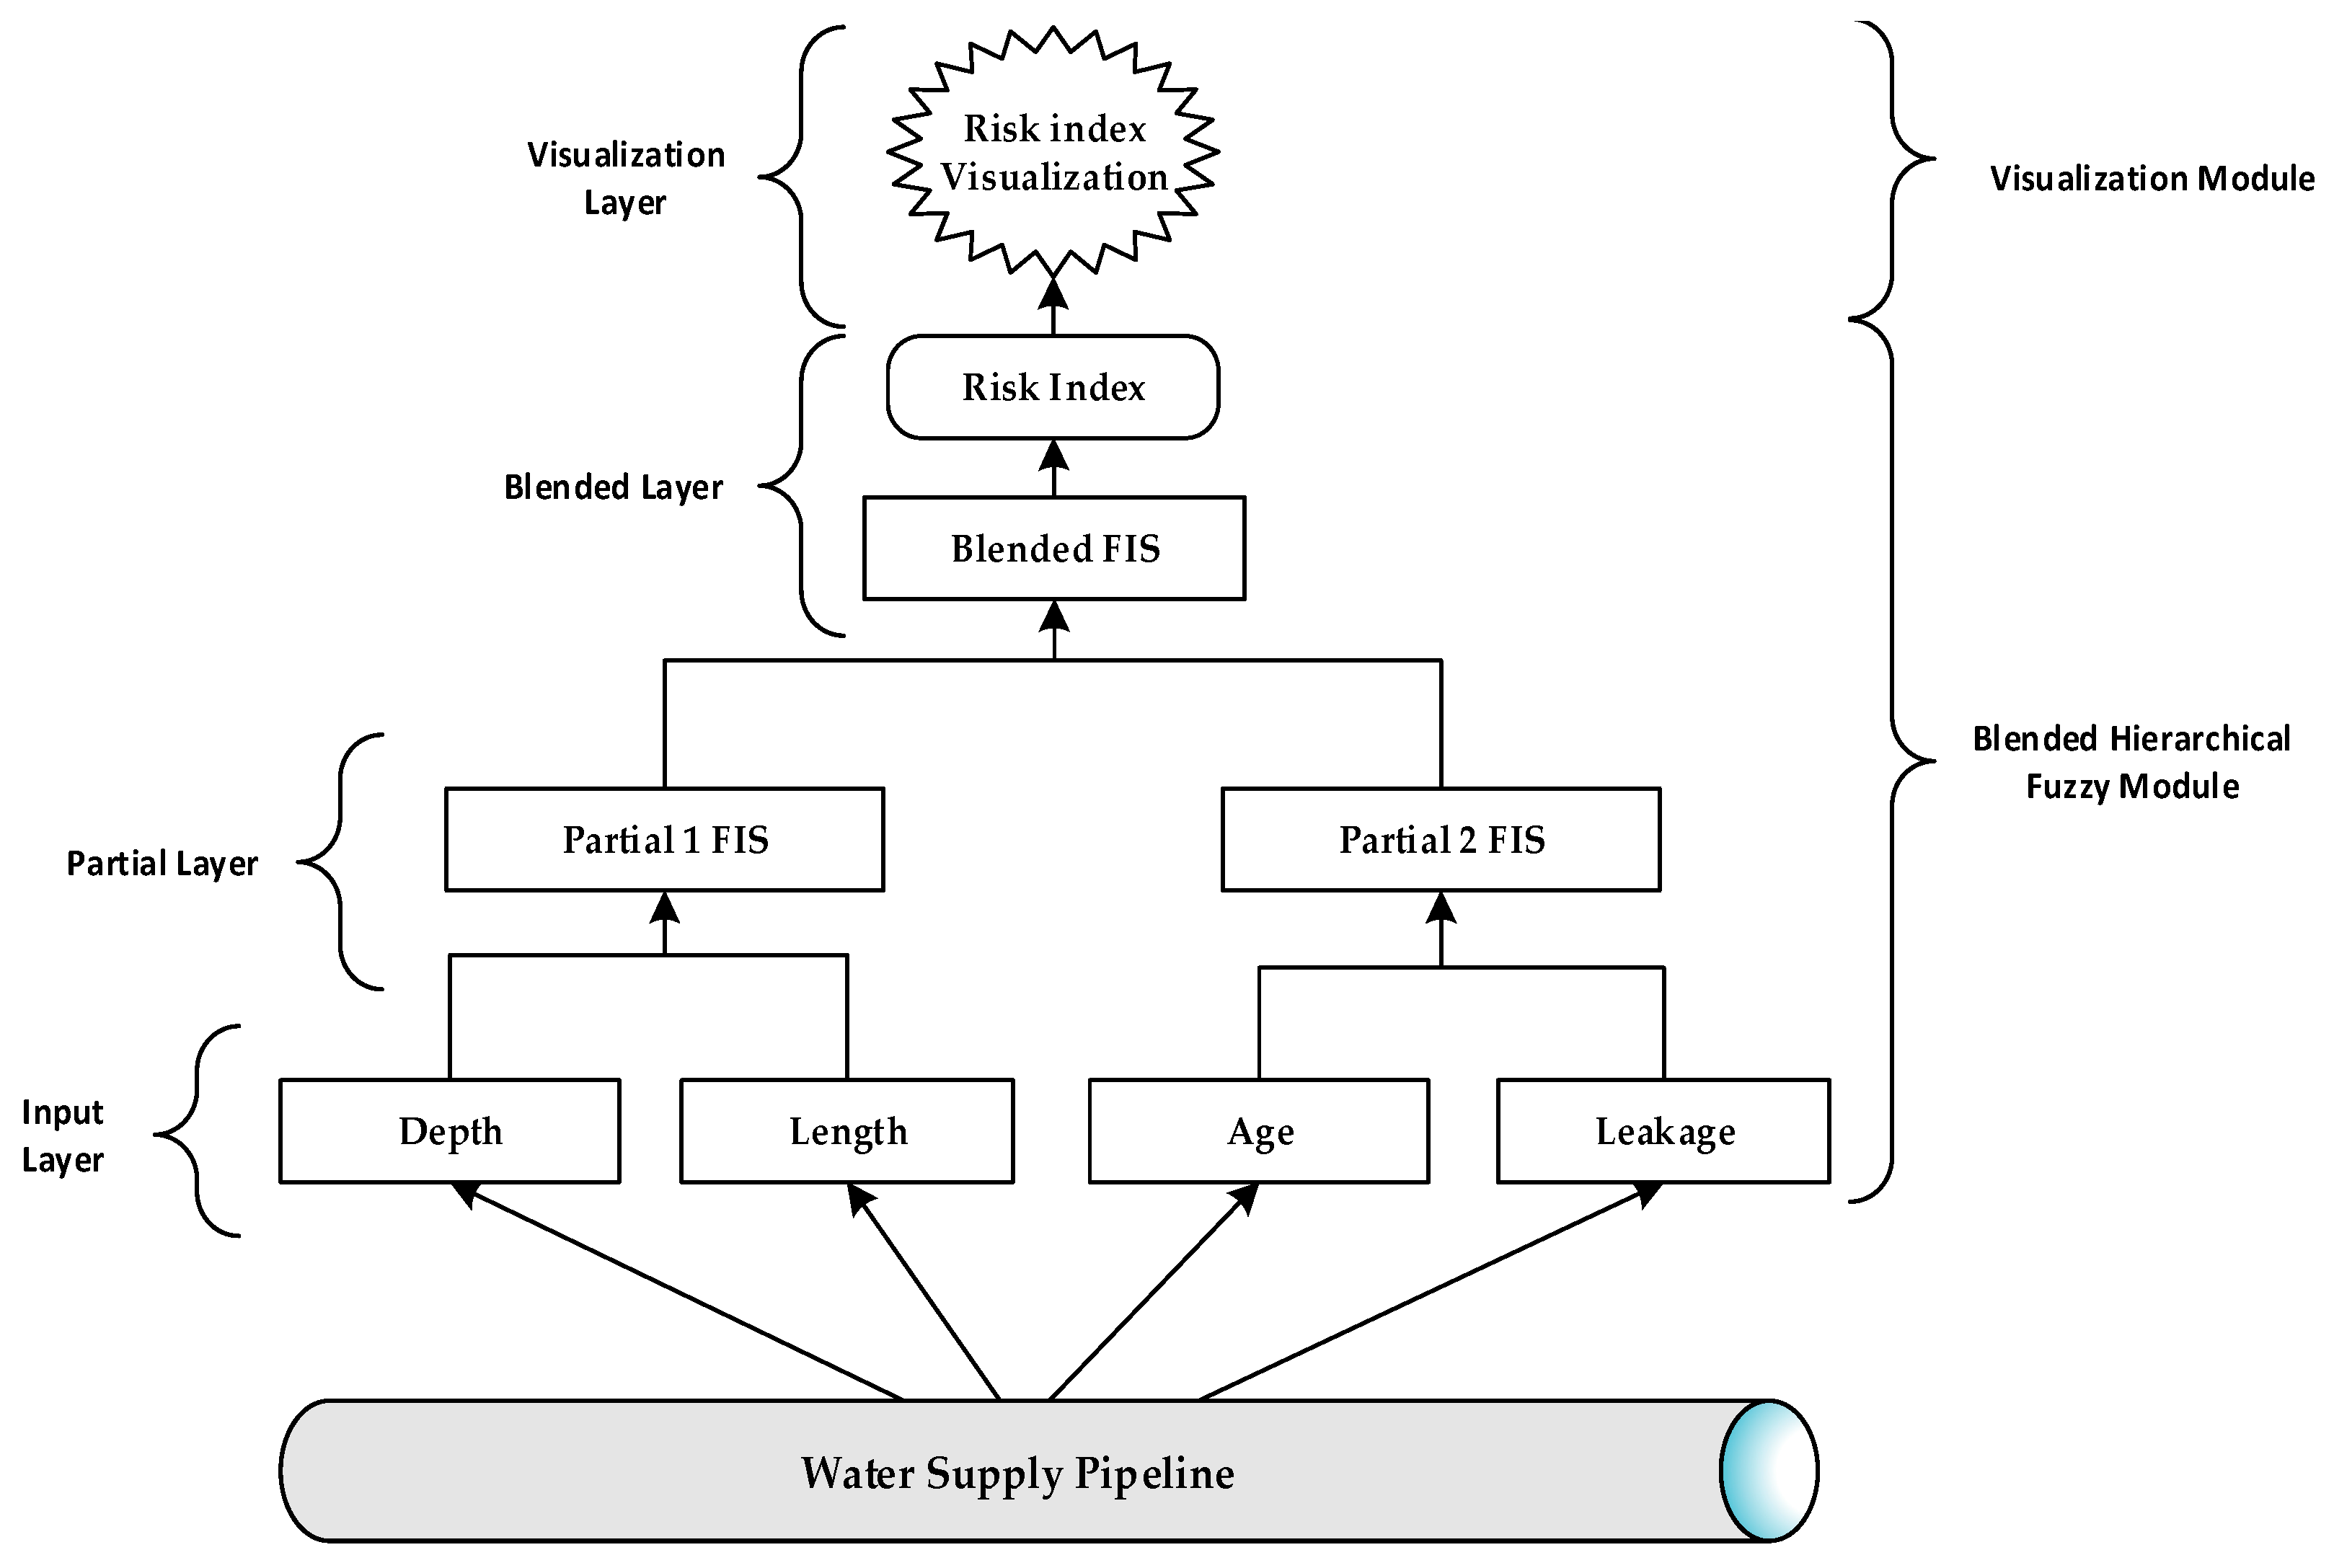
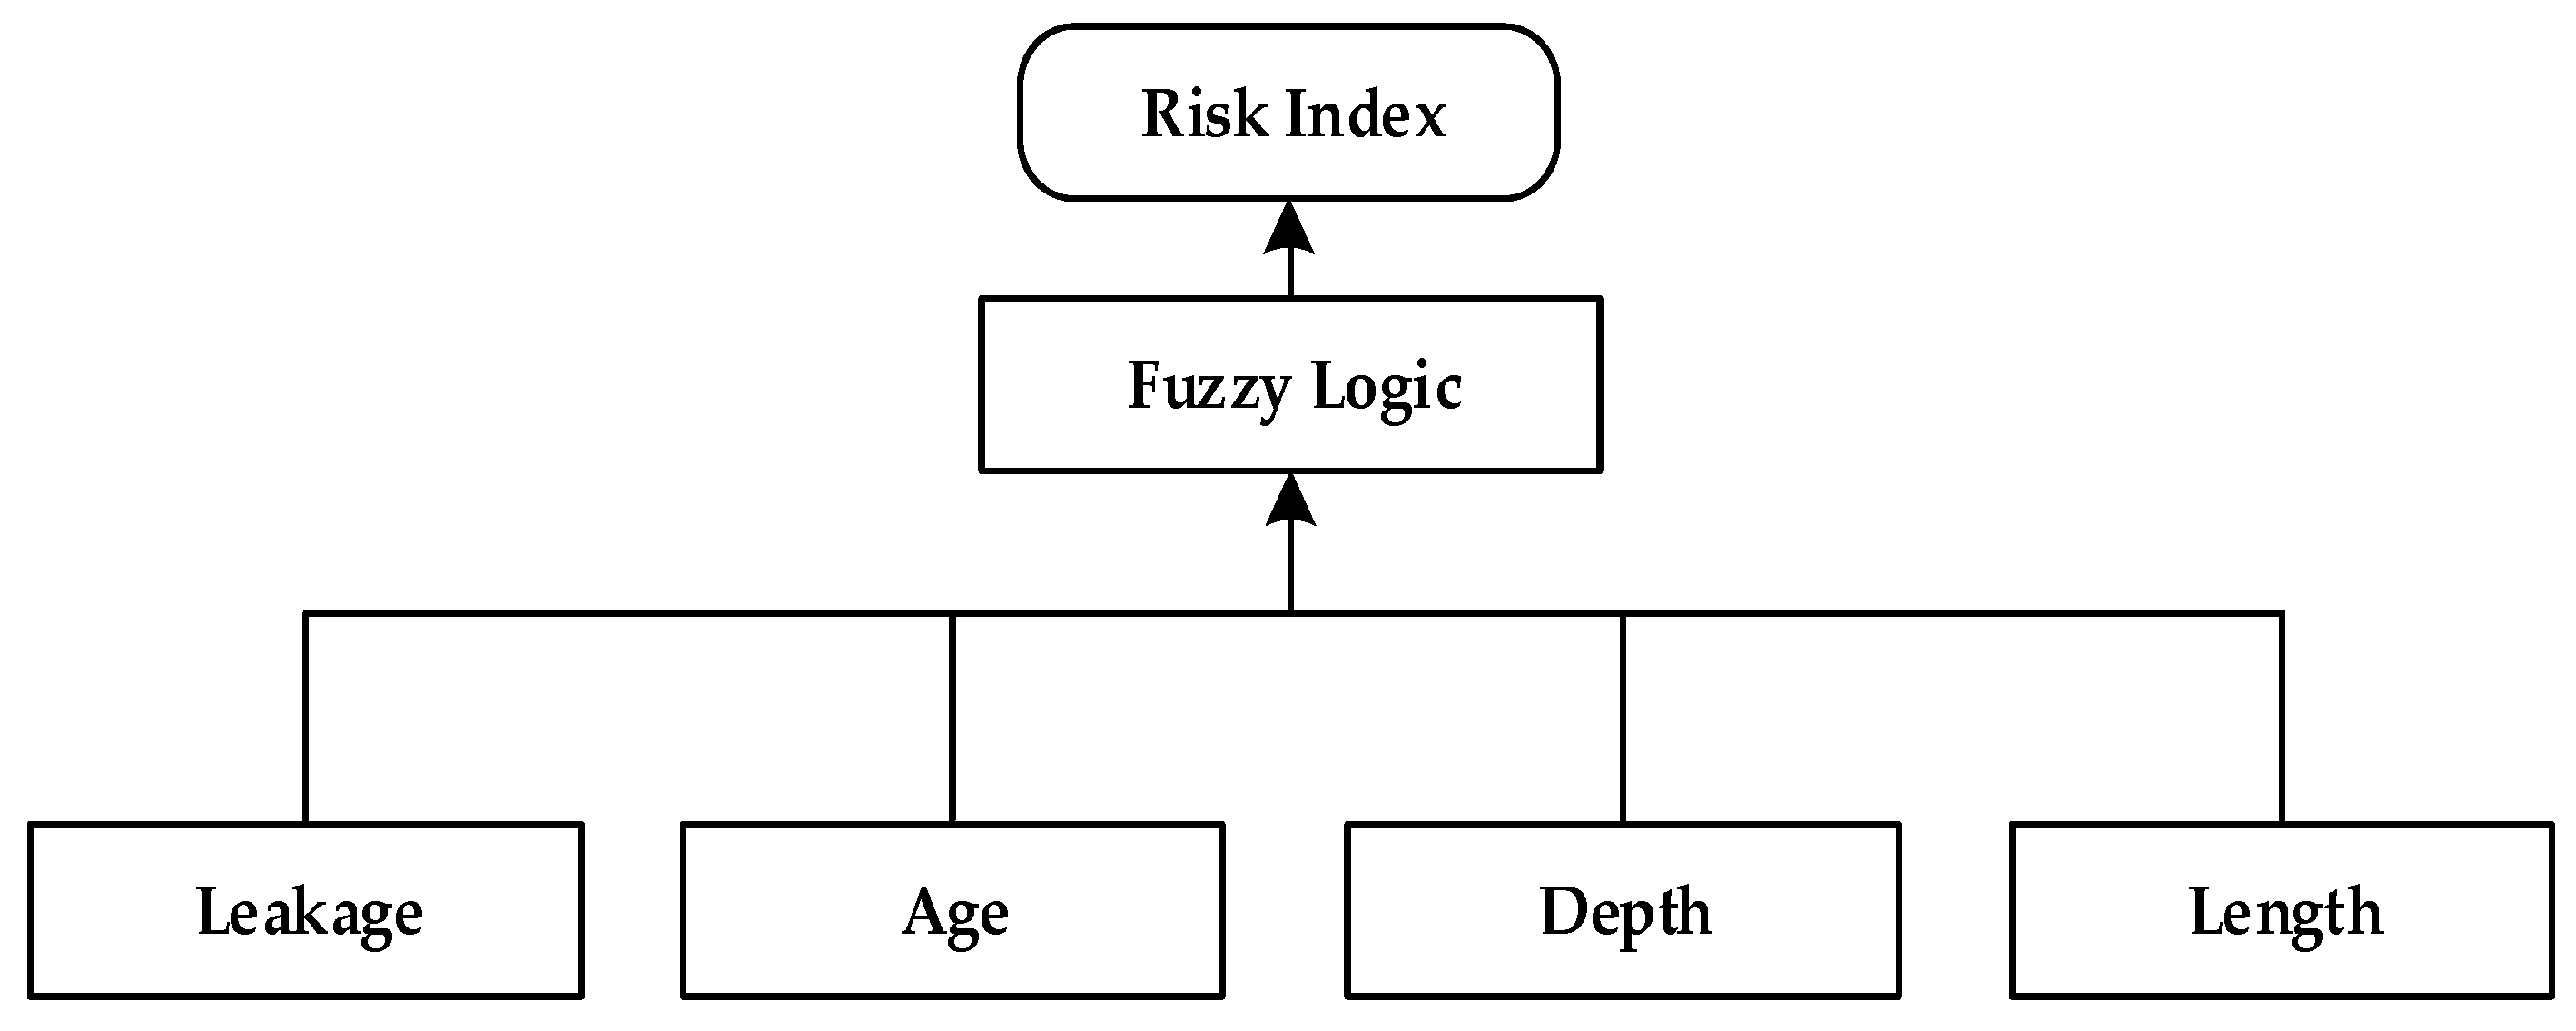
Figure 1 shows the proposed model for water supply pipelines risk index assessment and visualization. The proposed model is mainly comprised of two sub-modules, namely the blended hierarchical fuzzy logic module and the water supply risk index visualization module. The blended hierarchical fuzzy logic module further consists of three layers, namely the input layer, partial layer, and blended layer. The input layer consists of four parameters, namely the leakage, length, depth, and age of water supply pipeline. Further, these parameters are used as inputs to the partial layer; the partial layer consists of two modules, namely partial 1 fuzzy inference system (P1_FIS) and partial 2 fuzzy inference system (P2_FIS). The parameters depth and length are used as inputs to partial 1 FIS and the age and leakage parameters are used as inputs to partial 2 FIS. These two modules return partial risk index values for the water supply pipeline. Further, these partial risk values are provided to blended layers as inputs. The third layer of the proposed blended hierarchical fuzzy model is the blended layer that consists of a single module named the blended fuzzy inference system (B_FIS). The blended FIS receives the outputs of P1_FIS and P2_FIS as inputs. The B_FIS returns the overall risk index for the water supply pipeline. The conventional FIS for four input parameters is given in Figure 2.
The second module of the proposed model is the visualization, in which the water supply pipeline risk index is visualized using the GIS map. Input values to the visualization module are the water supply pipeline risk index values computed by the blended hierarchical fuzzy logic model and those risk index values are plotted on the GIS map to indicate different risk index levels.
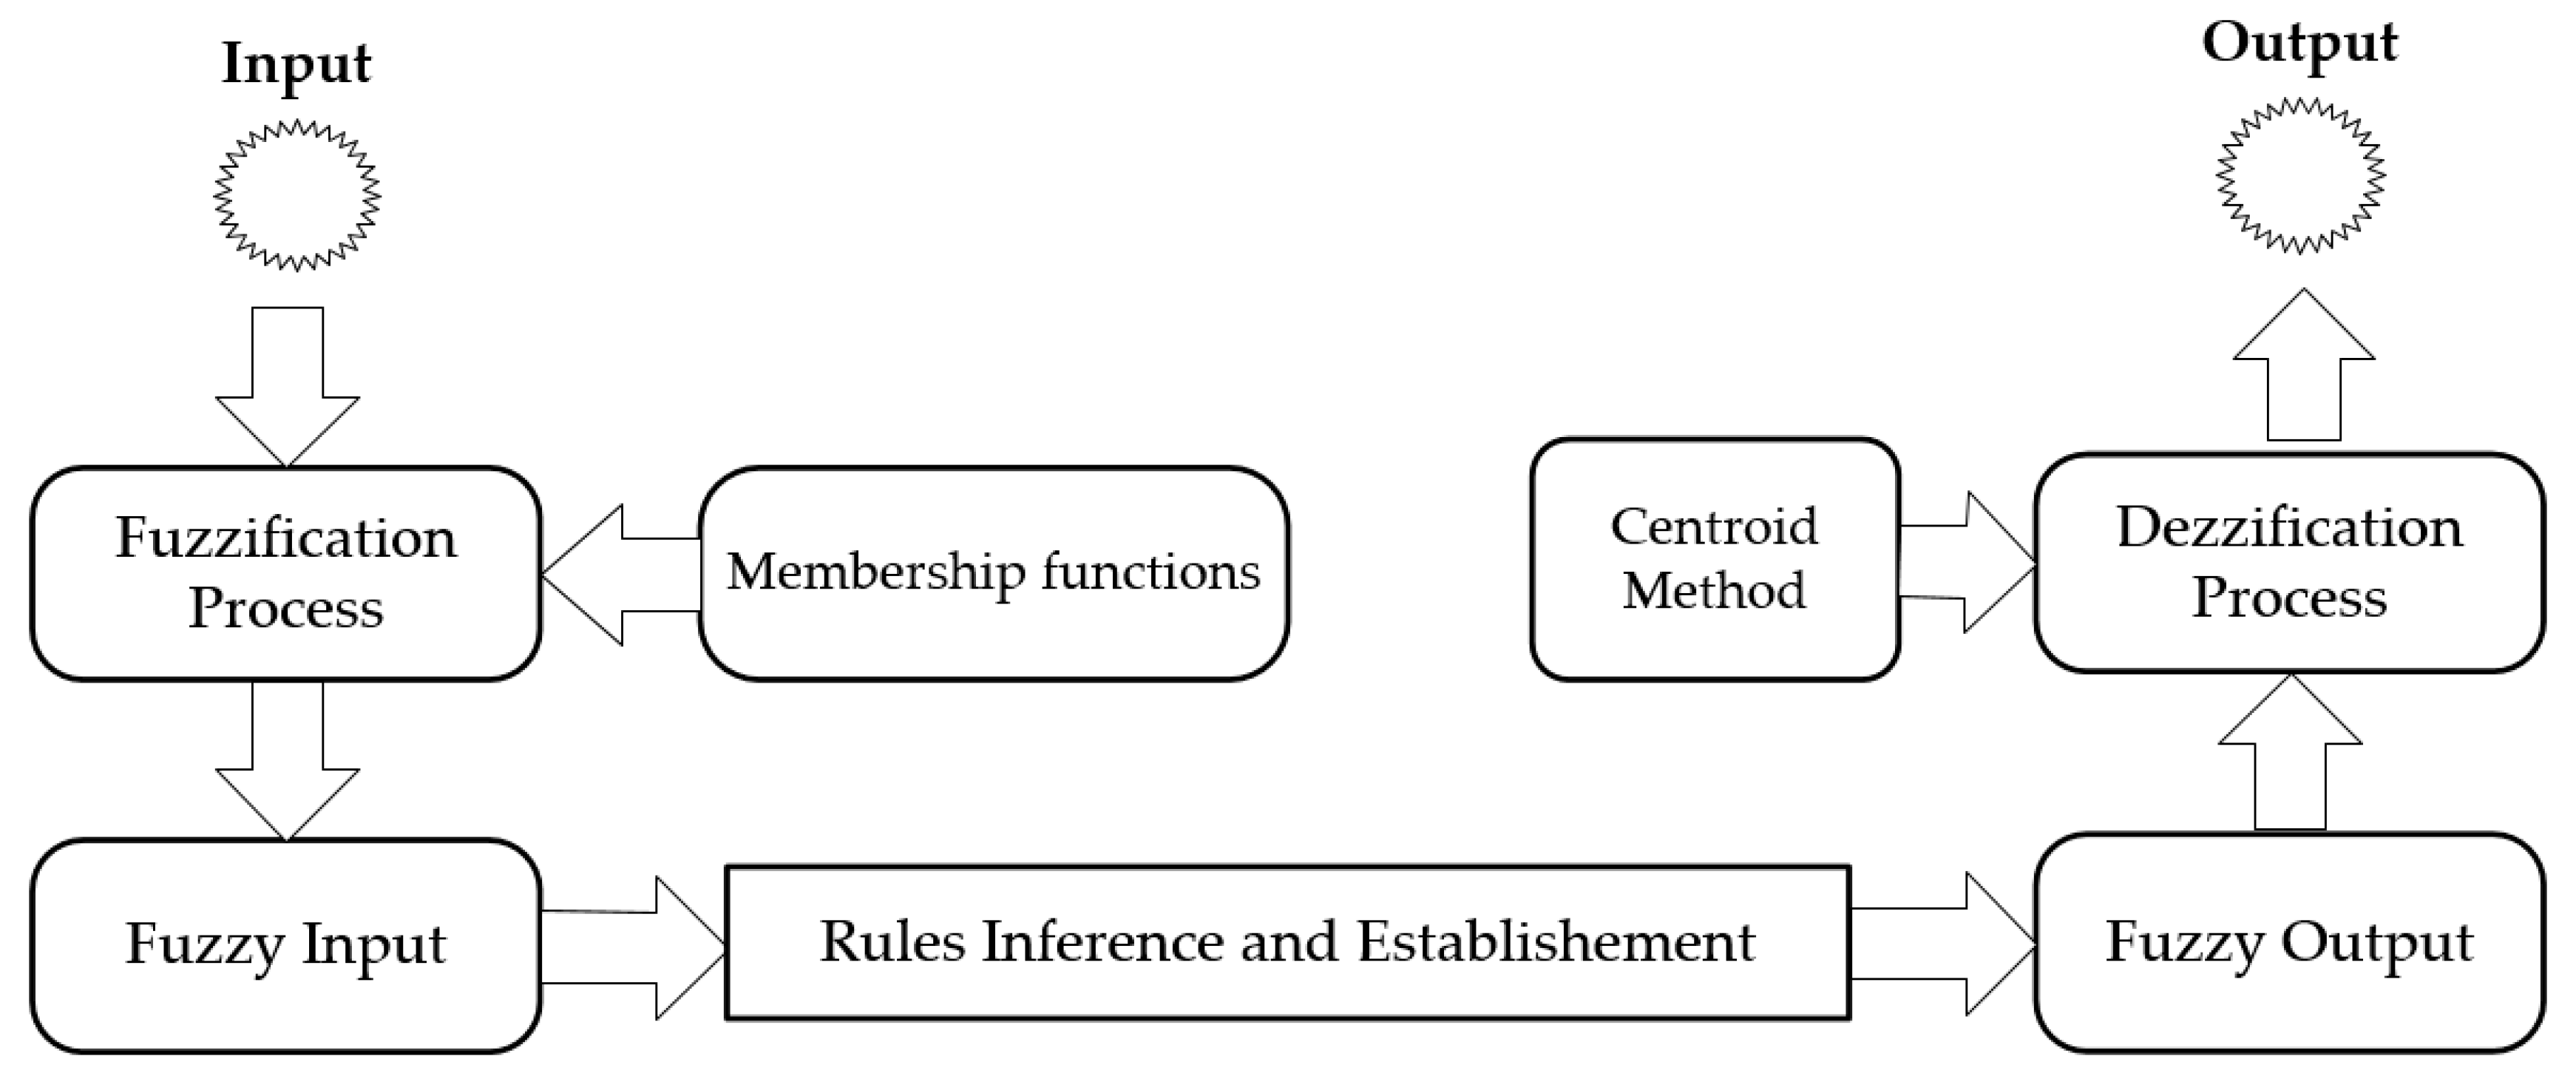
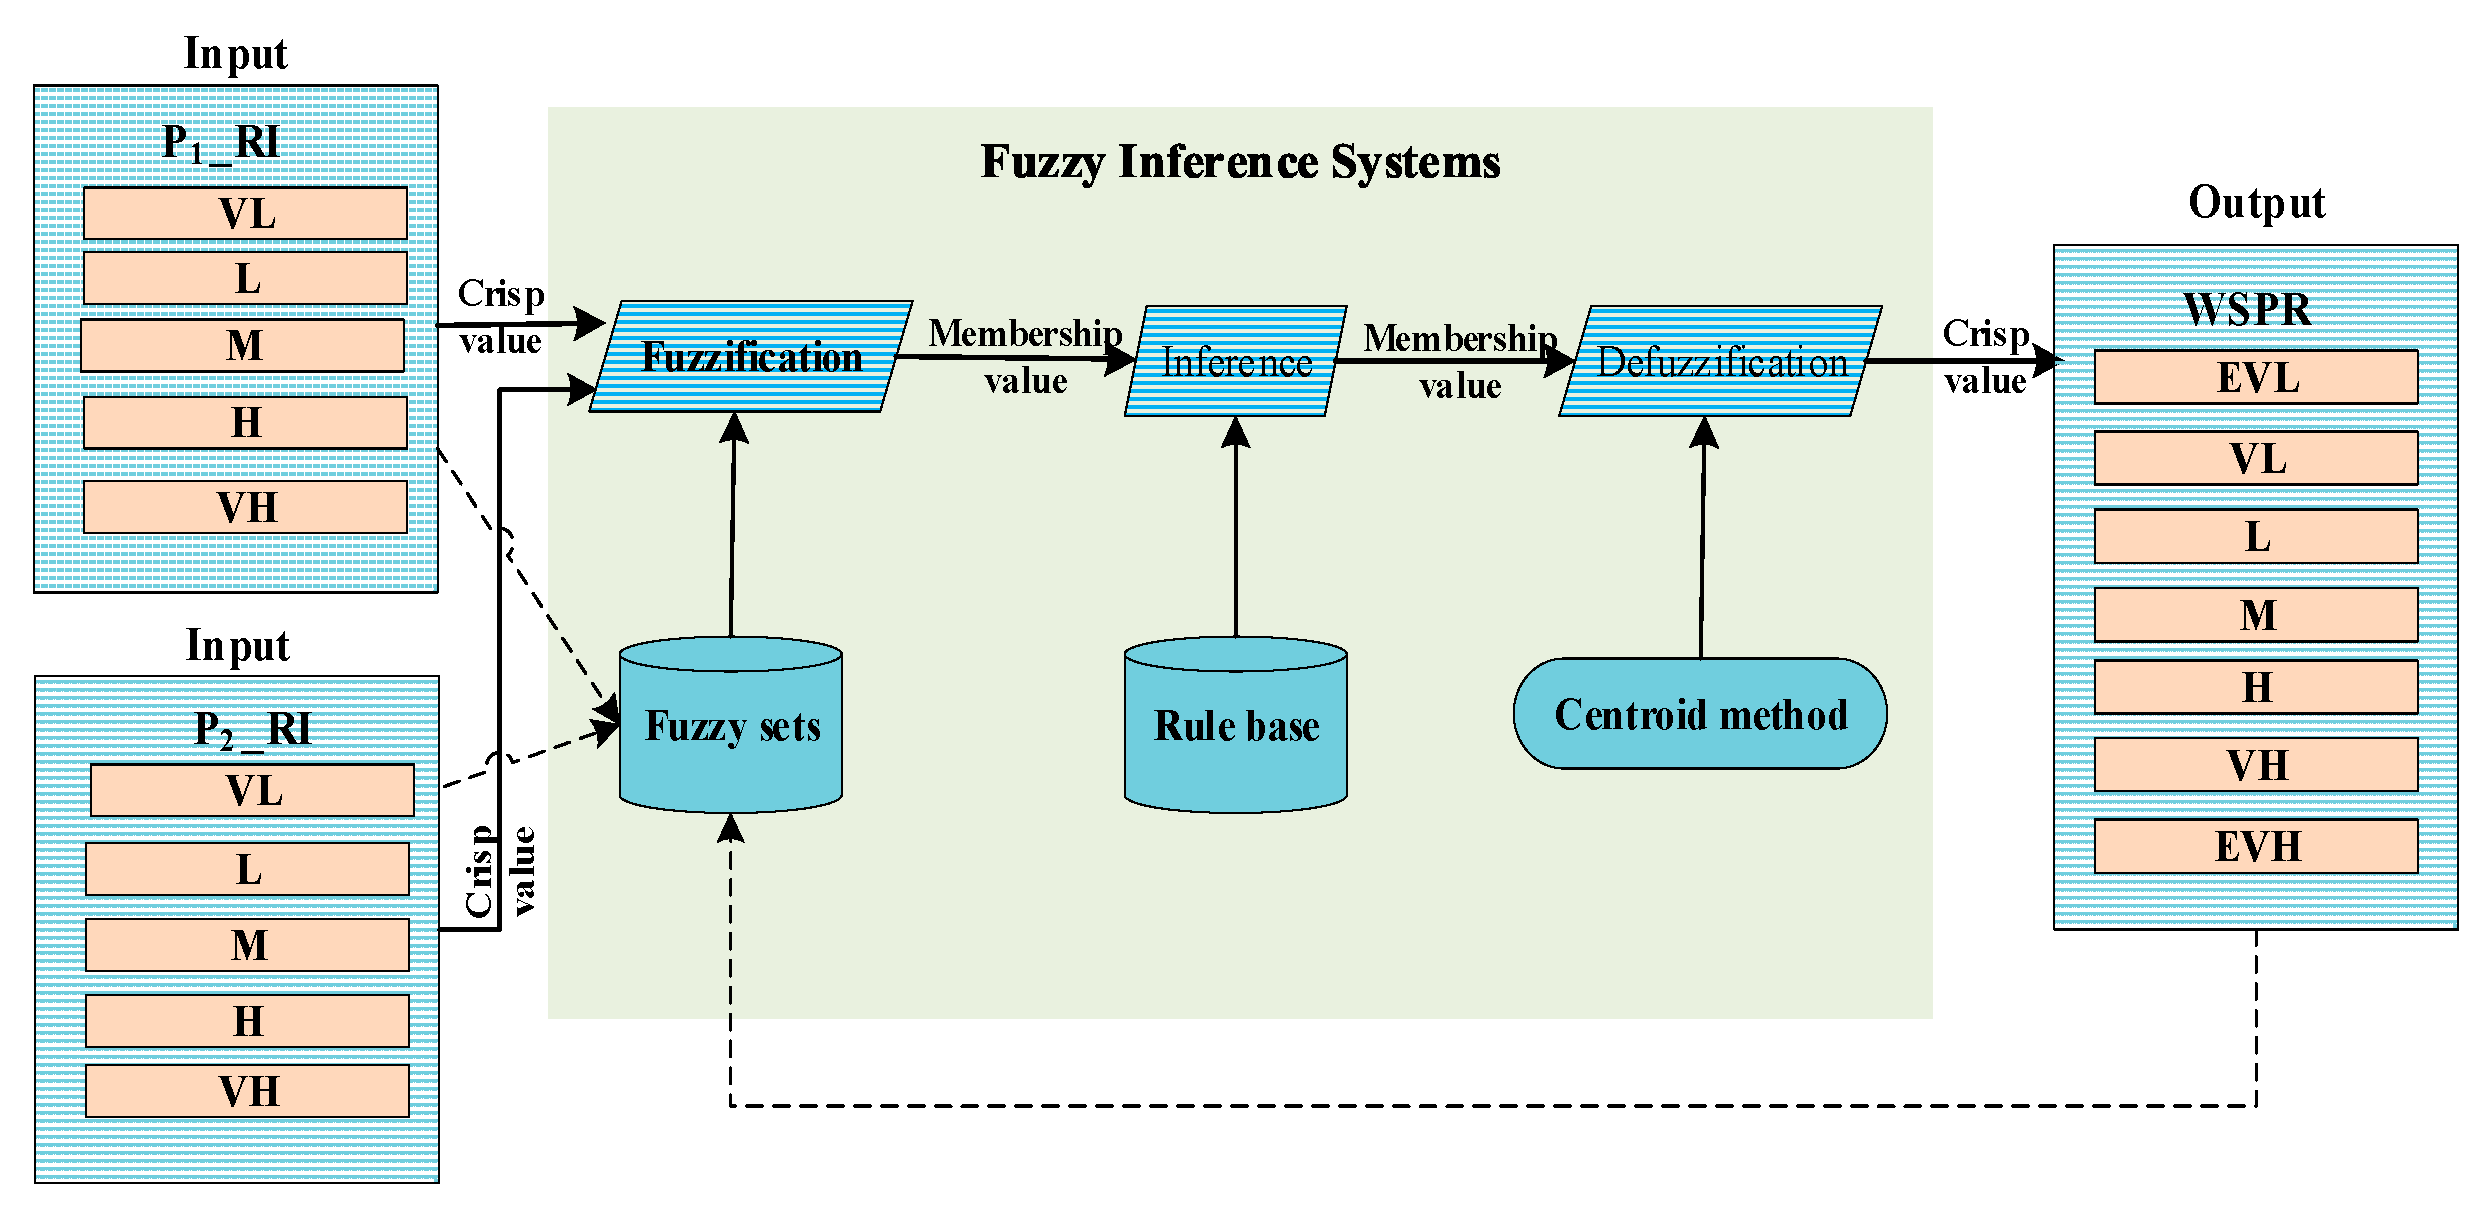
In 1965, Zadeh introduced the idea of fuzzy set theory; this theory now has many applications in different fields, such as engineering sciences, medical sciences, and computer sciences [38]. In this study, we used a Mamdani fuzzy inference system (FIS) in each module of the proposed blended hierarchical fuzzy logic model. The main advantage of Mamdani FIS is simplicity. The rule designing of Mamdani FIS is more simple and efficient compared to the Takagi-Sugeno-Kang fuzzy inference system. The main components of Mamdani FIS are the fuzzifier, knowledge base, inference engine, and defuzzifier. The fuzzifier uses membership functions (MFs) to generate fuzzy values from input values. Then the rules are evaluated in the knowledge base and the maximum aggregation of each consequent membership function values is calculated. The defuzzifier takes fuzzy values as input and generates the crisp values as output [11]. Membership functions play a key role in fuzzy logic construction and operations. Mamdani’s minimum operator method was used for inference and this was defuzzified to a crisp control signal using the center-of-gravity method. The structure diagram of the Mamdani FIS used in this study for each fuzzy inference system is shown in Figure 3.
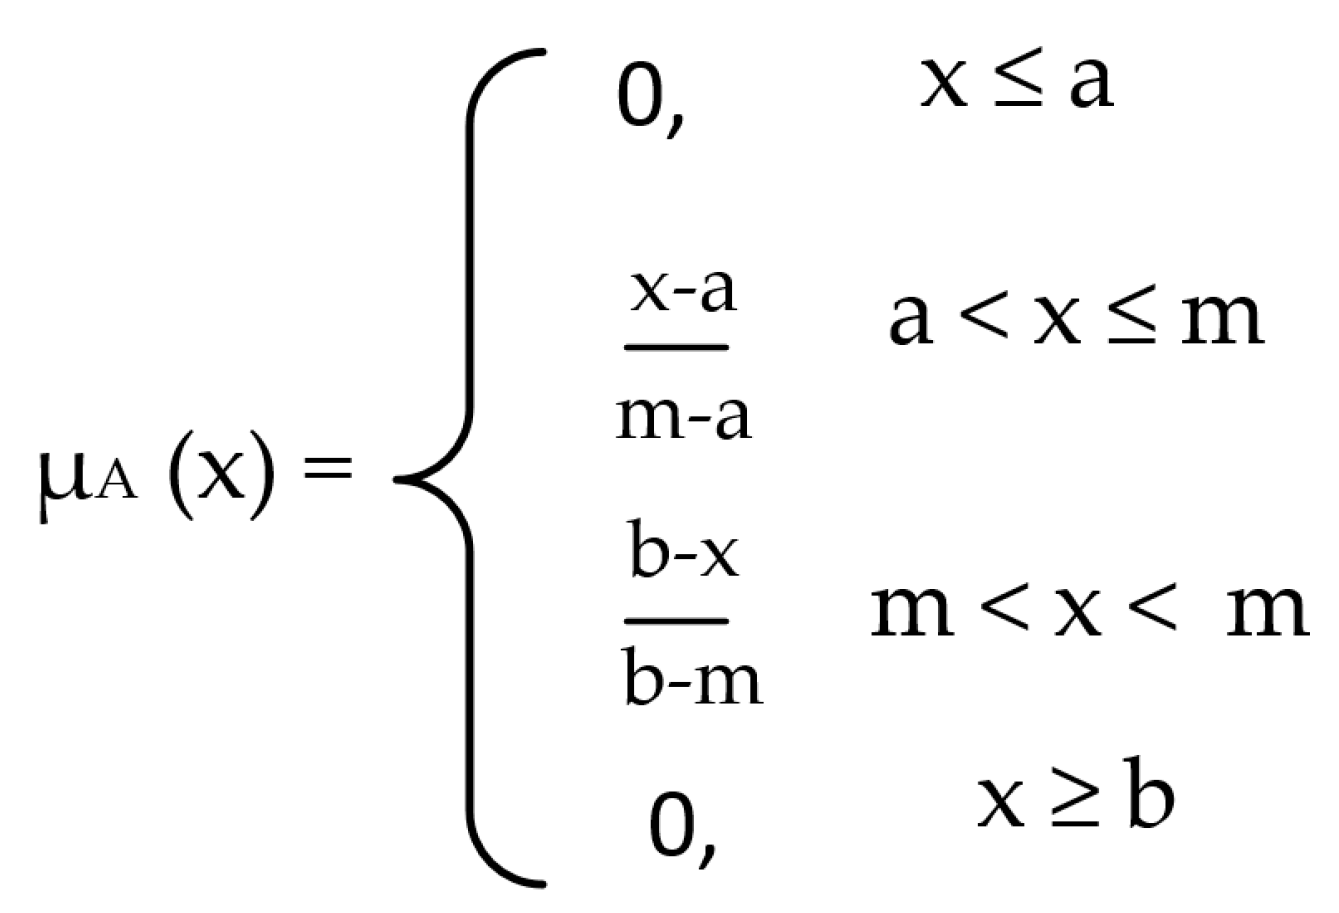
In the literature, there are many types of membership functions (Gaussian, bell-shaped, sigmoid, etc.) that can be used in the Mamdani FIS for fuzzification and defuzzification. The triangle membership functions are more effective and most commonly used in the Mamdani fuzzy inference system [14,39]. In this study, we defined triangular membership functions for each input/output variable in each FIS due to their computational simplicity. As shown in Figure 4, the triangular MF needs only three parameters (a, m, b) to be defined. The parameters a, b, and m respectively represent the lower limit, an upper limit, and a value, where a < m < b. Also, x represents the actual value.
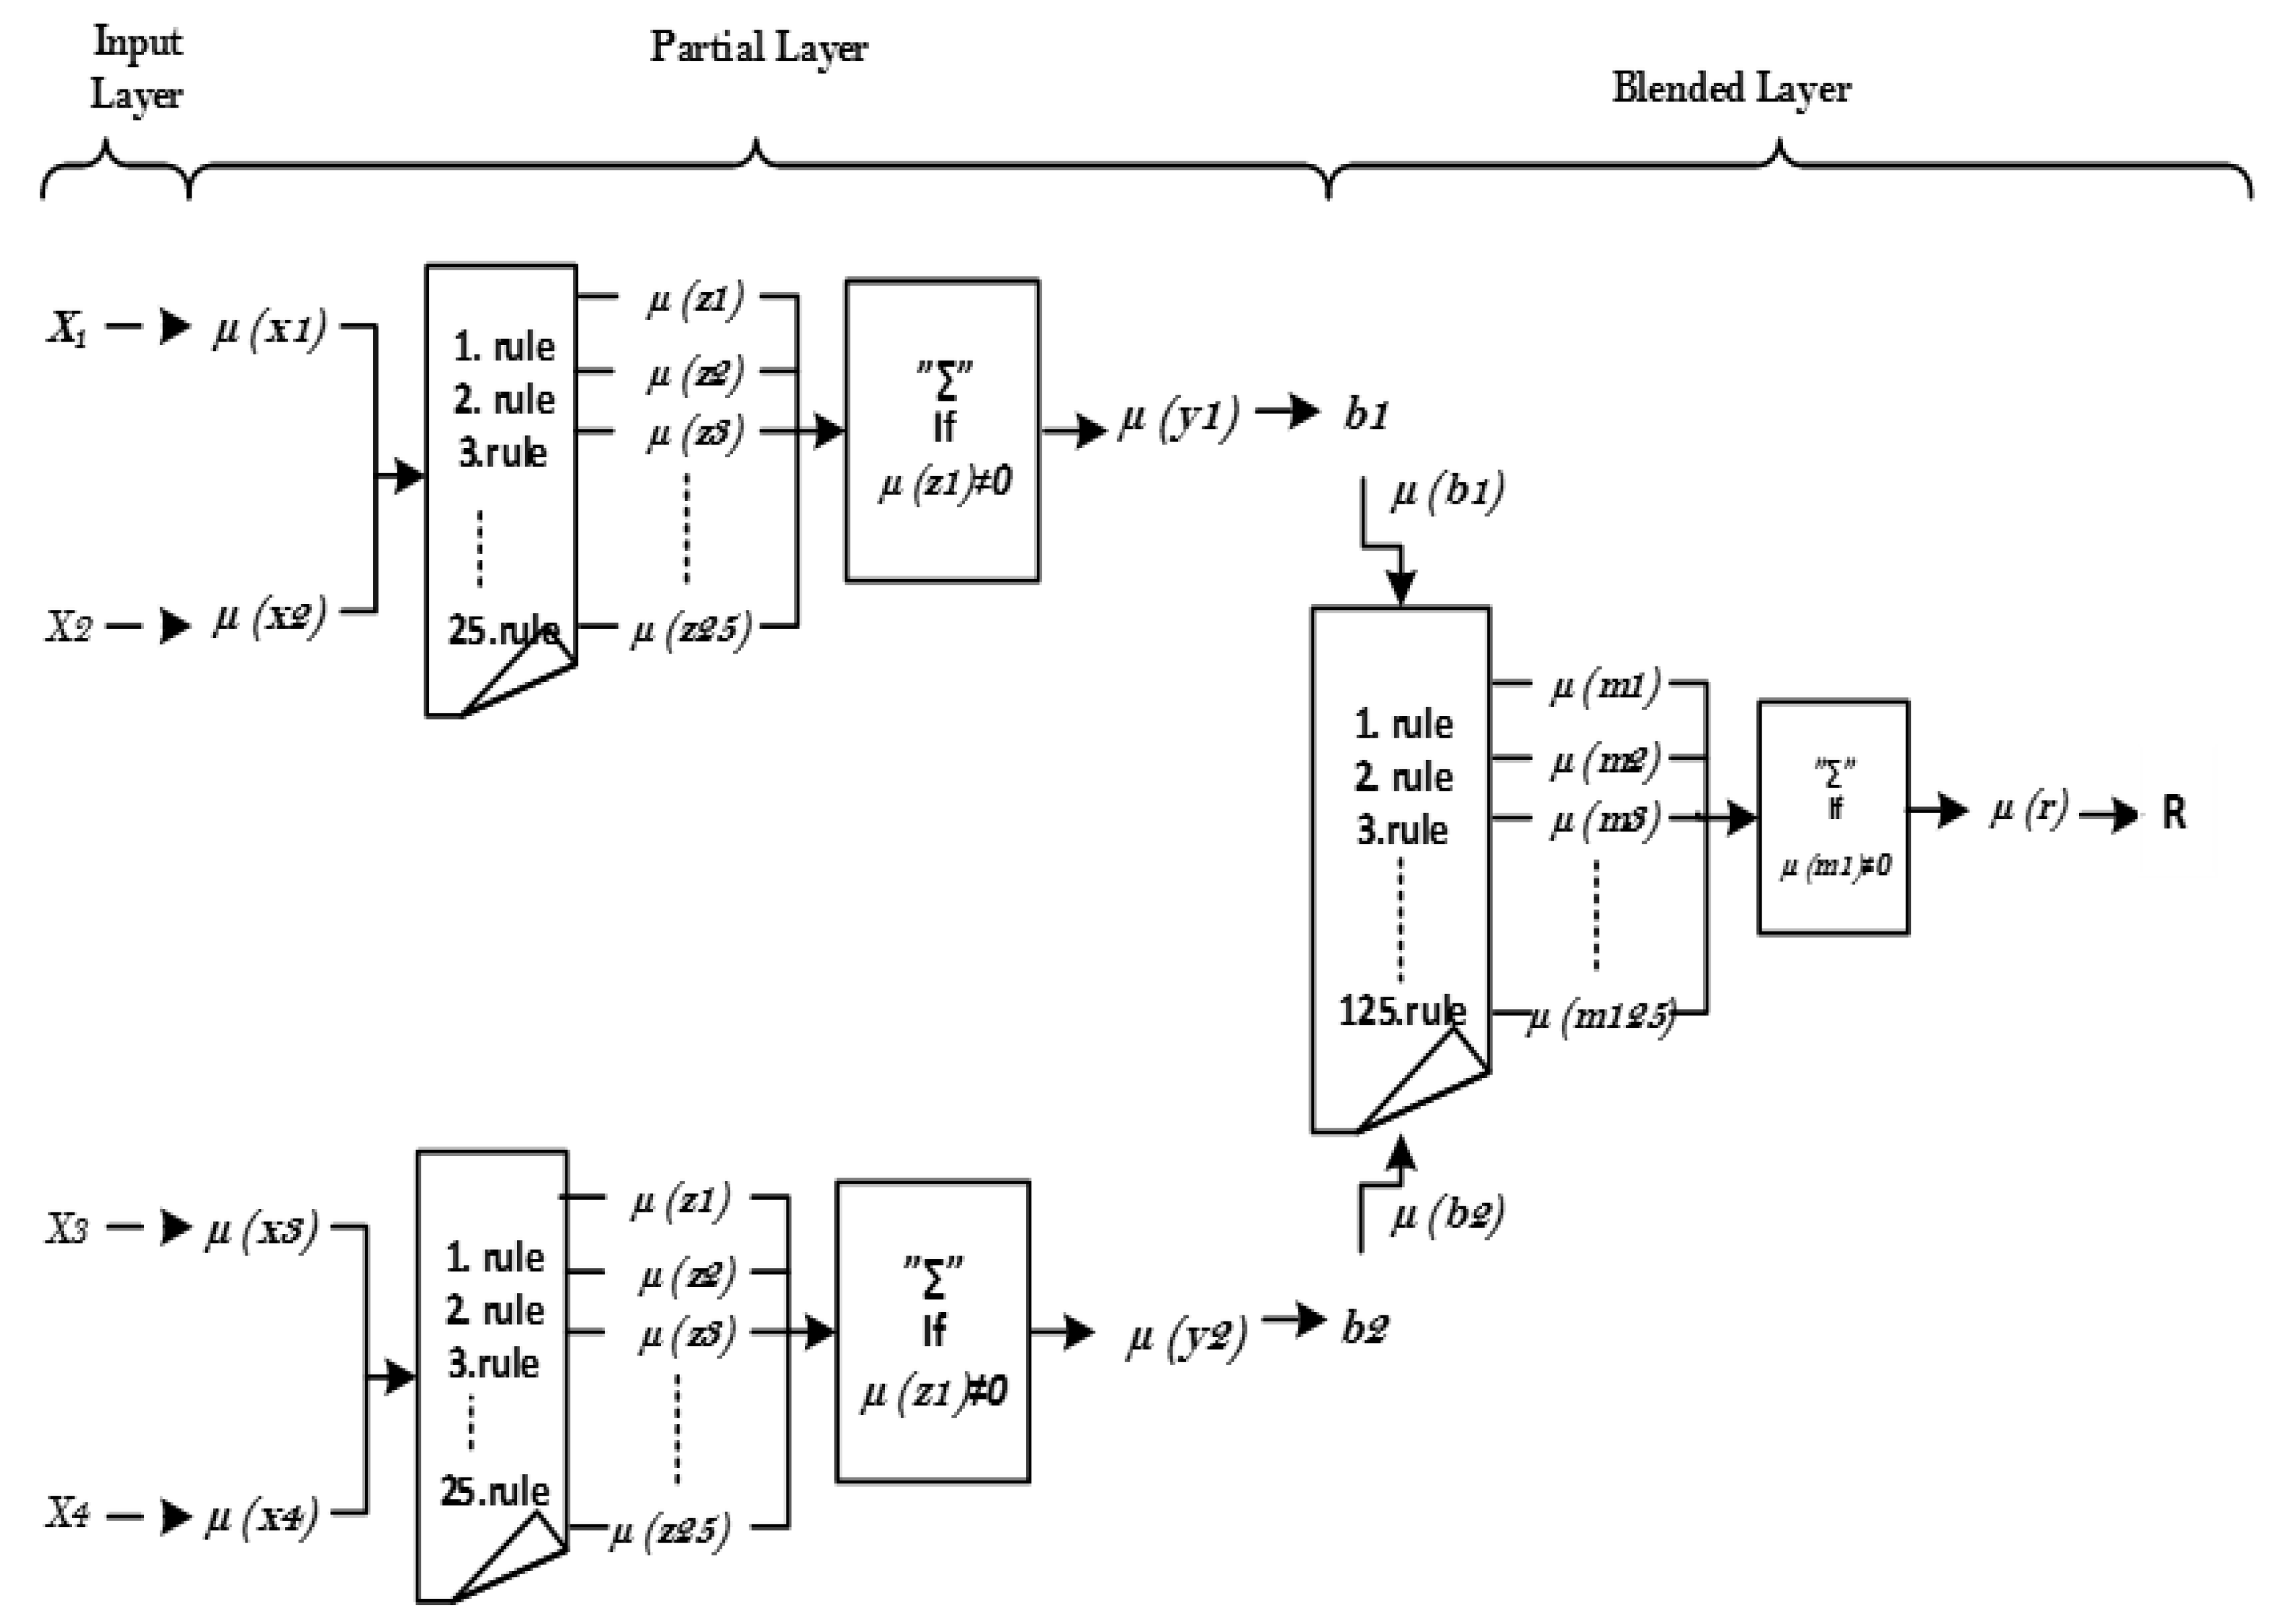
Figure 5 shows the proposed blended hierarchical fuzzy model in detail. The processing of each component of the proposed model is explained in detail. The symbols for input parameters of depth, length, age and length are X1, X2, X3 and X4, respectively. μ(xi) returns fuzzy values where i = 1, 2, 3, 4 for the partial layer. μ(zj) returns implicated fuzzy values where j = 1, 2, 3 … 25. μ(yk) returns the final output of FIS where k = 1, 2 for the partial layer. The outputs of P1_FIS and P2_FIS are represented by b1 and b2. μ(bi) returns fuzzy values where i = 1, 2 in the blended layer. μ(mj) returns implicated fuzzy values where j = 1, 2 … 25. μ(r) is the final risk index value of the blended layer FIS and the proposed model.
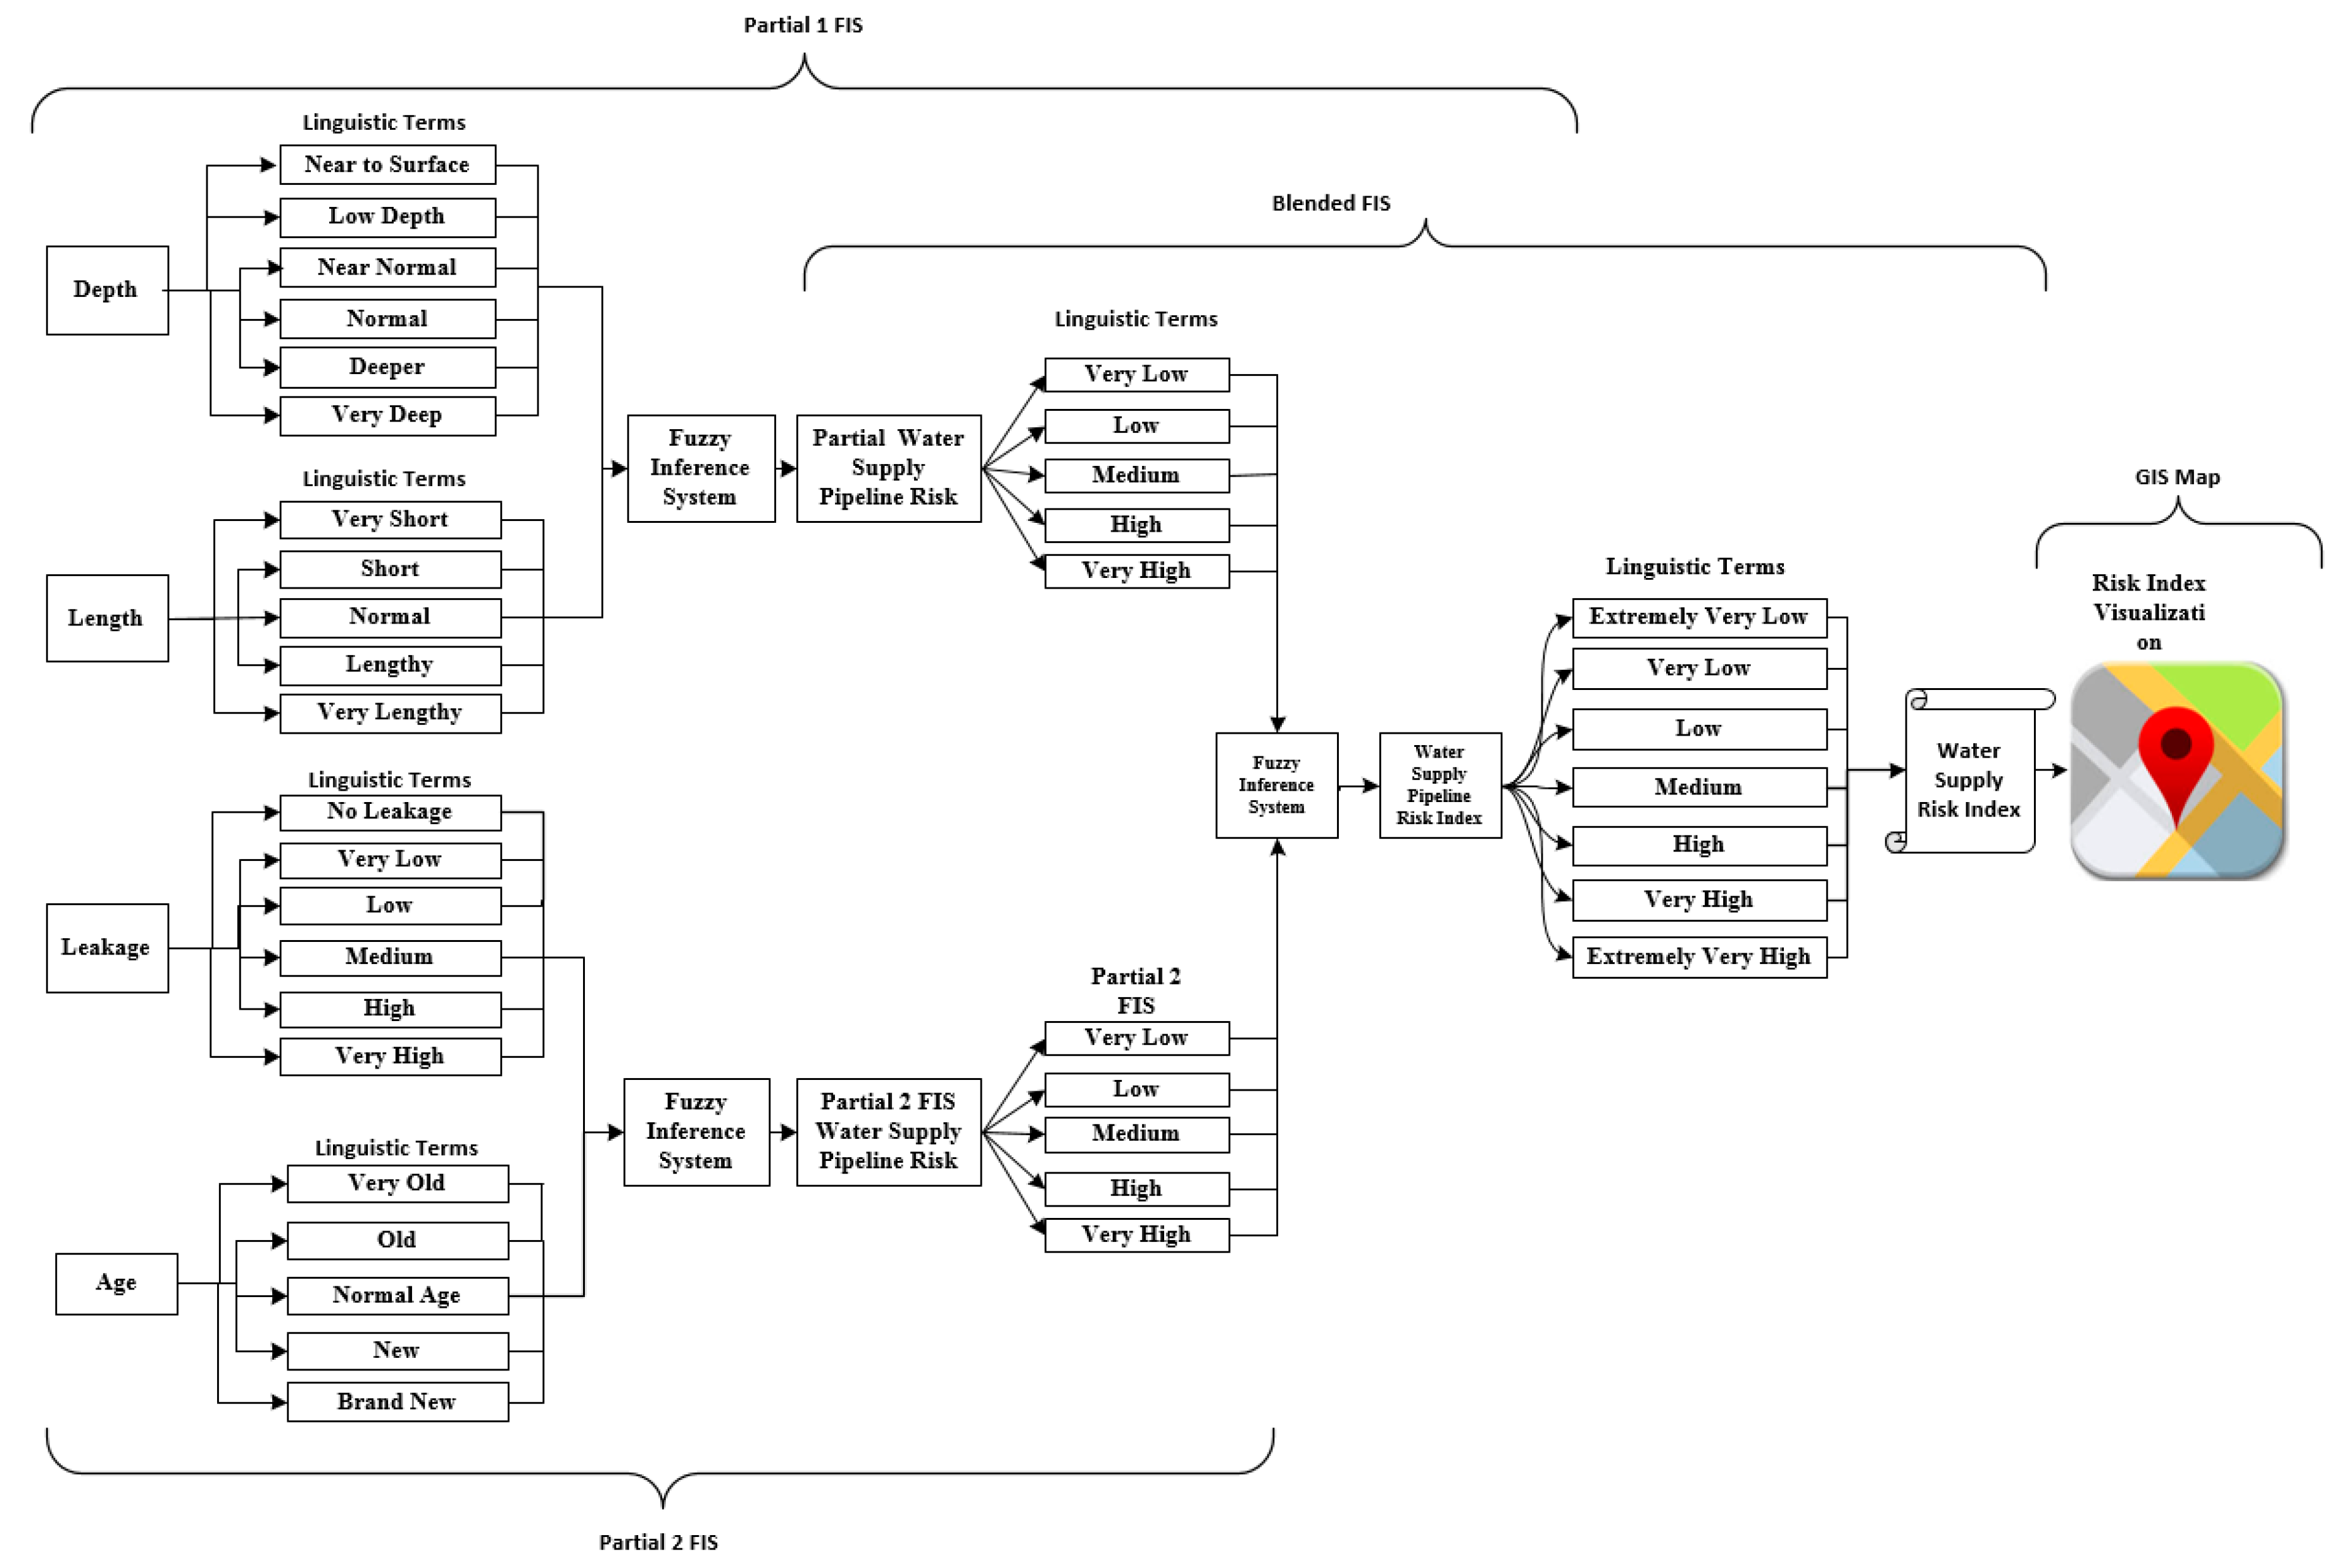
In our proposed blended hierarchical fuzzy logic model, we used three main modules and each module contains a fuzzy logic. Each fuzzy logic has two input variables and one output variable. We defined a different number of membership functions for each variable depending on the data variation. More membership functions were defined for the data with more variations. In order to find the variation of data, we can inspect the data visually or we can find the standard deviation. We defined more membership functions for more variant data in order to better represent the data. The variation can be found by the visual method, but in the proposed work we calculated the standard deviation in order to find the variation in each parameter. The threshold was then set according to the standard deviation value and the distribution and number of membership function were carried out according to threshold values. For rule designing, we obtained some help from experts working on this project as well as from the tendency of the data. Figure 6 shows the number of membership functions assigned to each variable and the linguistic terms defined for each membership function of each variable in FIS used in the proposed model. In proposed model we used three fuzzy logics, namely, P1_FIS, P2_FIS, and the blended fuzzy inference system (B_FIS). The P1_FIS has two inputs, namely depth and length. The fuzzy sets of depth are defined as Near to Surface (NS), Low Depth (LD), Near Normal (NN), Normal (N), Deeper (D), and Very Deeper (VD). Similarly, five fuzzy sets are defined for the input variable length: Very Short (VS), Short (S), Normal (N), Lengthy (L), and Very Lengthy (VL). The partial 2 layer also has two inputs, namely leakage and age. Six fuzzy sets are defined for input variable leakage: No Leakage (NL), Very Low (VL), Low (L), Medium (M), High (H), and Very High (VH). Similarly, five fuzzy sets are defined for age: Very Old (VO), Old (O), Normal Age (NA), New (N), and Brand New (BN). The P1_FIS logic has one output variable, the partial 1 water supply pipeline risk index. Similarly the P2_FIS logic also has one output variable, the partial 2 water supply pipeline risk index. For both variables, five fuzzy sets are defined as follows: Very Low (VL), Low (L), Medium (M), High (H), and Very High (VH). The partial 1 and partial 2 water supply pipeline risk variables are further inputs to the blended fuzzy inference system. B_FIS has one output variable, the water supply pipeline risk index. The output of the blended fuzzy inference system is the final risk index value of the blended hierarchical fuzzy logic model. The risk index values are further visualized on the GIS map in order to enable the caretaker to take measures before the occurrence of any abnormality.
The number of rules in a fuzzy inference system depends on the number of input/output variables and the number of membership functions. To define all possible rules in the proposed blended hierarchical fuzzy logic and conventional fuzzy logic, Equations (1) and (2) are used, respectively:
where h represents the number of levels of modules, represents the input variable and i = 1, 2, 3, 4…. N represents fuzzy sets defined for input variable A. Similarly is the second input variable and j = 1, 2, 3….M represents fuzzy sets defined for B. represents the fuzzy logics in each level.
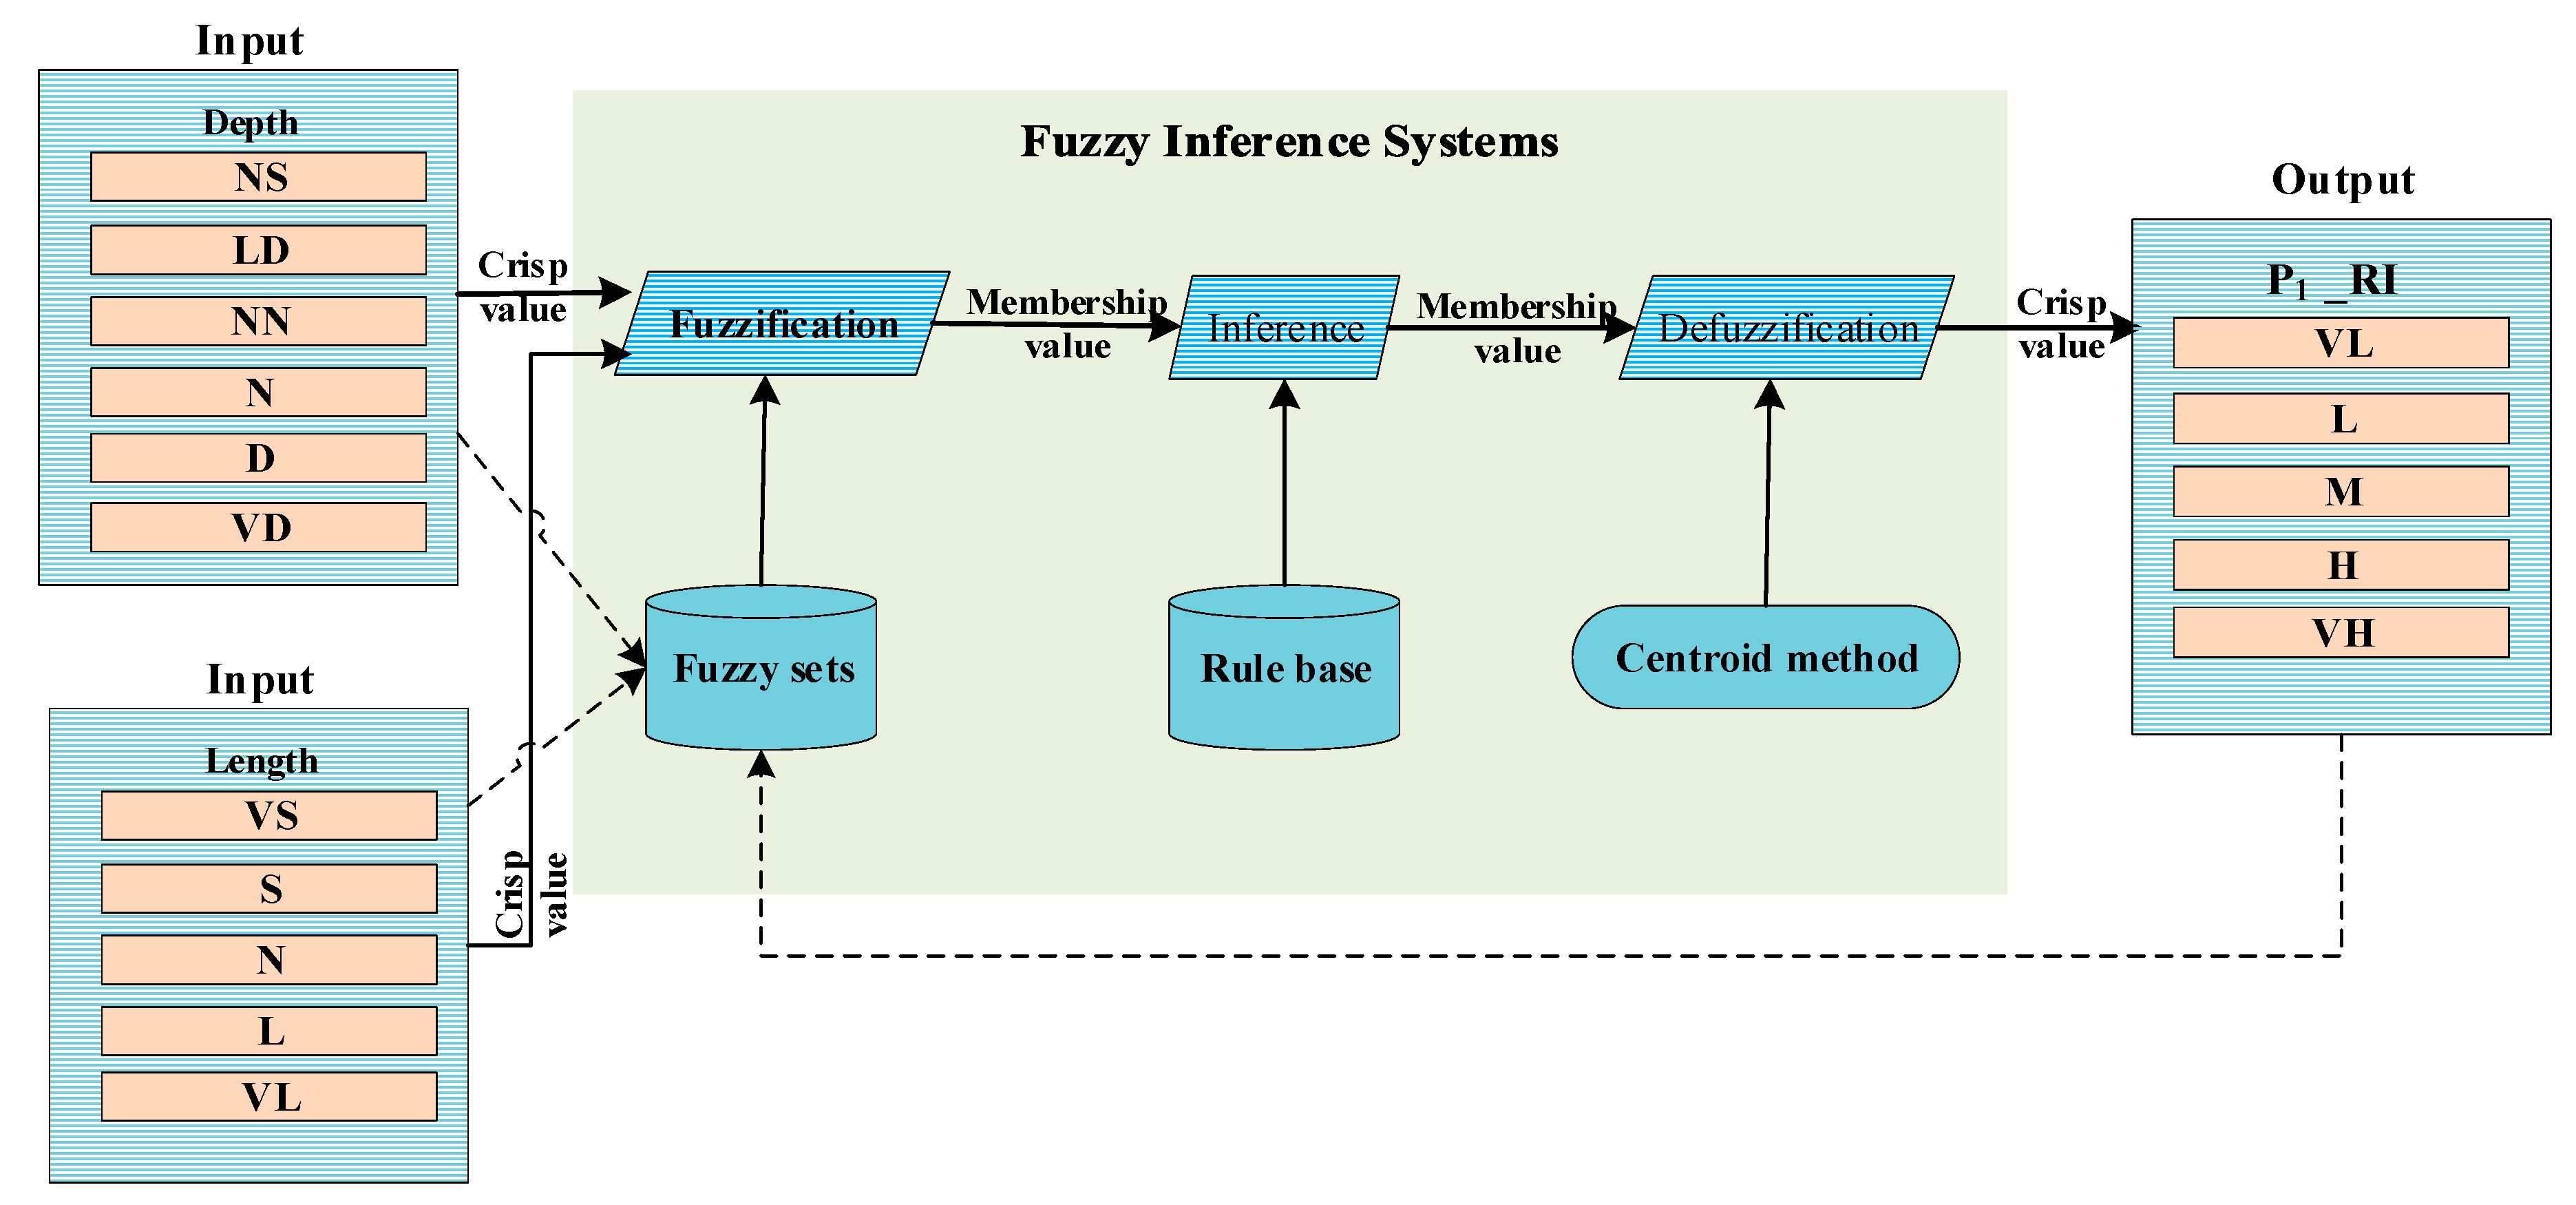
P1_FIS has two inputs, namely depth(X1) and length(X2). The structure diagram of P1_FIS is shown in Figure 7. For each input variable, a different number of membership functions are defined depending on the data variation. According to the number of input and output fuzzy sets, a different number of rules are defined for each fuzzy logic in the proposed model. We defined six fuzzy sets for depth and five for length. Hence, according to Equation (2), the number of rules for P1_FIS can be defined by putting n = 6 and m = 5, so R = 6 × 5 = 30. The rules designing P1_FIS logic were carried out as shown in Table 1.
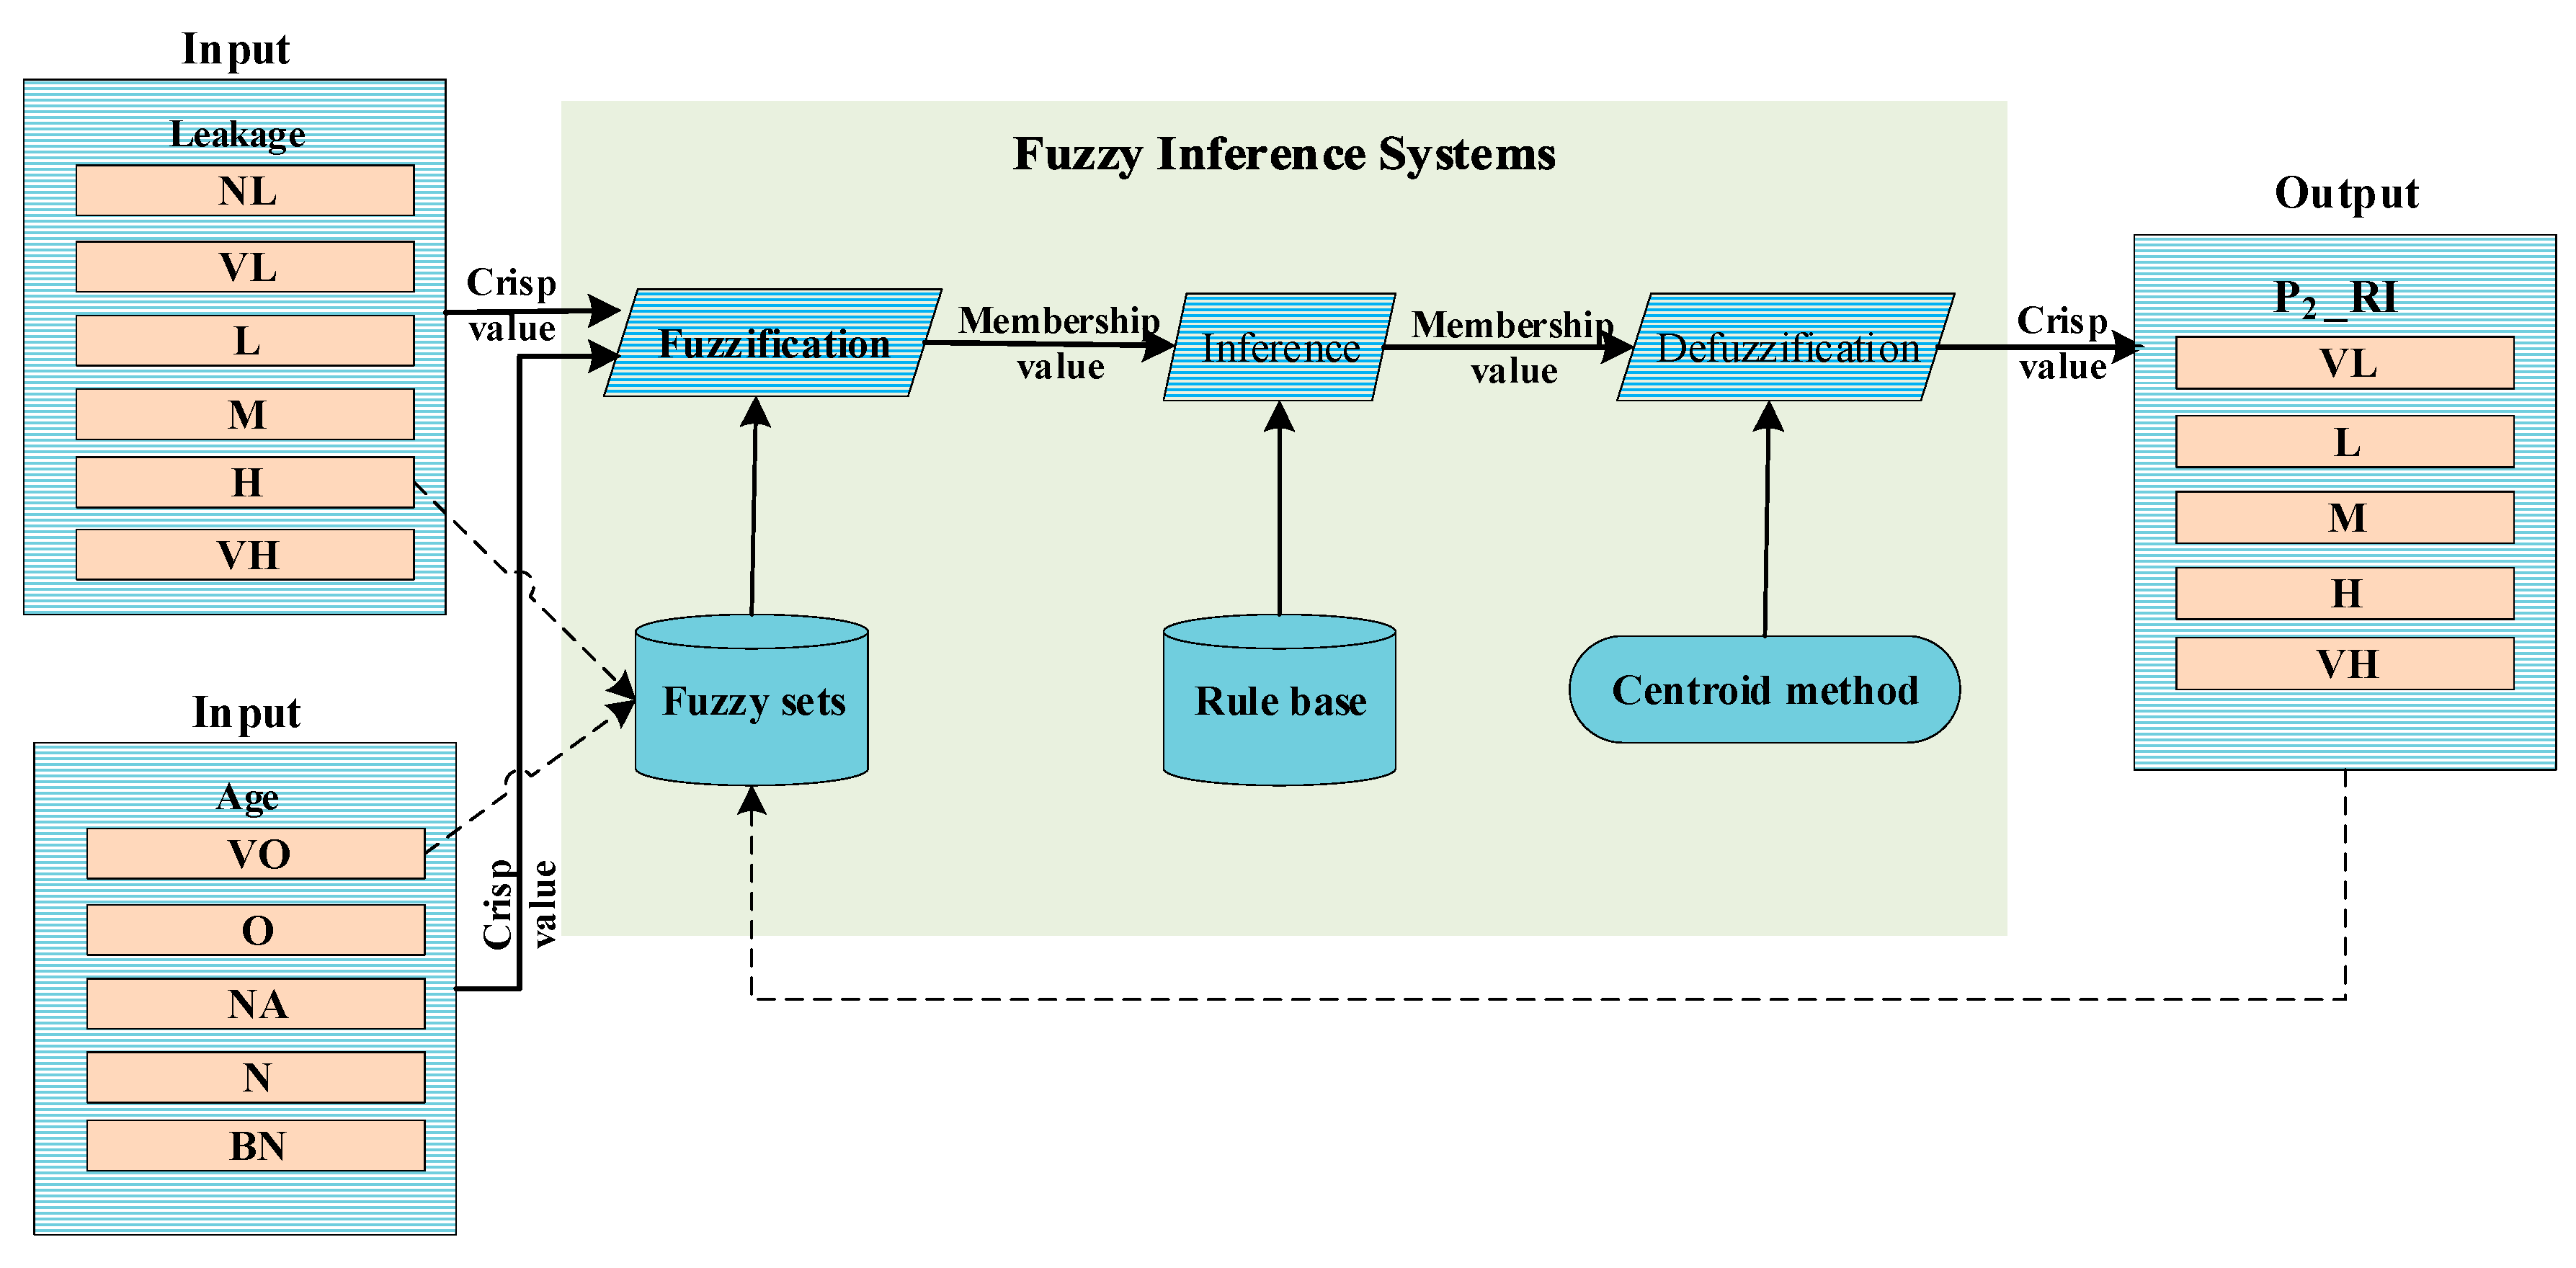
Similarly, P2_FIS has also two fuzzy logics, namely leakage (X3) and age (X4), as well as one output variable, P2_RI. The structure diagram for P2_FIS is shown in Figure 8. For input variables leakage and age, six and five fuzzy sets were defined, respectively. Hence, like P2_FIS, the same 30 fuzzy sets are also defined for P2_FIS. The rules designing P2_FIS were carried out as shown in Table 2.
The structure diagram for blended FIS is shown in Figure 9; the inputs of the blended fuzzy logic are the outputs of P1_FIS and P2_FIS, and the output is the final risk index values for the water supply pipelines. We defined five fuzzy sets for each input variable and five fuzzy sets for the output variable. The number of rules for blended FIS were determined by putting m = 5 and n = 5 in Equation (2); hence, R = 5 × 5 =25. The rule designing for blended fuzzy logic is illustrated in Table 3.
In order to measure the performance of the approximation ratio, the root mean square error (RMSE) was used. Equation (3) can be used to measure the performance of the approximation ratio. The mathematical representation of the RMSE is represented by Equation (3).
where n represents the total number of observations, A represents actual risk index value, and E represents the estimated risk index value computed by the blended hierarchical fuzzy logic.
In the proposed work, we also completed the risk index visualization using a GIS map. First leakage, depth, length and age parameters are given as inputs to the proposed model. The blended hierarchical fuzzy logic model calculates the risk index values based on these four input parameters and the risk index values are then visualized on the GIS map. The caretakers can take measures accordingly in order to prevent any abnormality before it occurs.
4. Experimental Results and Discussion
4.1. Experimental Setup
The implementation of the blended hierarchical fuzzy logic model was carried out in Matlab version 7.10.0.499 installed on an Intel (R) core (TM) i5-3570 [email protected] GHz computer system. A web-based application of the risk index visualization was developed. The technology stack used to develop this application included: Microsoft Visual Studio Enterprise 2015 as an IDE, .Net framework 4.5.2 and C# as a core programming language, and GMap.Net library for the visualization of the risk locations (or for visualizing the risk loca.). GMap.Net is a powerful, open-source, and cross-platform library which enables easy routing, geocoding, and directions on GIS maps. Another .Net drawing library was utilized to provide access to the graphic device interface (GDI) and basic graphics functionality to improve the overall visual interfaces.
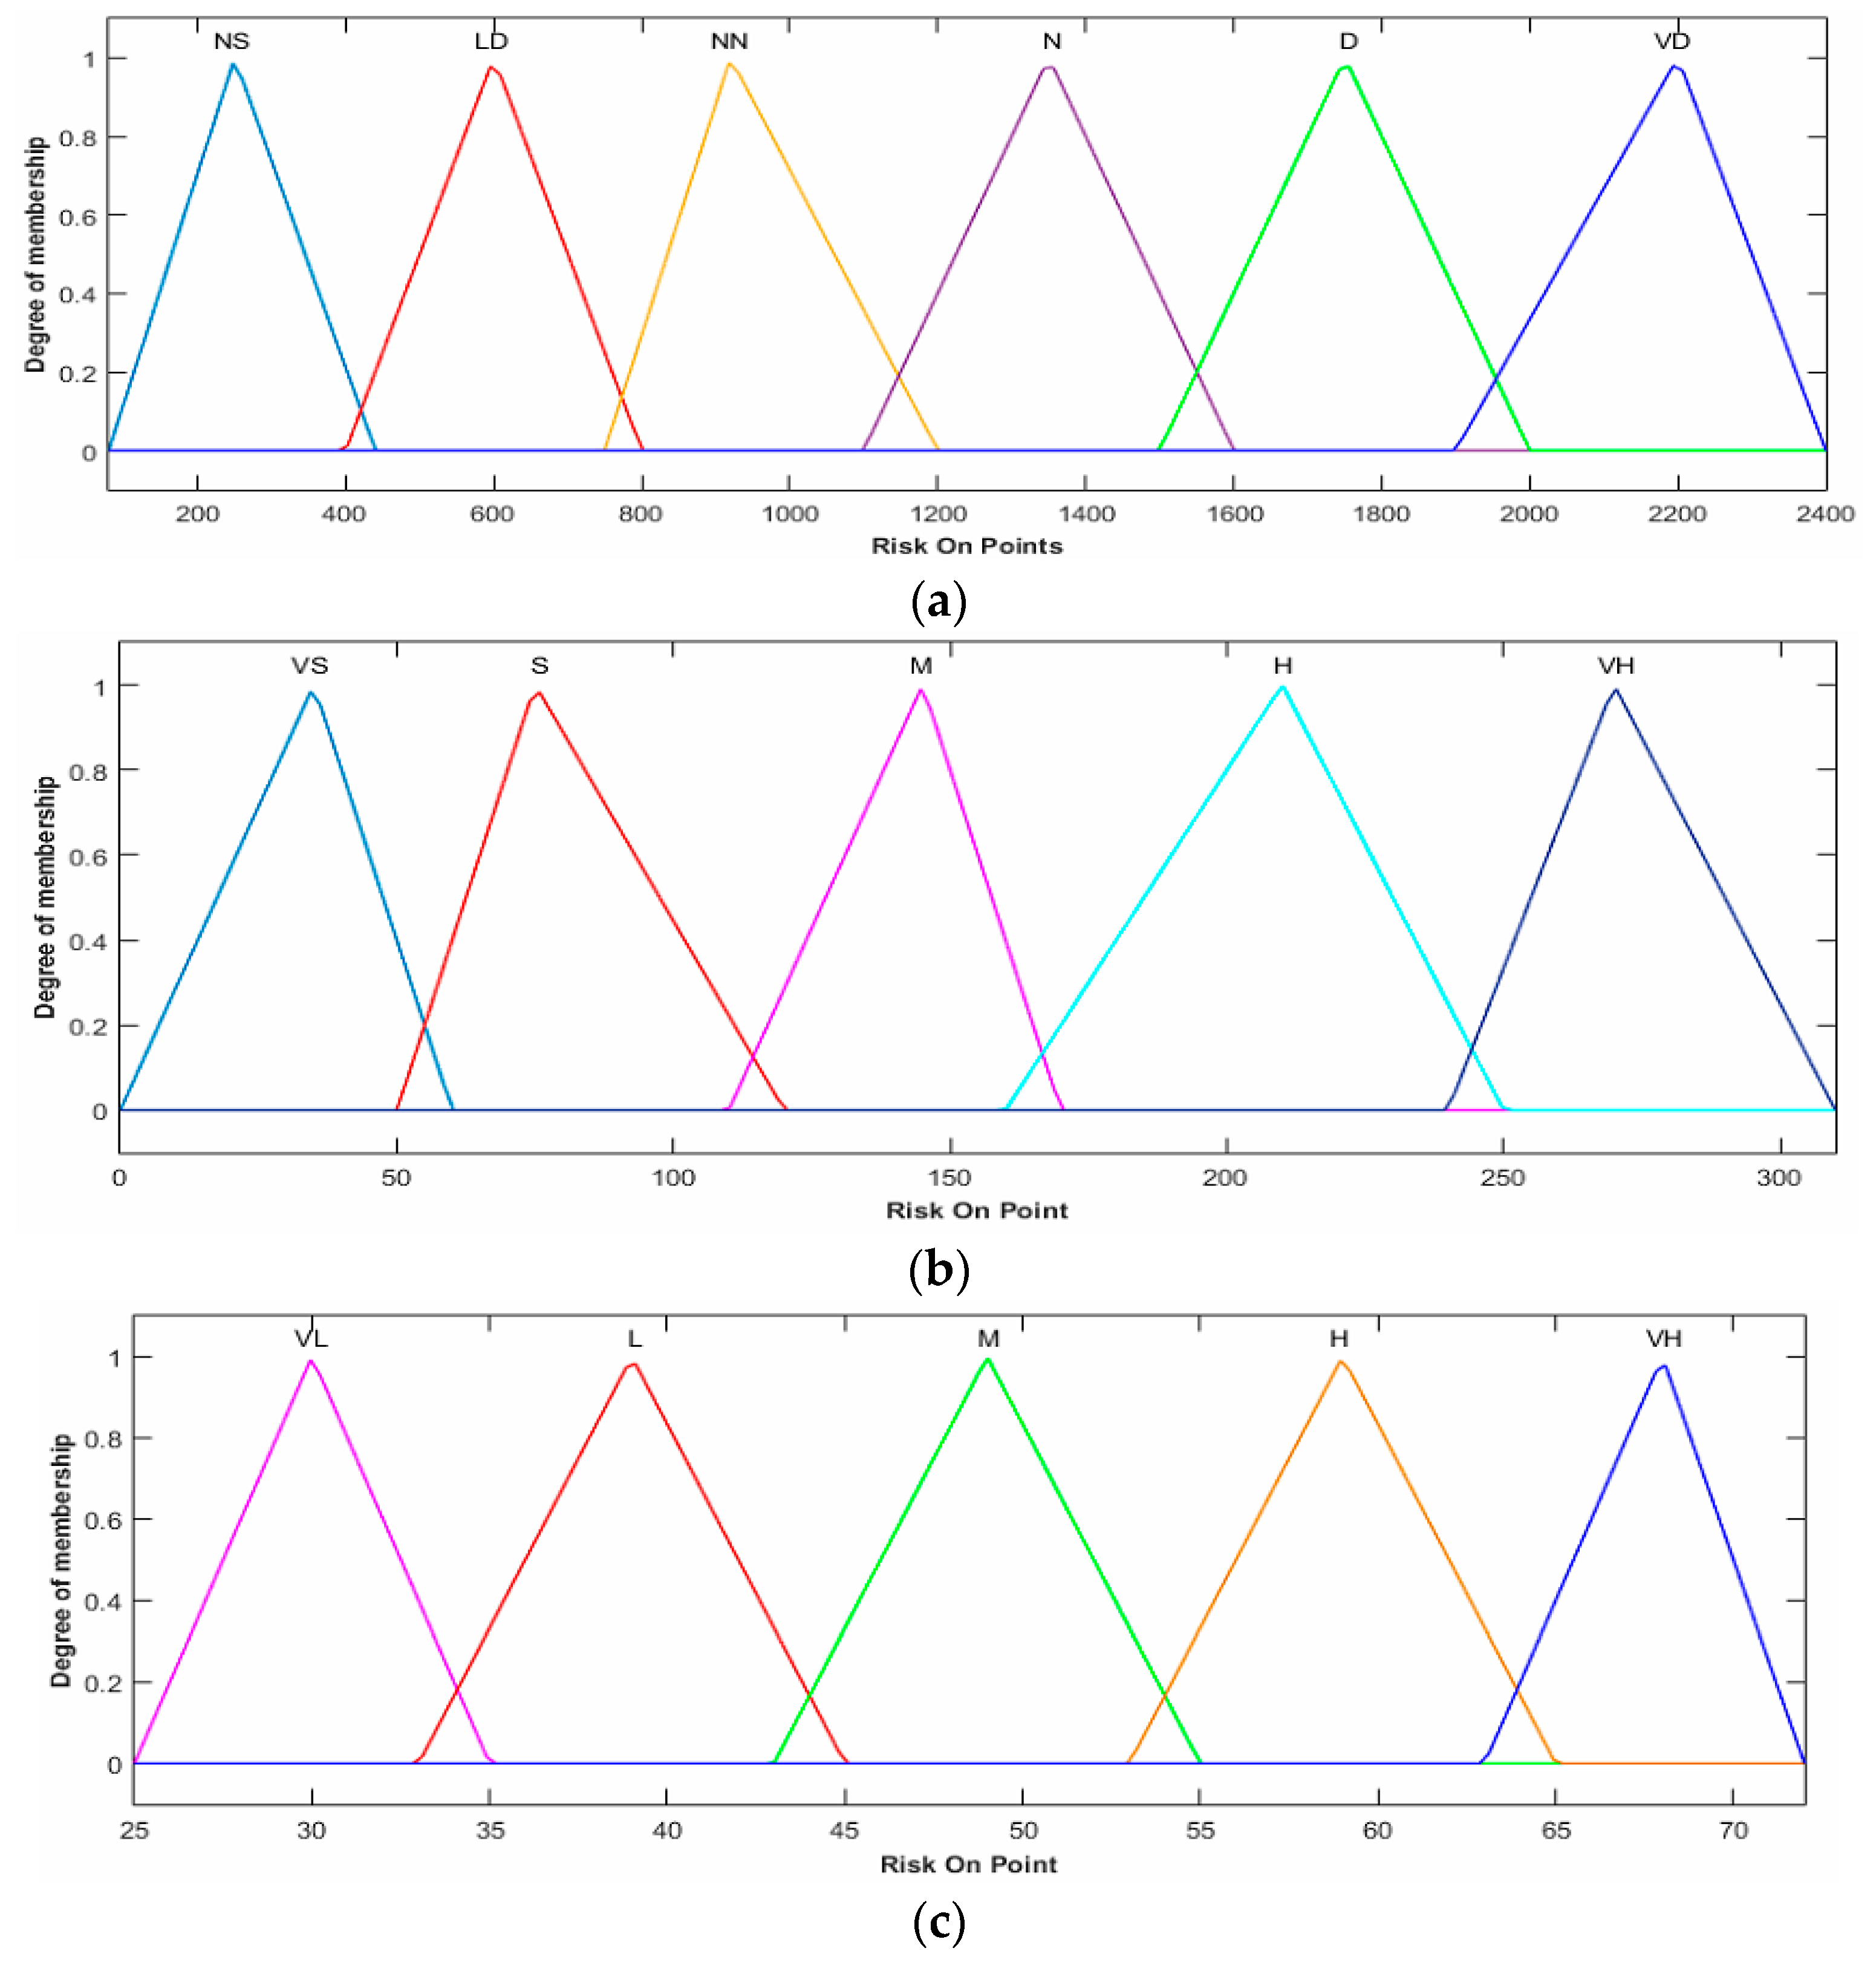
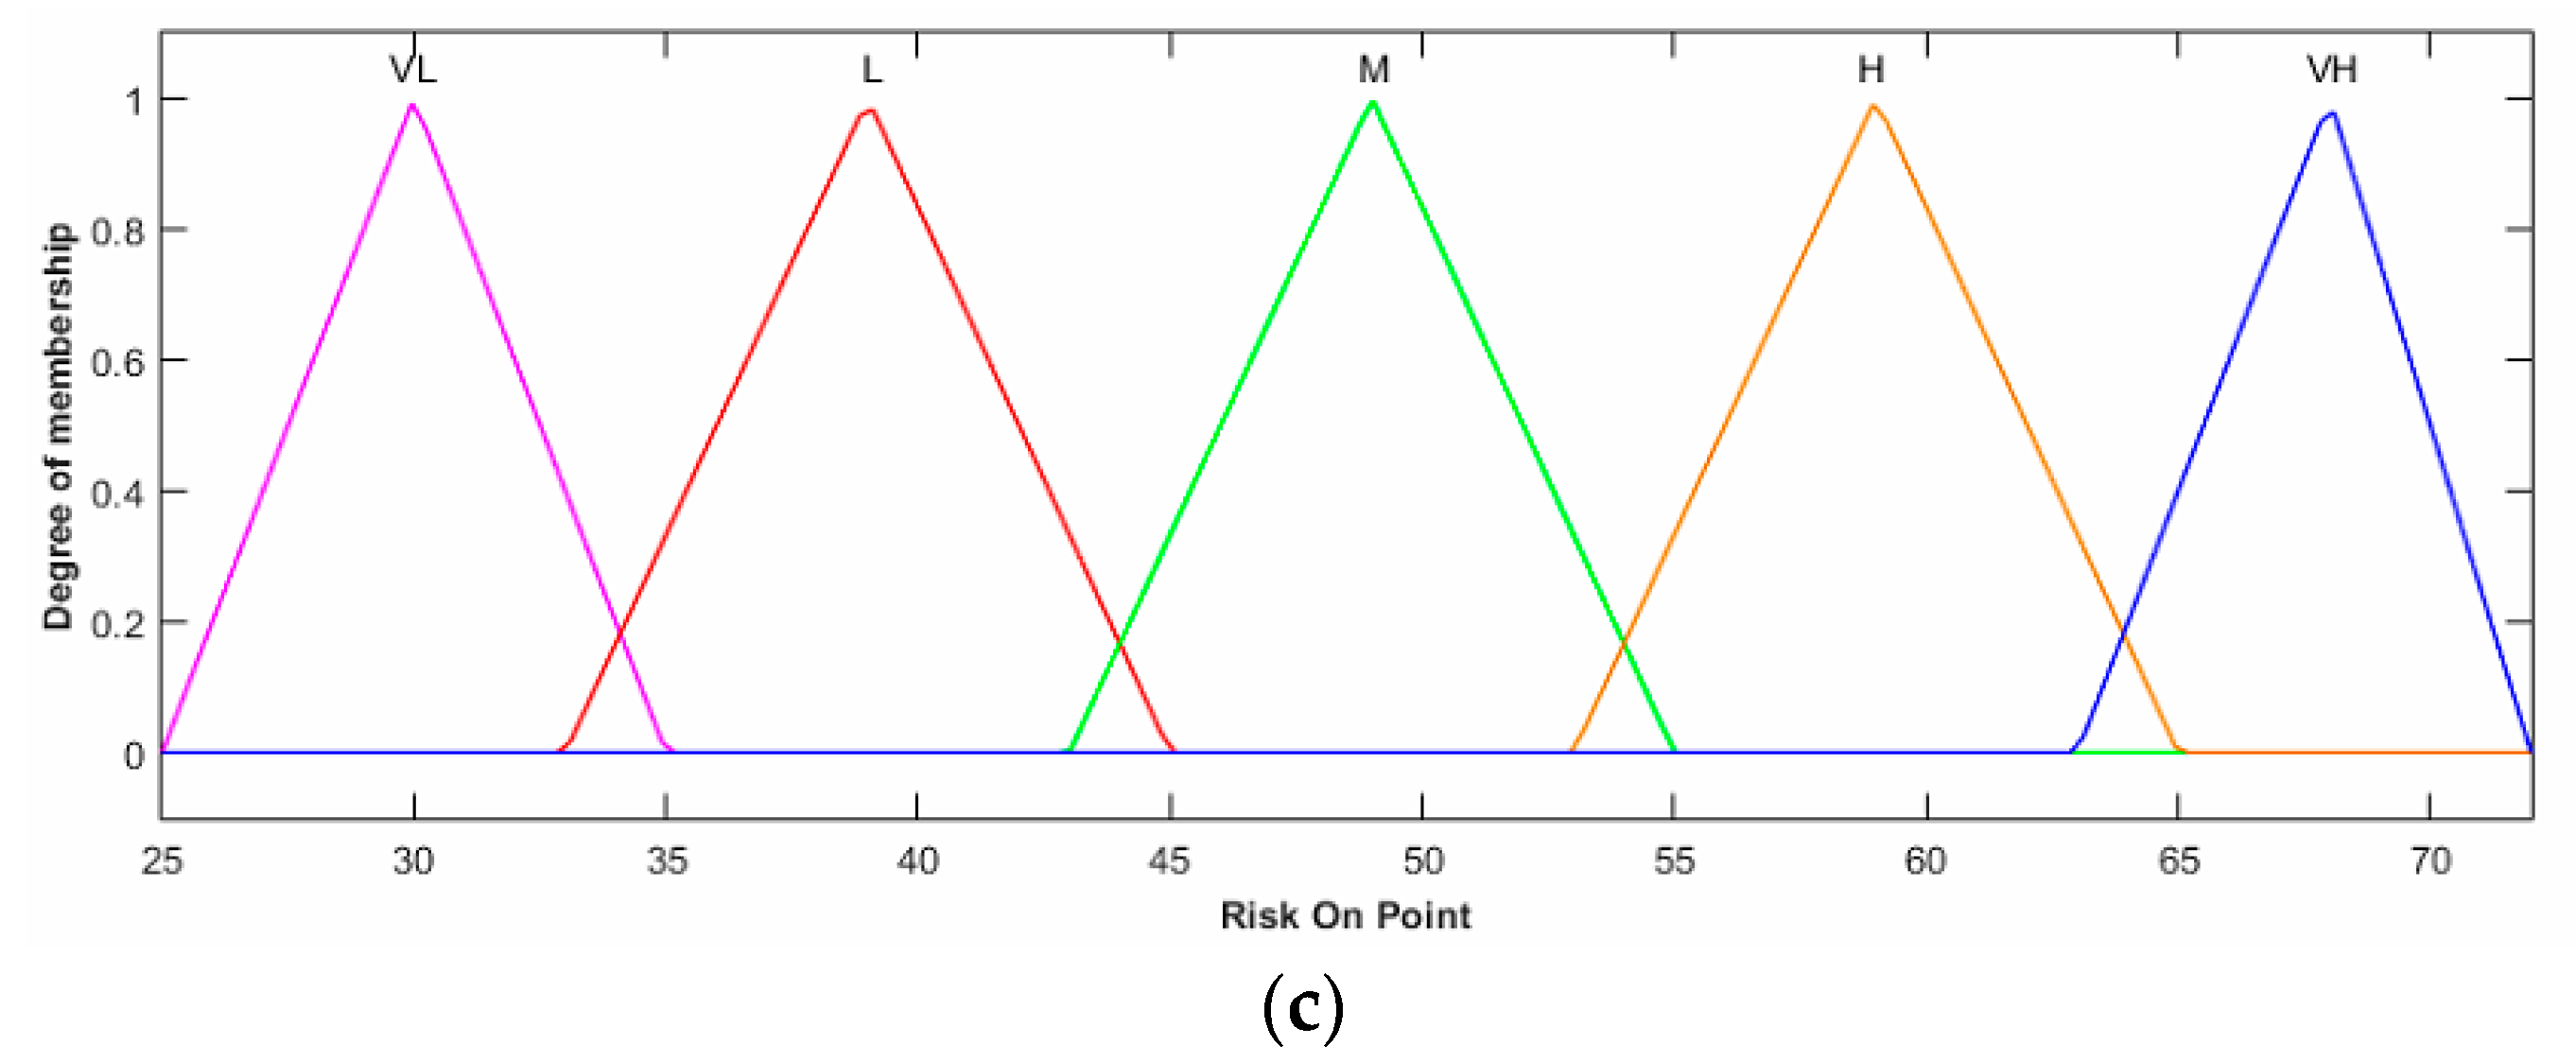
Every input/output parameter was rated according to the provided data and a different number and a different scale of membership functions were defined for each parameter in the proposed blended hierarchical fuzzy logic model. Figure 10 indicates the input/output triangular membership functions for P1_FIS. The linguistic terms NS, LD, NN, N, D and VD were assigned to the membership functions of input variable depth and the membership functions of input variable length were labeled as VS, S, M, H and VH. Similarly, the membership functions of output variable P1_RI were labeled as VL, L, M, H and VH.
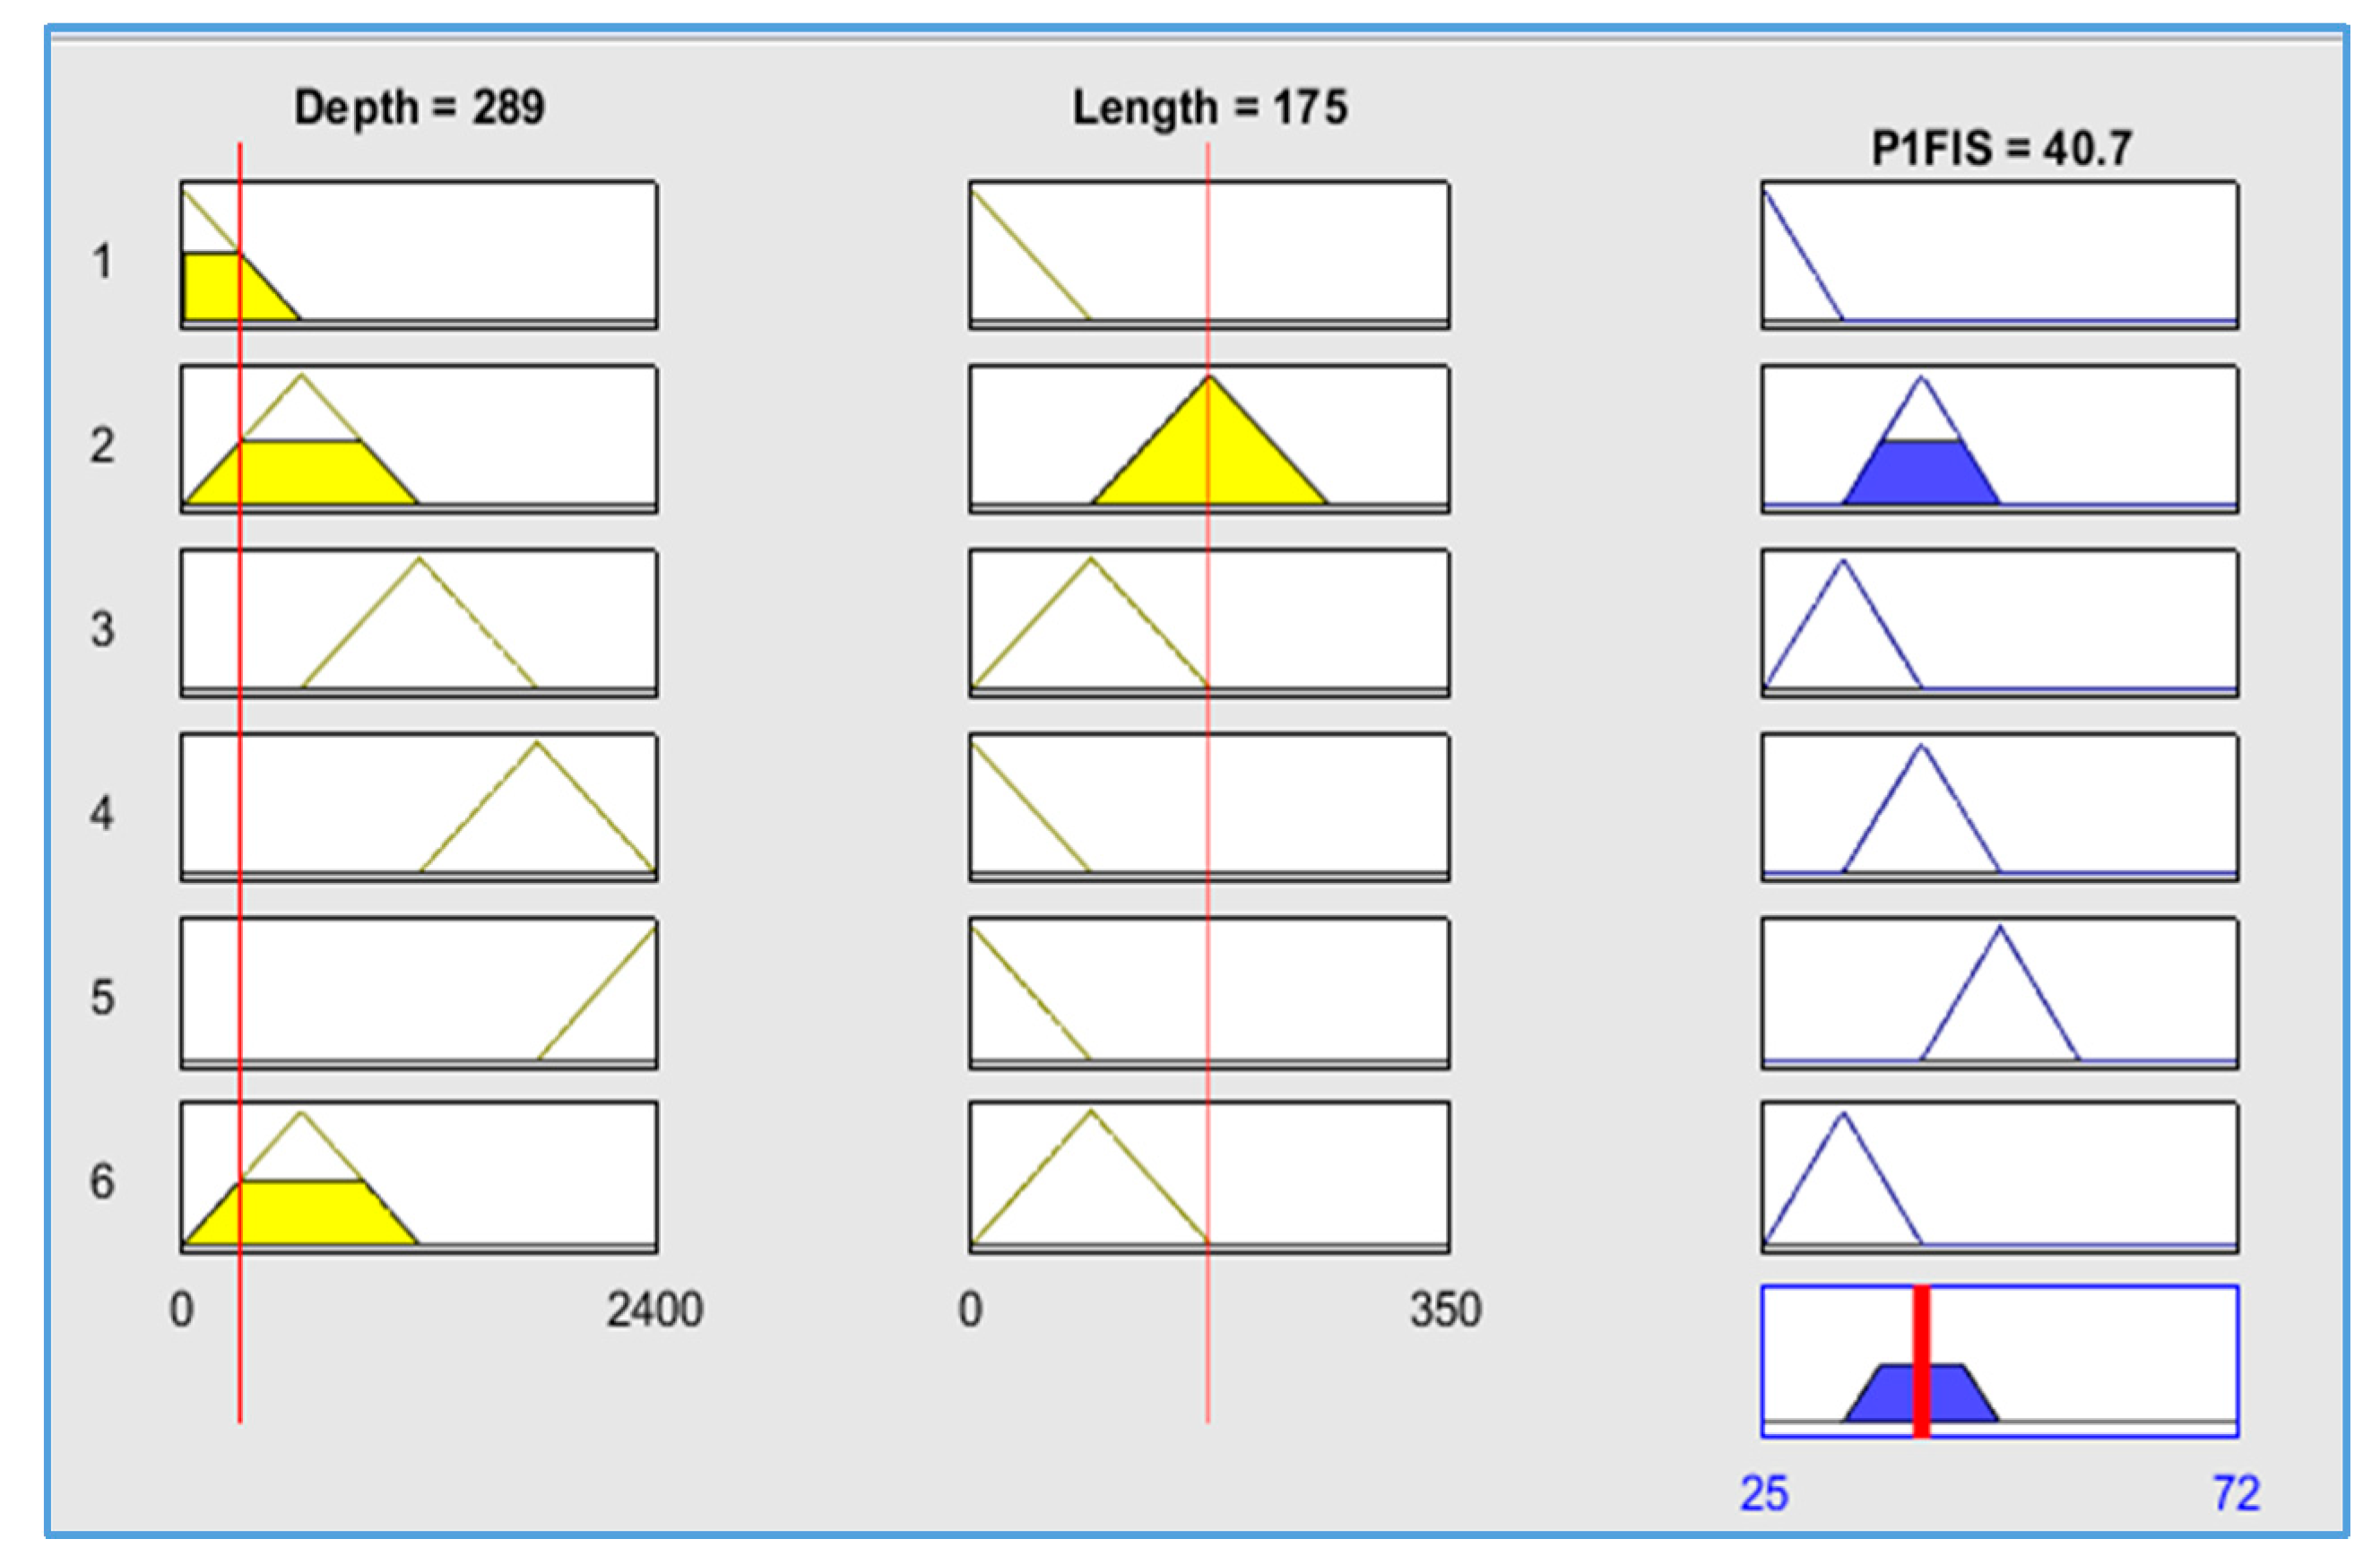
The rule viewer is shown in Figure 11, where some sample rules are designed for P1_FIS. The rule viewer shows a roadmap of the whole fuzzy inference process of P1_FIS. The three plots across the top of the figure represent the antecedent and consequent of the first rule. This P1_FIS returns fractional risk index values for the water supply pipeline.
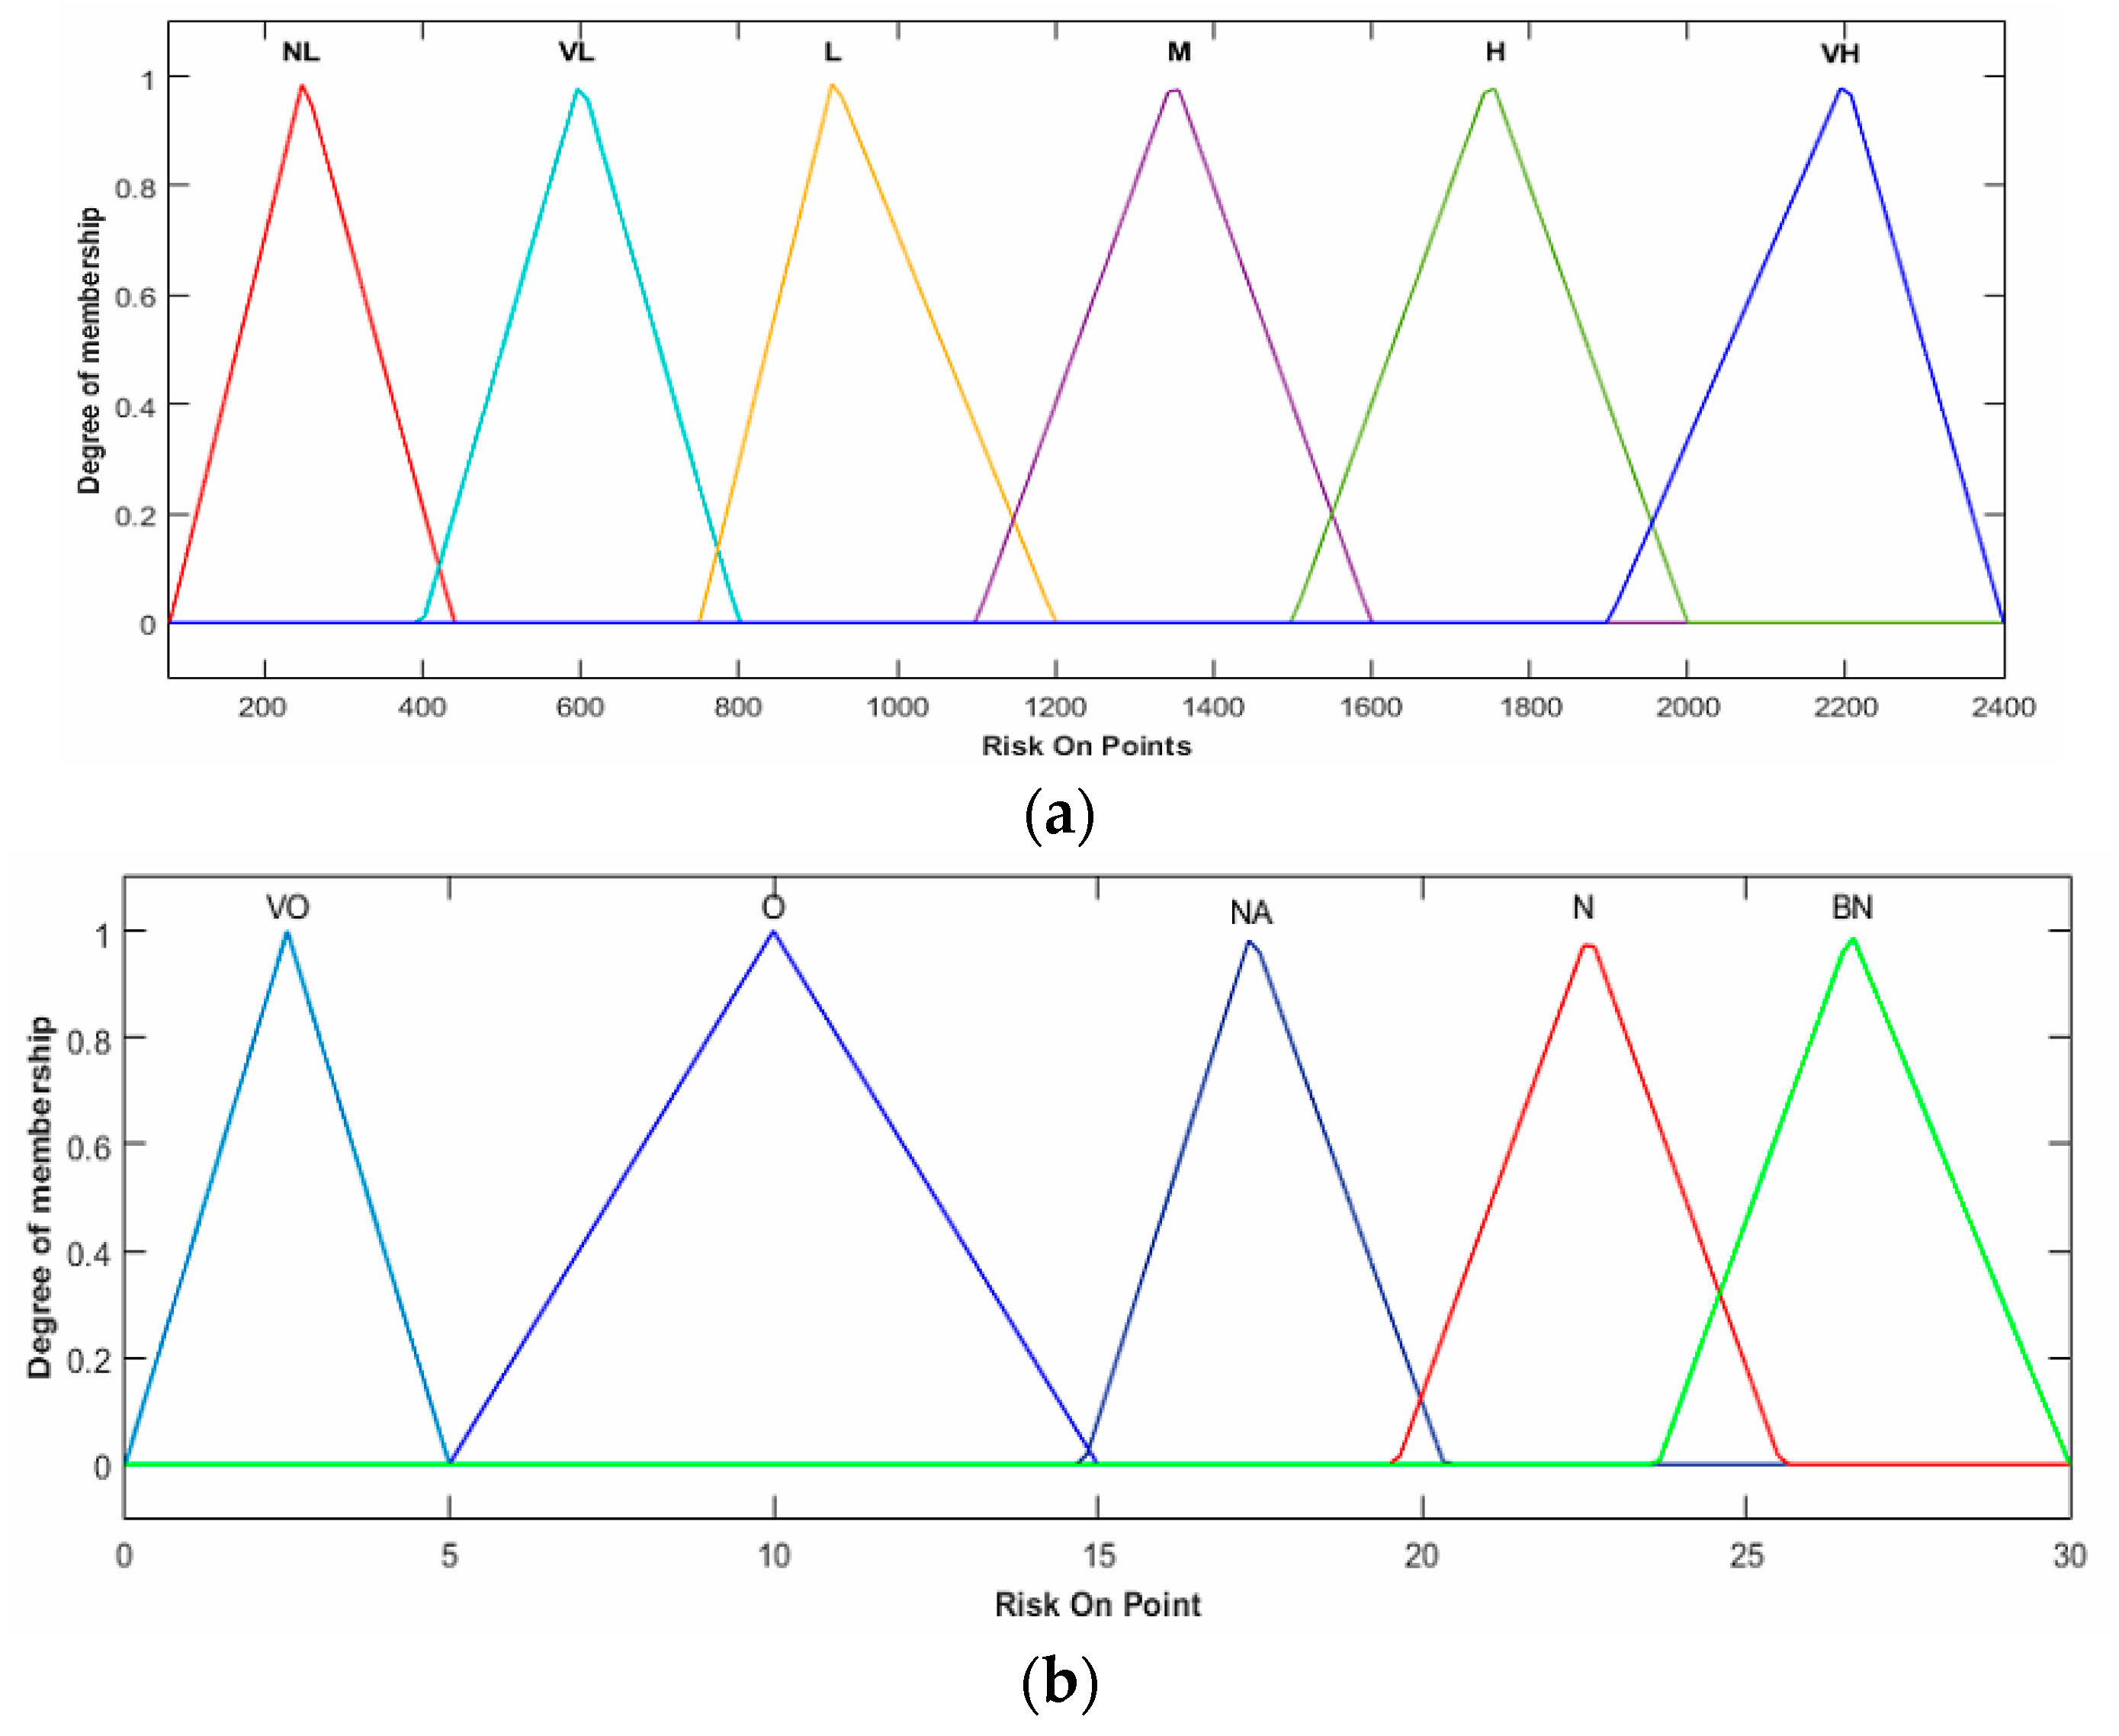
The input/output triangular membership functions are illustrated in Figure 12 for P2_FIS. The linguistic terms assigned to the membership functions of input variable leakage were NL, VL, L, M, H and VH; the linguistic terms for age input variable membership functions were VO, O, NA, N and BN. The linguistic terms for output variable P2_RI were VL, L, M, H and VH.
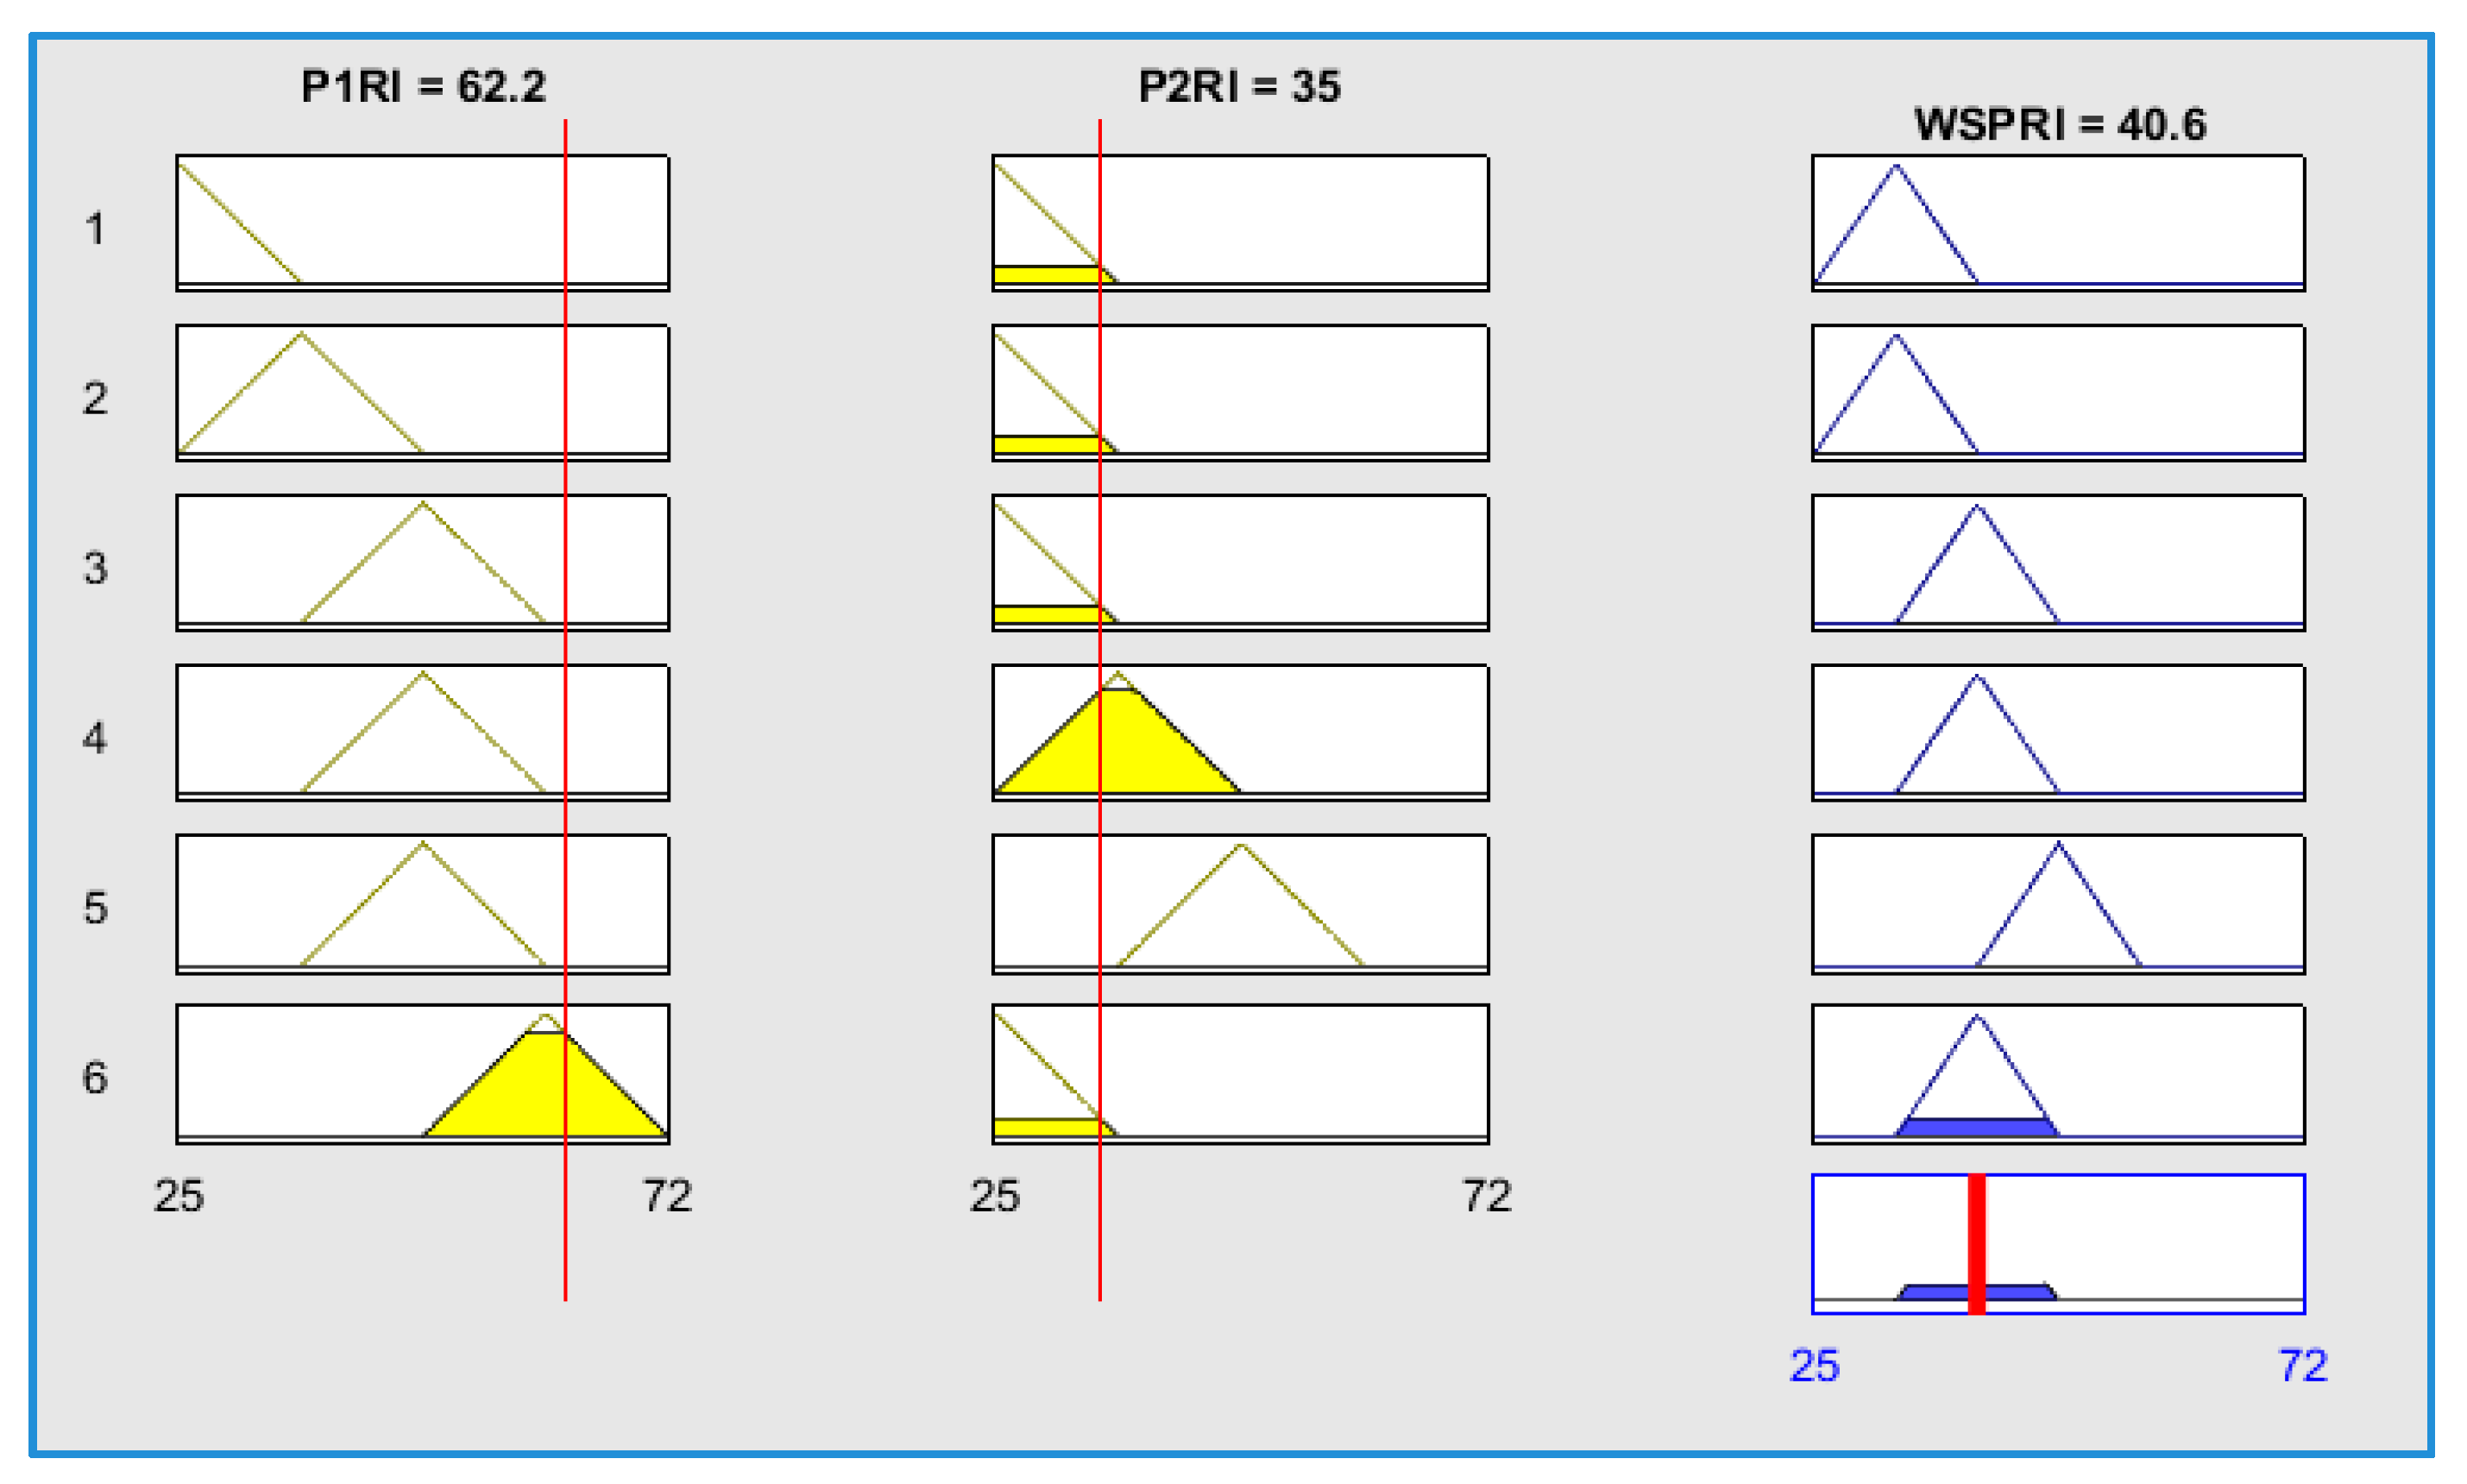
The graphical representation of rules using the above membership functions is shown in Figure 13. Some sample rules are given in order to show the overall inference process of P2_FIS.
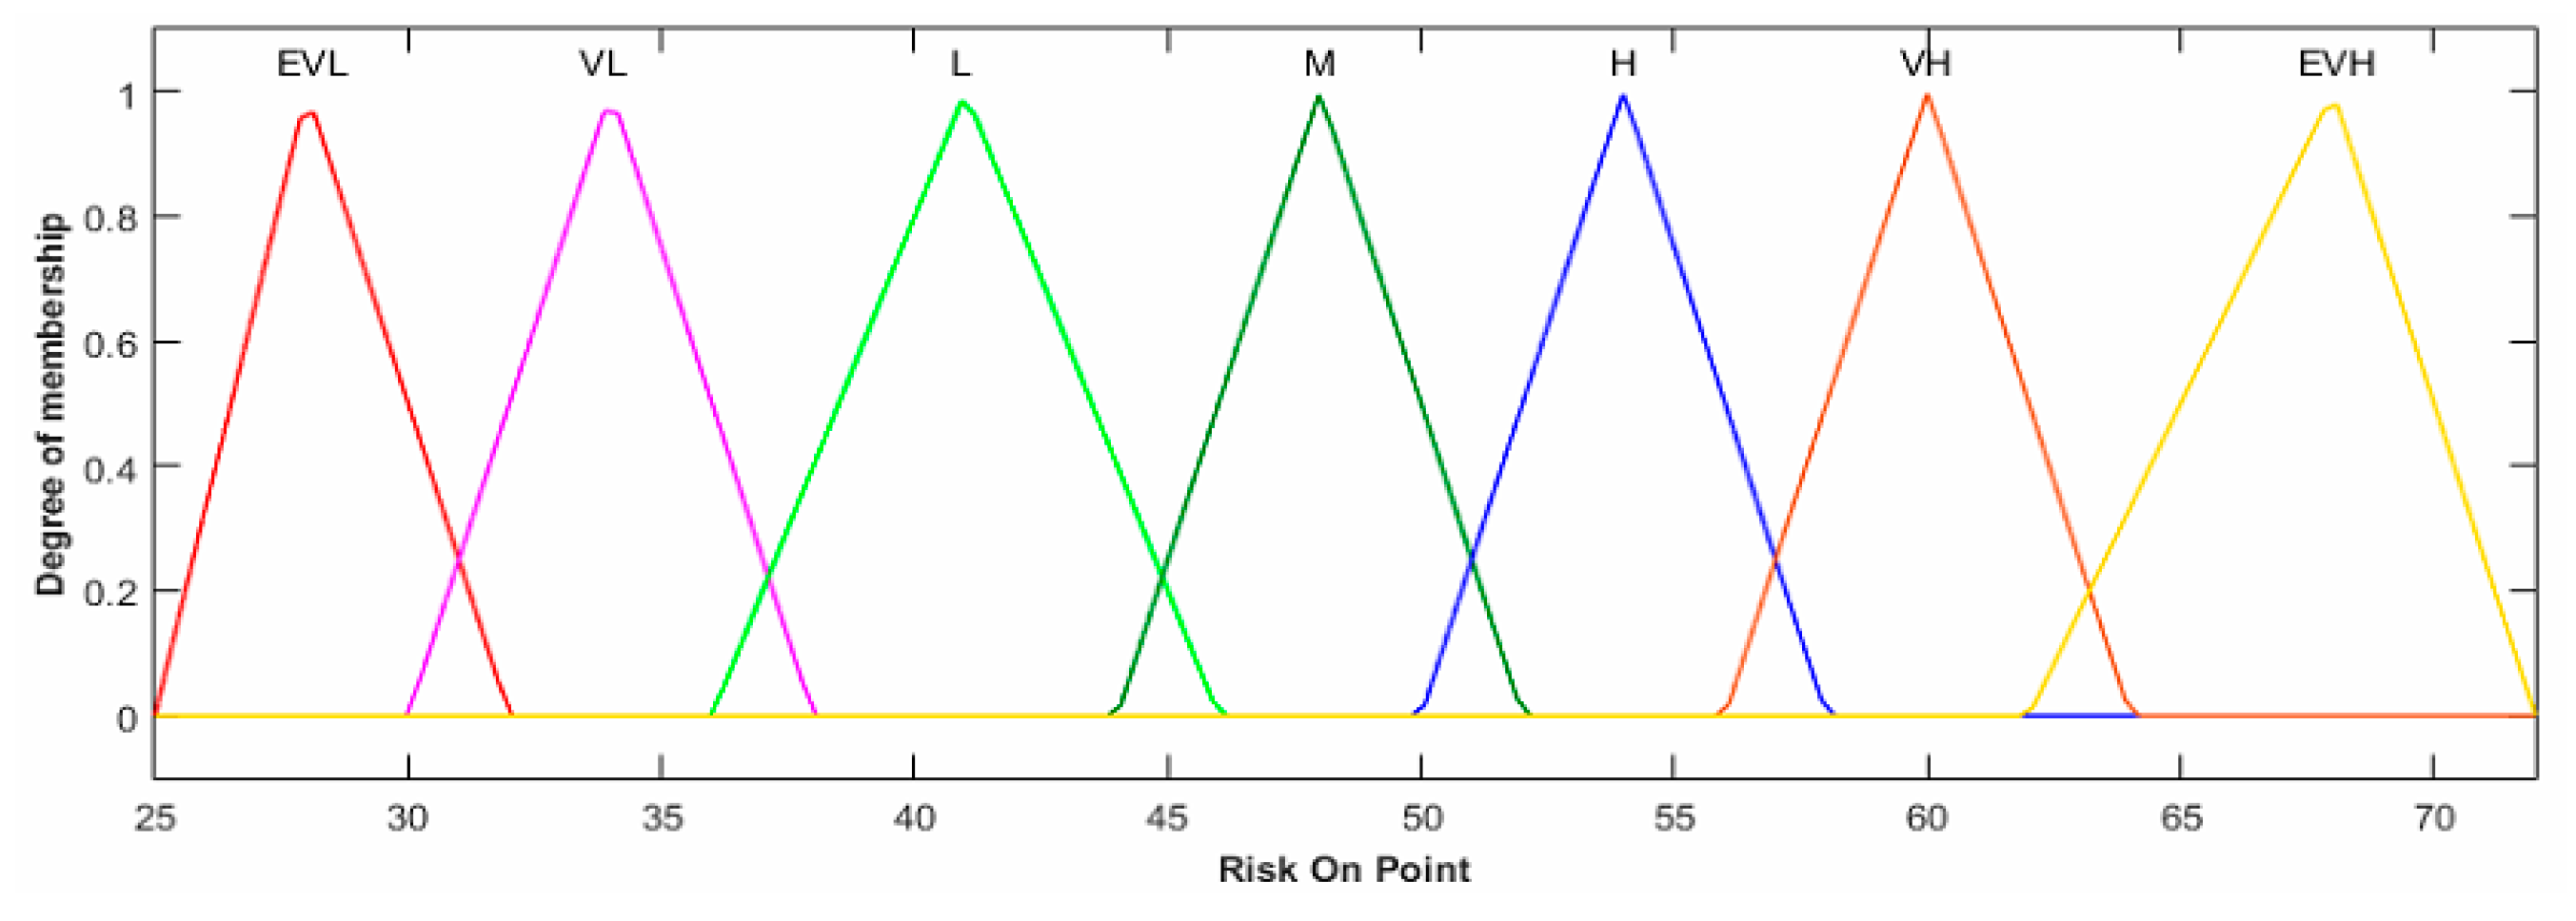
Figure 14 shows the triangular membership functions for the blended FIS. The same number of membership functions with the same labels were considered for input variables P1_RI and P2_RI as defined in P1_FIS and P2_FIS. The linguistic terms assigned to the membership functions for output variable WSP_RI were EVL, VL, L, M, H, VH and EVH. The rule viewer for some sample rules is shown in Figure 15.
4.2. Results
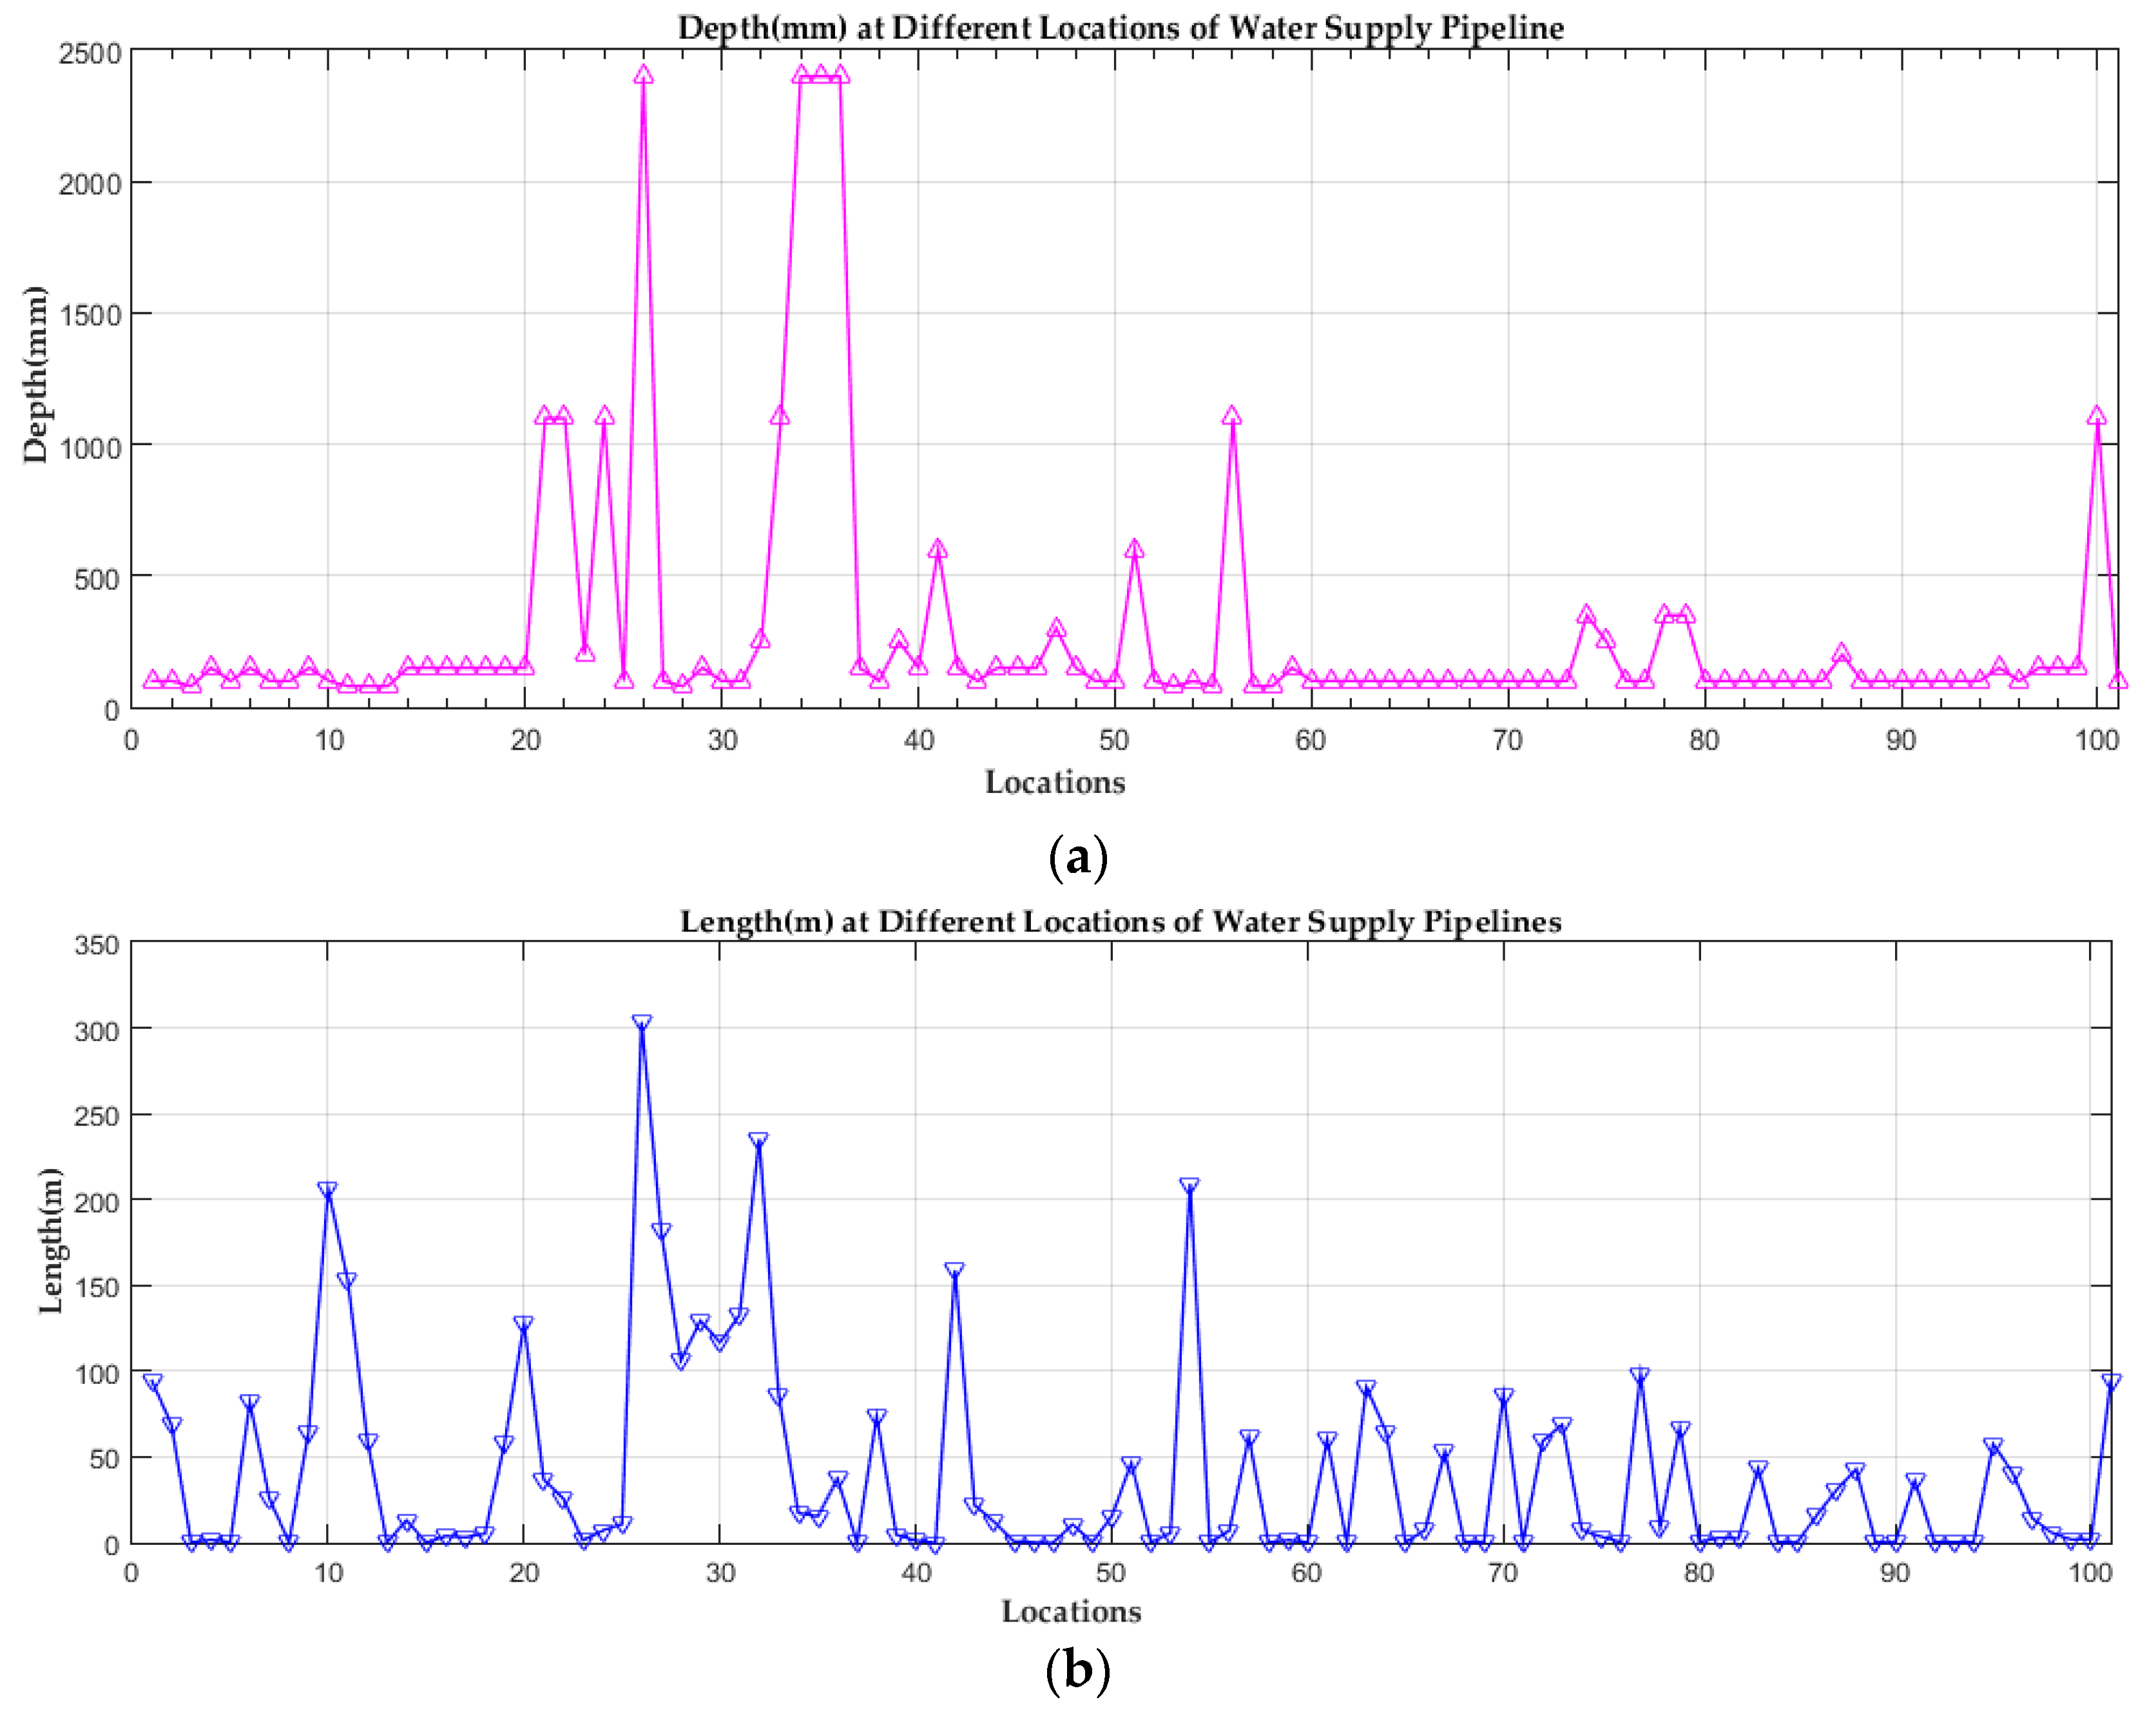
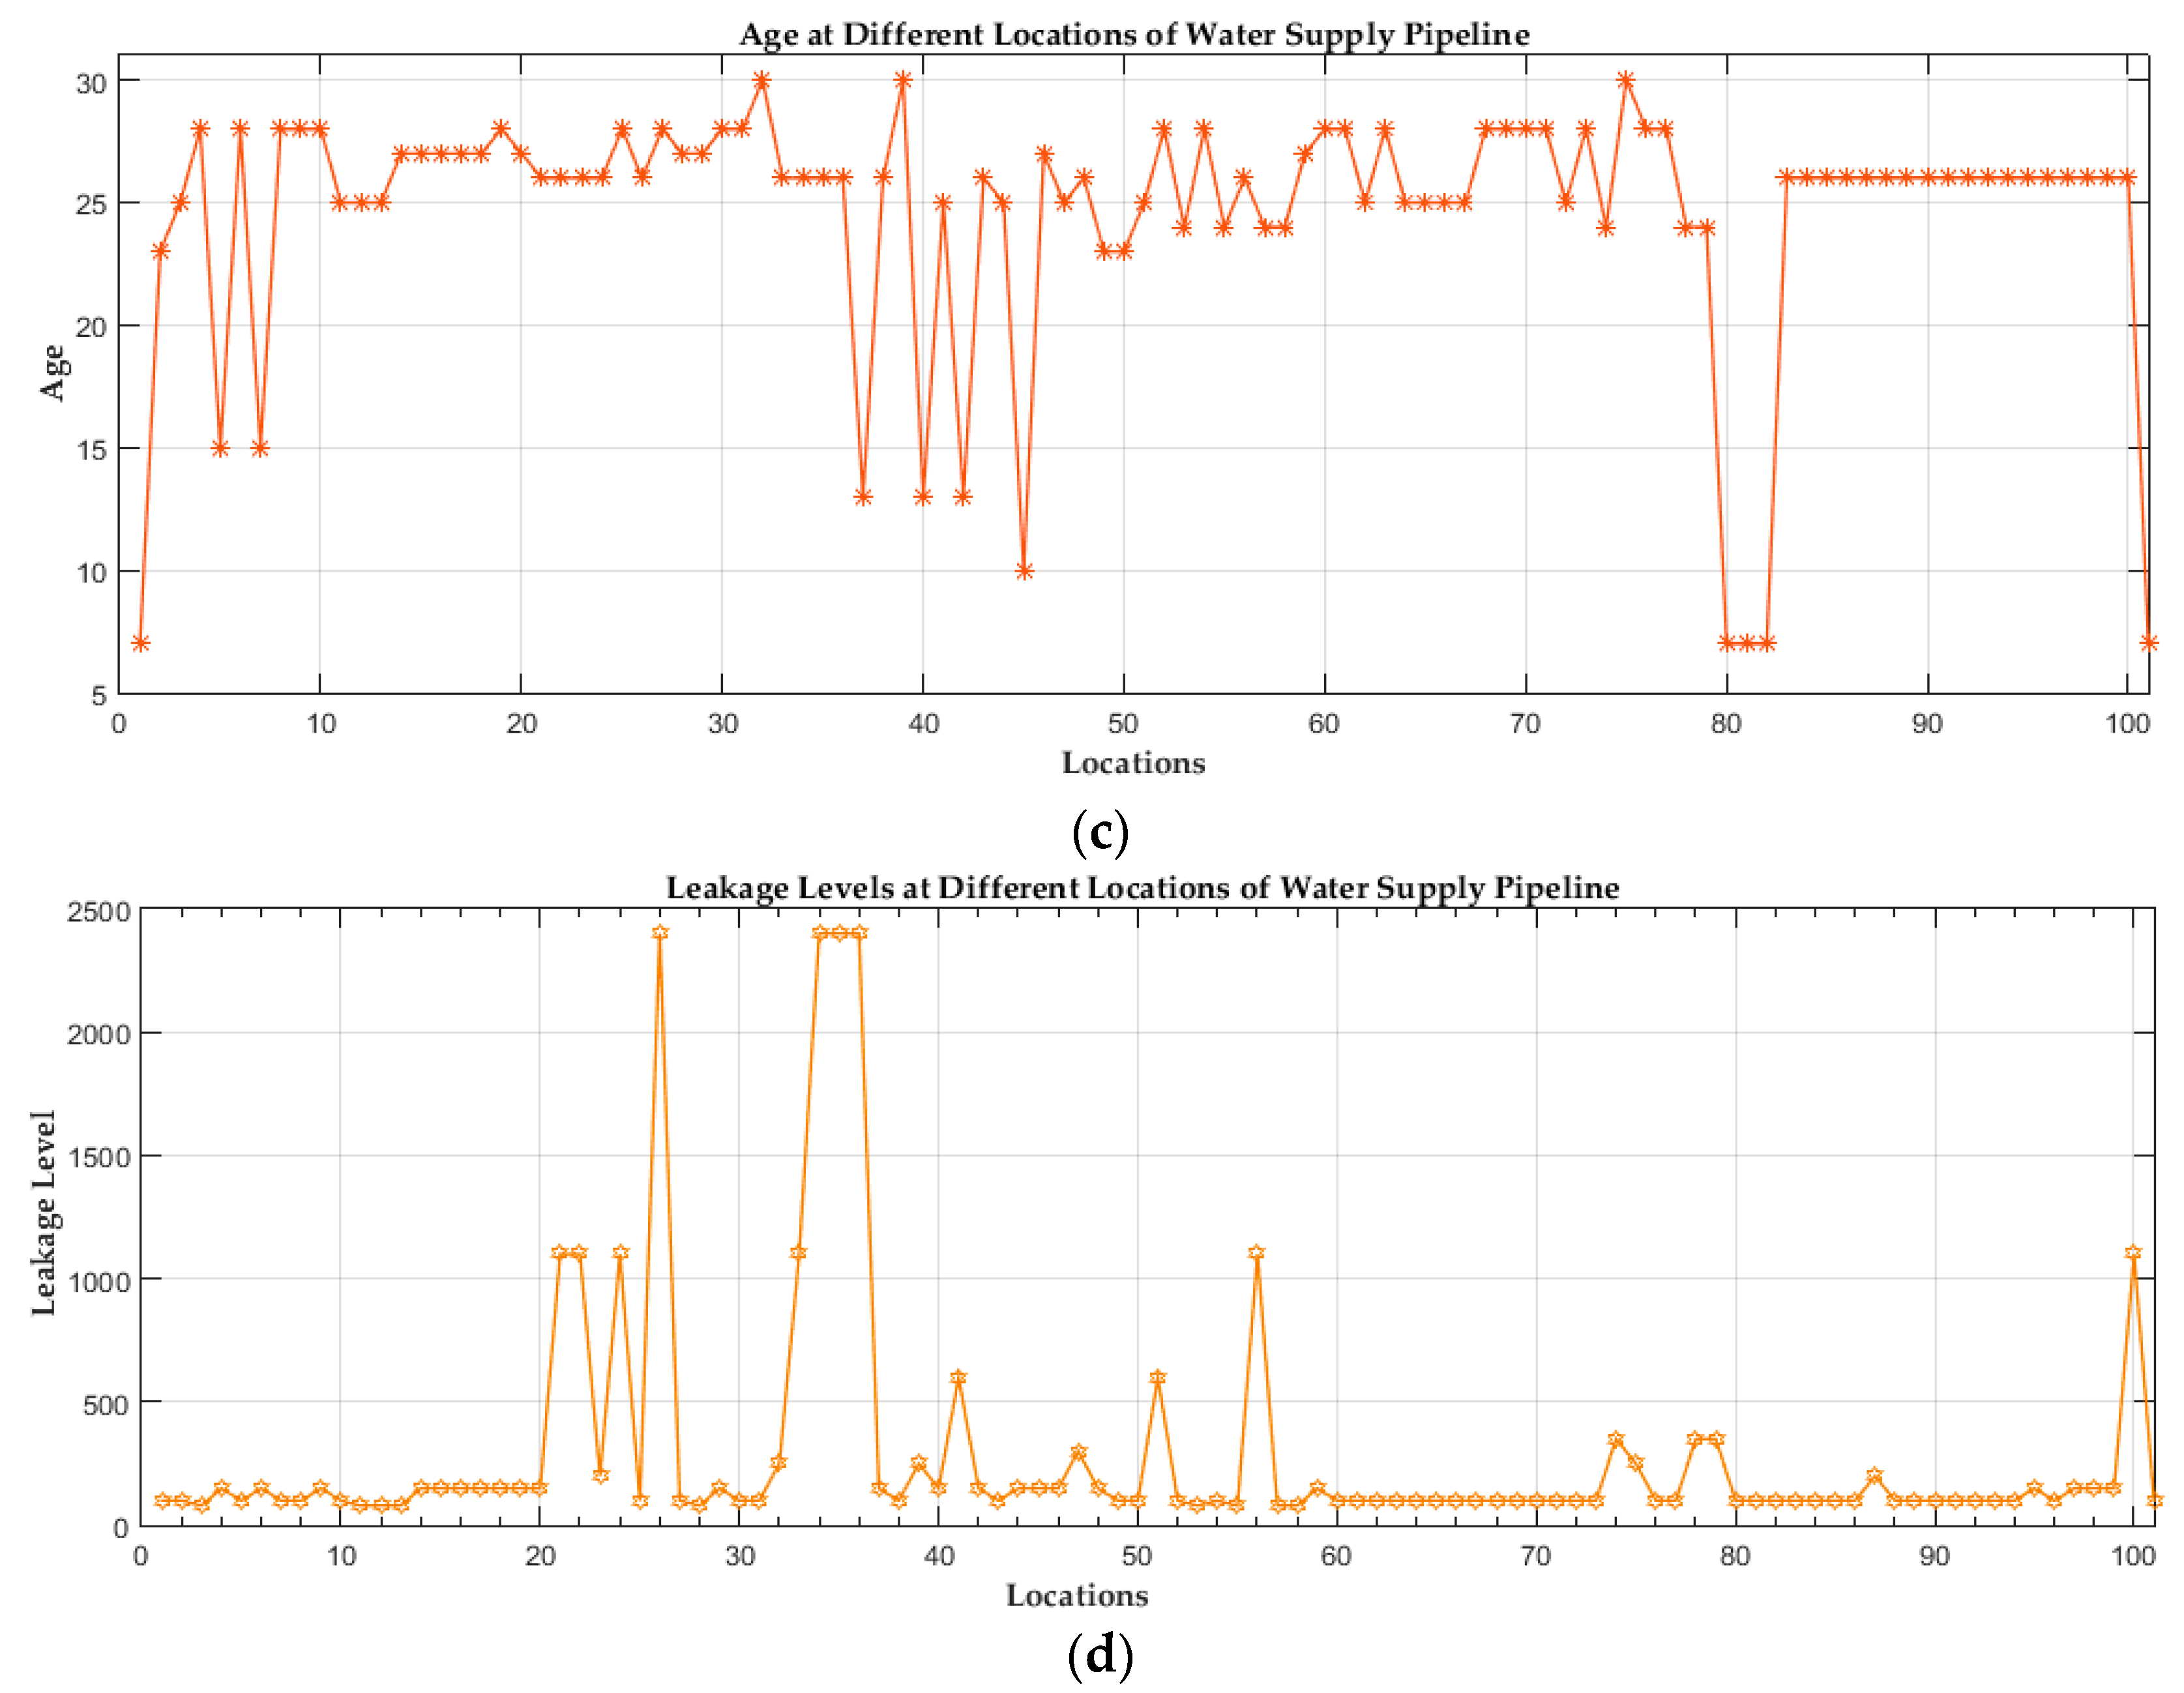
The dataset that was used in this work is real dataset provided by the Electronics and Telecommunications Research Institute (ETRI) organization working on the underground project. The data were collected from 1989 to 2010 for water supply pipelines installed at various locations in Seoul, Republic of Korea. The input data consists of four parameters, namely leakage, age, depth, and length. In this paper, we had access to data of the four mentioned parameters; hence, we used these four parameters for our experiments. Figure 16 shows the graphical representation of the input data in order to better elucidate it.
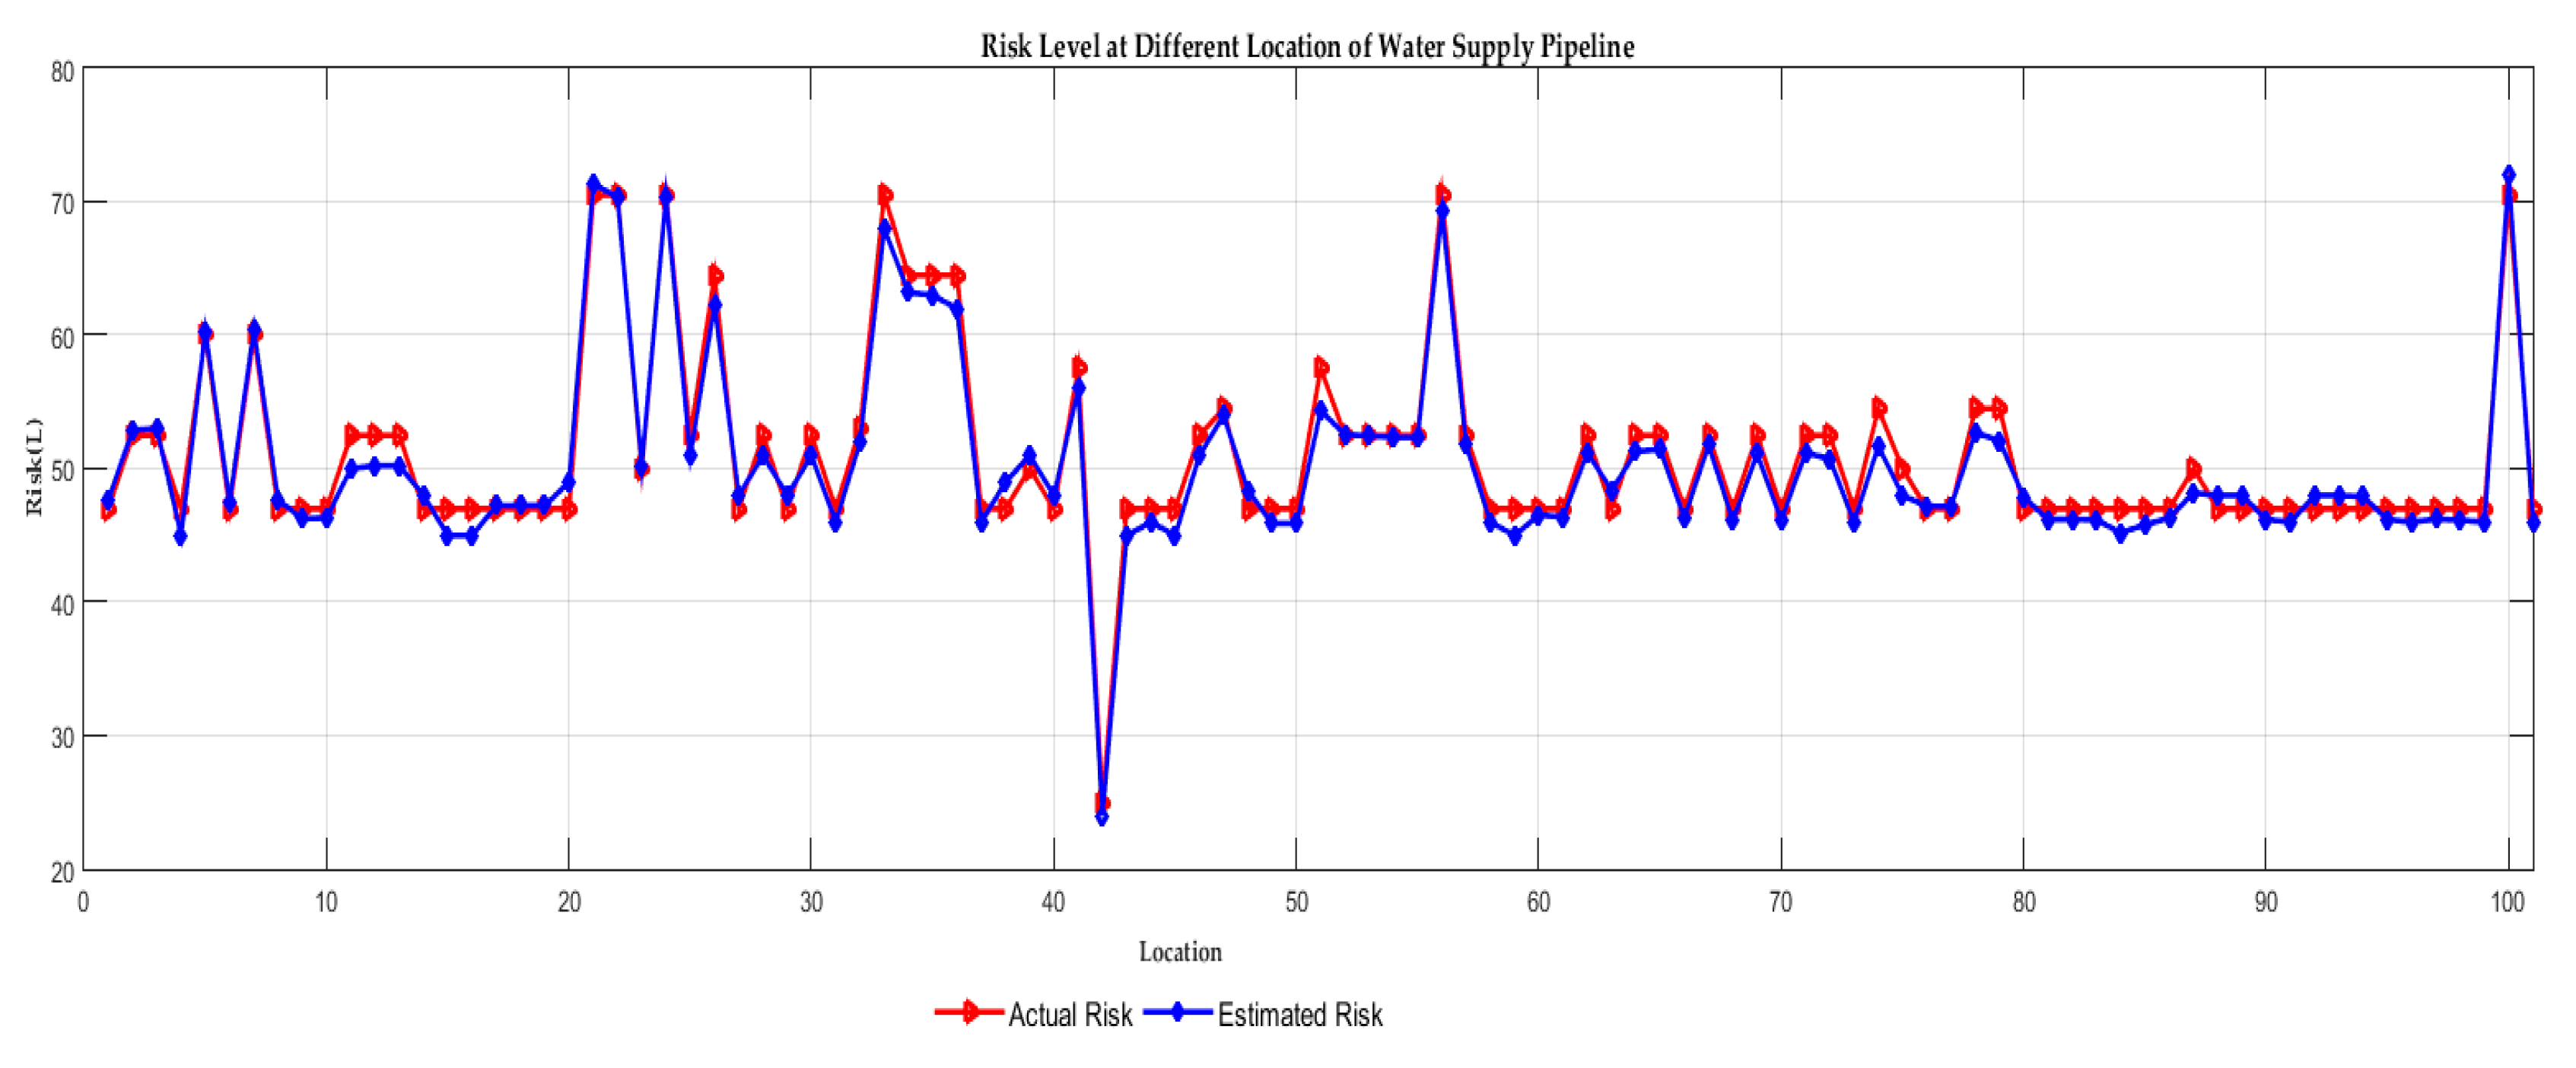
Figure 17 shows the actual risk index and the blended risk index values at different locations of water supply pipelines. The accuracy of the results using the fuzzy inference system rely on the accuracy of rules; more accurate rules mean more accurate results. As the proposed blended hierarchical fuzzy model makes the construction of rules in the rule base very simple, the rule manager can easily construct the rules with better preciseness in the rule base, which ultimately contributes to the accuracy of the system. The performance evaluation of the blended hierarchical fuzzy logic model was carried out using RMSE to measure how the computed risk index values compared to the actual risk index values. The value of RMSE was 1.3154, which indicates that the performance of the blended hierarchical fuzzy logic model is appropriate and suitable to be used in any practical application.
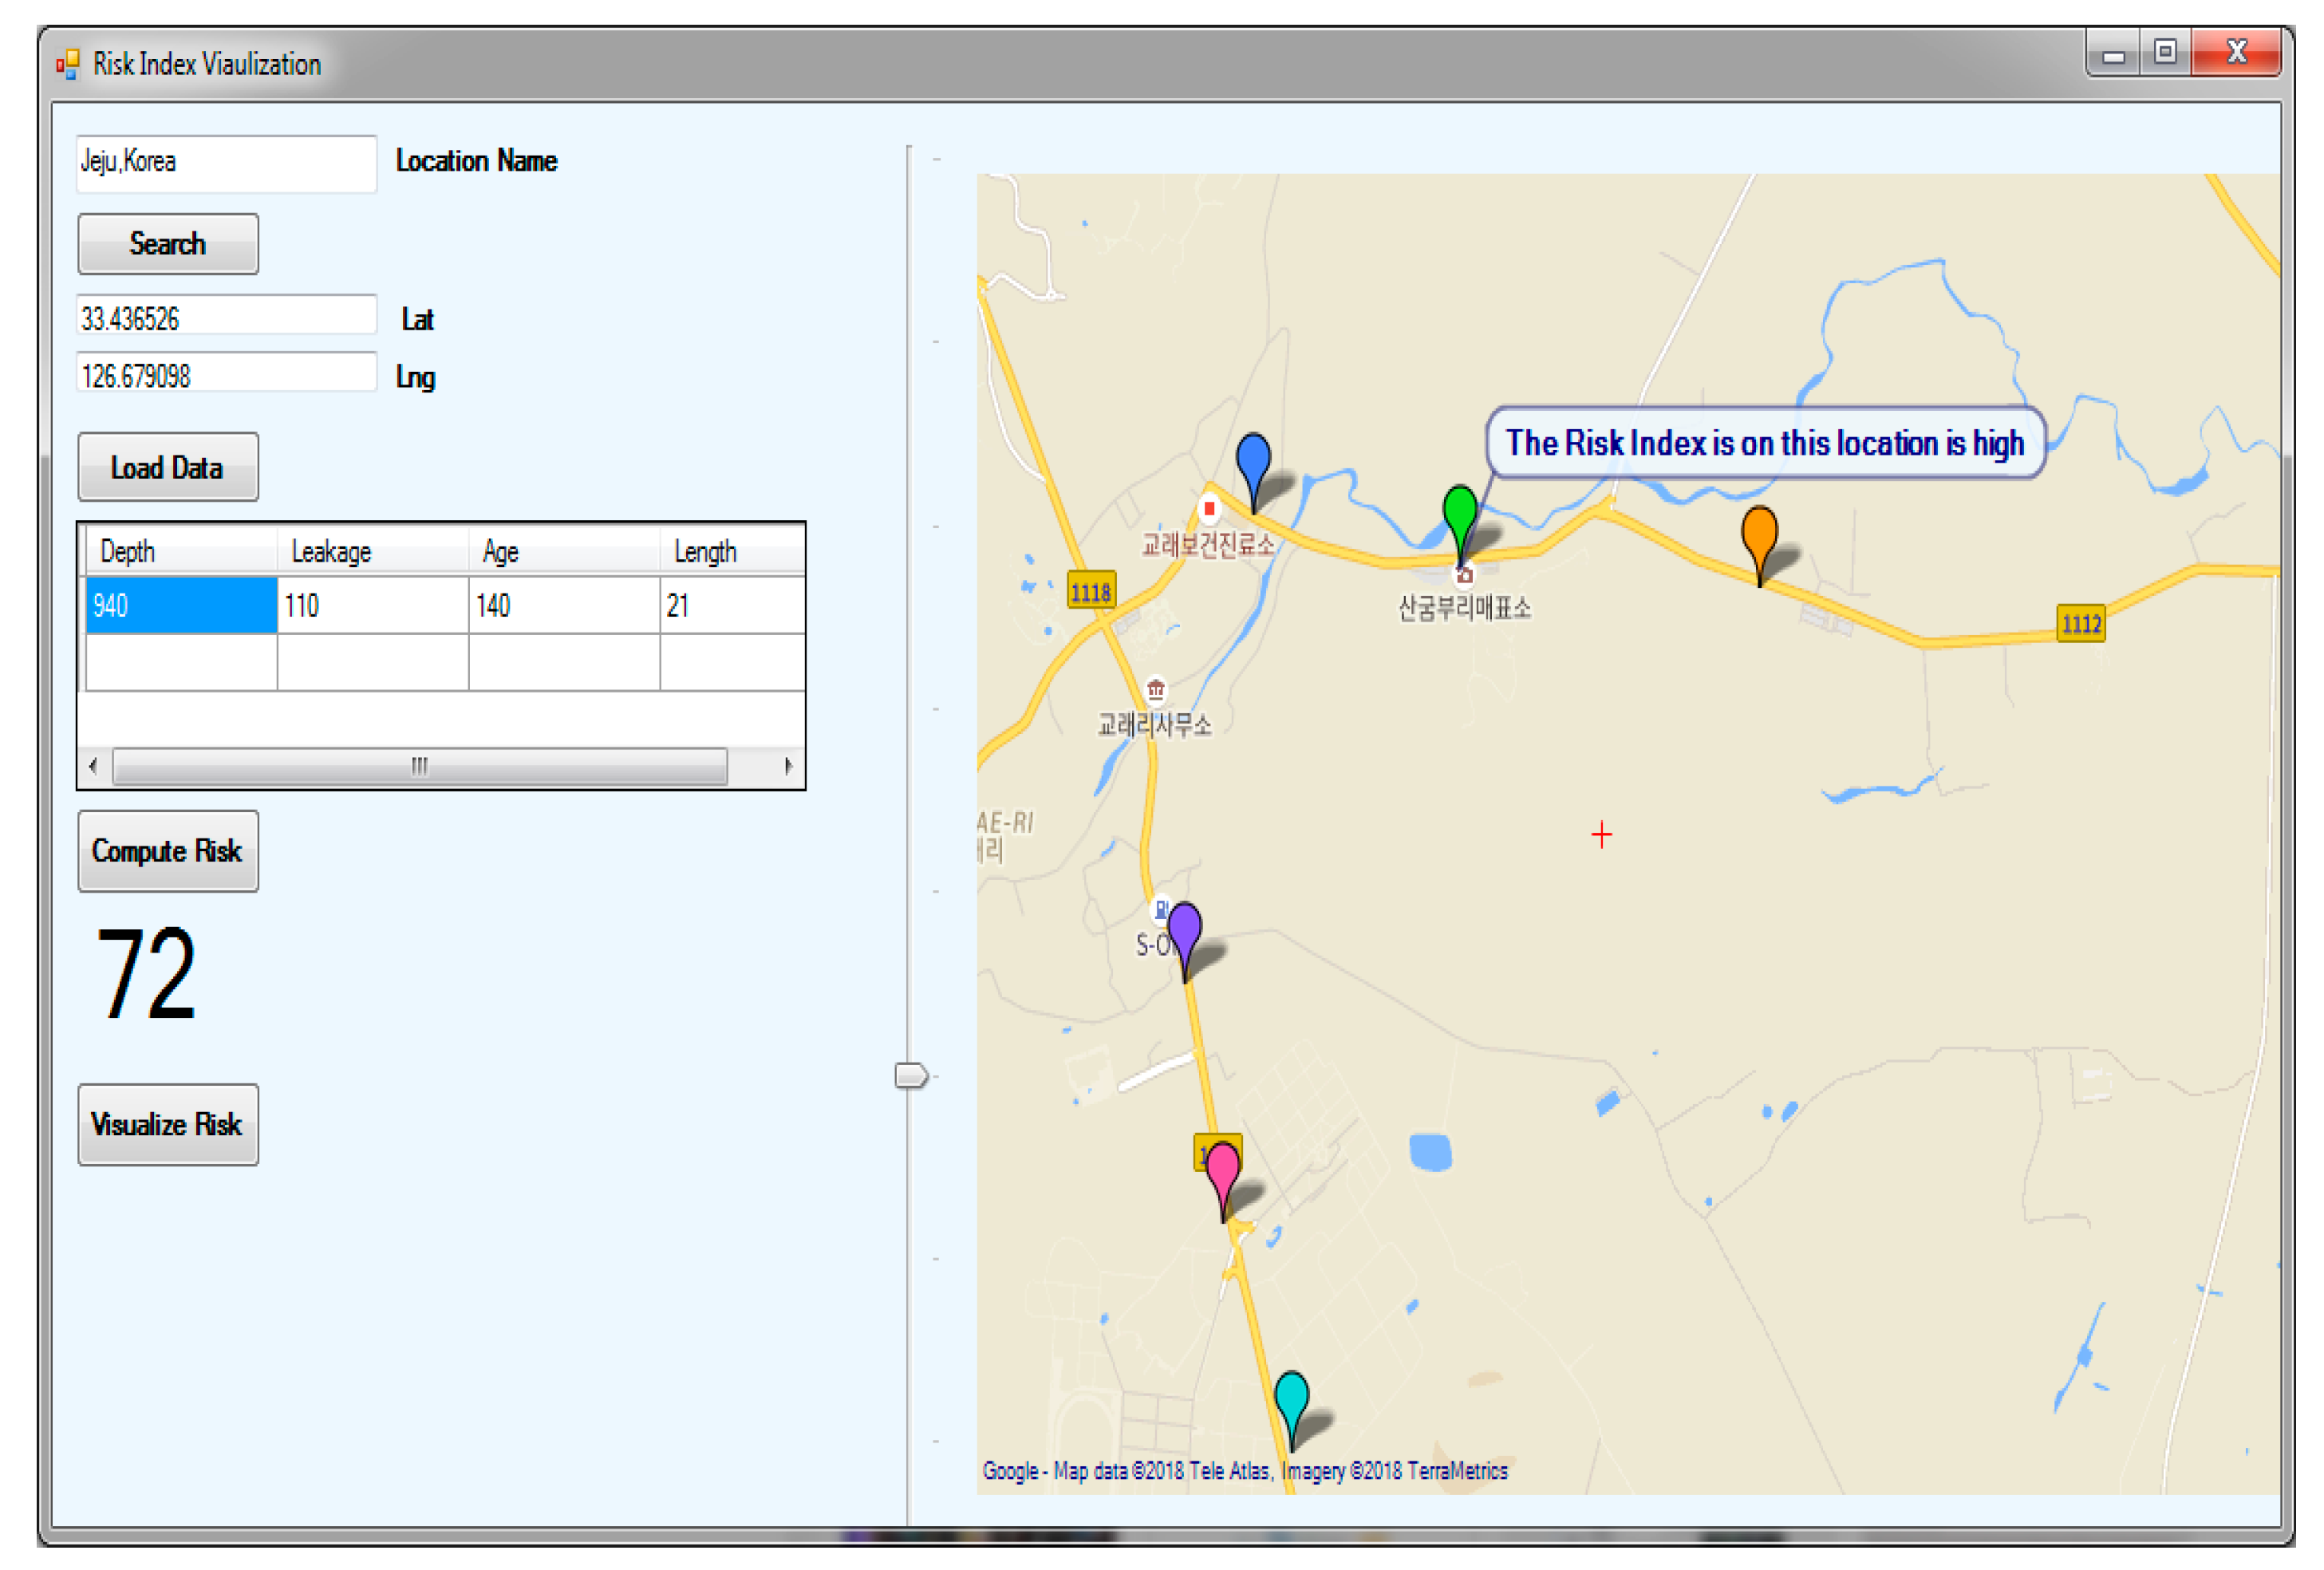
Figure 18 shows the visualization of the water supply risk index values. First, the risk index values were computed using blended hierarchical fuzzy logic model and then the computed risk index values for water supply pipelines were plotted on a GIS map in order to help the caretaker to trace the defective points in the water supply pipeline. The latitude and longitude of the location, where water supply pipelines risk index values are needed for calculations, are provided (the latitude values are not real). Next, the location where pipelines are installed was searched and the values of the parameters depth, leakage, age, and length were loaded by clicking on the load button. Then, the risk index of the water supply pipeline of the given location was computed by clicking on the compute risk button. Finally, the risk index values were shown on GIS map in the form of a marker. We used different marker colors to represent different risk index levels. Specifically, red, blue, green, orange, purple, pink, and light blue markers represent the extremely very high risk, very high risk, high risk, medium risk, low risk, very low risk, and extremely very low risk, respectively.
4.3. Discussion
In order to assess the risk index of the water supply pipeline, several parameters were taken into account because water supply pipeline risk assessment is very complex. In this study, four parameters were considered for the water supply pipeline risk assessment. It is expected that new parameters will also be taken into account in the near future. In this situation, the conventional fuzzy logic is not a wise choice to assess the water supply pipeline risk index. A system that has the capacity to deal with the curse of dimensionality is required when assessing the water supply pipeline risk index. It is quite challenging to design a fuzzy logic with a distinct structure for four parameters in order to reduce the curse of dimensionality.
The purpose of the proposed blended hierarchical fuzzy model was to reduce the number of rules in the rule base. The proposed model has three main modules with sub-fuzzy logics. Using Equation (1), the possible number of rules can be defined for our proposed blended hierarchical fuzzy logic model, such as:
Similarly, Equation (2) can be used to define all possible rules in conventional fuzzy logic as below.
In contrast to conventional fuzzy logic, the proposed blended hierarchical model takes fewer rules to compute the risk index. As it is expected that new parameters will be added to the system in the future, such a fuzzy inference system is required to reduce the number of rules in the rule base. For a fuzzy inference system with m input variables, the partition of each input variable is carried out into n fuzzy sets. Then, it can be observed that to build a complete fuzzy system, nm rules (if an identical number of membership functions have been defined for each input variable) are required. If input variables reaches seven and for each variable five fuzzy sets are defined, the total number of rules that would be required to design a complete system would be 57 = 78,125. The designing of these huge numbers of rules is almost impossible for an expert. If we use the proposed blended hierarchical system, the number of rules would be n2 × m = 52 × 7 = 175, which is an extremely lower number of rules compared to that required for conventional fuzzy logic. It is also necessary to define more fuzzy sets for a variable in order to completely represent the data, but defining more fuzzy sets also increases the number of rules. For example, if eight fuzzy sets are defined for seven input variables, then the number of rules would be 87 = 2,097,152 in the case of conventional fuzzy logic. For the same number of input variables and the same number of fuzzy sets for each input variable, the number of rules would be 82 × 7 = 448 in the blended hierarchical fuzzy logic. Rule reduction is enormously significant because the transparency and interpretation are damaged by the curse of dimensionality and it is very tough to design a large number of significant rules. Rule designing requires more concentration, while in the case of fewer rules an expert can concentrate in a more efficient and productive way while designing rules for a system. However, it is extremely difficult to design thousands of rules with appropriate concentration. Accurate rule designing is very important because any error in the rules may lead to an unfortunate situation. The proposed model has a direct impact on accuracy as well as on computation time. The RMSE values to measure the accuracy indicate that the proposed blended hierarchical fuzzy logic provides better results.
The mathematical formulation also increases as the number of parameters increase in each module of fuzzy logic, such as in the fuzzification module, defuzzification module, and knowledge base module. It is very difficult to deal with these mathematical formulas with accuracy, i.e., Equation (4) is a generic rule in the rule base [34]:
where represents the jth rule and (j = 1, 2,…N, i = 1, 2,…..n), = fuzzy subsets of the inputs and outputs respectively. If we use the conventional fuzzy logic with four input parameters, a rule could be designed as below using Equation (5).
This is a sample of a rule in rule base. However, in reality, many operations are required as new parameters enter into the system. The proposed blended hierarchical fuzzy logic system also reduces the mathematical formulas in each module of fuzzy logic.
The blended hierarchical fuzzy logic system not only reduces the number of rules in the rule base, but also renders the designing of rules simpler and easier. In conventional fuzzy logic, the rules designer normally has to take into account many variables while making rules, but the proposed blended model reduces the number of variables in each module, hence it is easy for the designer to design rules.
Risk index visualization was also carried out in the proposed model. The risk index visualization assists the caretakers to take measures before any loss. The GIS provides a graphical interface for the caretakers and from the interface the caretakers can assess the severity of the risk index on a particular point. We visualized the results on Google Maps for numerous reasons; first, Google Maps allows non-technical users to understand the risk points in designated areas by just looking at the map and it does not require a deeper look into the technical factors. Second, without visualization, the alternate way would be to give the risk location in the form of json arrays or an xml feed. These formats would also serve the purpose but the level of clarity would be reduced as compared to the visual interfaces we developed using Google Maps.
5. Conclusions and Future Work
In this paper, a model based on hierarchical fuzzy logic and a GIS map for water supply risk index assessment and visualization was proposed. The proposed model consists two modules, namely the blended hierarchical fuzzy logic module and the risk index visualization module. The blended hierarchical fuzzy logic model is used to reduce dimensionality as new variables enter into the system. The central benefit of the proposed model is its simplicity in the structure of the hierarchical fuzzy logic model as opposed to that of conventional fuzzy logic. The blended hierarchical fuzzy logic model also has the feature that the numbers of rules in the rule base do not increase exponentially as new parameters are entered into the system. The designing of rules in the rule base is also very simple, because few parameters are taken into account in each module of the proposed model while designing rules. In conventional fuzzy logic, all of the parameters are considered at one time while designing rules, which ultimately increases the complexity for the rules designer and increases the probability of errors while making rules. The proposed method was deployed on real data to calculate the water supply pipelines risk index and the RMSE value indicated that the blended hierarchical fuzzy logic model performs better and is suitable for practical applications. The second module of the proposed model is the visualization module, in which the risk index values calculated through the blended hierarchical fuzzy logic model are mapped on a GIS map in order to provide a graphical interface for the caretaker to find problematic locations. Different markers were used on the GIS map to indicate different risk index levels; hence, measurement can be taken accordingly to prevent any accidental loss.
In this work, we considered only the triangle membership functions. In future types of risk assessment, different distributions of membership functions would be investigated in order to improve accuracy. In the future, we would also include more parameters for the water supply pipeline risk index assessment.
Author Contributions
M.F. conceived the idea for this paper, designed and performed the experiments and wrote the paper; S.A. assisted in model designing and experiments. I.U. helped in writing review and results analysis. D.K. conceived the overall idea of water supply pipelines risk index assessment and visualization, and supervised this work.
Acknowledgments
This research was supported by the MSIT(Ministry of Science and ICT), Korea, under the ITRC(Information Technology Research Center) support program(2014-1-00743) supervised by the IITP(Institute for Information & communications Technology Promotion), and this work was supported by Institute for Information & communications Technology Promotion(IITP) grant funded by the Korea government(MSIT) (No.2017-0-00756, Development of interoperability and management technology of IoT system with heterogeneous ID mechanism). Any correspondence related to this paper should be addressed to DoHyeun Kim; [email protected].
Conflicts of Interest
The authors declare no conflict of interest.
References
- Kleiner, Y.; Rajani, B. Considering time-dependent factors in the statistical prediction of water main breaks. In Proceedings of the American Water Works Association Infrastructure Conference, Baltimore, MD, USA, 12 March 2000; pp. 12–15. [Google Scholar]
- Kleiner, Y.; Rajani, B. Forecasting variations and trends in water-main breaks. J. Infrastruct. Syst. 2002, 8, 122–131. [Google Scholar] [CrossRef]
- Kiefner, J.; Rosenfeld, M. The Role of Pipeline Age in Pipeline Safety; INGAA: Worthington, OH, USA, 2012. [Google Scholar]
- Christodoulou, S.E. Water network assessment and reliability analysis by use of survival analysis. Water Resour. Manag. 2011, 25, 1229–1238. [Google Scholar] [CrossRef]
- Inanloo, B.; Tansel, B.; Shams, K.; Jin, X.; Gan, A. A decision aid GIS-based risk assessment and vulnerability analysis approach for transportation and pipeline networks. Saf. Sci. 2016, 84, 57–66. [Google Scholar] [CrossRef]
- Christodoulou, S.; Aslani, P.; Deligianni, A. Integrated GIS-based management of water distribution networks. In Proceedings of the International Conference on Computing and Decision Making in Civil and Building Engineering, Montreal, QC, Canada, 14–16 June 2006; pp. 858–865. [Google Scholar]
- Tang, X.; Liu, Y.; Zheng, L.; Ma, C.; Wang, H. Leak detection of water pipeline using wavelet transform method. In Proceedings of the International Conference on Environmental Science and Information Application Technology, Wuhan, China, 4–5 July 2009; IEEE: Piscataway, NJ, USA, 2009; pp. 217–220. [Google Scholar]
- Caleyo, F.; Velazquez, J.; Valor, A.; Hallen, J. Probability distribution of pitting corrosion depth and rate in underground pipelines: A monte carlo study. Corros. Sci. 2009, 51, 1925–1934. [Google Scholar] [CrossRef]
- Pokoradi, L. Fuzzy logic-based risk assessment. Acad. Appl. Res. Mil. Sci. 2002, 1, 63–73. [Google Scholar]
- Markowski, A.S.; Mannan, M.S. Fuzzy logic for piping risk assessment (pflopa). J. Loss Prev. Process Ind. 2009, 22, 921–927. [Google Scholar] [CrossRef]
- Mamdani, E.H.; Assilian, S. An experiment in linguistic synthesis with a fuzzy logic controller. Int. J. Man Mach. Stud. 1975, 7, 1–13. [Google Scholar] [CrossRef]
- Christodoulou, S.; Deligianni, A.; Aslani, P.; Agathokleous, A. Risk-based asset management of water piping networks using neurofuzzy systems. Comput. Environ. Urban Syst. 2009, 33, 138–149. [Google Scholar] [CrossRef]
- Ataoui, R.; Ermini, R. Risk assessment of water distribution service. Procedia Eng. 2017, 186, 514–521. [Google Scholar] [CrossRef]
- Fayaz, M.; Ullah, I.; Park, D.-H.; Kim, K.; Kim, D. An integrated risk index model based on hierarchical fuzzy logic for underground risk assessment. Appl. Sci. 2017, 7, 10–37. [Google Scholar] [CrossRef]
- Li, D.; Yao, W. Risk assessment of long-distance water transmission pipeline based on fuzzy similarity evaluation approach. In Proceedings of the 2016 12th International Conference on Natural Computation, Fuzzy Systems and Knowledge Discovery (ICNC-FSKD), Changsha, China, 13–15 August 2016; IEEE: Piscataway, NJ, USA, 2016; pp. 1096–1102. [Google Scholar]
- Zhang, J.; Gao, J.; Diao, M.; Wu, W.; Wang, T.; Qi, S. A case study on risk assessment of long distance water supply system. Procedia Eng. 2014, 70, 1762–1771. [Google Scholar] [CrossRef]
- Shamir, U.; Howard, C.D. An analytic approach to scheduling pipe replacement. Water Works Assoc. 1979, 71, 248–258. [Google Scholar] [CrossRef]
- Walski, T.M.; Pelliccia, A. Economic analysis of water main breaks. Water Works Assoc. 1982, 140–147. [Google Scholar] [CrossRef]
- Kettler, A.; Goulter, I. An analysis of pipe breakage in urban water distribution networks. Can. J. Civ. Eng. 1985, 12, 286–293. [Google Scholar] [CrossRef]
- Clark, R.M.; Stafford, C.L.; Goodrich, J.A. Water distribution systems: A spatial and cost evaluation. J. Water Resour. Plan. Manag. Div. 1982, 108, 243–256. [Google Scholar]
- Kleta, H.; Heyduk, A. Image processing and analysis as a diagnostic tool for an underground infrastructure technical condition monitoring. Undergr. Infrastruct. Urban Areas 2014, 3, 39. [Google Scholar]
- Lej, K. The technical and economic conditions for the construction of the central section of metro line ii in warsaw. Undergr. Infrastruct. Urban Areas 2014, 3, 85. [Google Scholar]
- Kuttisseril, J.; Kuang, K. Development of a low-cost image processing technique for crack detection for structural health monitoring. In 3rd ASEAN Australian Engineering Congress (AAEC 2015): Australian Engineering Congress on Innovative Technologies for Sustainable Development and Renewable Energy; Engineers Australia: Barton, Australia, 2015; p. 55. [Google Scholar]
- Ustinovichius, L.; Barvidas, A.; Vishnevskaja, A.; Ashikhmin, I.V. Multicriteria verbal analysis for the decision of construction problems. Technol. Econ. Dev. Econ. 2009, 15, 326–340. [Google Scholar] [CrossRef]
- Qi, D.; Liu, Y.; Wu, X.; Zhang, Z. An algorithm to detect the crack in the tunnel based on the image processing. In Proceedings of the 2014 Tenth International Conference on Intelligent Information Hiding and Multimedia Signal Processing (IIH-MSP), Kitakyushu, Japan, 27–29 August 2014; IEEE: Piscataway, NJ, USA, 2014; pp. 860–863. [Google Scholar]
- Meng, Q.; Wang, X.; Qu, X.; Yong, K.; Lee, S.; Wong, S. Quantitative risk assessment models of road tunnels–state of the art and their implications for Singapore’s road tunnels. In Proceedings of the 2nd International Tunnel Safety Forum for Road and Rail, Lyon, France, 20–22 April 2009; pp. 20–22. [Google Scholar]
- Zhang, X.; Yan, S. Event tree analysis for steam generator tube ruptures. Nuclear Power Eng. 1999, 20, 168–173. [Google Scholar]
- Meng, Q.; Qu, X.; Wang, X.; Yuanita, V.; Wong, S.C. Quantitative risk assessment modeling for nonhomogeneous urban road tunnels. Risk Anal. 2011, 31, 382–403. [Google Scholar] [CrossRef] [PubMed]
- Duzgun, H. Analysis of roof fall hazards and risk assessment for zonguldak coal basin underground mines. Int. J. Coal Geol. 2005, 64, 104–115. [Google Scholar] [CrossRef]
- Nyvlt, O.E.; Privara, S.; Ferkl, L.A. Probabilistic risk assessment of highway tunnels. Tunn. Undergr. Space Technol. 2011, 26, 71–82. [Google Scholar] [CrossRef]
- Sari, M.; Selcuk, A.S.; Karpuz, C.; Duzgun, H.S.B. Stochastic modeling of accident risks associated with an underground coal mine in turkey. Saf. Sci. 2009, 47, 78–87. [Google Scholar] [CrossRef]
- Jahanshahi, M.R.; Masri, S.F. Adaptive vision-based crack detection using 3d scene reconstruction for condition assessment of structures. Autom. Constr. 2012, 22, 567–576. [Google Scholar] [CrossRef]
- Blockley, D. Predicting the likelihood of structural accidents. Proc. Inst. Civ. Eng. 1975, 59, 659–668. [Google Scholar] [CrossRef]
- Cho, H.-N.; Choi, H.-H.; Kim, Y.-B. A risk assessment methodology for incorporating uncertainties using fuzzy concepts. Reliab. Eng. Syst. Saf. 2002, 78, 173–183. [Google Scholar] [CrossRef]
- Fujino, T. The Development of a Method for Investigating Construction Site Accidents Using Fuzzy Fault Tree Analysis; The Ohio State University: Columbus, OH, USA, 1994. [Google Scholar]
- Wang, Y.-M.; Elhag, T.M. An adaptive neuro-fuzzy inference system for bridge risk assessment. Expert Syst. Appl. 2008, 34, 3099–3106. [Google Scholar] [CrossRef]
- Christodoulou, S.; Aslani, P.; Vanrenterghem, A. A risk analysis framework for evaluating structural degradation of water mains in urban settings, using neurofuzzy systems and statistical modeling techniques. In Proceedings of the World Water & Environmental Resources Congress, Philadelphia, PA, USA, 23–26 June 2003; pp. 1–9. [Google Scholar]
- Zadeh, L.A. Fuzzy Sets, Fuzzy Sets, Fuzzy Logic, and Fuzzy Systems: Selected Papers by Lotfi A. Zadeh; World Scientific Publishing Co., Inc.: River Edge, NJ, USA, 1996; pp. 394–432. [Google Scholar]
- Zhao, J.; Bose, B.K. Evaluation of membership functions for fuzzy logic controlled induction motor drive. IEEE 2002 28th Annual Conference of the Industrial Electronics Society, Sevilla, Spain, 5–8 November 2002; IEEE: Piscataway, NJ, USA, 2002; pp. 229–234. [Google Scholar]
Figure 1.
Proposed water supply pipeline risk assessment and visualization model.

Figure 2.
Conventional fuzzy logic model for four input parameters.

Figure 3.
Structure diagram of the Mamdani fuzzy inference system.

Figure 4.
Formulas for triangular membership functions.

Figure 5.
Detailed processing diagram of the blended hierarchical fuzzy model.

Figure 6.
Detailed representation of the blended hierarchical fuzzy risk index visualization model for water supply pipelines.
Figure 6.
Detailed representation of the blended hierarchical fuzzy risk index visualization model for water supply pipelines.

Figure 7.
Structure diagram for P1_FIS.

Figure 8.
Structure diagram for P2_FIS.

Figure 9.
Structure diagram for B_FIS.

Figure 10.
Input/output membership functions for P1_FIS. (a) Input depth; (b) input length; and (c) output partial 1 risk index.
Figure 10.
Input/output membership functions for P1_FIS. (a) Input depth; (b) input length; and (c) output partial 1 risk index.

Figure 11.
Example of fuzzy rules used in P1_FIS.

Figure 12.
Input/output triangular membership functions for P2_FIS. (a) Input leakage; (b) input age; and (c) output partial 2 risk index.
Figure 12.
Input/output triangular membership functions for P2_FIS. (a) Input leakage; (b) input age; and (c) output partial 2 risk index.


Figure 13.
Example of fuzzy rules used in P2_FIS.

Figure 14.
Output membership functions for B_FIS.

Figure 15.
Example of fuzzy rules used in B_FIS.

Figure 16.
Graphical representations of input data: (a) depth; (b) length; (c) age; and (d) leakage.
Figure 16.
Graphical representations of input data: (a) depth; (b) length; (c) age; and (d) leakage.


Figure 17.
The actual risk index and blended hierarchical fuzzy logic risk index at different locations.
Figure 17.
The actual risk index and blended hierarchical fuzzy logic risk index at different locations.

Figure 18.
Water supply pipeline risk index visualization.


Table 1.
Fuzzy rules in partial 1 FIS.
| X1 | NS | LD | NN | N | D | VD |
|---|---|---|---|---|---|---|
| X2 | ||||||
| VS | VL | VL | L | M | M | VL |
| S | L | L | M | M | H | L |
| M | L | M | M | H | VH | L |
| H | M | M | H | VH | VH | M |
| VH | M | H | VH | VH | VH | H |
Table 2.
Fuzzy rules in partial 2 FIS.
| X3 | NL | VL | L | M | H | VH |
|---|---|---|---|---|---|---|
| X4 | ||||||
| VO | VL | VL | L | M | M | VH |
| O | VL | L | M | M | H | VH |
| NA | L | M | M | H | VH | VH |
| N | M | M | H | VH | VH | VH |
| BN | M | H | VH | VH | VH | VH |
Table 3.
Fuzzy rules in the blended FIS.
| P1 | VL | L | M | H | VH |
|---|---|---|---|---|---|
| P2 | |||||
| VL | VL | VL | L | M | M |
| L | VL | L | M | M | H |
| M | L | M | M | H | VH |
| H | M | M | H | VH | VH |
| VH | M | H | VH | VH | VH |
© 2018 by the authors. Licensee MDPI, Basel, Switzerland. This article is an open access article distributed under the terms and conditions of the Creative Commons Attribution (CC BY) license (http://creativecommons.org/licenses/by/4.0/).
Share and Cite
MDPI and ACS Style
Fayaz, M.; Ahmad, S.; Ullah, I.; Kim, D. A Blended Risk Index Modeling and Visualization Based on Hierarchical Fuzzy Logic for Water Supply Pipelines Assessment and Management. Processes 2018, 6, 61. https://doi.org/10.3390/pr6050061
AMA Style
Fayaz M, Ahmad S, Ullah I, Kim D. A Blended Risk Index Modeling and Visualization Based on Hierarchical Fuzzy Logic for Water Supply Pipelines Assessment and Management. Processes. 2018; 6(5):61. https://doi.org/10.3390/pr6050061
Chicago/Turabian StyleFayaz, Muhammad, Shabir Ahmad, Israr Ullah, and DoHyeun Kim. 2018. "A Blended Risk Index Modeling and Visualization Based on Hierarchical Fuzzy Logic for Water Supply Pipelines Assessment and Management" Processes 6, no. 5: 61. https://doi.org/10.3390/pr6050061
Note that from the first issue of 2016, this journal uses article numbers instead of page numbers. See further details here.