Modelling of a Naphtha Recovery Unit (NRU) with Implications for Process Optimization


Department of Chemical Engineering & Applied Chemistry, University of Toronto, Toronto, ON M5S 3E5, Canada
*
Author to whom correspondence should be addressed.
Processes 2018, 6(7), 74; https://doi.org/10.3390/pr6070074
Submission received: 30 May 2018
/
Revised: 16 June 2018
/
Accepted: 18 June 2018
/
Published: 22 June 2018
(This article belongs to the Special Issue Modeling and Simulation of Energy Systems)
Abstract
:The naphtha recovery unit (NRU) is an integral part of the processes used in the oil sands industry for bitumen extraction. The principle role of the NRU is to recover naphtha from the tailings for reuse in this process. This process is energy-intensive, and environmental guidelines for naphtha recovery must be met. Steady-state models for the NRU system are developed in this paper using two different approaches. The first approach is a statistical, data-based modelling approach where linear regression models have been developed using Minitab® from plant data collected during a performance test. The second approach involves the development of a first-principles model in Aspen Plus® based on the NRU process flow diagram. A novel refinement to this latter model, called “withdraw and remix”, is proposed based on comparing actual plant data to model predictions around the two units used to separate water and naphtha. The models developed in this paper suggest some interesting ideas for the further optimization of the process, in that it may be possible to achieve the required naphtha recovery using less energy. More plant tests are required to validate these ideas.
Note to reader regarding figures: The units of some of the variables in the figures have been normalized or expressed as a percentage of the working range for proprietary reasons.
1. Introduction
The naphtha recovery unit (NRU) is an important process used to recover the hydrocarbon diluent (naphtha) that is used to assist with bitumen extraction from oil sands [1]. Oil extraction from oil sands has drawn considerable public attention due to its energy consumption and ecological footprint. The NRU plays a key role in both respects in that it requires energy (steam) to recover the naphtha for reuse in the process and it discharges unrecovered naphtha to the environment (tailings pond).
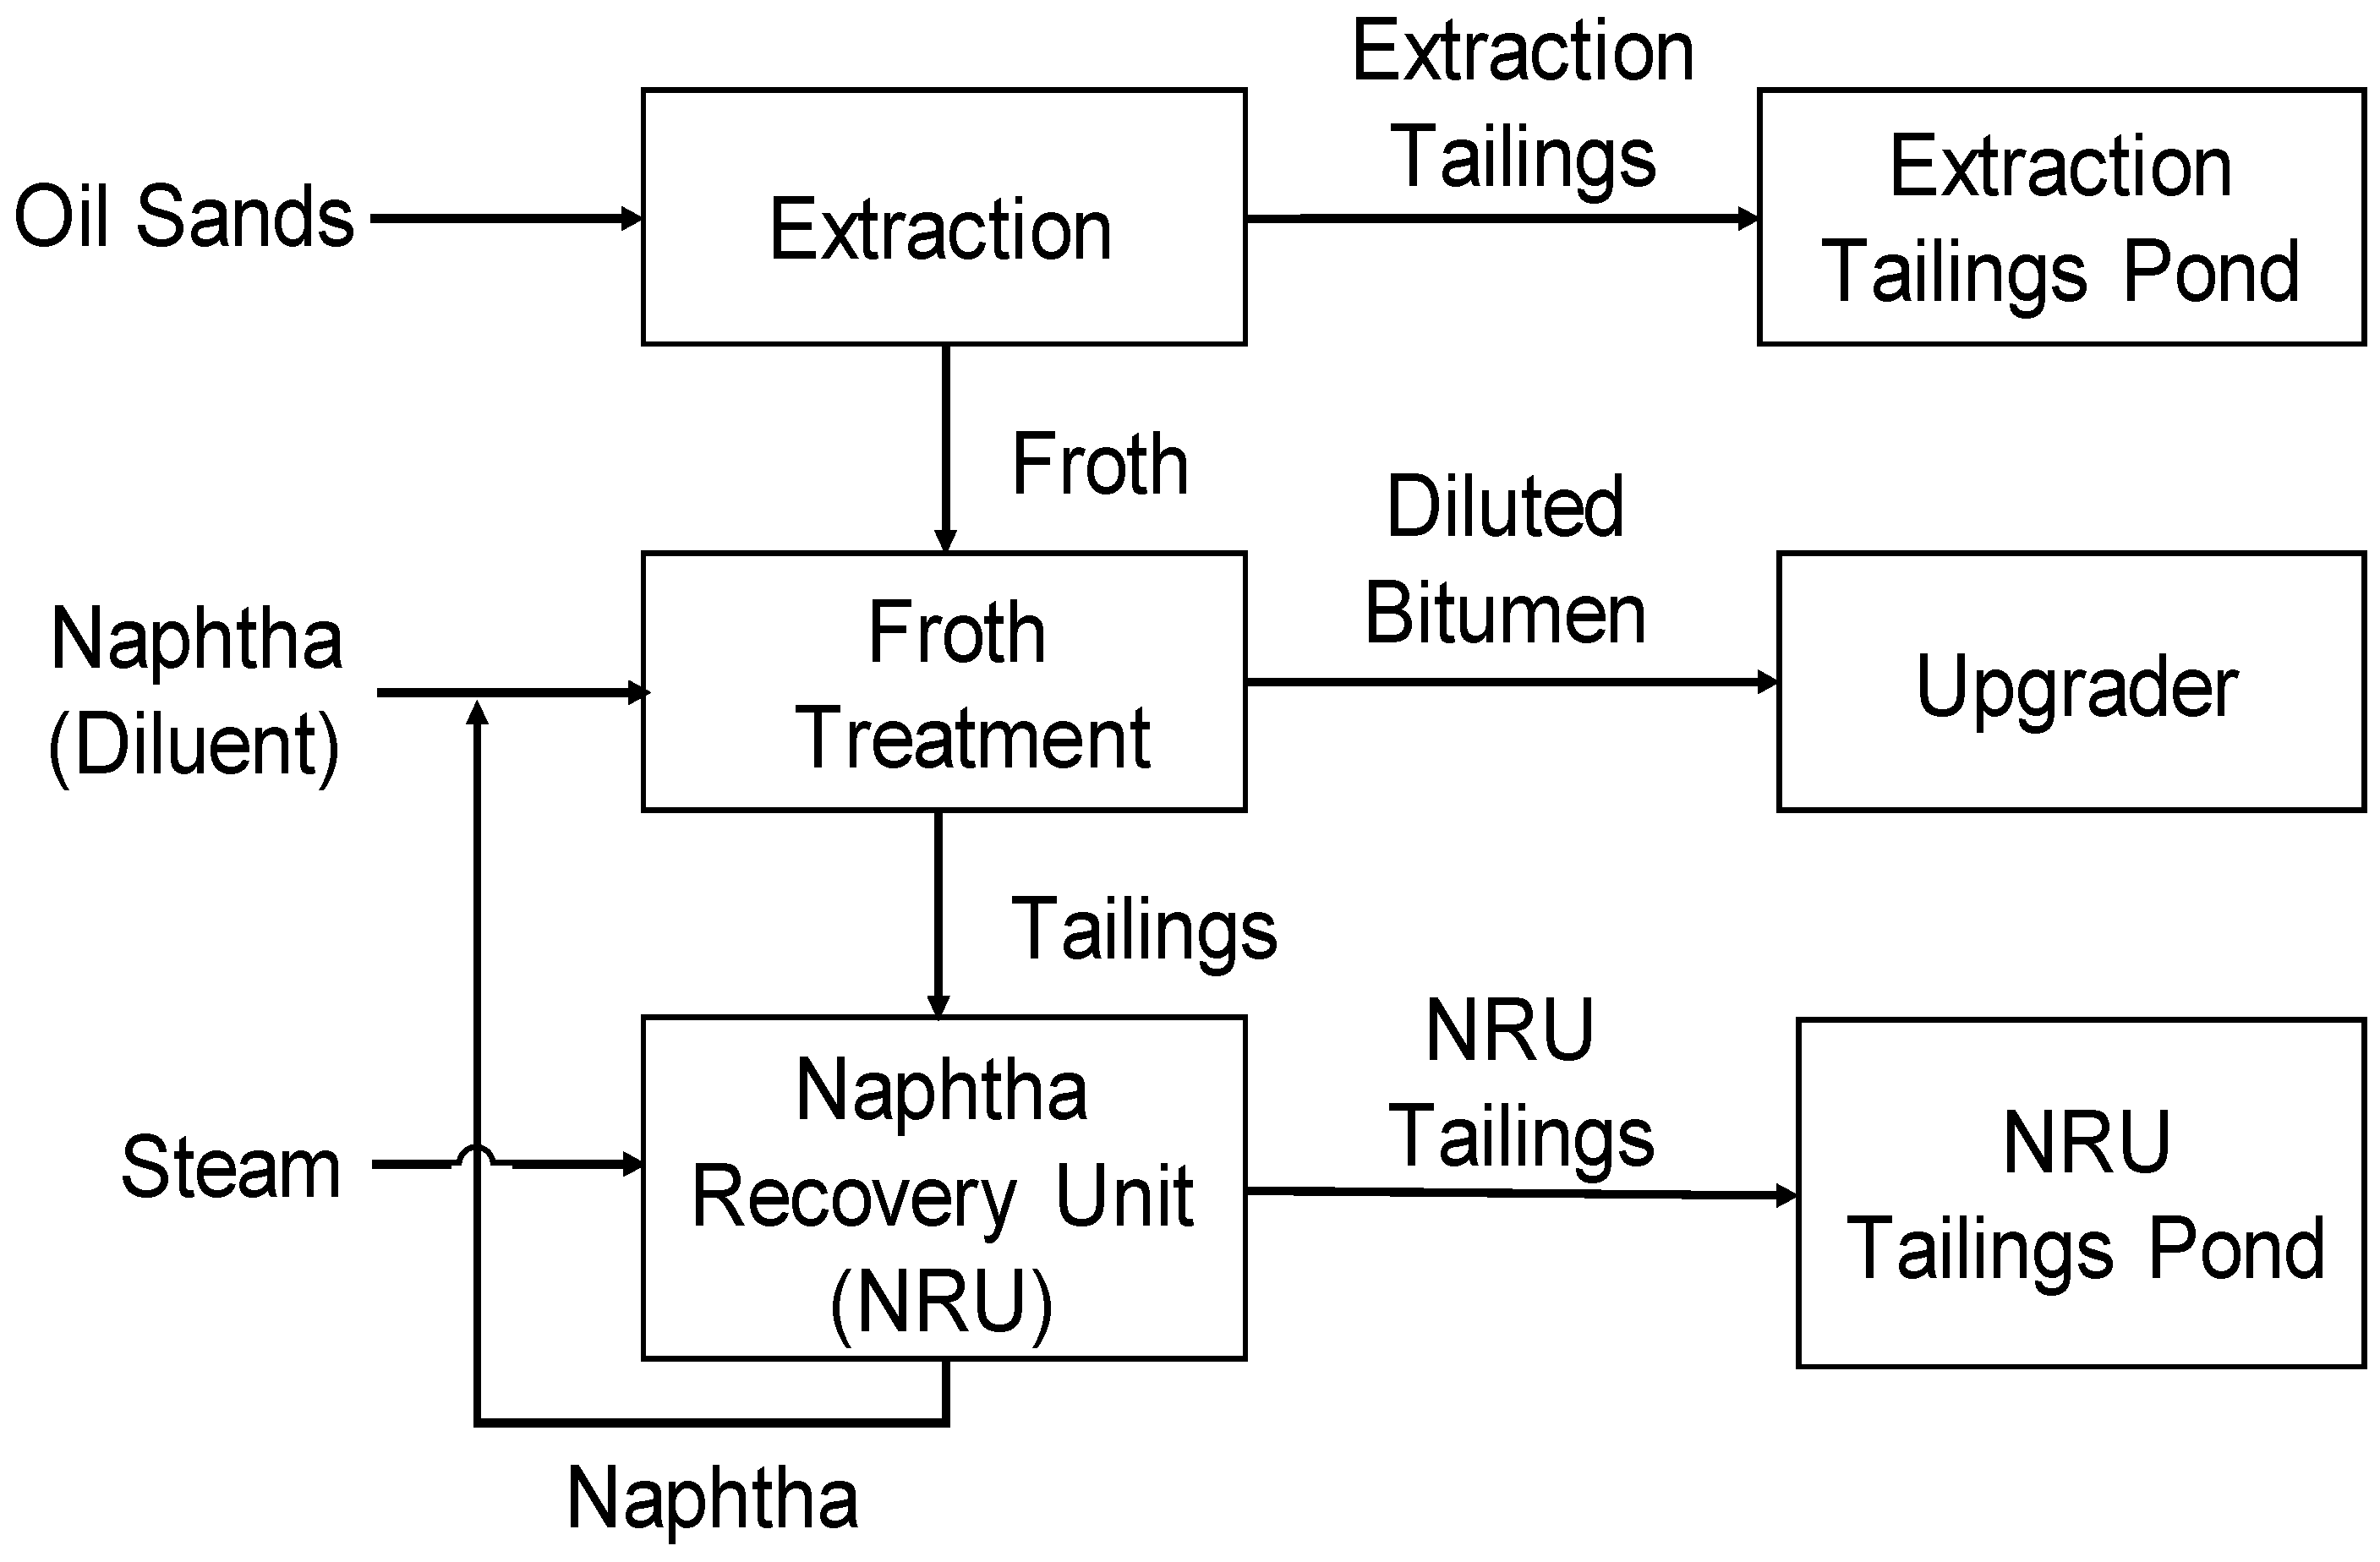
Figure 1 gives a simplified process flow diagram to help put the NRU in the context of the bitumen extraction process. The froth that is produced from a hot water extraction process is a highly viscous fluid containing approximately 60% bitumen, 30% water and 10% solids on a weight basis. This froth is diluted with naphtha and is sent to a centrifuge system where the bitumen is separated and sent downstream for upgrading. The tailings, consisting of mostly water, sand and trace amounts of diluent and bitumen, are sent to the NRU. The NRU consists of a vacuum stripping tower with steam injected at the bottom of the deck. As its name implies, this unit recovers naphtha from the tailings for reuse and the remnants are discharged to the tailings pond.
Figure 2 offers a closer look at the NRU. The feed to the NRU column consists of the tailings from the upstream centrifuge system. Because the column is operated under vacuum, the feed flashes with a vapour mixture of water and naphtha rising up the column. A demister pad at the top of the column knocks out liquid droplets and solid particles entrained in the vapour. The vapour stream then enters the overhead system, where cooling water and a heat exchanger is used to condense the vapour into a liquid stream. The condensed liquid is then separated into naphtha and water by decantation in two separators that are connected in series. The recovered naphtha is sent to storage tanks for reuse and the water is recycled back to the column. The feed to the column that does not leave in the overhead vapour stream settles down in the liquid pool at the bottom of the column and is a mixture of unrecovered naphtha, solids, bitumen and water. Steam is injected directly into the liquid pool to provide heat that causes the naphtha in the pool to vaporize and travel up the column. Water from upstream upgrading facilities is also added to the column feed as an additional heating source.
In this paper, we are interested in exploring two different modelling approaches, with the goal being to optimize the NRU process, i.e., to maximize naphtha recovery while minimizing energy consumption. The first approach is based on a statistical model of the NRU process that was built using steady-state data collected during a plant trial when the steam flow to the column was varied over a wide operating range. The second approach is based on a first-principles model of the NRU process using knowledge of the process and measurements taken of key process variables.
It turns out that there is a dearth of papers in the literature that deal with the optimization of the NRU. Special issues of the Canadian Journal of Chemical Engineering were published in both 2004 and 2013 with a focus on the oil sands industry. The importance of models and soft sensors for monitoring, control and optimization of oil sands processes is discussed in [2]. In the case of the NRU, the paper’s focus is on the development of a soft sensor for measuring the composition of the product coming off the top of the NRU column. Process control and optimization are also mentioned in [3]. Here, the focus is on the use of NIR spectroscopy to analyze bitumen and solvent-diluted bitumen samples from the froth stream produced by the hot water extraction process and the development of a soft sensor based on the NIR measurements for fast routine analysis with the potential for on-line applications. These two papers, along with the overview in [4], highlight the importance of accurate measurements and the need for novel techniques to obtain such measurements in the oil sands industry, including the work presented here.
2. Performance Test on the NRU
Based on years of experience, operators at the oil sands plant where this study was performed believe that naphtha recovery is improved by injecting more steam into the NRU. Therefore, the current optimization strategy consists of injecting the maximum flowrate of steam available. Recently, however, on-site process engineers have suspected that too much steam is being injected, causing overload issues in the overhead heat exchange system, and the cost of generating additional steam is a major economic concern.
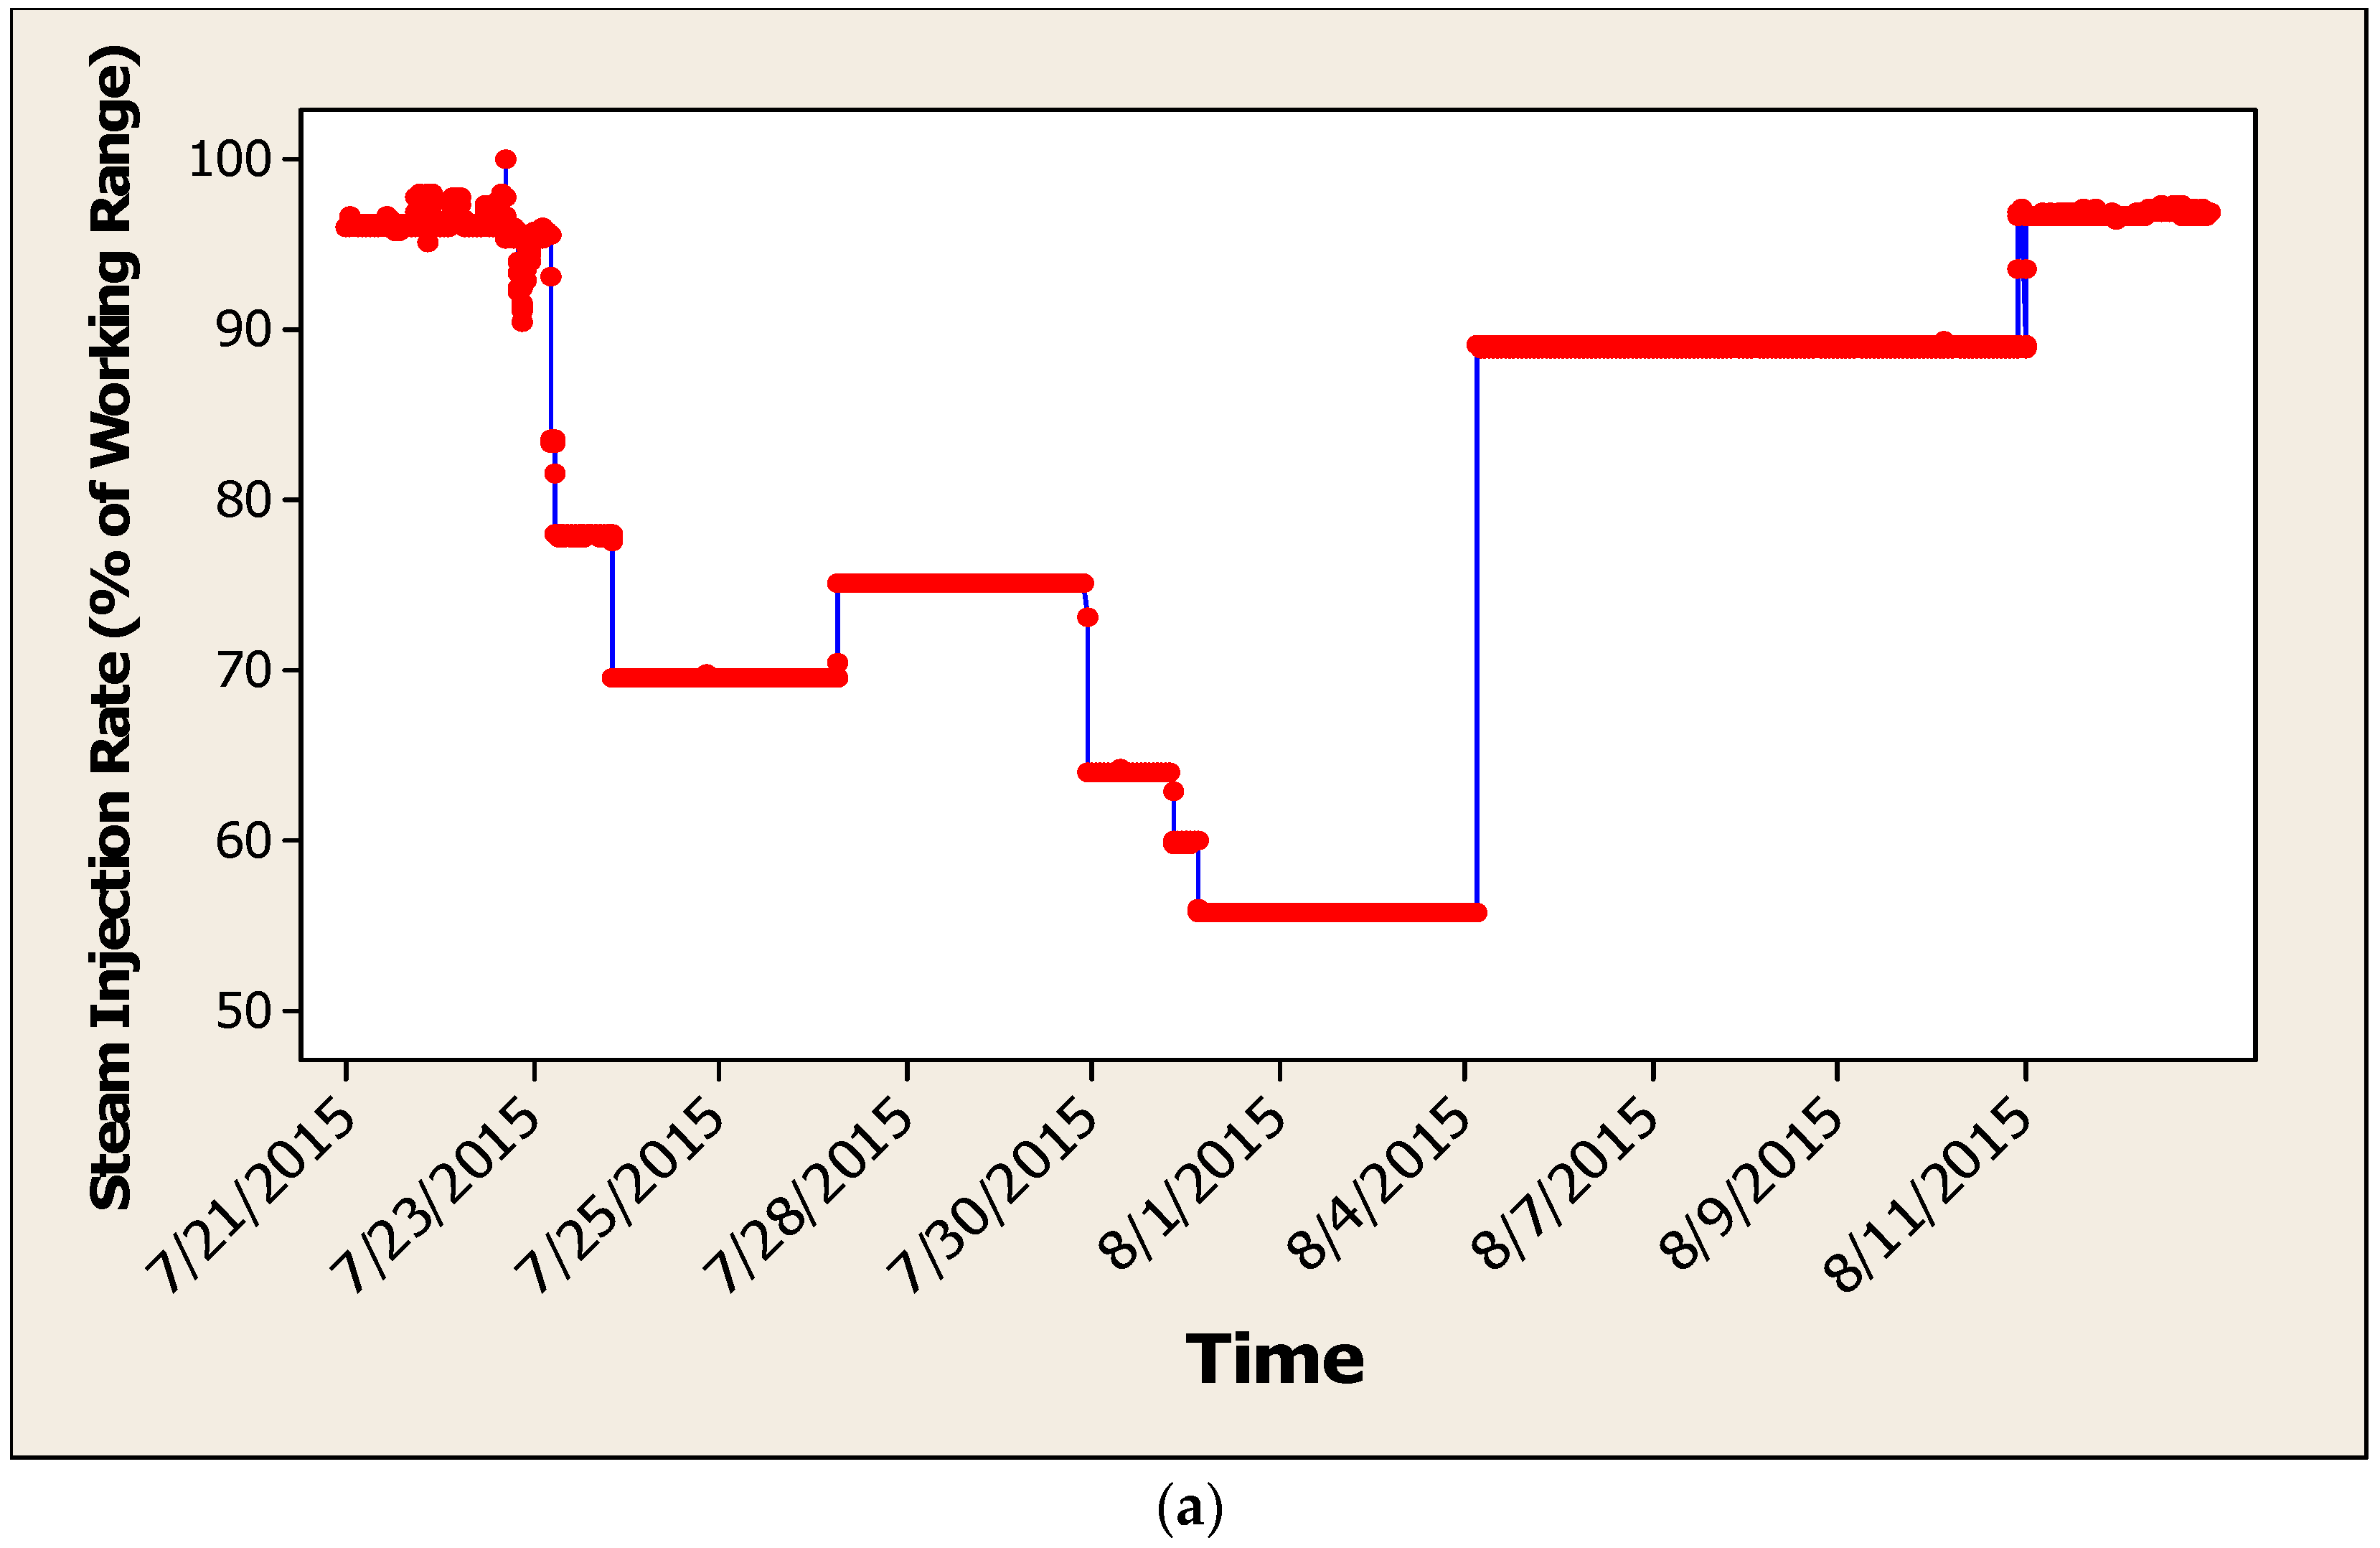
To examine this issue more carefully, a performance test was conducted in 2015 over a three-week period with the goal being to determine if the steam injection rate could be reduced without negatively affecting the naphtha recovery. During the test, the steam injection rate was reduced from its maximum value to approximately 50% of that value through a series of step changes. The steam rate was held constant for at least one day following each step. Once the steam rate reached its lower limit, it was returned to its original value in two large steps. Process data consisting of the key process variables were collected using automatic sensors every 10 min based on the process engineers’ knowledge that the time for the NRU to reach steady-state is on the order of 5 min. The steam injection rate over the test period is shown in Figure 3a.
The definition for naphtha recovery, a dimensionless quantity, used in this study is a standard in the industry and is given by Equation (1), where naphtha on the right-hand side of the equation refers to its mass flowrate:
The mass flow rate of naphtha in the feed and tailings is calculated using Equation (2):
Ultrasonic flowmeters are used to measure the total volumetric flowrate () of the feed and tailings streams. These volumetric flowrates (expressed in L/h) can be further converted into total mass flowrates using Equation (3):
where the feed and tailings streams consist of four major components, namely water, naphtha, bitumen and solids. Near-infrared (NIR) sensors are used to measure the mass fractions (wt.%) of each of these four major components in the feed and tailings streams.
3. Statistical Modelling of the NRU Using Minitab® (V16)
3.1. Principal Component Analysis (PCA)
The process variables collected during the performance test and included in the PCA are summarized here in two tables, with the first being the NRU stream variables (Table 1) and the second being the NRU operating variables (Table 2). The units in these two tables reflect the units associated with the automatic sensors. An overall mass balance was initially performed around the NRU to verify that the sensors being used were behaving consistently throughout the test period. Results showed that variations in total input and total output mass flows were being tracked consistently.
PCA was used to help determine if the data set was representative of one or more operating modes. This is similar to the classical discrimination problem proposed in [5] in their tutorial and the analysis of historical process data sets suggested in [6] in their tutorial. Minitab was used and the correlation matrix was selected where each variable was mean-centred and scaled by its standard deviation. Data points with missing values were removed from the data set manually. Outliers were removed through a combination of visual inspection and with the help of the PCA analysis itself [5]. Missing data and outliers represented less than 10% of the original data set.
Figure 3b shows a plot of the first two principal components. The data set in this reduced dimension clearly clusters into two distinct regions. By comparing the data points in each cluster to the time series plot of the steam injection schedule during the performance test (Figure 3a), it was determined that all the data points in the left-hand cluster came from data collected during the performance test up to August 4th (referred to as OP1) and all the data points found in the right-hand cluster came from the data collected after August 4th (referred to as OP2). This would seem to indicate that a distinct shift in process behaviour occurred on August 4th, coinciding with the large increase in steam flowrate that occurred at that time. Therefore, if statistical models were going to be built for prediction purposes, it would probably be best to identify separate models for the process in OP1 and OP2 [7].
3.2. Linear Regression Models
In this part of our analysis, our goal was to generate an equation that describes the statistical relationship (model) between one or more predictors (regressors) and the primary response variable of interest in this study, naphtha recovery (NR), as defined in Equation (1). Separate models were developed using Minitab for each operating mode (OP1 and OP2) based on our PCA. Each data set was divided randomly in half, and one half of the data was used for model development (training) while the other half was used for model validation (testing). Given that we have assumed the data is representative of the system at steady-state, partitioning the data in this way is valid.
Several dimensionless variables were examined as possible predictors based on our engineering knowledge of the NRU. A sequence of models was constructed iteratively by starting with a large number of predictors and then reducing the model size based on the p-value of each predictor, one predictor at a time. In the end, only the predictors that made a significant and therefore meaningful contribution to the model were retained.
The predictors that were determined to make a significant contribution in both OP1 and OP2 to NR are given here:
Composition of naphtha in the NRU feed (NF):
Normalized steam injection rate in the NRU feed (SF):
Here, we have made use of Equation (3) to normalize the steam injection rate by the feed mass flowrate in Equation (5). The 2.2 factor is needed for unit conversion and the multiplier of 100 at the right end of Equation (5) is used to bring SF to the same order of magnitude as NF and NR.
The fact that these variables have appeared in these models makes physical sense because, from an input-output point of view, NR is the primary output variable of interest, SF is a key manipulated input variable and NF is an important disturbance input variable. The modelling results are summarized in Table 3 and Table 4 and plots related to these models may be found in Figure 4 and Figure 5.
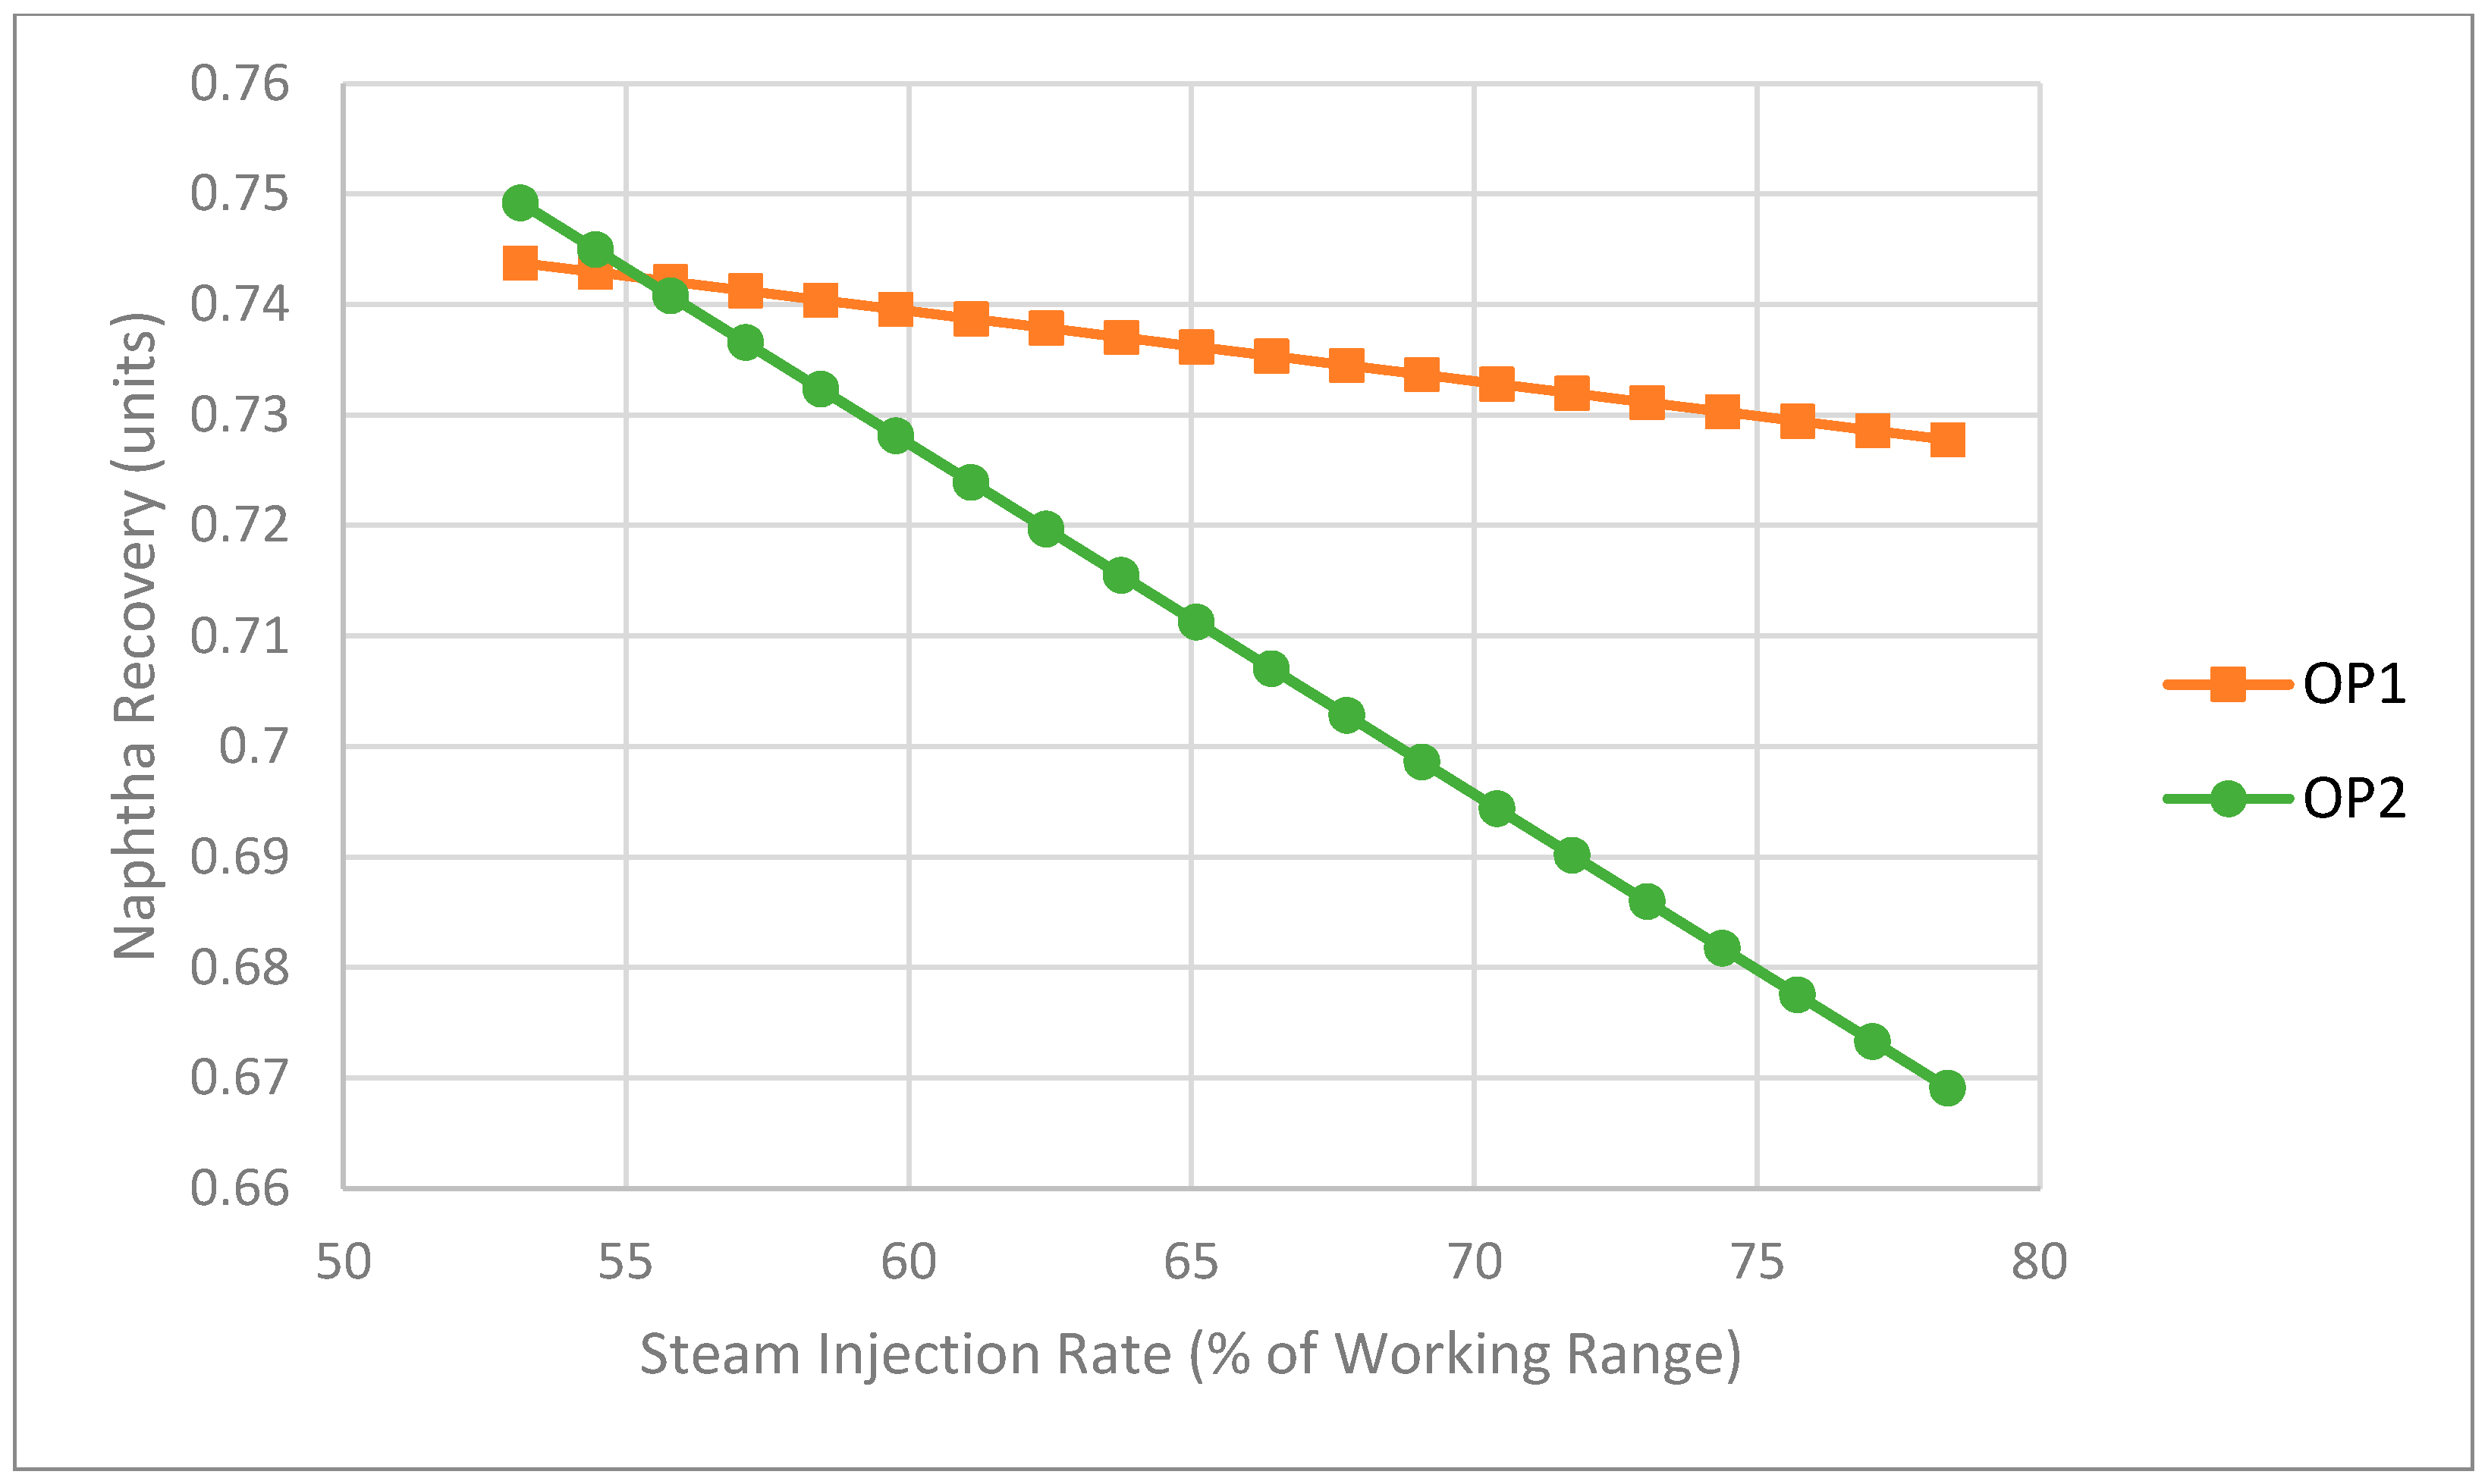
Based on these linear regression models, Figure 6 and Figure 7 were generated to look at the prediction of the individual effects of NF and SF on NR, respectively. The positive slope in Figure 6 associated with the NF to NR relationship may at first appear counterintuitive, i.e., one might expect based on mass and energy balance considerations that an increase in the mass fraction of naphtha in the feed would cause a higher naphtha loss and therefore a drop in naphtha recovery. However, given the way that naphtha recovery is defined in Equation 1, this is not necessarily the case. For example, say there are 100 units of naphtha coming in initially. If the naphtha recovery is 0.8, the naphtha loss would be 20 units. Now, let us assume the naphtha inflow increases from 100 to 130 units. The expected naphtha loss would increase as well when using the same steam flowrate; let us say it increases from 20 to 24 units. In this case, the recovery actually increases from 0.8 to 0.82 (106/130).
The negative slope in Figure 7 associated with the SF to NR relationship is also counterintuitive based on mass and energy balance considerations and is contrary to the general belief of the operators. However, it is important to point out that the NRU does not consist of only a vacuum stripping column but also includes an overhead heat exchanger system and two separators connected in series with material recycled from both separators flowing back to the column. In addition, these modelling results seem to reinforce the suspicions of the process engineers that more steam does not necessarily improve recovery because of the interaction between the column and the overhead heat exchange system. Altogether, these interesting findings are what encouraged us to dig more deeply into the problem and turn our attention away from a data-based modelling approach towards a first-principles modelling approach, as described in the following section.
Before moving to the next section, we would like to close this section by illustrating one possible application of these linear regression models. A measurement of the mass flowrate of naphtha in the tailings is given by Equations (2) and (3) written for the tailings:
Note that this measurement of naphtha in the tailings requires a measurement of the volumetric flowrate of the tailings, , and composition analysis of the tailings (wt.% of each component i in the tailings).
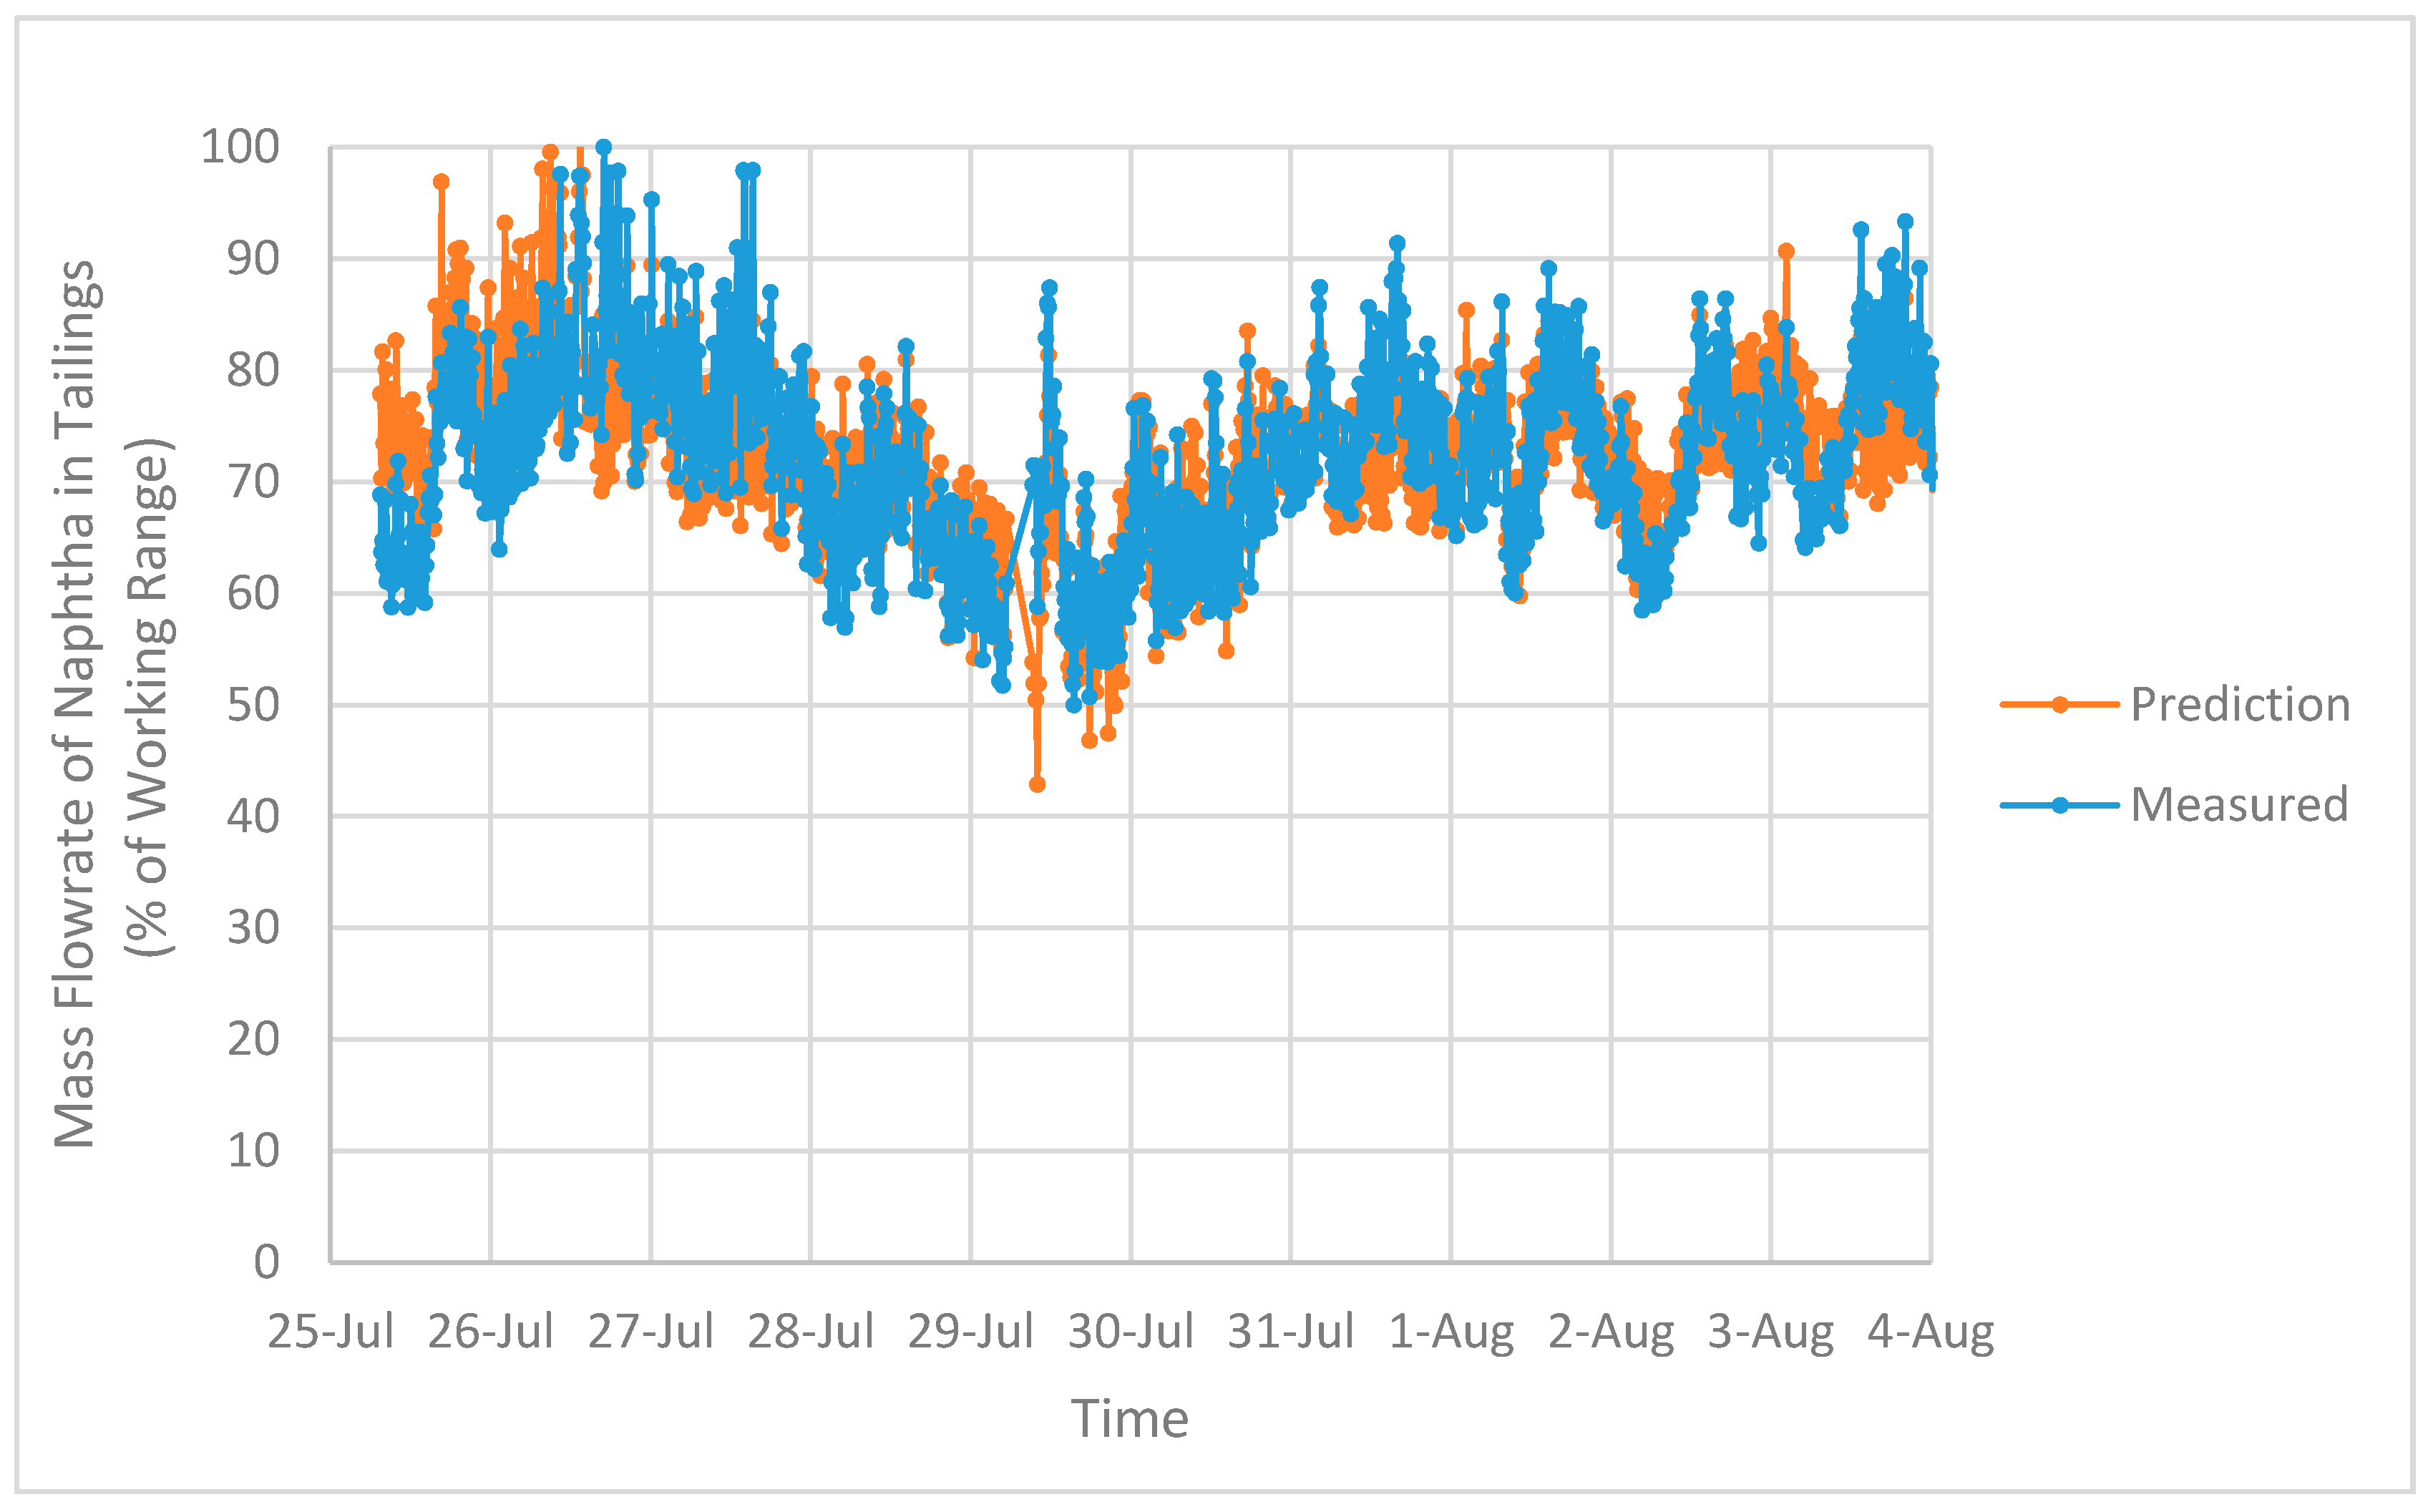
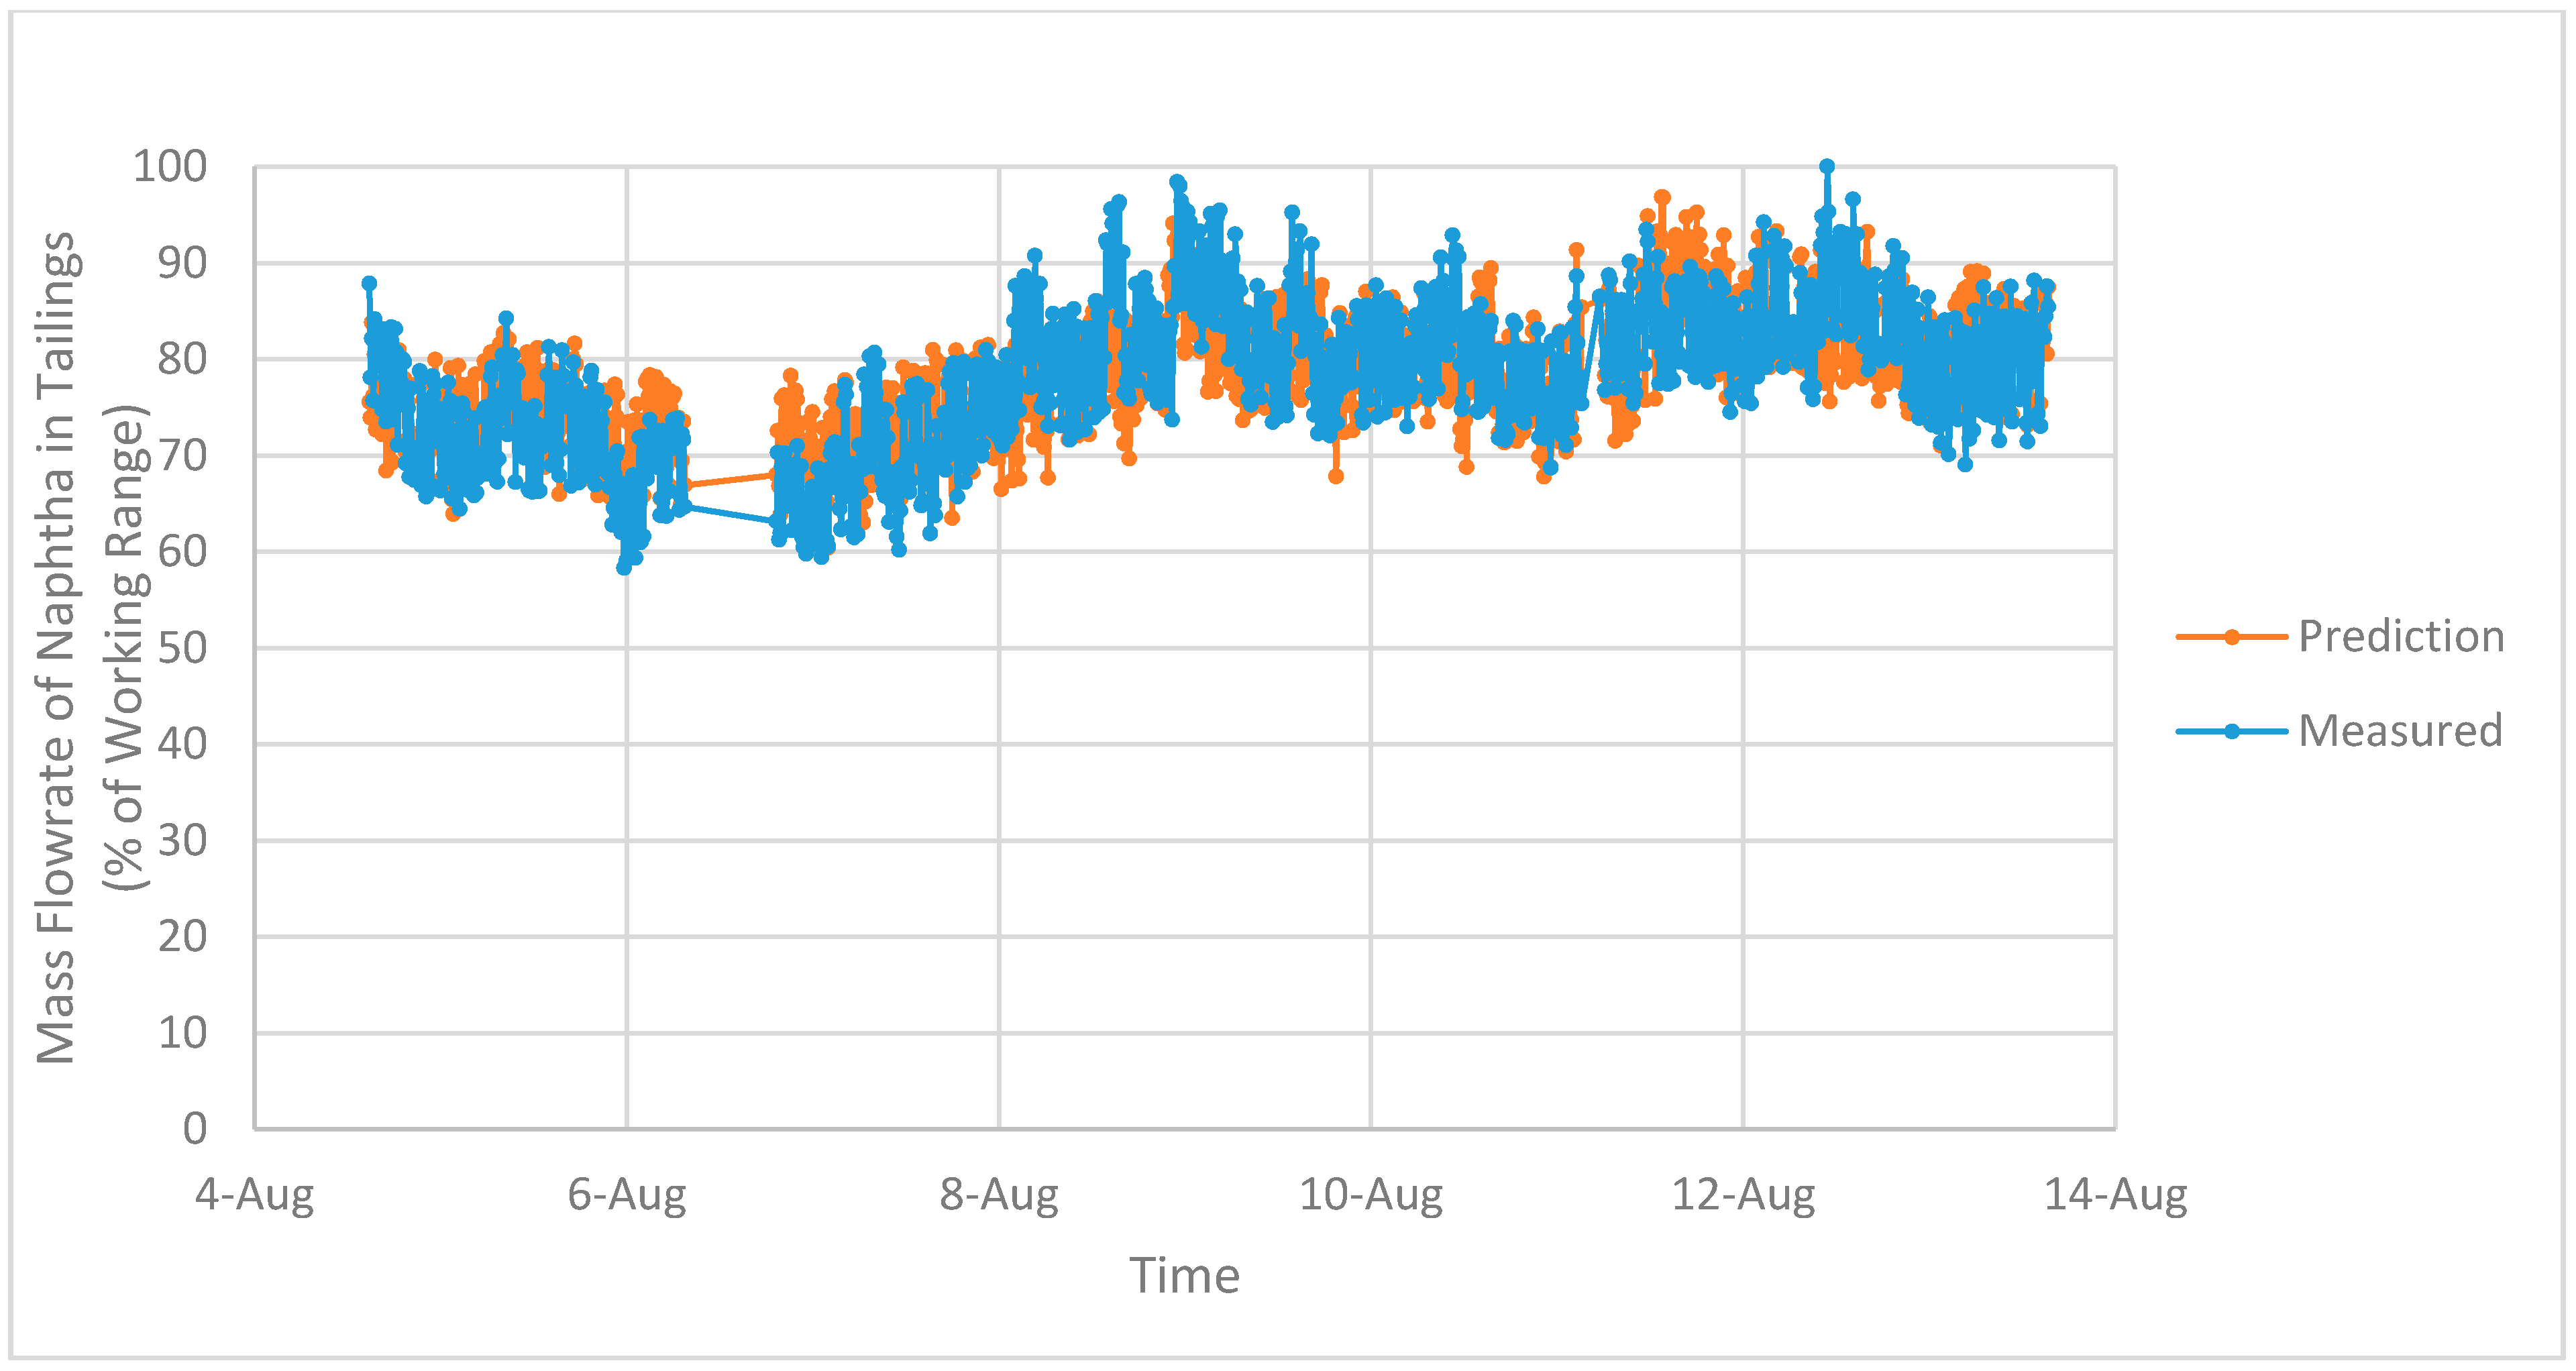
Figure 8 and Figure 9 show comparisons of the measured and predicted mass flowrates of naphtha in the tailings for OP1 and OP2, respectively. In these plots, the training and testing data have been included to illustrate the overall fit obtained using these regression models to generate a prediction for the mass flowrate of naphtha in the tailings. The correlation between the measured mass flowrate and the predicted value is approximately 0.8 for both OP1 and OP2.
This represents a simple soft-sensor application for these linear regression models in that they could be used to predict naphtha in the tailings based solely on the measured mass flowrate and composition analysis of the feed and a predicted value for naphtha recovery without requiring measurements of the flowrate and composition of the tailings. This application highlights the need for multiple models and the ability to detect when a system has shifted from one operating mode to another. PCA could be used in an on-line manner for this purpose [7] as could a Bayesian approach [8].
4. First-Principles Modelling of the NRU in Aspen Plus® (V8.6)
Aspen Plus is a chemical process simulation and optimization software package widely used in the petroleum industry. It was used here to model the actual plant operation of the NRU system at steady-state. The composition of naphtha taken from laboratory analysis was used to define the naphtha stream in the simulation model. The analysis revealed approximately 475 components in naphtha, among which 353 components had a mass fraction less than 0.1%. Only components more than 1% were retained in the list. The rest of the components with mass fractions between 0.1% and 1% were grouped based on their chemical composition. Within each group, the component with the highest mass fraction was chosen to represent all the components in the group, and the mass fraction of this particular component was replaced with the sum of the mass fractions of all components in the corresponding group. Additionally, attention was also given to components with the same chemical composition but different properties due to their structural differences, i.e., aromatic structure verse chain structure. Under such circumstances, subgroups were created based on the similarity of their chemical properties. After grouping was completed, a new list with 25 components was created and scaled so that the total added up to 100% (Table 5).
Other major components, namely solids and bitumen, were defined as follows: solids were assumed to be 50% SiO2 and 50% Al2O3 (on a mass basis) and bitumen was assumed to be C40H80: 1-Tetracontene.
NRTL (non-random-two-liquid) was chosen as the physical method in Aspen Plus because it has a large number of built-in binary parameters. This method is also excellent for handling highly non-ideal chemical mixtures as well as vapor-liquid equilibrium and liquid-liquid equilibrium calculations.
4.1. Conceptual Design of the NRU Column
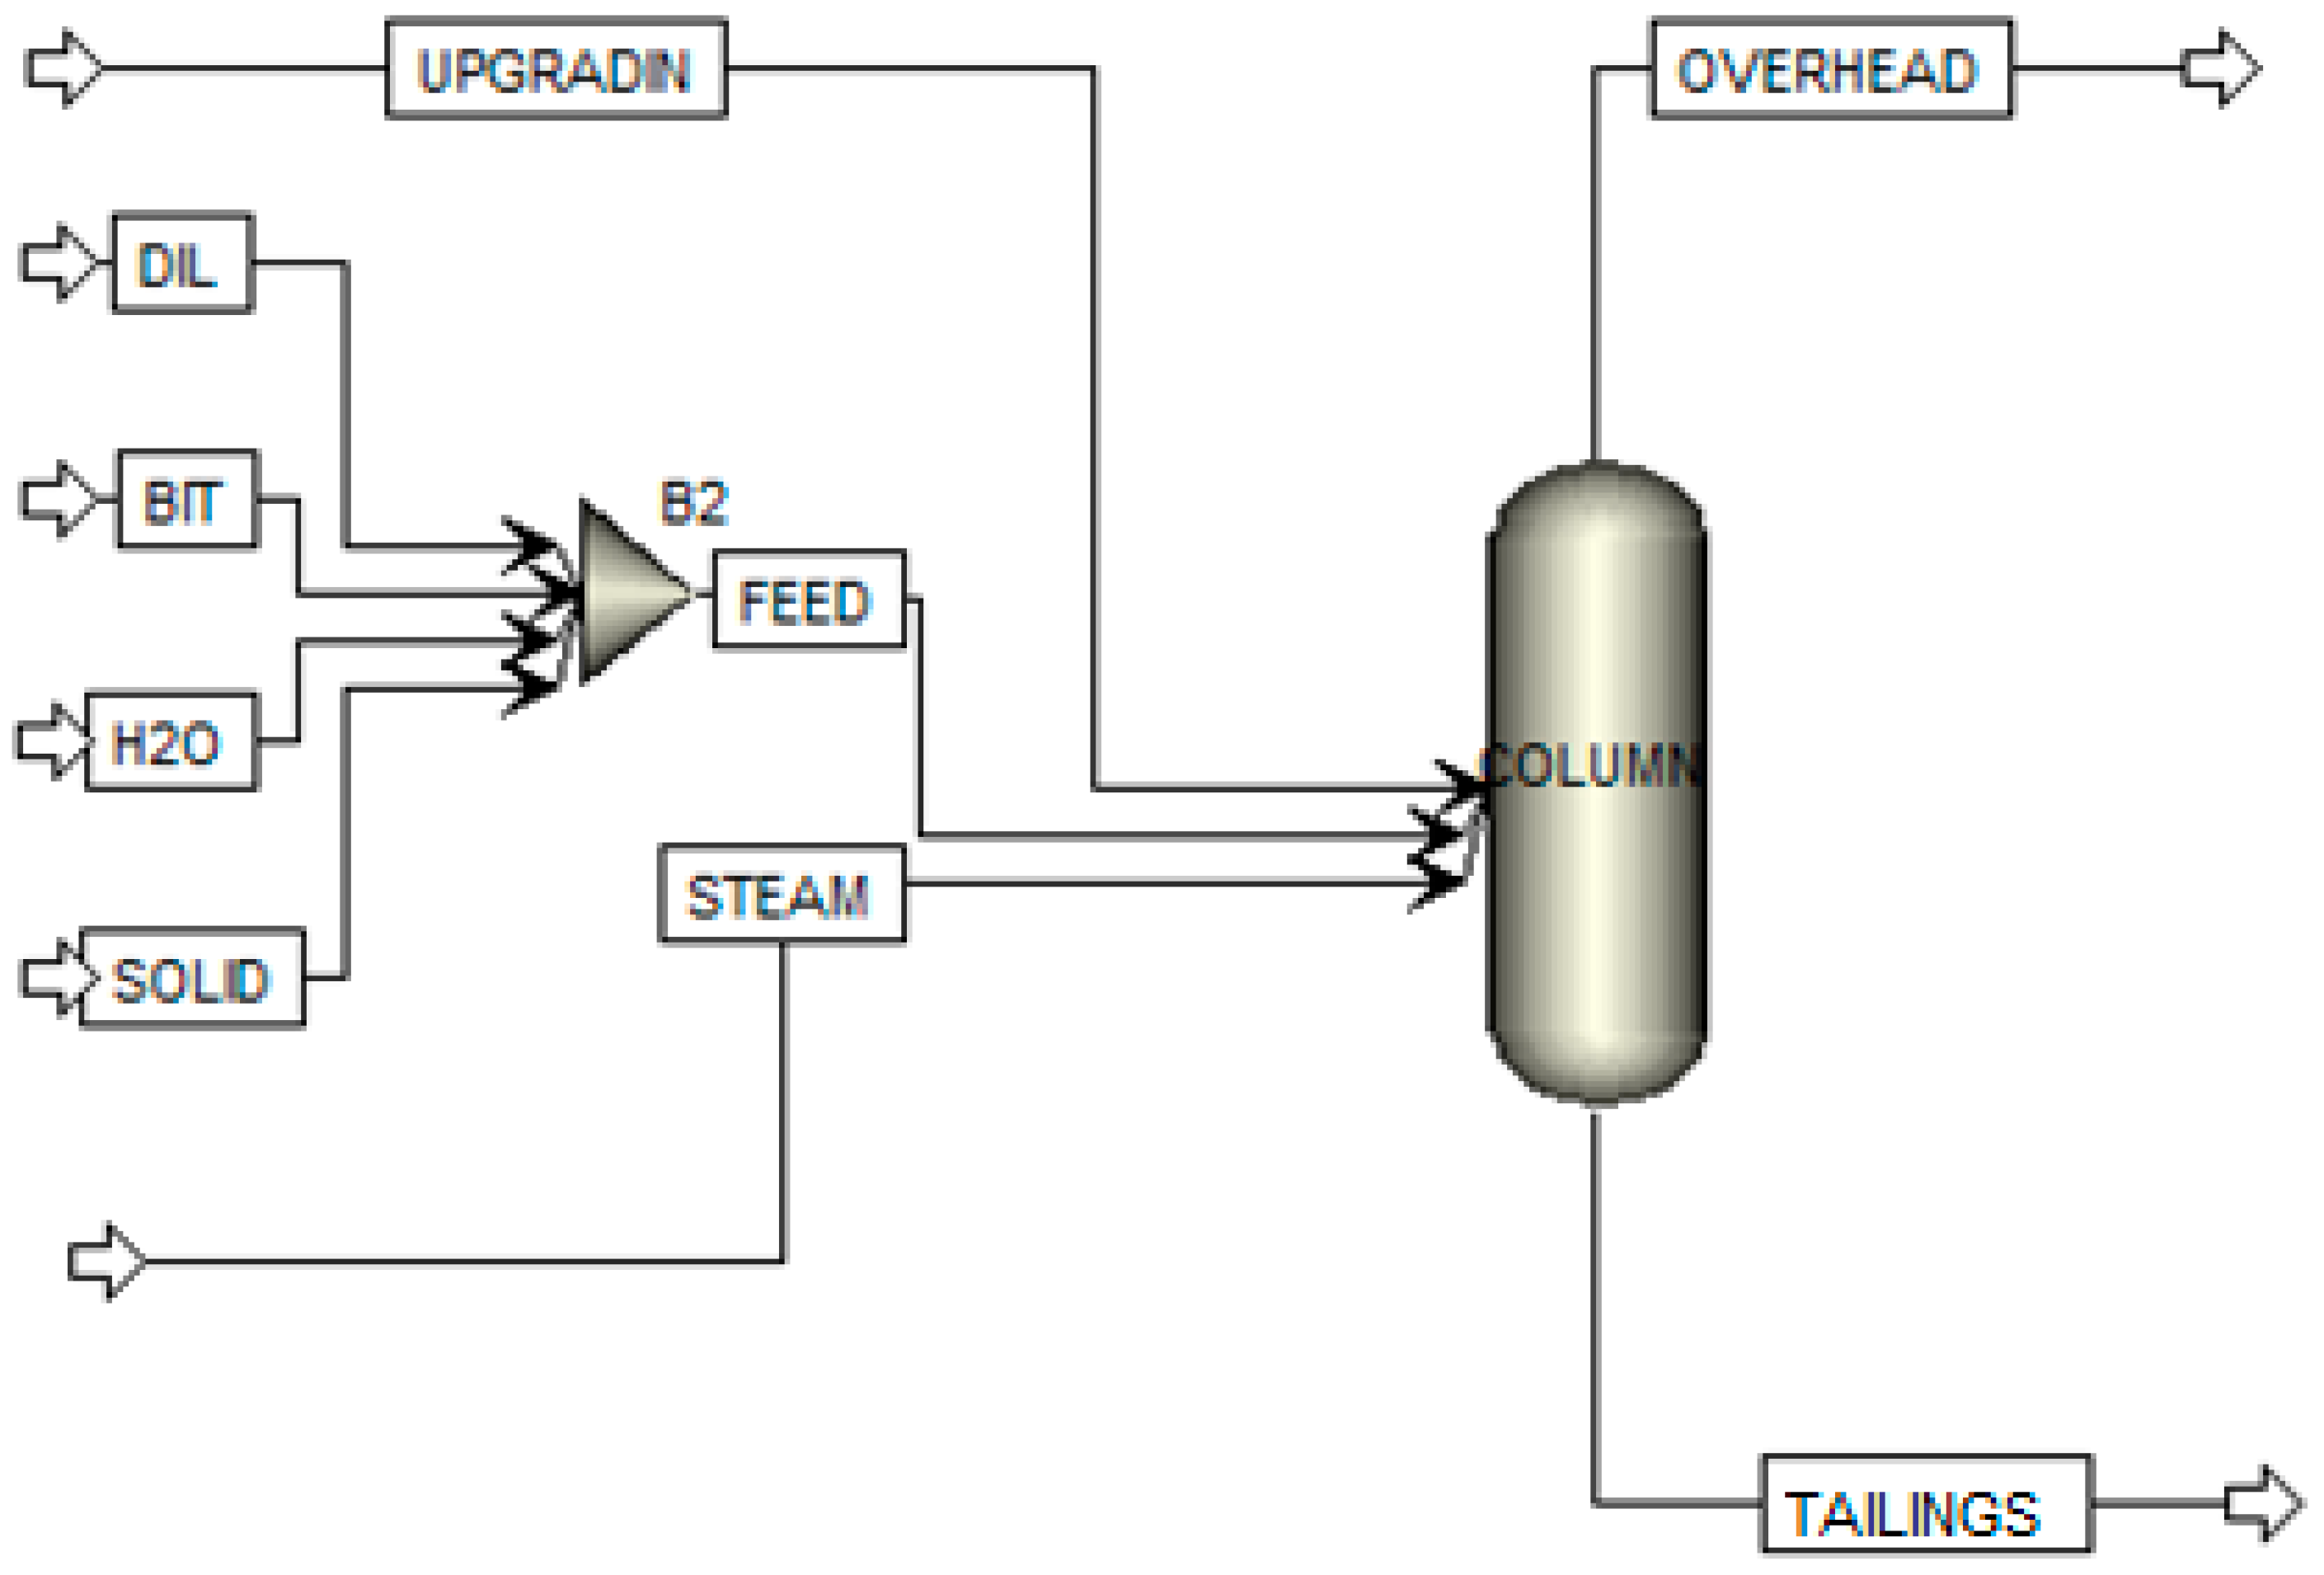
The RadFrac unit in Aspen Plus was the first of two designs considered for the NRU column (Figure 10). The RadFrac unit was specified to have two equilibrium stages but no reboiler or overhead drum. It was set up to operate at a vacuum pressure of 2.7 psi at the top stage of the column with a 0.3 psi pressure drop across the column. The top equilibrium stage (stage 1) represents the separation occurring in the flashing zone. The bottom equilibrium stage (stage 2) represents the separation taking place in the liquid pool. The feed to the column is set at 948 t/h and is made up of naphtha (DIL), bitumen (BIT), water (H2O) and solids (SOLID) coming in as four separate streams and then combined to create a single feed stream (FEED). The weight percentage of each stream in terms of the total feed is 1.03%, 1.87%, 85.1% and 12%, respectively. This feed stream enters the NRU column at 163.5 and atmospheric pressure (14.7 psi). The demister water and upgrading water streams are combined (UPGRADIN) and enter the column at 211 and 14.7 psi and a flowrate or 36 t/h. Finally, 11.8 t/h of steam enters the column at 291.5 and 43 psi. The two liquid streams, FEED and UPGRADIN, enter the column at the top stage (stage 1) and STEAM enters at the second stage (stage 2) to create the liquid–vapor contact that is necessary for the naphtha separation. On the output side, the vapor (OVERHEAD) is sent to the overhead system whereas the remaining liquid (TAILINGS) is discharged through the NRU tailings.
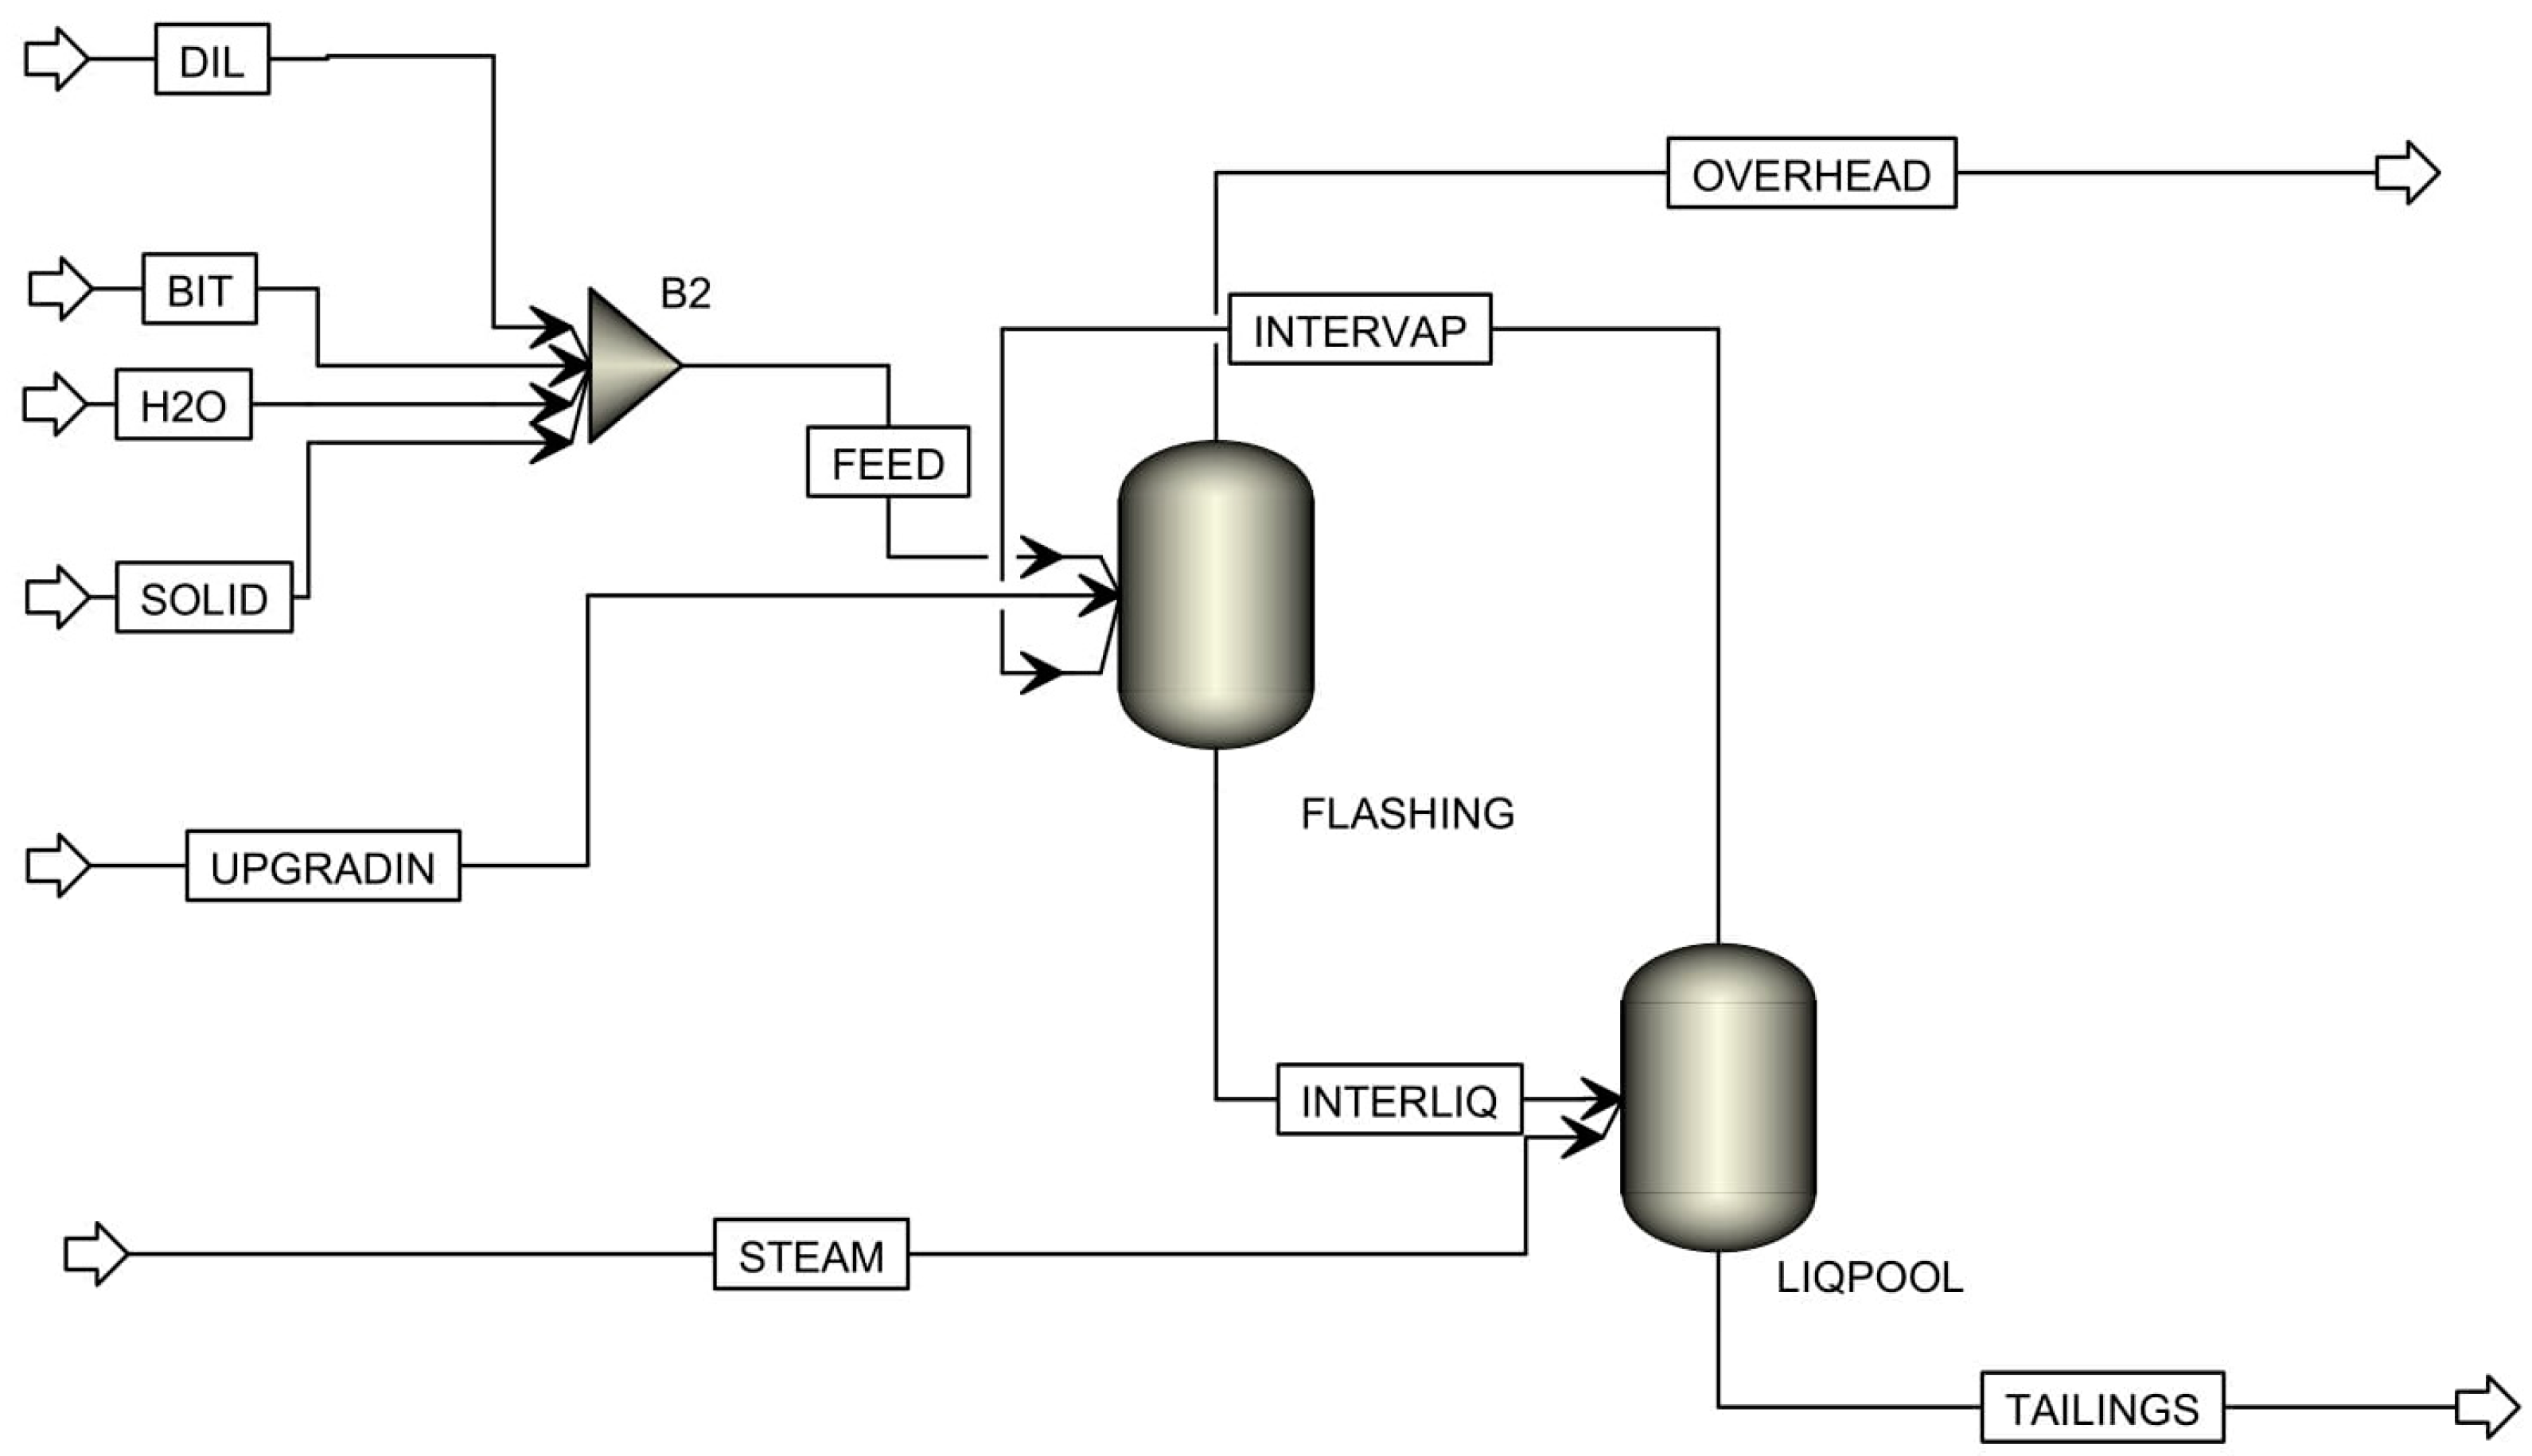
The second design considered for the NRU column is shown in Figure 11 and consists of two interconnected Flash2 units. Each Flash2 unit has one equilibrium stage. The first Flash2 unit (FLASHING) is where the feed (FEED) and the upgrading water (UPGRADIN) enter. It is used to represent the flashing zone in which the vapor–liquid equilibrium is established at 2.7 psi and with a vapor fraction of 0.95. The vapor (OVERHEAD) generated from the first Flash2 unit is sent to the overhead system, whereas the liquid bottom (INTERLIQ) becomes the feed to the second Flash2 unit (LIQPOOL). LIQPOOL, with pressure and vapor fraction 3 psi and 0.15, respectively, is used to represent the liquid pool where the steam is directly injected. The overhead vapor (INTERVAP) from LIQPOOL is sent to FLASHING while the liquid product (TAILINGS) leaves as the NRU tailings. The specification of column temperature is avoided in both Flash2 units because the temperature is subject to the amount of heat provided by the steam. The conditions of all input streams are the same as those used in the RadFrac design.
These two conceptual designs for the NRU column were evaluated based on how well they estimated the column temperature and the steam impact on the naphtha recovery as compared to the process data.
With the same specifications for the input streams, the simulations of both designs overestimated the column temperature by 5 as compared to what was recorded in the plant (135 ). This difference between the predicted and actual temperatures can be explained by the mal-distribution of steam in the actual column. The poor distribution of steam limits the liquid–vapour contact, which further limits the heat transfer. Thus, the NRU column may very well experience lower temperatures.
With the steam injection rate set at a mid-range value (referred to now as the nominal value), it was found that both designs provide a similar estimate for naphtha recovery consistent with the actual process. Then, the steam injection rate was varied to see the effect on naphtha recovery in both designs. What was discovered is that with an increasing steam rate, an increasing naphtha recovery is predicted with the RadFrac design, whereas no change in naphtha recovery is predicted by the Flash2 design. Because the actual process does exhibit a change in the naphtha recovery when the steam injection rate is changed, the RadFrac design was chosen to simulate the NRU column in Aspen Plus.
4.2. Conceptual Design of the Overhead System
Moving now to the overhead system, we begin by examining what we will refer to as the base case design, consisting of one overhead condenser, two separators and one compressor, that mimics the actual process design (see Figure 12). The vapor (OVERHEAD) coming from the NRU column first enters the overhead condenser (HX1). HX1 partially condenses the vapor (CONDENSA) and then sends it to the first separator. The first separator is modeled in Aspen Plus by one Flash2 unit (SEP11) and one decanter (SEP12). SEP11 separates the vapor from the condensate and passes the condensate to the decanter (SEP12) where the organic liquid phase that is rich in naphtha is separated from the non-organic phase that is rich in water. The decanter is chosen because it allows separation efficiencies to be specified for each component. The second separator (SEP2), modeled by a Flash3 unit, is used to recover the remaining naphtha from the non-condensed overhead vapor after being pressurized in a compressor (COMP). The Flash3 model is selected for the second separator because the inputs (temperature and pressure) required to define this model are available from the process data. The water streams from both separators are recycled back to the NRU column whereas the recovered naphtha is sent to storage. Table 6 summarizes the model selection and specifications for the key units.
The major limitation of the base case design is that the separator models available in Aspen Plus normally perform equilibrium calculations with the assumption of ideal conditions, e.g., the decanter model assumes sufficient residence time to establish phase equilibrium such that a complete separation between the two liquid phases can be achieved. Thus, the two product streams—recovered naphtha and recycled water streams—have extremely high purity (almost 99%). However, this does not match data collected from the actual process which indicates, under normal operation, that the produced naphtha contains at least 20 wt.% water and the recycled water stream contains approximately 3–7 wt.% naphtha. The operating data also indicates that a significant amount (10 wt.%) of the total naphtha enters the column via the recycled water stream.
To simulate this non-ideal separation that is occurring in both overhead separators, the separation efficiency of water in the decanter associated with the first separator was varied from 0 to 0.5. However, little change was observed in the composition and flowrate of the recycled water. Therefore, a novel design in Aspen Plus was needed to give a more accurate representation of the actual process.
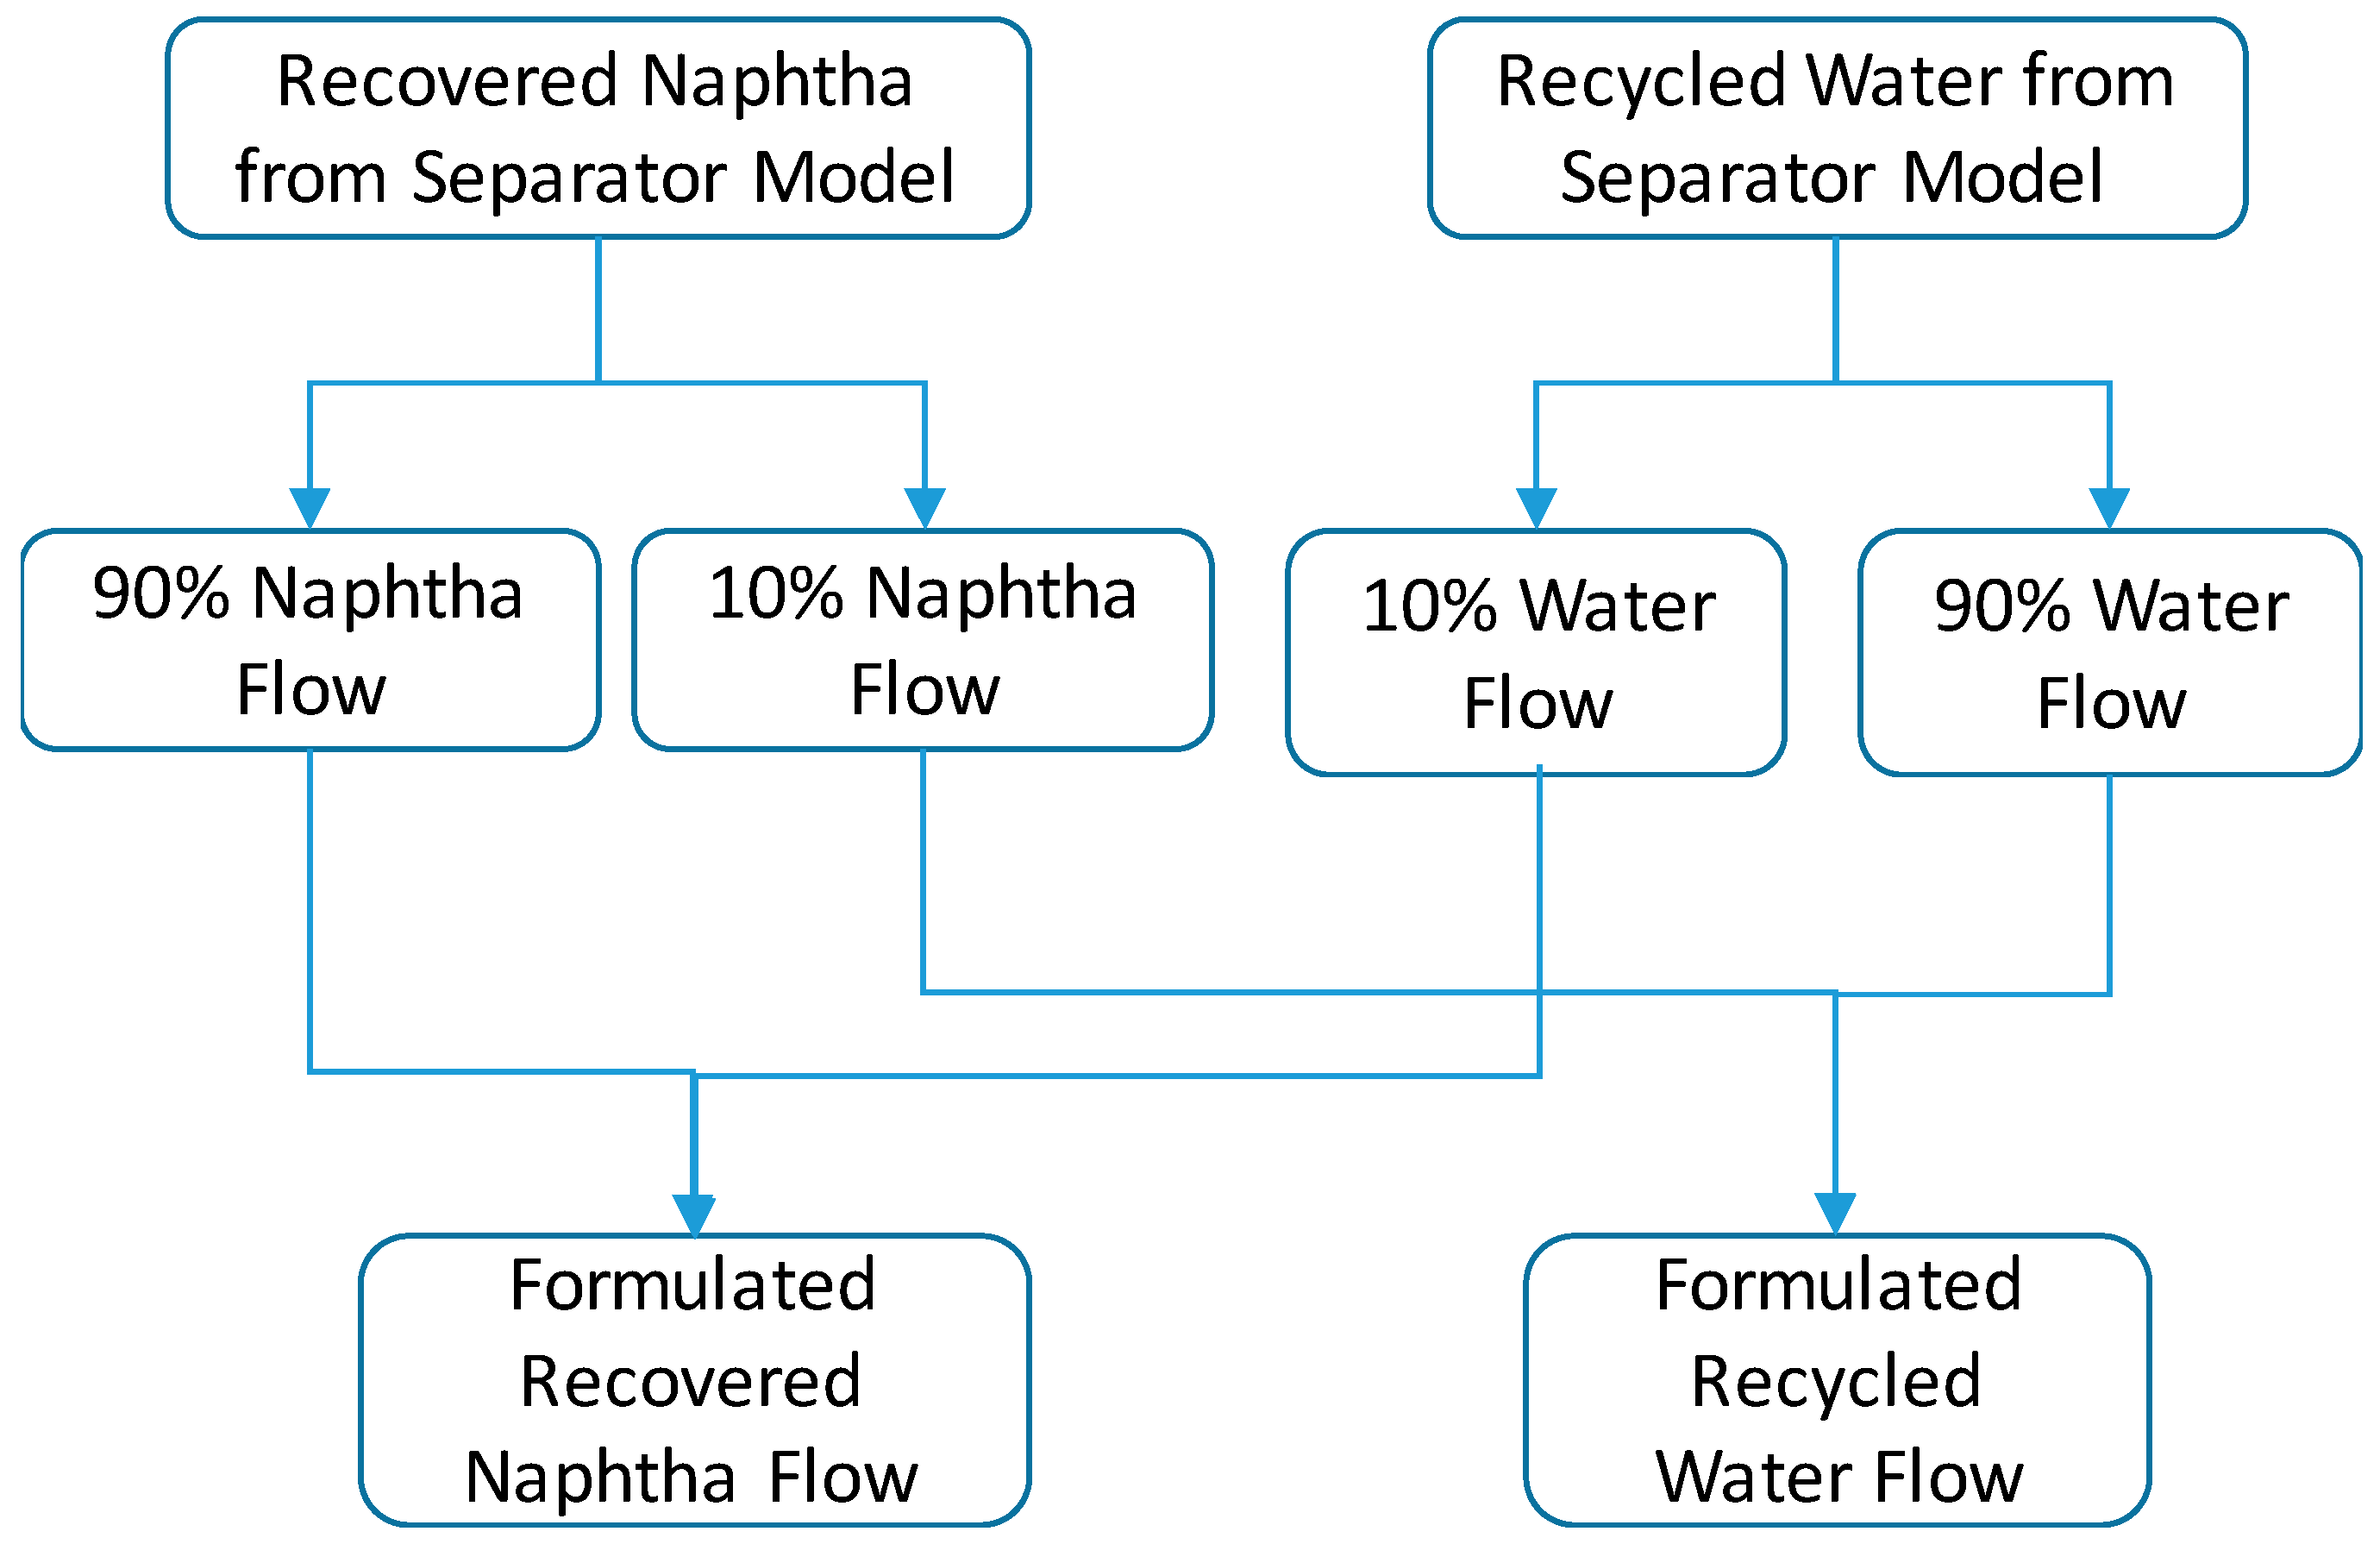
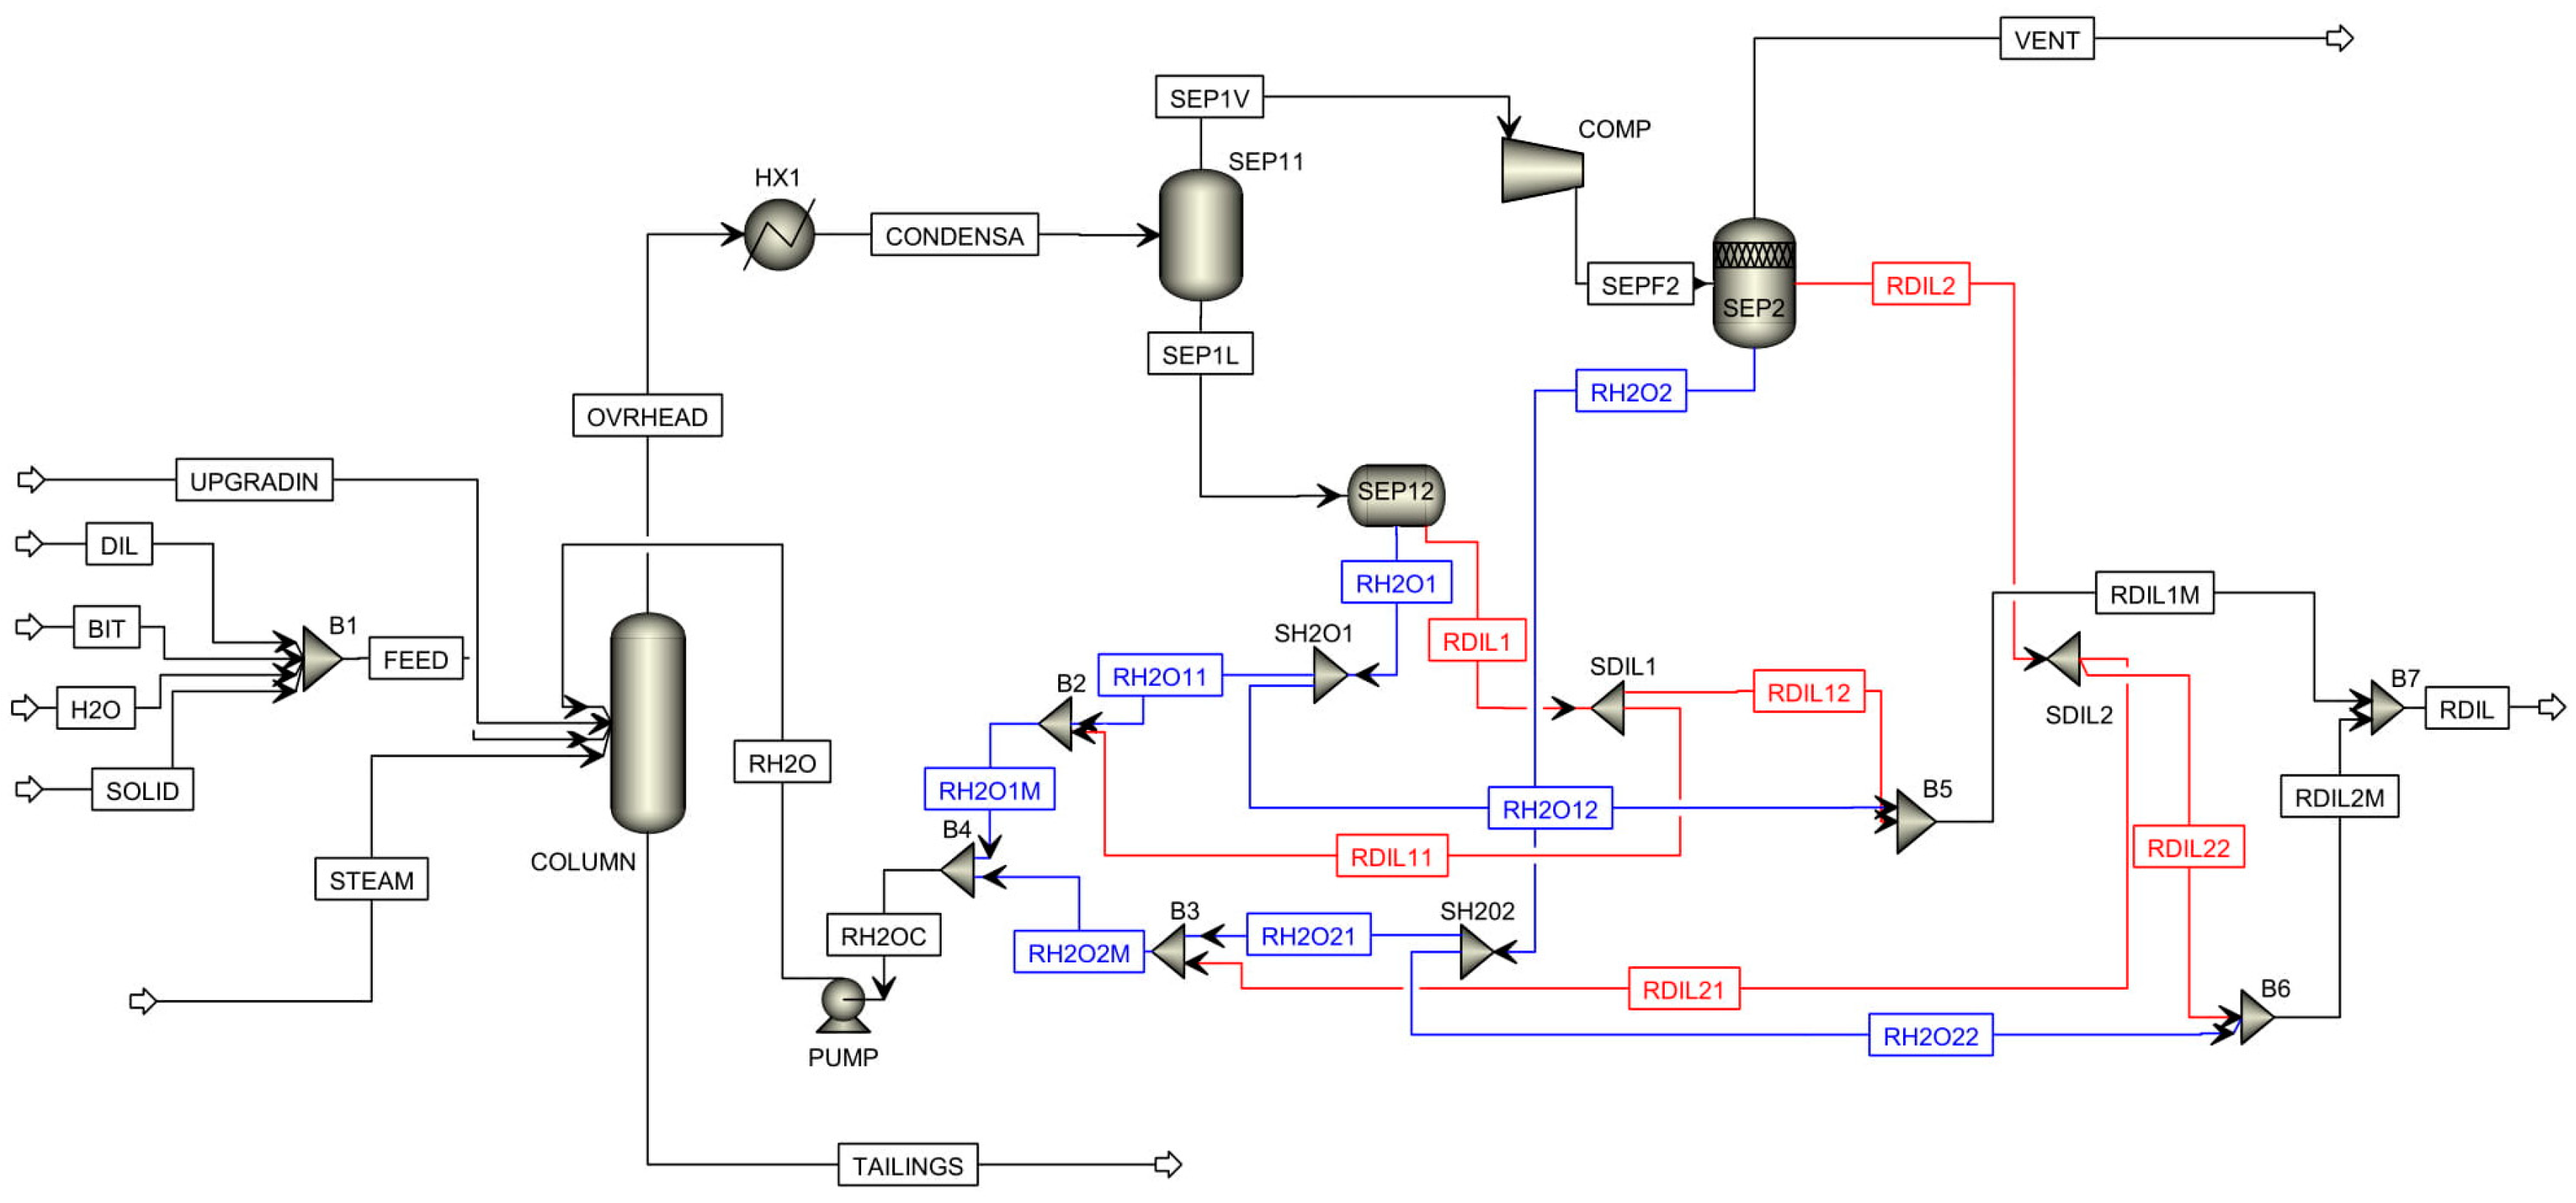
At this point, an innovative “withdraw and remix” concept was proposed. The idea is to take a small portion from both the water and naphtha streams and mix them with the other stream. As illustrated in Figure 13, the naphtha and water streams coming from the same separator are each divided into two sub-streams on a 10/90 split. The sub-stream which contains 10 wt.% of the original naphtha flow is remixed with the sub-stream containing 90 wt.% of the original water flow to represent the formulated recycled water stream. The other two sub-streams, one with 90 wt.% of the original naphtha flow and one with 10 wt.% of the original water flow, are mixed to form the formulated recovered naphtha stream. This concept artificially adds impurity to both two product streams coming from the overhead system to mimic the non-ideal separation. The actual split ratio can be adjusted iteratively to match the composition of the formulated streams with the actual produced streams.
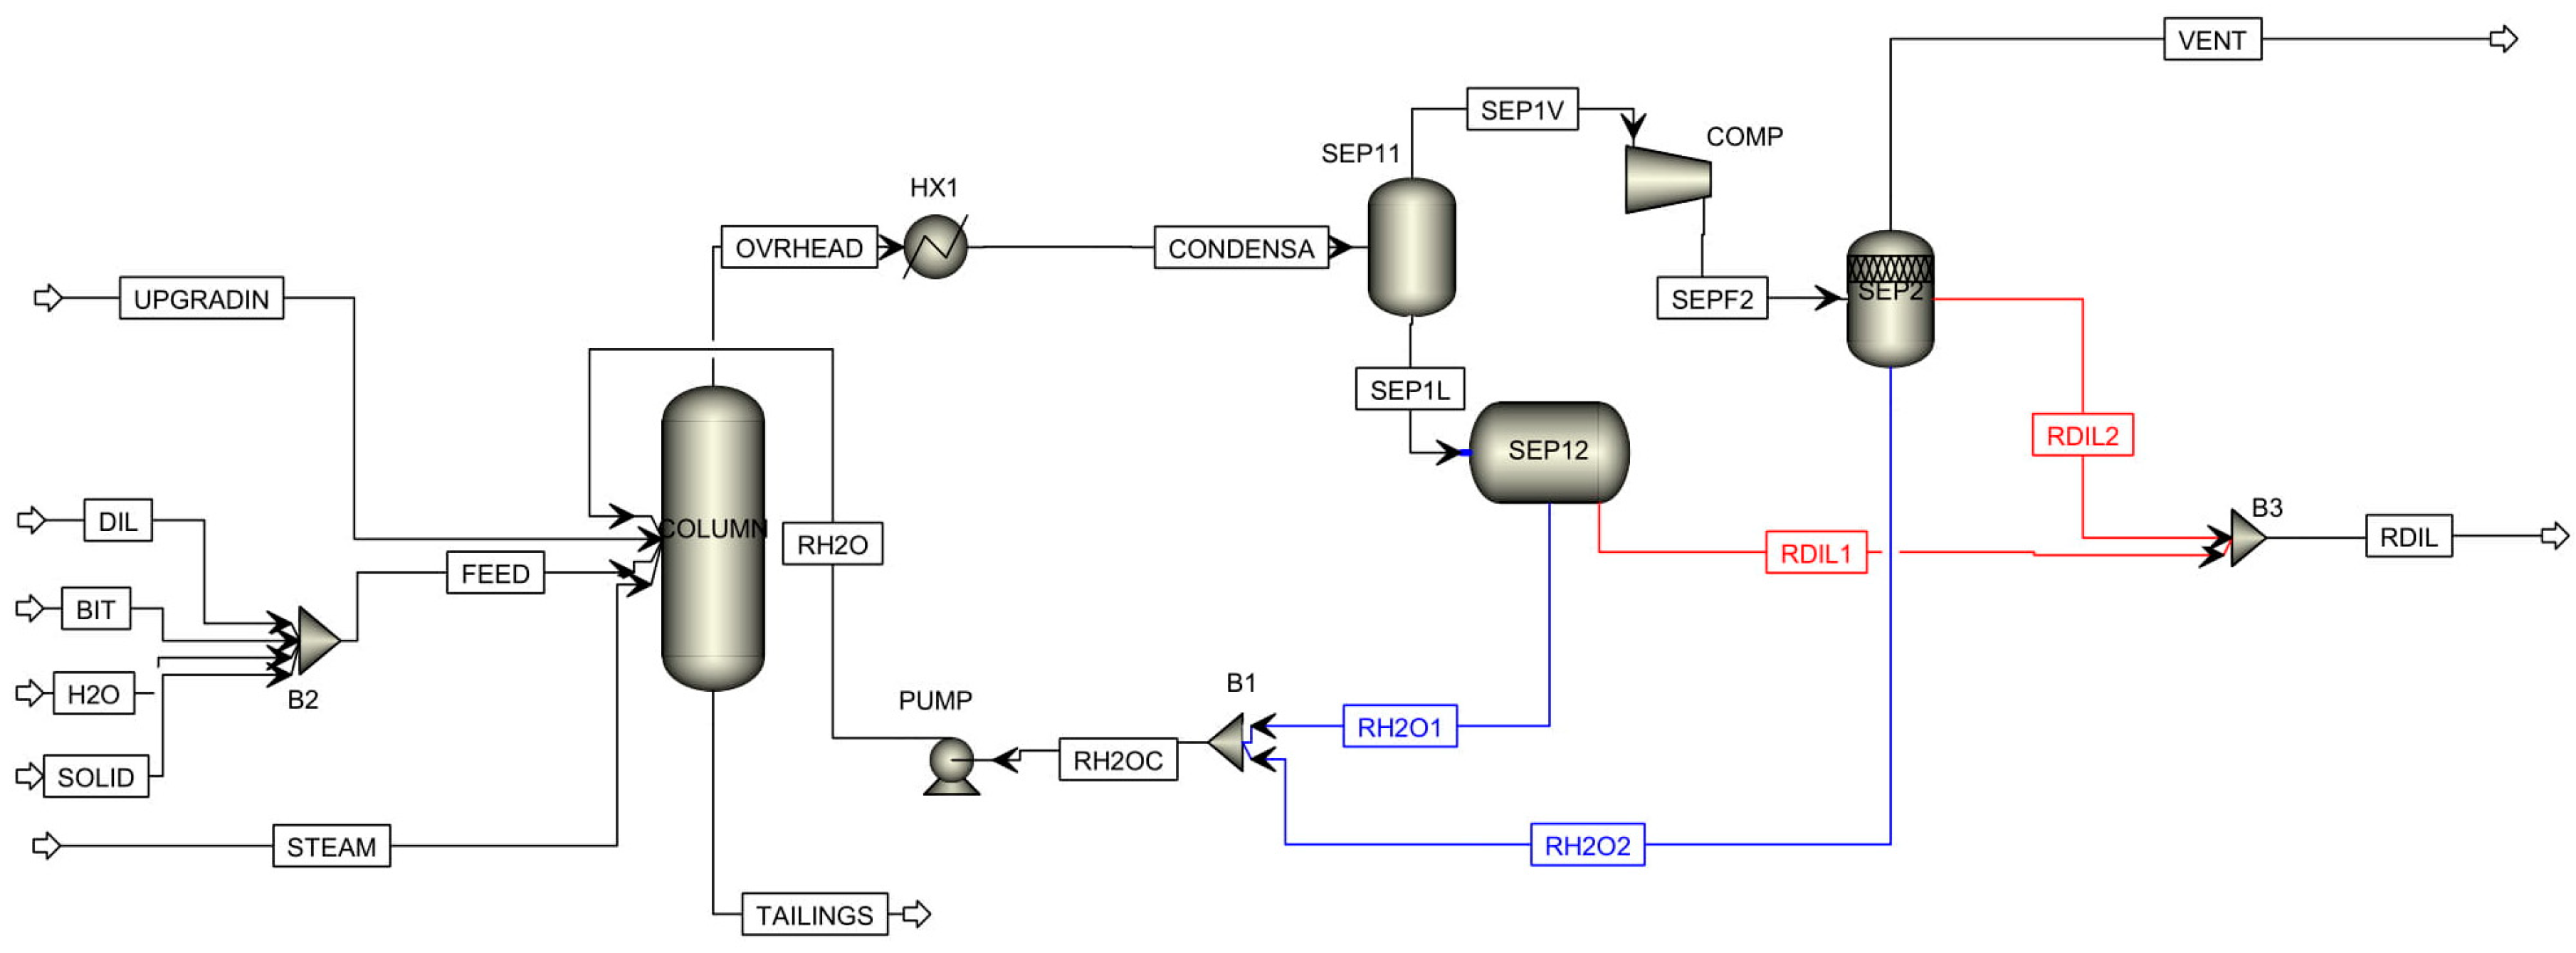
This new design is shown in Figure 14, where we have taken the base case design as our starting point and have then incorporated the “withdraw and remix” strategy. All Aspen Plus models used in this design have the same specifications summarized in Table 6. The Aspen files for both the base case design and the “withdraw and remix” design are provided in the Supplementary Materials.
5. Implications for Process Optimization
In this section of the paper, we are going to examine the effects of cooling duty and steam feed rate or injection rate on naphtha recovery as predicted by our “withdraw and remix” Aspen Plus model of the NRU (Figure 14). These two independent variables have been chosen with a view to gaining some insight into process optimization. The cooling duty associated with the overhead condenser under nominal operating conditions is calculated as 75 MMBTU/h. For this sensitivity analysis, the cooling duty is varied from 65 to 75 MMBTU/h and the steam feed rate is varied from 68% to 80% of its working range.
Figure 15 shows the relationship between steam injection rate and naphtha recovery that is predicted by the model. With the condenser duty fixed at 75 MMBtu/h, the naphtha recovery initially goes down and then up as the steam rate increases. Over this range, there is a minimum value for naphtha recovery that occurs. Beyond a certain steam rate, the predicted recovery levels off.
Insight into the reason for the shape of this relationship in Figure 15 can be gleaned from Figure 16, which shows the predicted naphtha being recovered from the first separator and the second separator separately. One can see at the lower steam rates that most of the “work”, in terms of recovering the naphtha, is being done by the first separator. As the steam rate increases, the load on the overhead condenser system increases, resulting in a higher percentage of uncondensed vapor at a higher temperature going over to the second separator. Thus, more “work”, again in terms of recovering the naphtha, ends up being done by the second separator while less naphtha is recovered by the first separator. This trend continues with increasing steam rates. However, when taken together, the combined recovery of naphtha initially decreases, goes through a minimum, and then rises back up before leveling off.
Returning to Figure 15, the parabolic shape of this relationship between steam rate and naphtha recovery has interesting implications for the NRU system. It indicates that at lower steam rates, the relationship between steam rate and naphtha recovery has a negative slope, but at higher steam rates this relationship takes on a positive slope. The negative relationship is contrary to what operators believe but is consistent with the findings of the linear regression models summarized in Figure 7. On the other hand, the positive relationship is consistent with what the operators believe.
These findings also have interesting implications for process optimization. The parabolic shape in Figure 15 indicates that it might be possible to achieve the same naphtha recovery by operating the NRU system at two different steam rates, a higher value and a lower value. Therefore, to minimize cost, a lower steam rate could be chosen while still ensuring that the required naphtha recovery is achieved. This phenomenon is referred to as “input multiplicity” and has been observed in a heat-integrated double-column air separation unit [9] as well as both isothermal and adiabatic chemical reactors [10].
The flat section of the relationship in Figure 15 at high steam rates is another interesting result. Here, the model predicts that increasing the steam rate beyond a certain point has no effect on the naphtha recovery and therefore represents a waste of energy. This result is consistent with the beliefs of the on-site process engineers.
The impact of the cooling duty of the overhead condenser on naphtha recovery has also been examined and the results as predicted by the model are shown in Figure 17. The cooling duty is set to four different values (65, 67.5, 70 and 75 MMBTU/h) and a series of four parabolic curves like the one found in Figure 15 shows the impact of steam on naphtha recovery at these different duties. As the condenser duty decreases, the curves shift left towards lower steam injection rates. This is because the cooling capacity limits the amount of steam that the overhead system can handle. The minimum naphtha recovery decreases slightly with lower cooling duty, but the change is negligible.
Figure 17 indicates that when more steam is injected into the NRU system, a higher cooling duty is required to achieve the same recovery. This is another finding that has interesting implications for the optimization of the NRU process. In terms of minimizing the cost of both steam production and cooling water, it appears that it might be possible to achieve the target naphtha recovery using a combined strategy of less steam and less cooling water. For example, if the target recovery was 0.75, a steam injection rate of approximately 47–48% of the working range and a cooling duty in the range 65–67.5 MMBTU/h would be optimal.
6. Conclusions
The goal in this paper was to develop steady-state models for a naphtha recovery unit (NRU) found in the oil sands industry. Two approaches have been examined with one being a statistical, data-based modelling approach and the other being a first-principles modelling approach. Some of the findings in this paper are consistent with the process understanding of operators and engineers at the plant. However, some of the results are counterintuitive and provide interesting suggestions and implications for optimization of the NRU system. A second performance test has been suggested to plant personnel to explore and validate the ideas presented here.
Our paper suggests that it may be possible to reduce steam consumption without compromising naphtha recovery. This is counterintuitive because the general belief is that a higher steam injection rate will translate into more naphtha being vaporized in the stripping column, which in turn should lead to a higher naphtha recovery. Instead, our first-principles modelling work predicts that increasing the steam injection rate beyond a certain threshold does not have a significant effect on naphtha recovery because the overhead condenser system cannot handle the increased volume of overhead vapour. Our results suggest that the overhead system plays an important role and that it is the interconnections between the NRU column and the overhead system that produce this counterintuitive behaviour. Hence, it is recommended that both parts of the NRU system be studied in an integrated way to further improve naphtha recovery.
Supplementary Materials
The Aspen files for the base case design in Figure 12 and the “withdraw and remix” design in Figure 14 are available online at https://www.mdpi.com/2227-9717/6/7/74/s1.
Author Contributions
Conceptualization, J.D. and W.R.C.; Methodology, J.D. and W.R.C.; Software, J.D.; Validation, J.D. and W.R.C.; Formal Analysis, J.D. and W.R.C.; Investigation, J.D.; Resources, J.D. and W.R.C.; Data Curation, J.D.; Writing-Original Draft Preparation, J.D.; Writing-Review & Editing, J.D. and W.R.C.; Visualization, J.D. and W.R.C.; Supervision, W.R.C.; Project Administration, J.D. and W.R.C.
Funding
This research received no external funding.
Conflicts of Interest
The authors declare no conflict of interest.
References
- Speight, J.G. Oil Sand Production Processes; Elsevier: New York, NY, USA, 2013. [Google Scholar]
- Khatibisepehr, S.; Huang, B.; Domlan, E.; Naghoosi, E.; Zhao, Y.; Miao, Y.; Shao, X.; Khare, S.; Keshavarz, M.; Feng, E.; et al. Soft sensor solutions for control of oil sands processes. Can. J. Chem. Eng. 2013, 91, 1416–1426. [Google Scholar] [CrossRef]
- Long, Y.; Dabros, T.; Hamza, H. Analysis of solvent-diluted bitumen from oil sands froth treatment using NIR spectroscopy. Can. J. Chem. Eng. 2004, 82, 776–781. [Google Scholar] [CrossRef]
- Feng, E.; Domlan, E.; Kadali, R. Spectroscopic measurements in oil sands industry—From laboratories to real-time applications. In Proceedings of the 9th International Symposium on Advanced Control of Chemical Processes, The International Federation of Automatic Control, Whistler, BC, Canada, 7–10 June 2015; pp. 199–204. [Google Scholar]
- Wold, S.; Esbensen, K.; Geladi, P. Principle component analysis. Chemom. Intell. Lab. Syst. 1987, 2, 37–52. [Google Scholar] [CrossRef]
- Kourti, T.; MacGregor, J.F. Process analysis, monitoring and diagnosis, using multivariate projection methods. Chemom. Intell. Lab. Syst. 1995, 28, 3–21. [Google Scholar] [CrossRef]
- Zhao, S.J.; Zhang, J.; Xu, Y.M. Monitoring of processes with multiple operating modes through multiple principle component analysis models. Ind. Eng. Chem. Res. 2004, 43, 7025–7035. [Google Scholar] [CrossRef]
- Khatibisepehr, S.; Huang, B.; Xu, F.; Espejo, A. A Bayesian approach to design of adaptive multi-model inferential sensors with application in the oil sand industry. J. Process Control 2012, 22, 1913–1929. [Google Scholar] [CrossRef]
- Mahapatra, P.; Bequette, B.W. Design and control of an elevated-pressure air separations unit for IGCC power plants in a process simulator environment. Ind. Eng. Chem. Res. 2013, 52, 3178–3191. [Google Scholar] [CrossRef]
- Sistu, P.B.; Bequette, B.W. Model predictive control of processes with input multiplicities. Chem. Eng. Sci. 1995, 50, 921–936. [Google Scholar] [CrossRef]
Figure 1.
Simplified process flow diagram of bitumen extraction from oil sands.

Figure 2.
Process flow diagram of naphtha recovery unit.

Figure 3.
Data and preliminary results from the performance test: (a) steam injection rate used during the performance test, and (b) principal component analysis (PCA) of data collected from the performance test.
Figure 3.
Data and preliminary results from the performance test: (a) steam injection rate used during the performance test, and (b) principal component analysis (PCA) of data collected from the performance test.


Figure 4.
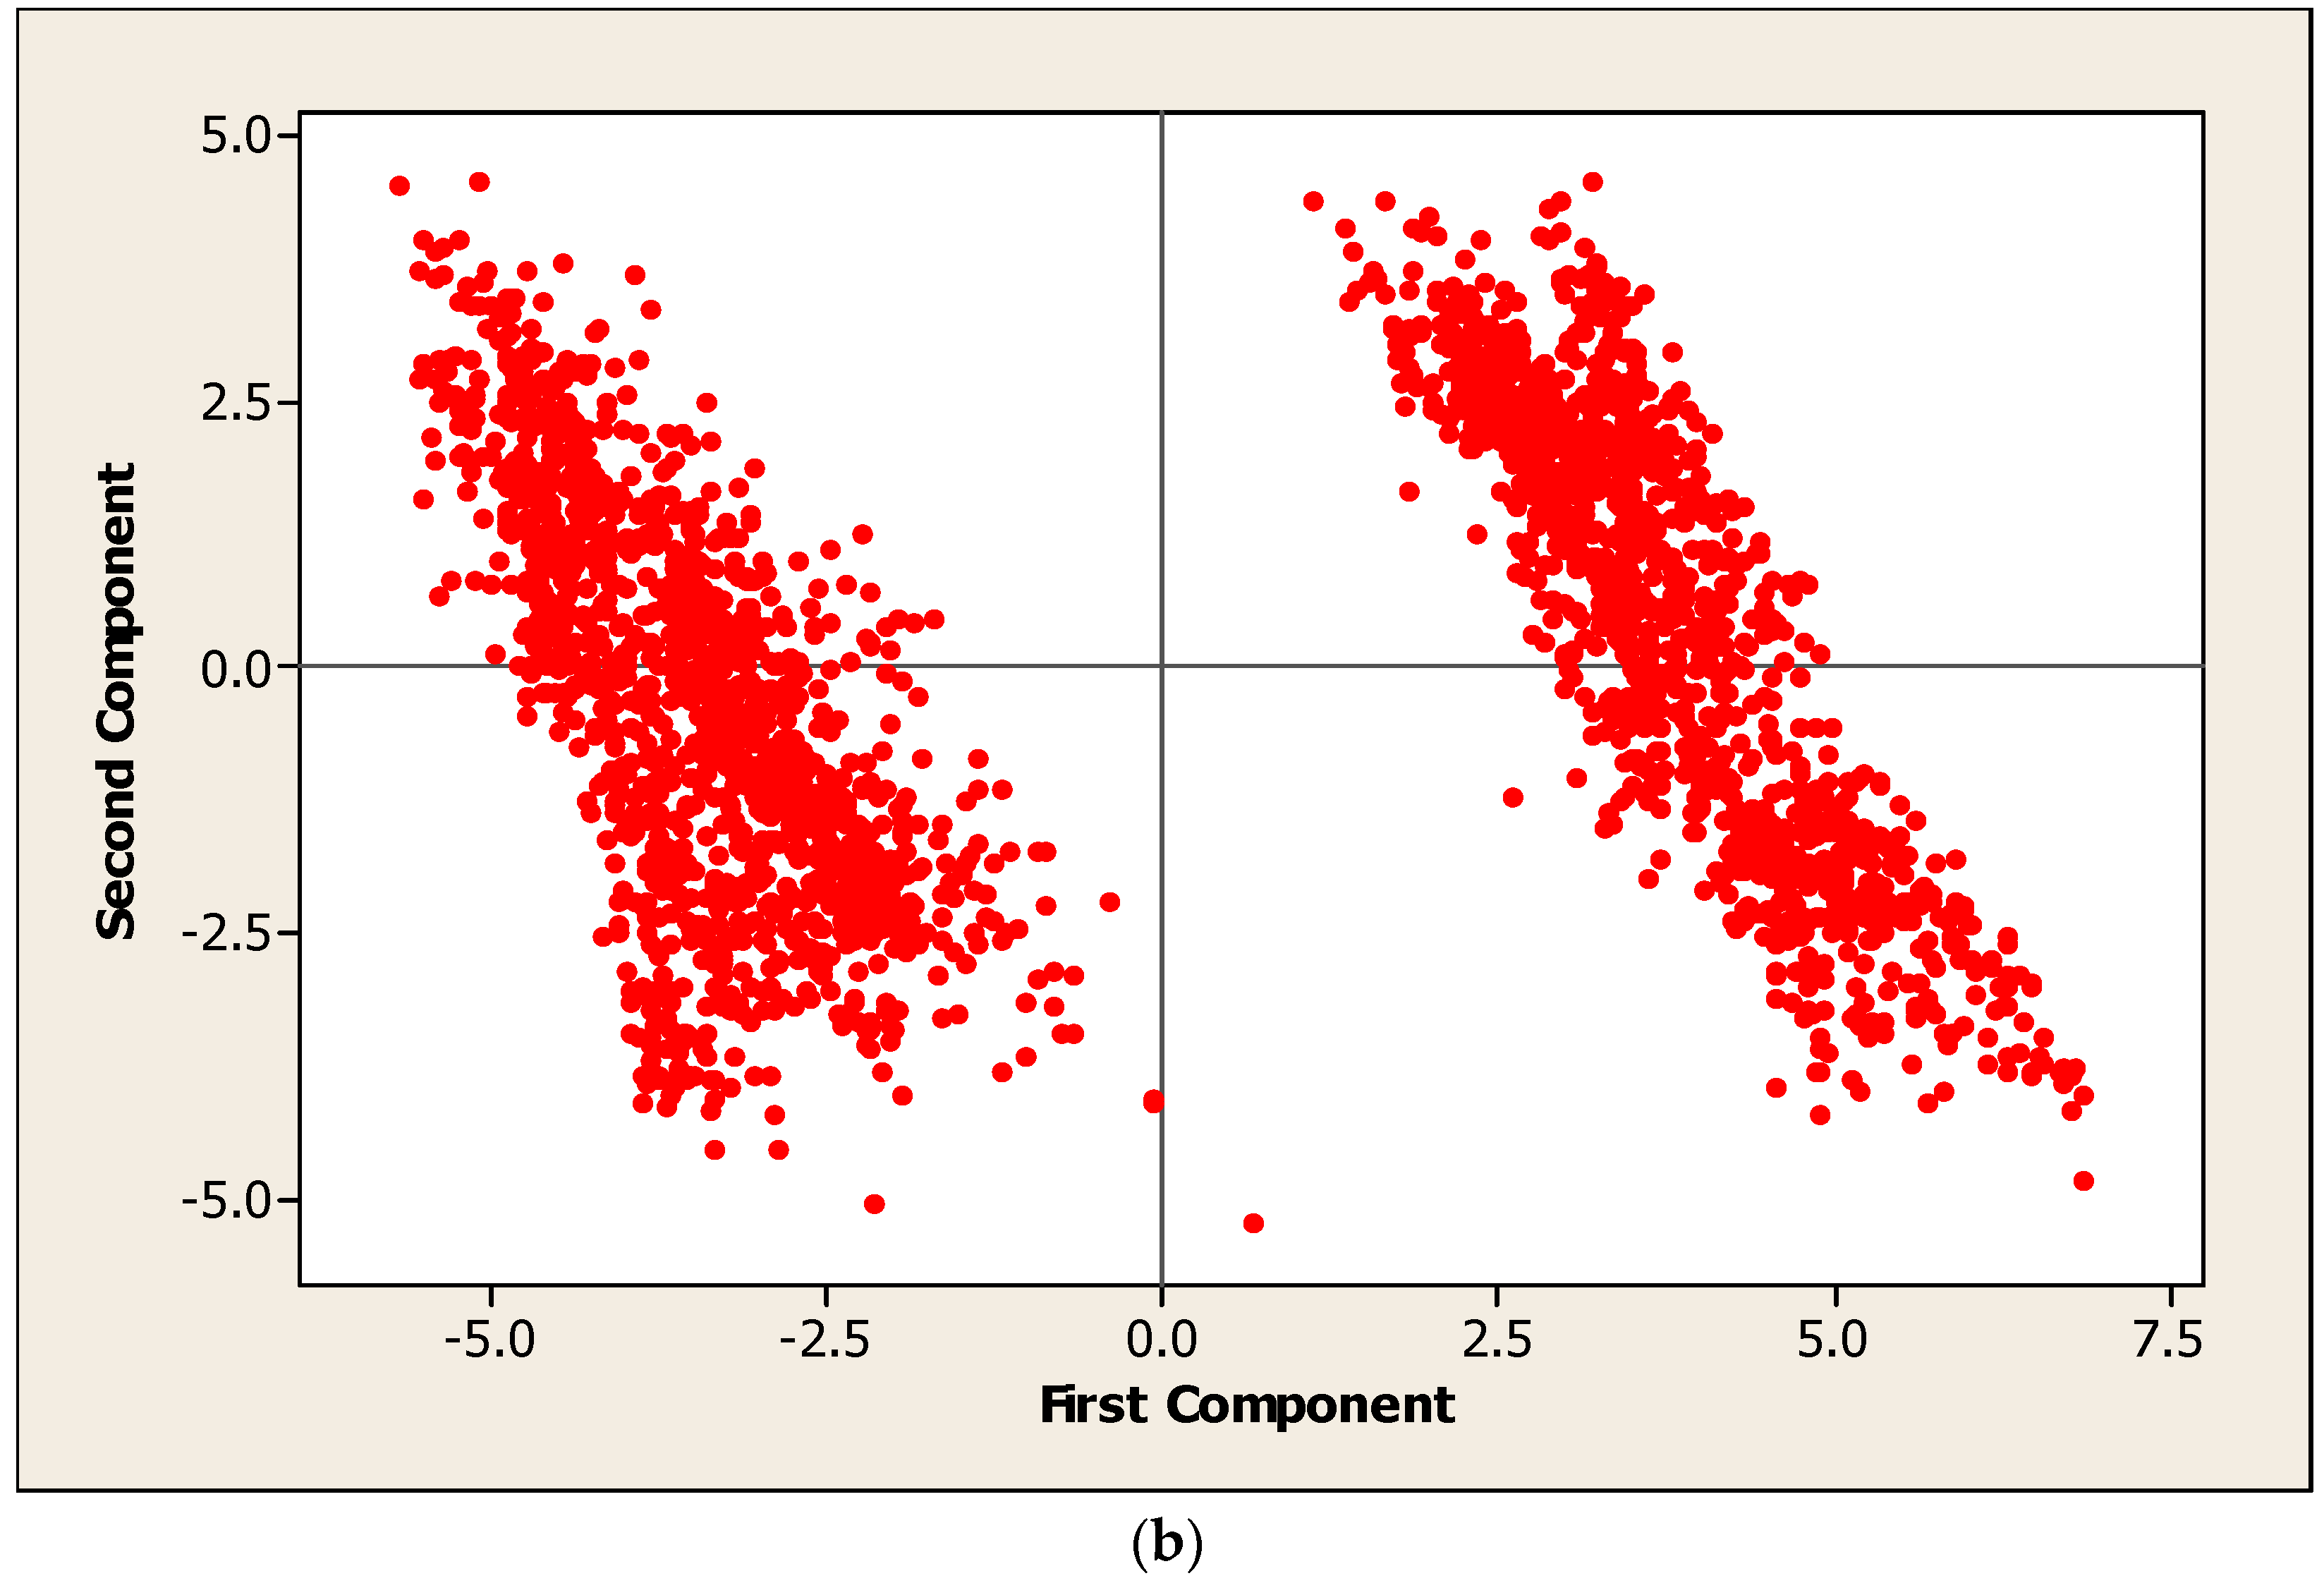
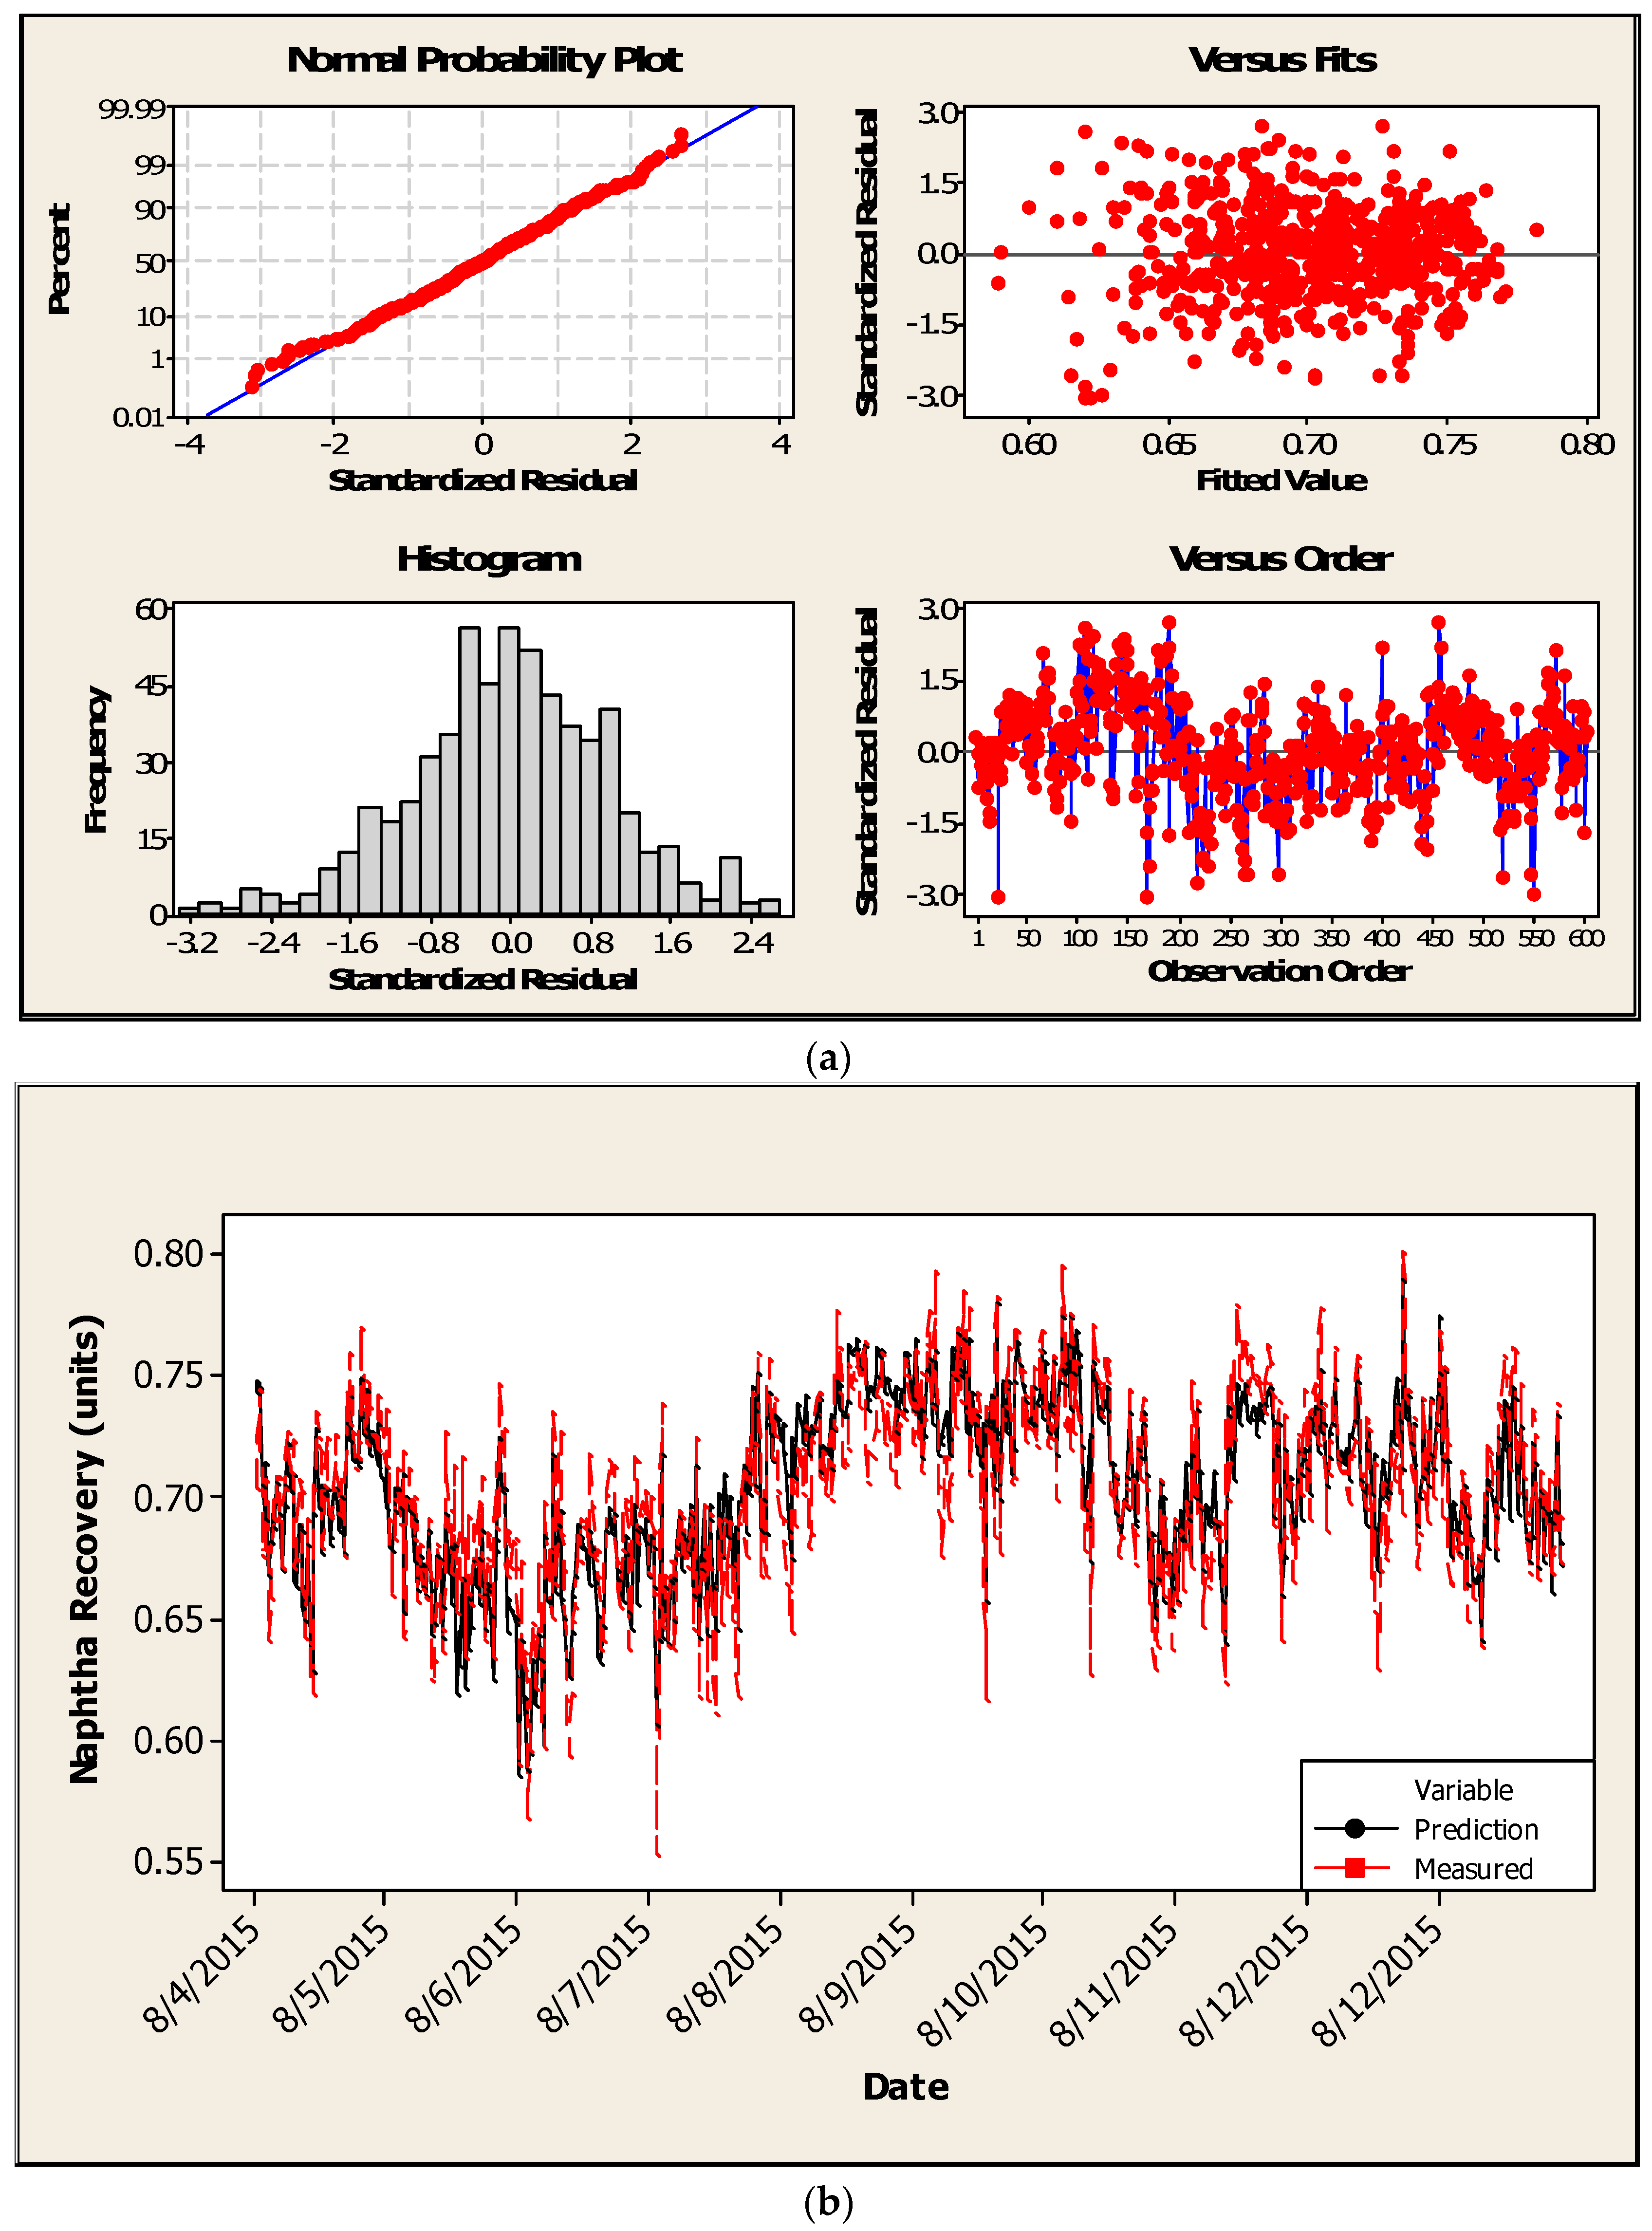
(a) Statistical modelling results for OP1 (residuals developed using training data); (b) Statistical modelling results for OP1 comparing measured versus predicted NR using testing data.
Figure 4.
(a) Statistical modelling results for OP1 (residuals developed using training data); (b) Statistical modelling results for OP1 comparing measured versus predicted NR using testing data.

Figure 5.
(a) Statistical modelling results for OP2 (residuals developed using training data); (b) Statistical modelling results for OP2 comparing measured versus predicted NR using testing data.
Figure 5.
(a) Statistical modelling results for OP2 (residuals developed using training data); (b) Statistical modelling results for OP2 comparing measured versus predicted NR using testing data.

Figure 6.
Impact of naphtha mass fraction in the feed on naphtha recovery (NR) as predicted by statistical models (SF = 0.562).
Figure 6.
Impact of naphtha mass fraction in the feed on naphtha recovery (NR) as predicted by statistical models (SF = 0.562).

Figure 7.
Impact of steam injection rate on naphtha recovery (NR) as predicted by statistical models (NF = 0.863 wt.%, ).
Figure 7.
Impact of steam injection rate on naphtha recovery (NR) as predicted by statistical models (NF = 0.863 wt.%, ).

Figure 8.
Measured and predicted mass flowrates of naphtha in the tailings for OP1.

Figure 9.
Measured and predicted mass flowrates of naphtha in the tailings for OP2.

Figure 10.
Configuration of the RadFrac model of the NRU column.

Figure 11.
Configuration of the interconnected Flash2 model of the NRU column.

Figure 12.
Configuration of the base case design for the overhead system.

Figure 13.
Illustration of “withdraw and remix” strategy to mimic the non-ideal NRU separators.

Figure 14.
Configuration of the “withdraw and remix” design for the overhead system.

Figure 15.
Impact of steam on naphtha recovery as predicted by Aspen Plus model.

Figure 16.
Impact of steam on recovered naphtha from separators 1 and 2 as predicted by Aspen Plus model.
Figure 16.
Impact of steam on recovered naphtha from separators 1 and 2 as predicted by Aspen Plus model.

Figure 17.
Impact of steam and cooling water flowrate on naphtha recovery as predicted by Aspen Plus model (4 different cooling water duties shown with units of MMBTU/h).
Figure 17.
Impact of steam and cooling water flowrate on naphtha recovery as predicted by Aspen Plus model (4 different cooling water duties shown with units of MMBTU/h).


Table 1.
NRU stream variables.
| Measured Variables | Description | Units | Measured Variables | Description | Units |
|---|---|---|---|---|---|
| Feed flow rate | bbl/h | Water composition in tailings | wt.% | ||
| Feed temperature | °F | Solid composition in tailings | wt.% | ||
| Naphtha composition in feed | wt.% | Recycled water flowrate | USGPM | ||
| Bitumen composition in feed | wt.% | Recycled water density | SG | ||
| Water composition in feed | wt.% | Water composition in recycled water | wt.% | ||
| Solid composition in feed | wt.% | Hydrocarbon composition in recycled water | wt.% | ||
| Steam injection rate | MLB/h | Recovered naphtha flowrate | USGPM | ||
| Upgrading water flow rate | bbl/h | Recovered naphtha density | SG | ||
| Demister water flow rate | USGPM | Water composition in recovered naphtha | wt.% | ||
| Tailings flow rate | USGPM | Hydrocarbon composition in recovered naphtha | wt.% | ||
| Tailings temperature | °F | Cooling water flowrate | USGPM | ||
| Naphtha composition in tailings | wt.% | Cooling water inlet temperature | °F | ||
| Bitumen composition in tailings | wt.% | Cooling water outlet temperature | °F |
Table 2.
NRU operating variables.
| Measured Variables | Description | Units | Measured Variables | Description | Units |
|---|---|---|---|---|---|
| NRU column bottom temperature | °F | NRU column top pressure | psi | ||
| NRU column bottom pressure | psi | Second separator temperature | °F | ||
| NRU column top temperature | °F | Overhead compressor suction pressure | psi |
Table 3.
Statistical model results for operating mode 1 (OP1).
| LS Model | NRprediction = 0.347 + 0.735 NF − 0.264 (NF)2 − 0.077 SF | |
|---|---|---|
| R square | Training Set | Testing Set |
| 0.927 | 0.912 | |
| Validation 1 | NRmeasured = −0.0095 + 1.011 NRprediction | |
1 Validation corresponds to fit obtained using testing data. A perfect fit between predicted and measured values of NR would correspond to slope = 1 and intercept = 0.
Table 4.
Statistical model results for OP2.
| LS Model | NRprediction = 0.605 + 0.475 NF − 0.129 (NF)2 − 0.375 SF | |
|---|---|---|
| R square | Training Set | Testing Set |
| 0.810 | 0.817 | |
| Validation 1 | NRmeasured = 0.0264 + 0.963 NRprediction | |
1 Validation corresponds to fit obtained using testing data. A perfect fit between predicted and measured values of NR would correspond to slope = 1 and intercept = 0.
Table 5.
Composition of naphtha stream used in the Aspen Plus model.
| Component | Mass Fraction (Total = 100) |
|---|---|
| n-Pentane | 0.25 |
| Benzene | 0.27 |
| Methylcyclopentane | 5.25 |
| n-Hexane | 9.23 |
| Toluene | 2.38 |
| Methylcyclohexane | 9.32 |
| n-Heptane | 9.33 |
| 2-Methylhexane | 8.43 |
| m-Xylene | 3.21 |
| Ethylbenzene | 0.79 |
| 1-Methyl-1-ethycyclopentane | 5.90 |
| n-Octane | 6.42 |
| 2-Methylheptane | 8.60 |
| 2,3-Dihydroindene | 0.50 |
| 1-Ethyl-3-methylbenzene | 3.66 |
| tert-Butylcyclopentane | 1.83 |
| n-Nonane | 4.33 |
| 2,2,5-Trimethylhexane | 11.71 |
| n-Decane | 4.13 |
| C10-Naphthene | 1.18 |
| 1,3-Dimethyl-4-ethylbenzene | 0.46 |
| Isobutylcyclohexane | 0.30 |
| 3,6-Dimethyloctane | 1.82 |
| n-Undecane | 0.70 |
Table 6.
Aspen Plus unit specifications for both base case and “withdraw and remix” designs.
| Industrial Unit | Symbol | Simulation Model | Specification | ||
|---|---|---|---|---|---|
| Variable | Value | Unit | |||
| NRU Column | COLUMN | RadFrac | Number of Stage | 2 | stage |
| Pressure @ 1st stage | 2.7 | psi | |||
| Pressure Drop | 0.3 | psi | |||
| Overhead Condenser | HX1 | HEATER | Pressure | 2.5 | psi |
| Duty | −75 | MMBTU/h | |||
| Compressor | COMP | Compr(Isentropic) | Discharge Pressure | 3.8 | psi |
| Pump | PUMP | Pump | Discharge Pressure | 2.7 | psi |
| First Separator | SEP11 | Flash 2 | Pressure | 2.5 | psi |
| Duty | 0 | MMBTU/h | |||
| SEP12 | Decanter | Pressure | 2.5 | psi | |
| Temperature | 82 | ||||
| Second Separator | SEP2 | Flash 3 | Temperature | 100 | |
| Pressure | 3.8 | psi | |||
© 2018 by the authors. Licensee MDPI, Basel, Switzerland. This article is an open access article distributed under the terms and conditions of the Creative Commons Attribution (CC BY) license (http://creativecommons.org/licenses/by/4.0/).
Share and Cite
MDPI and ACS Style
Du, J.; Cluett, W.R. Modelling of a Naphtha Recovery Unit (NRU) with Implications for Process Optimization. Processes 2018, 6, 74. https://doi.org/10.3390/pr6070074
AMA Style
Du J, Cluett WR. Modelling of a Naphtha Recovery Unit (NRU) with Implications for Process Optimization. Processes. 2018; 6(7):74. https://doi.org/10.3390/pr6070074
Chicago/Turabian StyleDu, Jiawei, and William R. Cluett. 2018. "Modelling of a Naphtha Recovery Unit (NRU) with Implications for Process Optimization" Processes 6, no. 7: 74. https://doi.org/10.3390/pr6070074
Note that from the first issue of 2016, this journal uses article numbers instead of page numbers. See further details here.