Article

Investigation on Reinforcement and Lapping Effect of Fracture Grouting in Yellow River Embankment

School of Civil Engineering, Shandong University, 17922, Jingshi Road, Jinan 250061, China
*
Author to whom correspondence should be addressed.
Processes 2018, 6(7), 75; https://doi.org/10.3390/pr6070075
Submission received: 23 May 2018 / Revised: 17 June 2018 / Accepted: 19 June 2018 / Published: 22 June 2018
(This article belongs to the Special Issue Fluid Flow in Fractured Porous Media)

Abstract

:
Fracture grouting has been a mitigation measure widely used against seepage in the Yellow River Embankment. However, there is currently a lack of systematic investigations studying the anti-seepage effect of the fracture grouting employed in this longest river embankment in China. Therefore, in this work, laboratory and in situ experiments are carried out to investigate the reinforcement effect of fracture grouting in the Jinan section of the Yellow River Embankment. In particular, laboratory tests concentrate on studying the optimum strength improvement for cement–silicate grout by varying the content of backfilled fly ash and bentonite as admixtures. Mechanical strength and Scanning Electron Microscope photographs are investigated for assessing the strength and compactness improvement. Subsequently, based on the obtained optimum admixtures content, in situ grouting tests are carried out in the Jinan section of the Yellow River Embankment to evaluate the reinforcement and lapping effect of fracture grouting veins, where geophysical prospecting and pit prospecting methods are employed. Laboratory results show that, compared with pure cement–silicate grouts, the gelation time of the improved slurry is longer and gelation time increases as fly ash content increases. The optimum mixing proportion of the compound cement–silicate grout is 70% cement, 25% fly ash, and 5% bentonite, and the best volume ratio is 2 for the investigated cases. Geophysical prospecting including the ground penetrating radar and high-density resistivity method can reflect the lapping effect of fracture grouting veins on site. It shows that the grouting material mainly flows along the axial direction of the embankment. The treatment used to generate directional fracture is proved to be effective. The injection hole interval distance is suggested to be 1.2 m, where the lapping effect of the grouting veins is relatively significant. For the investigated cases, the average thickness of the grouting veins is approximately 6.0 cm and the corresponding permeability coefficient is averagely 1.6 × 10⁻⁶ cm/s, which meets the anti-seepage criterion in practice.

1. Introduction

The Yellow River Embankment is the longest river embankment in China, and is mainly constructed of Yellow River alluvial soils, i.e., silt with low surface strength, high porosity, and drastic capillarity. Many scholars [1,2,3] have investigated the Yellow River Embankment from different points of view. Seepage-induced instabilities such as infiltration, piping, and leakage frequently occurred in the Yellow River Embankment during its long-term operation period, mainly due to its unfavorable soil properties, animal interference, and water level change [4]. Among the potential seepage control methods, fracture grouting has been developing rapidly recently due to its low cost and high efficiency [5]. According to the statistics, more than 3000 dangerous reservoirs and 2000 km of embankments have been reinforced with fracture grouting in the past 20 years [6].
Researchers have carried out a series of studies on grouting materials [7,8,9], grouting mechanism, and fluid flow [10,11] against seepage through indoor experiments and theoretical analysis. In particular, Warner et al. [12] used compaction grouting to mitigate the sinkholes at WAC Bennett dam, showing satisfactory reinforcement effect. Grotenhuis [13] predicted the fracture length and thickness of grouting in sandy soil through analytical solutions. Tunçdemir et al. [14] investigated fracture grouting in fissured Ankara Clay with low-viscosity cement grouts, where the effect of water/solid ratio and the applied vertical stress on fracturing pressure was studied. Bezuijen [15] studied fracture grouting in sand by developing a conceptual and analytical model and obtained the relationship between crack dimensions and grouting material properties. Yoneyama et al. [16] discussed the mechanism by which cement grout controlled water permeation through fractures in rocks, focusing on the effectiveness of the clogging of cement particles for closing water paths. Yun et al. [17] studied the injection process of fracture grouting and proposed an analytical solution to determine fracture pressure, length, and thickness. Wang et al. [18] performed laboratory tests on loose sand under confined boundary conditions to explore the grouting evolution and diffusion process, with different grout water cement ratios and degrees of saturation of soil. They highlighted the influence of these two factors on the injected grout volume, grout density, and the characteristics of the grouted bulbs. Sun [19] put forward the important factors affecting diffusion radius and derived the calculation formula of fracture grouting diffusion radius based on the assumption that the soil is isotropic and the calculated model is an ideal parallel plane model. However, those introduced works mainly concentrate on investigating grouting in sand or some specific soil whose engineering properties are very different from the Yellow River silt. Therefore, the grouting parameters in existing studies cannot be directly used to investigate the anti-seepage grouting in the Yellow River Embankment. Furthermore, due to the complexity and randomness of grouting mechanism and material properties, there is a need for a systematic assessment for the grouting effectiveness in the Yellow River Embankment.
In existing studies, experimental or theoretical works have been conducted to investigate the properties of the Yellow River silt. In particular, Liu et al. [20] established the stress–strain behavior of the Yellow River silt under dynamic loading through dynamic triaxial and resonance column tests. Xiao et al. [21] investigated the basic physical–mechanical properties of the Yellow River silt by a series of laboratory experiments to treat the distress of silt rainfall of the Beijing–Jiulong railway in the Yellow River alluvial plain area. Song et al. [22] simulated the rainfall infiltration and capillary rising through laboratory tests and analyzed the hydrophilic characteristics of silty roadbed in the Yellow River alluvial plain. Zhu et al. [23] studied the attenuation law of strength and stiffness of silty embankment under capillary water and evaluate the reinforcement effect of the embankment by using the Soletanche method based on large-scale indoor model tests. Chen et al. [24] carried out a number of triaxial tests with stress-controlled monotonic loading and cyclic loading for the Yellow River silt under the CU condition to investigate factors that influence the mechanical behavior of the Yellow River silt. Shi [25] studied the bond performance between polymer anchorage body and silt through ultimate pullout tests on vertical polymer anchors. It is noted that the existing studies concentrate on investigating the mechanical properties of the Yellow River silt through indoor tests. However, laboratory tests cannot comprehensively reflect the in situ state of soil or reveal realistically the grouting mechanism of fracture grouting in the Yellow River Embankment.
Therefore, in this work, laboratory and in situ experiments are carried out to investigate the reinforcement effect of fracture grouting in the Jinan section of the Yellow River Embankment. In particular, firstly, the laboratory tests concentrate on studying the optimum strength and compactness improvement for cement–silicate grout by varying the content of backfilled fly ash and bentonite as admixtures. Flexural strength and Scanning Electron Microscope photographs are investigated for assessing the strength and compactness improvement. Subsequently, based on the obtained optimum admixtures content, in situ grouting tests are carried out in the Jinan section of the Yellow River Embankment to investigate the anti-seepage effect of fracture grouting, where geophysical prospecting and pit prospecting methods are employed. The work provides references for determining the technical construction parameters of practical fracture grouting in river embankment, i.e., distance of grouting holes, the optimum mixing proportion of grouting material and termination condition.

2. Experimental Scheme and Testing Procedure

2.1. Grouting Material Laboratory Experiment

Grouting effectiveness significantly depends on the grouting materials used in practice. Cement–silicate grout has been widely used due to its short gelation time and high stone rate. However, it has some limitations, such as low-level stability and fluidity, which has restricted its further development. Therefore, experiments are designed to investigate the improvements on the reinforcement effect of the existing cement–silicate grout aiming for the optimum content of backfilled fly ash and bentonite as water reducing agent and expansive agent respectively.

2.1.1. Raw Material

The cement used in the experiment is a Portland cement (PC) graded 42.5 and produced by Sunnsy Group in Jinan. The fly ash (FA) can be classified as Class F according to ASTM C618-05 [26]. The compositions of PC and FA are shown in Table 1. The main characteristics and properties of bentonite (B) are shown in Table 2. The Baume degree and modulus of the silicate are 40 and 3.3 respectively.

2.1.2. Experimental Scheme

To improve the grouting effects of cement–silicate grout, fly ash and bentonite are added as admixtures. In particular, first, construction cost can decrease when partially replacing cement with fly ash. Second, the fluidity of grout increases as fly ash particle is spherical and finer than the cement ones. Last but not the least, secondary reaction can occur between fly ash and the reactants of hydration action of cement, and low calcium hydrates like CaSiO3 can be generated, which improves the anti-aqueous solubility of the concretion and promotes the durability of the anti-seepage curtain. According to Sha [27], the optimum percentage of fly ash ranges from 20% to 30%.
Bentonite can improve the stability and infiltration capacity of grout. However, bentonite affects the hydration of cement and lowers concrete strength [28]. Therefore, the mixing content of bentonite should be controlled in a certain range. Based on the research of Liu [29], the percentage of bentonite is controlled at 5% in this paper to achieve an optimum improvement.
In addition, the water over solid (W/S) ratio is controlled at 1.0 according to practical engineering. The volume ratios (VR) between cementitious suspensions and silicate are parametrically varied with 1:1, 2:1, 3:1, and 4:1. The specific proportion of mixture of experimental grout is shown in Table 3.

2.1.3. Testing Procedure

Inverted cup tests are firstly carried out to measure the gelation time of the slurry under different fly ash content (FA) and volume ratio between cementitious suspensions and silicate (VR). Secondly, the specimens are produced in laboratory and the dimensions of the specimen are 40 × 40 × 160 mm according to GB/T 17671-1999 [30]. The specimens are subsequently maintained in a standard curing room (23 ± 3 °C and 100% R.H.) for seven and 28 days, two maintenance conditions. Thirdly, a WDW-100E mechanical press is used to measure the compressive and flexural strength of the specimen with a speed of 2 kN/min and 2 mm/min respectively. Finally, Scanning Electron Microscope (SEM) photographs are investigated for assessing the anti-seepage properties in a micro perspective.

2.2. In Situ Grouting Test

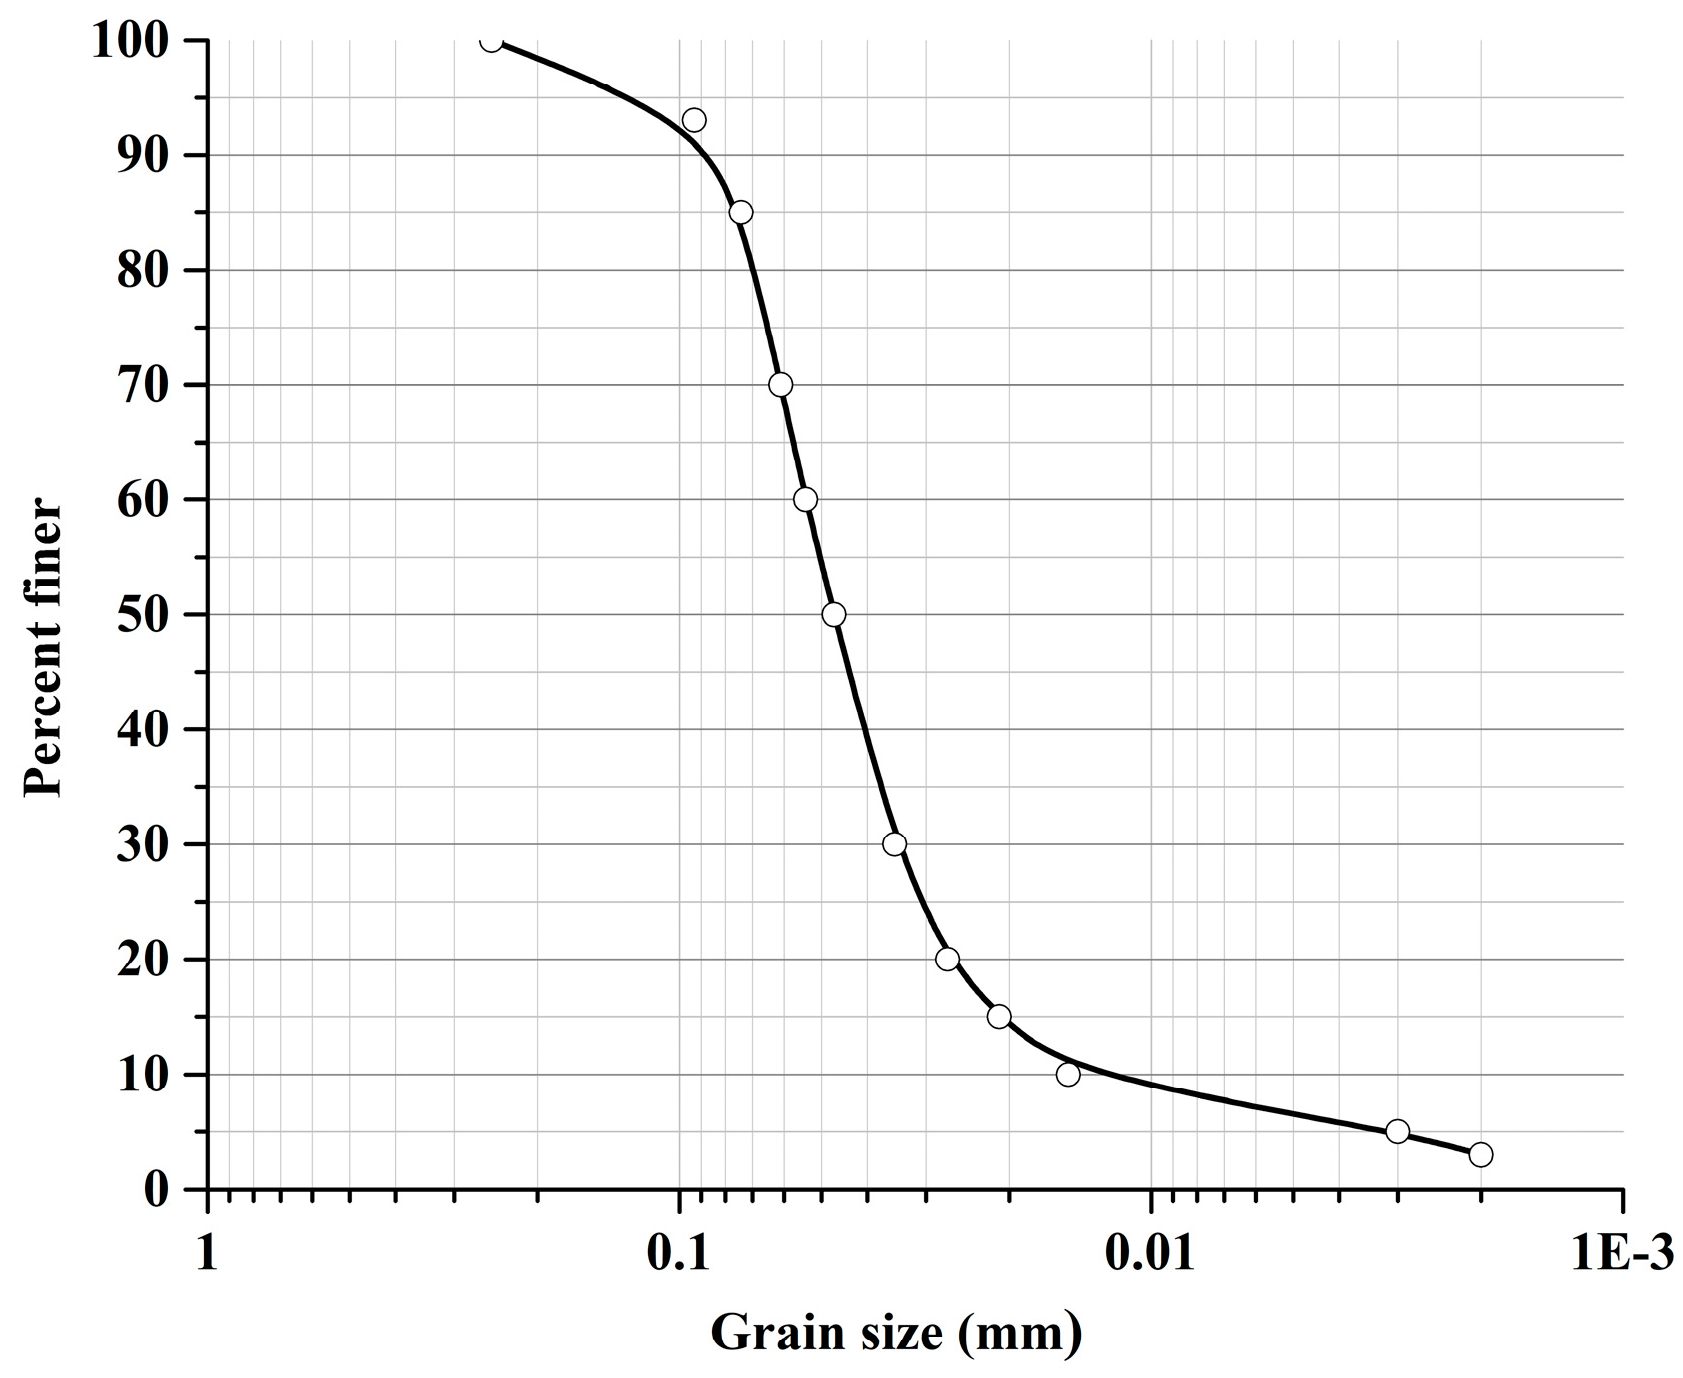
2.2.1. Yellow River Silt

According to Cui [31], Yellow River silt consists of over 80% silt and a small amount of clay, with low surface strength, high porosity, and drastic capillarity.
Prior to the in situ tests, particle gradation tests, direct shear tests, and permeability tests are carried out. The result of the particle gradation testis shown in Figure 1. The non-uniform coefficient (Cu) and curvature coefficient (Cc) of Yellow River Silt are 3.6 and 1.51 respectively. It can be seen that the particle gradation of the Yellow River silt is relatively uniform and the particles in the size range 0.002–0.074 mm account for more than 80%. In addition, the gradation of the soil is poor as Cu is smaller than 5. Based on the results from the direct shear tests, the cohesion (cq) and angle of shearing resistance ( φ q) are 10.78 kPa and 23.67°, respectively. The permeability of the Yellow River silt is obtained by the variable water head permeability test and the tested permeability coefficient is 5.913 × 10⁻⁵ cm/s.

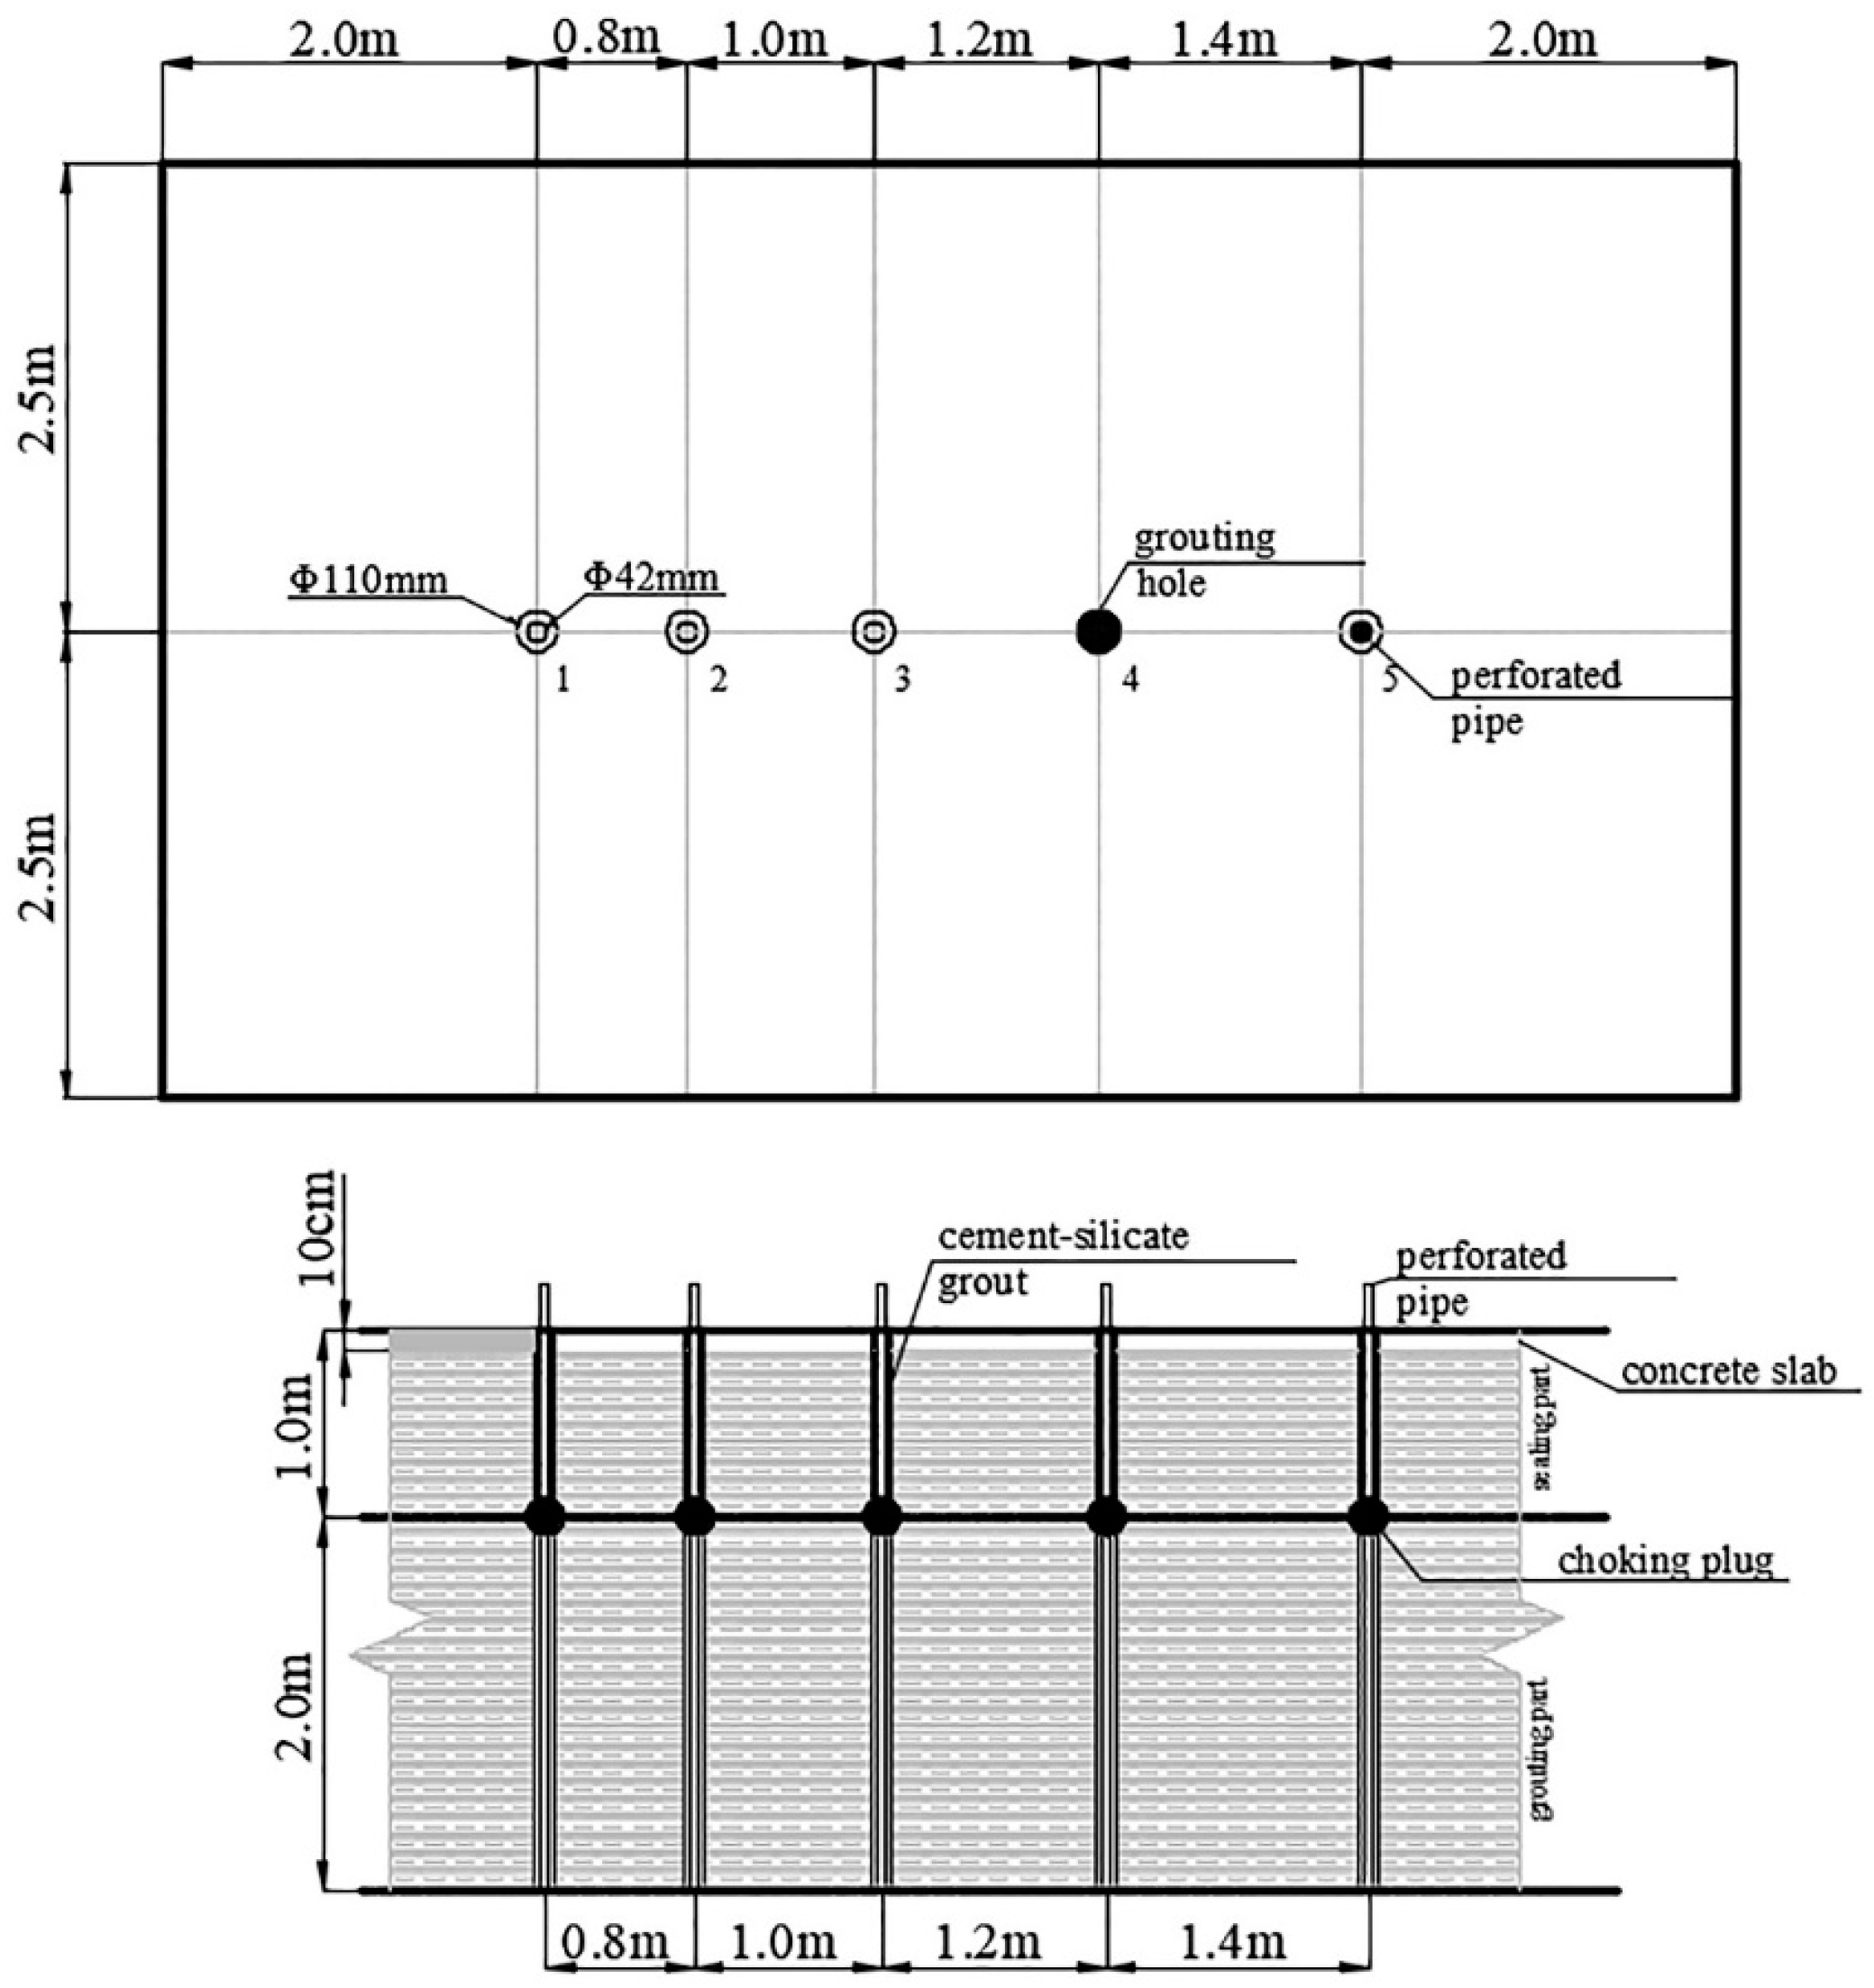
2.2.2. Design of In Situ Grouting Tests

(1) Layout of grouting holes
The interval distance between grouting holes is determined by diffusion radius and grouting range, while diffusion radius is decided by rheological property of grouting material, grouting pressure and grouting time. However, there is a lack of theoretical relation for confirming the diffusion radius at present. As a consequence, the determination of the distance will be determined empirically based on practical applications.
When determining the interval distance, the lapping effect between two holes should be taken into consideration. Based on the fact that the permeability of Yellow River silt is relatively low, the fracture grouting would be the dominant type when conducting grouting experiment. According to the existing applications [32], the distance between two grouting holes can be determined as 1.0–2.0 m. In order to further decide the optimum distance, the interval distance is parametrically varied from 0.8 m to 1.5 m in the tests. The layout of the grouting holes and the schematic cross section of the grouting field are shown in Figure 2.
(2) Grouting pressure
It is crucial to control the grouting pressure during the grouting process, which affects the compactness of the soil. However, deformation or even destruction of earth structures can occur when grouting pressure exceeds a critical value. Therefore, the grouting pressure should be controlled in a certain range. The maximum allowed value of fracture grouting pressure can be calculated by Equation (1) [33]:
Pmax = γh + σt,
where γ, h and σt represent the specific weight of soil, the depth of grouting pipe and soil tensile strength respectively.
After substituting γ = 15.5 kN/m3, σt = 10 kPa(empirical value) and h = 3 m into Equation (1), the maximum allowable pressure is determined to be 56.5 kPa.
Considering that emitting slurry phenomenon may happen when grouting in shallow strata, the ultimate grouting pressure can be calculated by Equation (2) [32]:
Pu ≤ γhtan2(45° + φ/2) + 2c tan (45° + φ/2).
Based on the results in Section 2.2.1, the ultimate grouting pressure is calculated as 141.9 kPa.
Combining the calculated results, initiation pressure and the ultimate pressure are determined as 60 kPa and 150 kPa in the field grouting experiment.

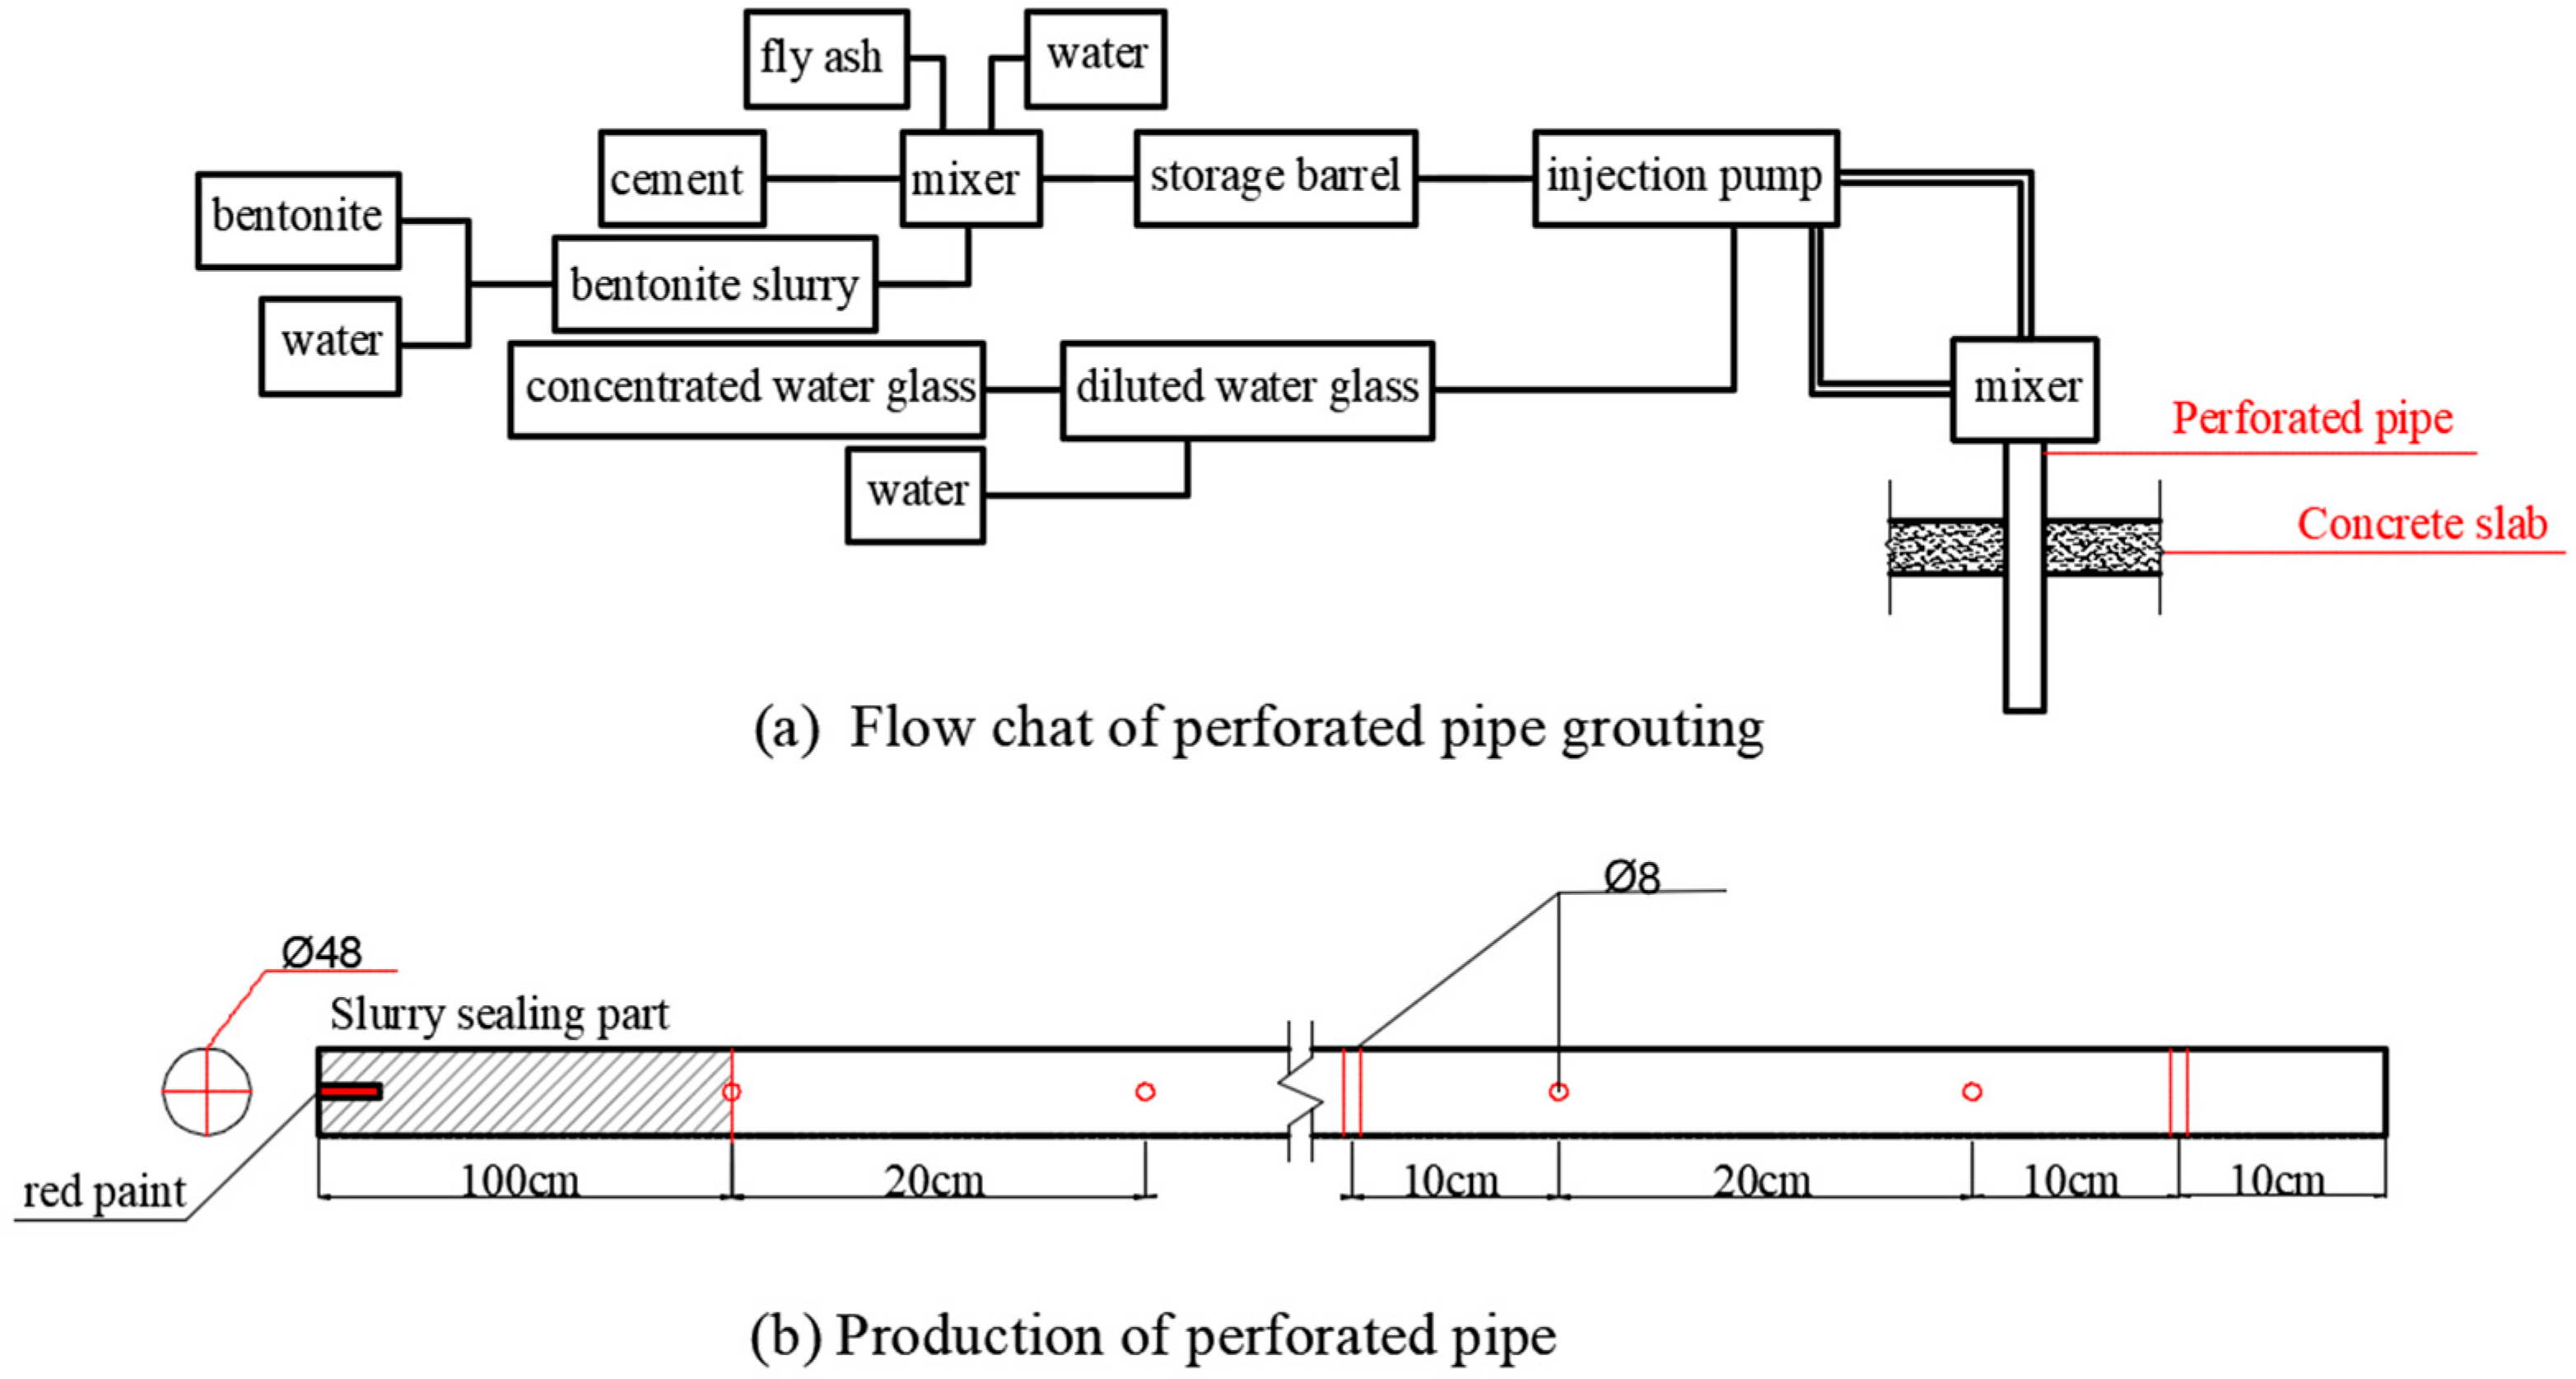
2.2.3. Grouting Procedure

Perforated pipe grouting is used in in situ tests. The grouting procedure involves grouting pad construction, positioning and drilling of grouting holes, preparation of the grout, and, finally, injection of the grout. A flow chart of grouting is shown in Figure 3a.
A concrete slab with dimensions of 8.4 m × 5 m × 10 cm (length × width × depth) is produced as the grouting pad a week before the grouting injection. After fabricating the grouting pad for three days, the grouting holes are excavated according to Figure 2. At the same time, the perforated pipes are produced with seamless steel tube with diameter of 48 mm and wall thickness of 3.5 mm. In order to generate directional grouting fractures along the axis, the hole distances on the pipe are designed to be different in two direction where one direction is 20 cm and the other is 40 cm. The direction of the dense holes on the pipes is marked with red oil paint. The detailed process is shown in Figure 3b.
The optimum admixture content is obtained from the laboratory tests and is adopted in the in situ tests. The cementitious suspensions and the water glass with Baume degree of 40 are placed in different agitated tanks. The prepared grout is agitated in case of sedimentation or setting. Meanwhile, drilling rig is used to bore the grouting holes according to the grouting holes positions.
After boring the grouting holes, perforated pipes are placed into the holes. It should be noted that the painted direction is parallel to the axial direction of the layout of the in situ grouting test. Before injection, cement–silicate grout with volume ratio of 2:1 is used to seal the holes to avoid slurry inflow.
After preparation, the grout is pumped into the grouting holes and the sequence of grouting holes number is 1, 3, 5, 2 and 4. Thin slurry is used at the beginning and the grouting pressure increases progressively until it reaches the fracture pressure (about 0.06 MPa). After spitting the soil, the grouting pressure is decreased and adjusted to the defined level. Meanwhile, the slurry is gradually densified. The injection process does not complete until one of the following two criteria is satisfied: either the volume of the injected grout is equal to the predefined volume (150–200 kg/m) or the inflow injection pressure reaches the ultimate pressure (about 0.15 MPa). When the injection completes, the circuits of the injection pump should be washed with clean water to avoid blocking. Besides, concentrated grout is injected to the grouting holes to seal the holes.

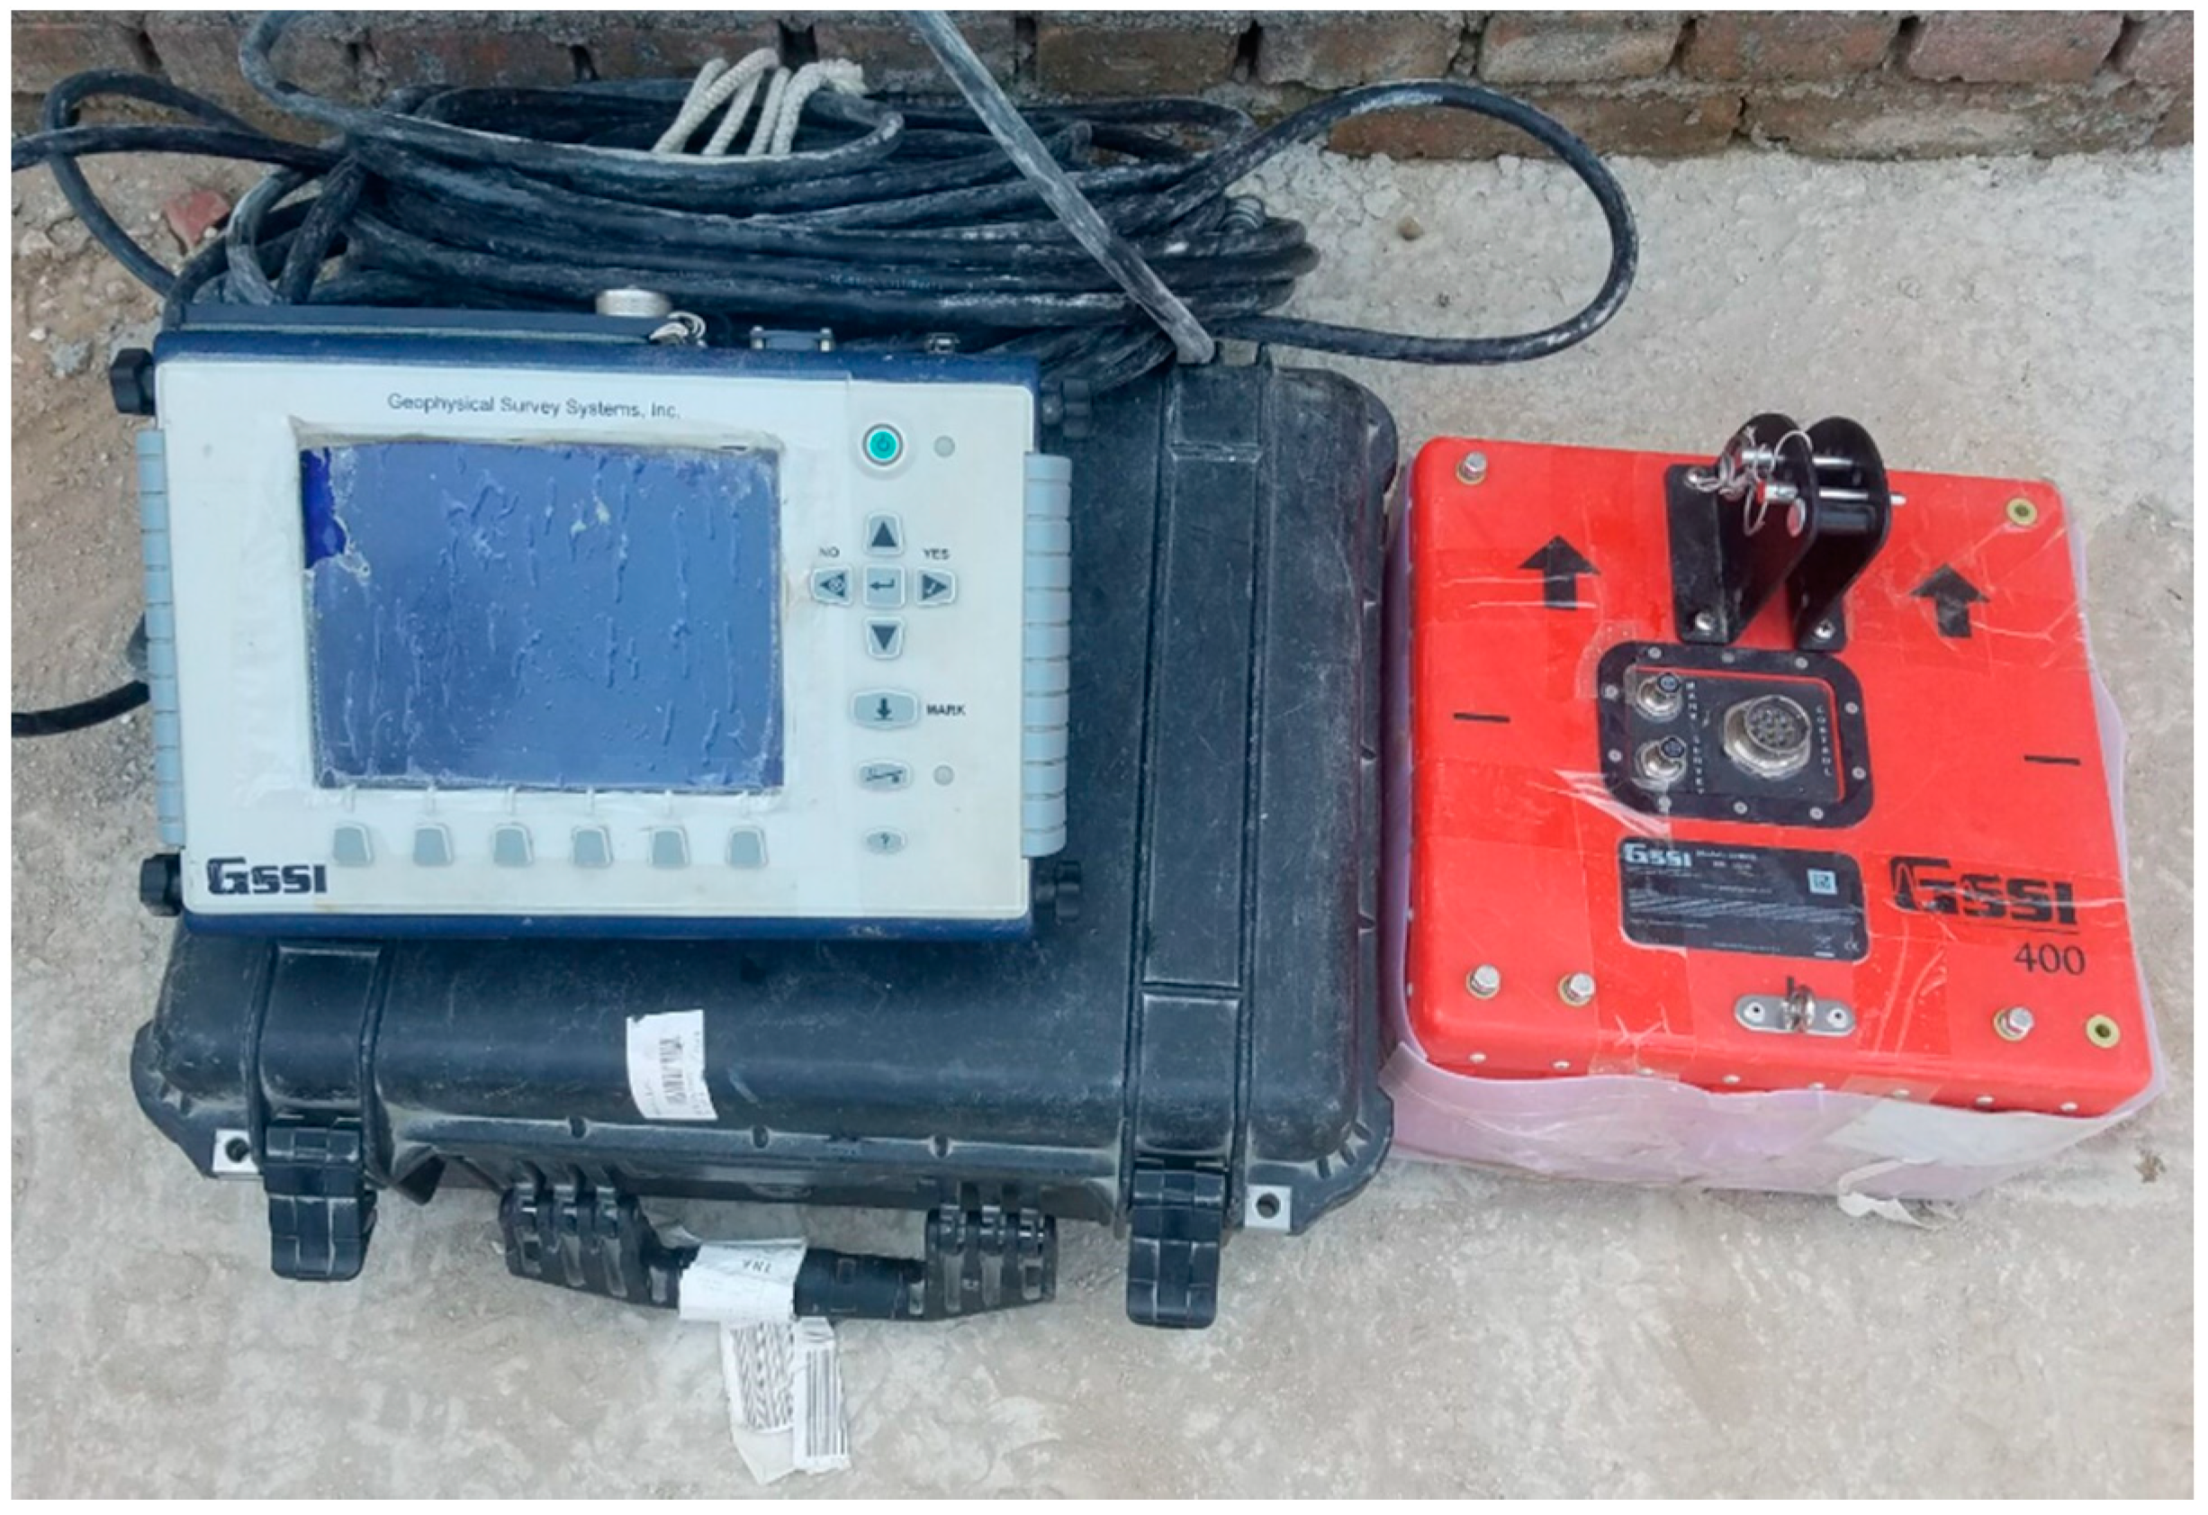
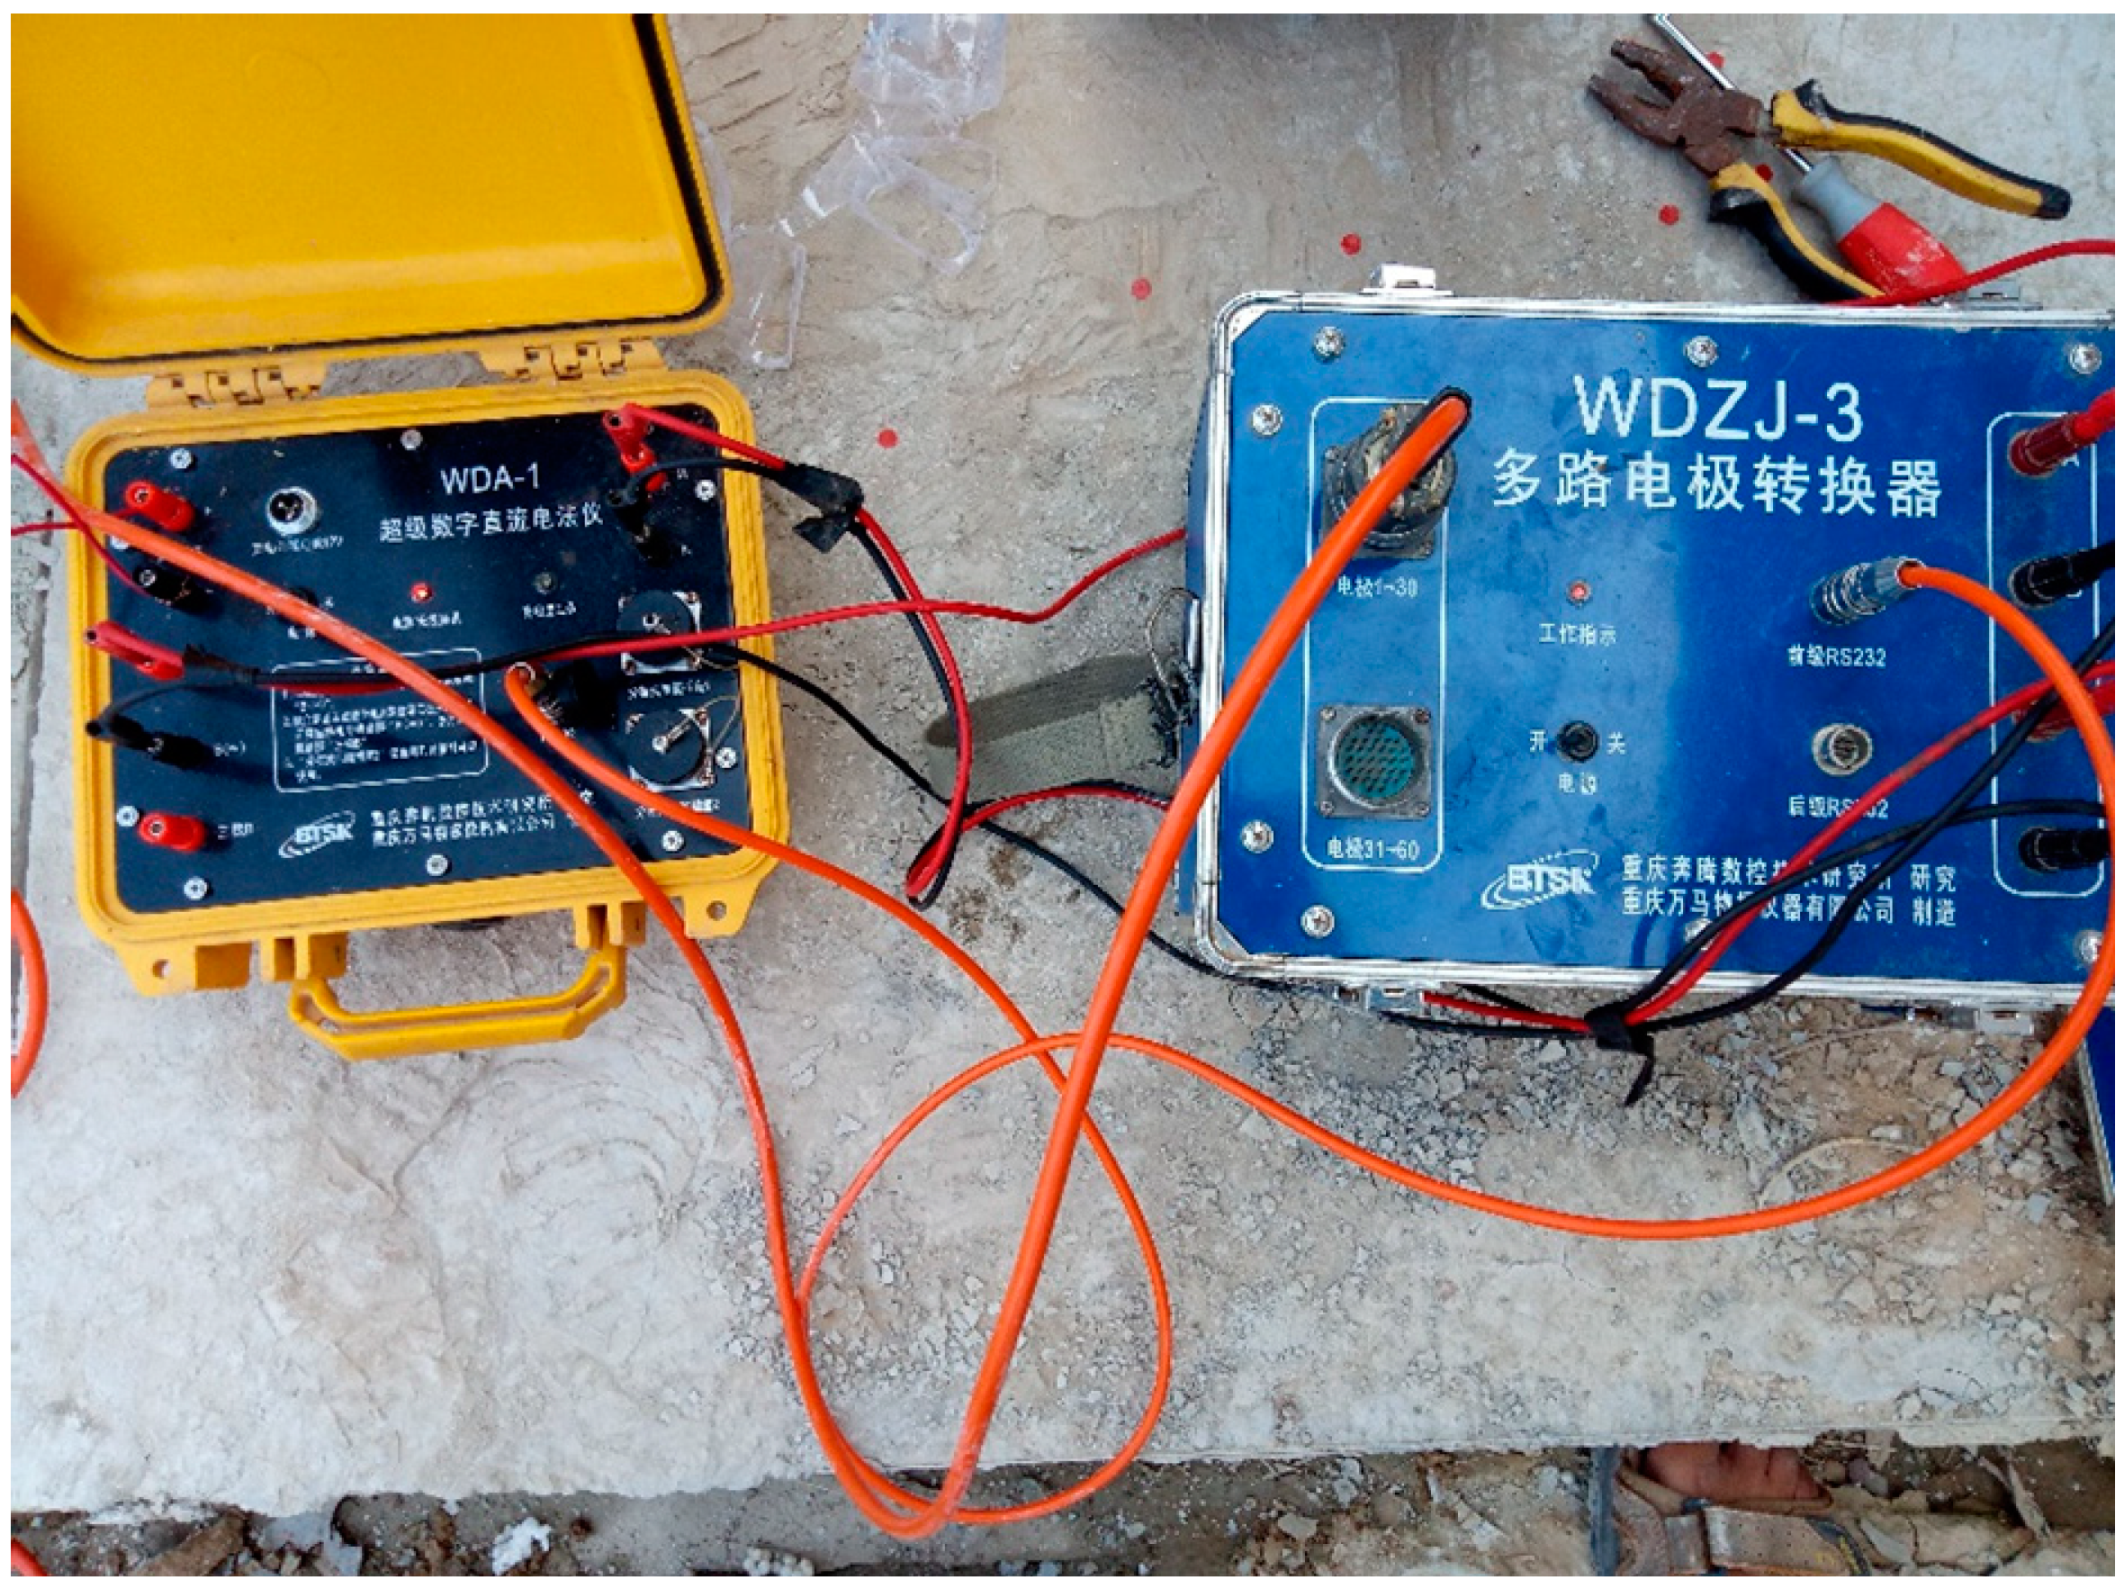
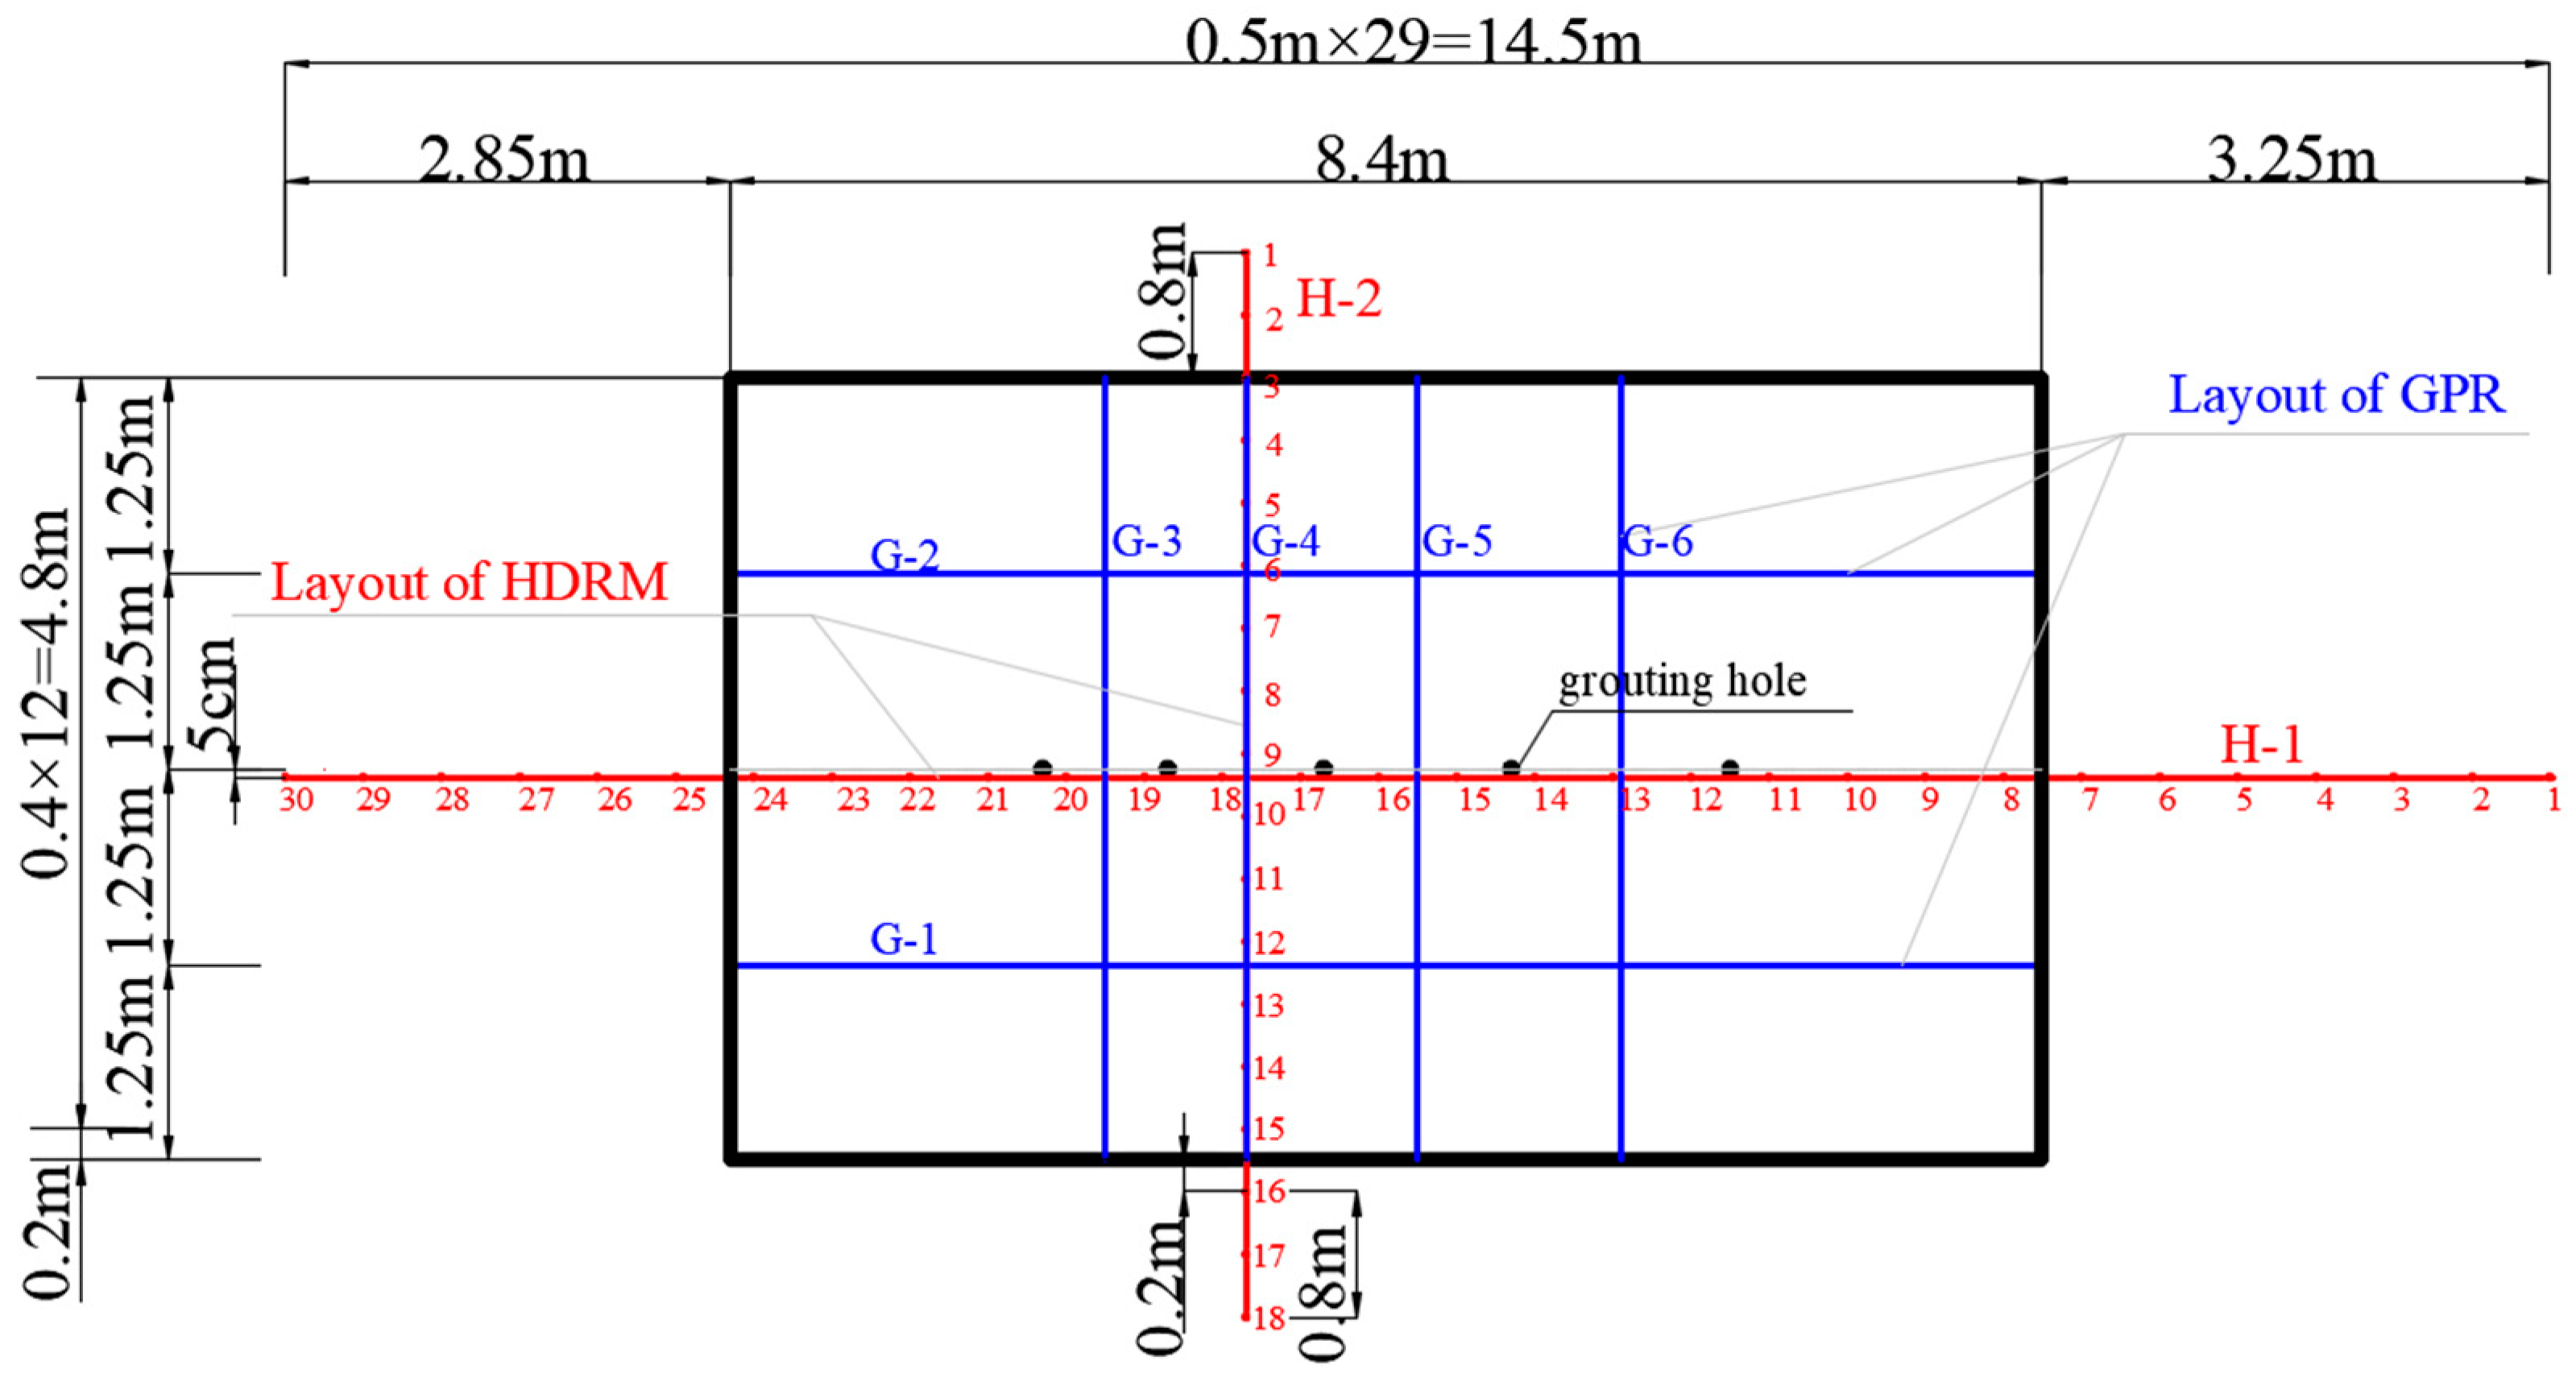
2.2.4. Geophysical Prospecting Method

In order to comprehensively evaluate grouting effectiveness, both the ground-penetrating radar (GPR) and high-density resistivity method (HDRM) are used to avoid the limitation and multiplicity induced by a single method, as shown in Figure 4 and Figure 5. Pit prospecting is additionally carried out to investigate the reinforcement mechanism and the created grouting veins. The results of pit prospecting can verify the validity of the geophysical prospecting method and can further help to better understand the grouting mechanism in the soil.
The in situ test procedure is described as follows. First, the reinforcement condition is detected using GPR and HDRM two weeks after grouting, where the layout of geophysical prospecting is shown in Figure 6. After geophysical prospecting, the grouted field is excavated to observe the grouting veins. Finally, part of the grouting veins is sampled, and the thickness of the grouting veins is measured.

3. Discussion of Laboratory Results

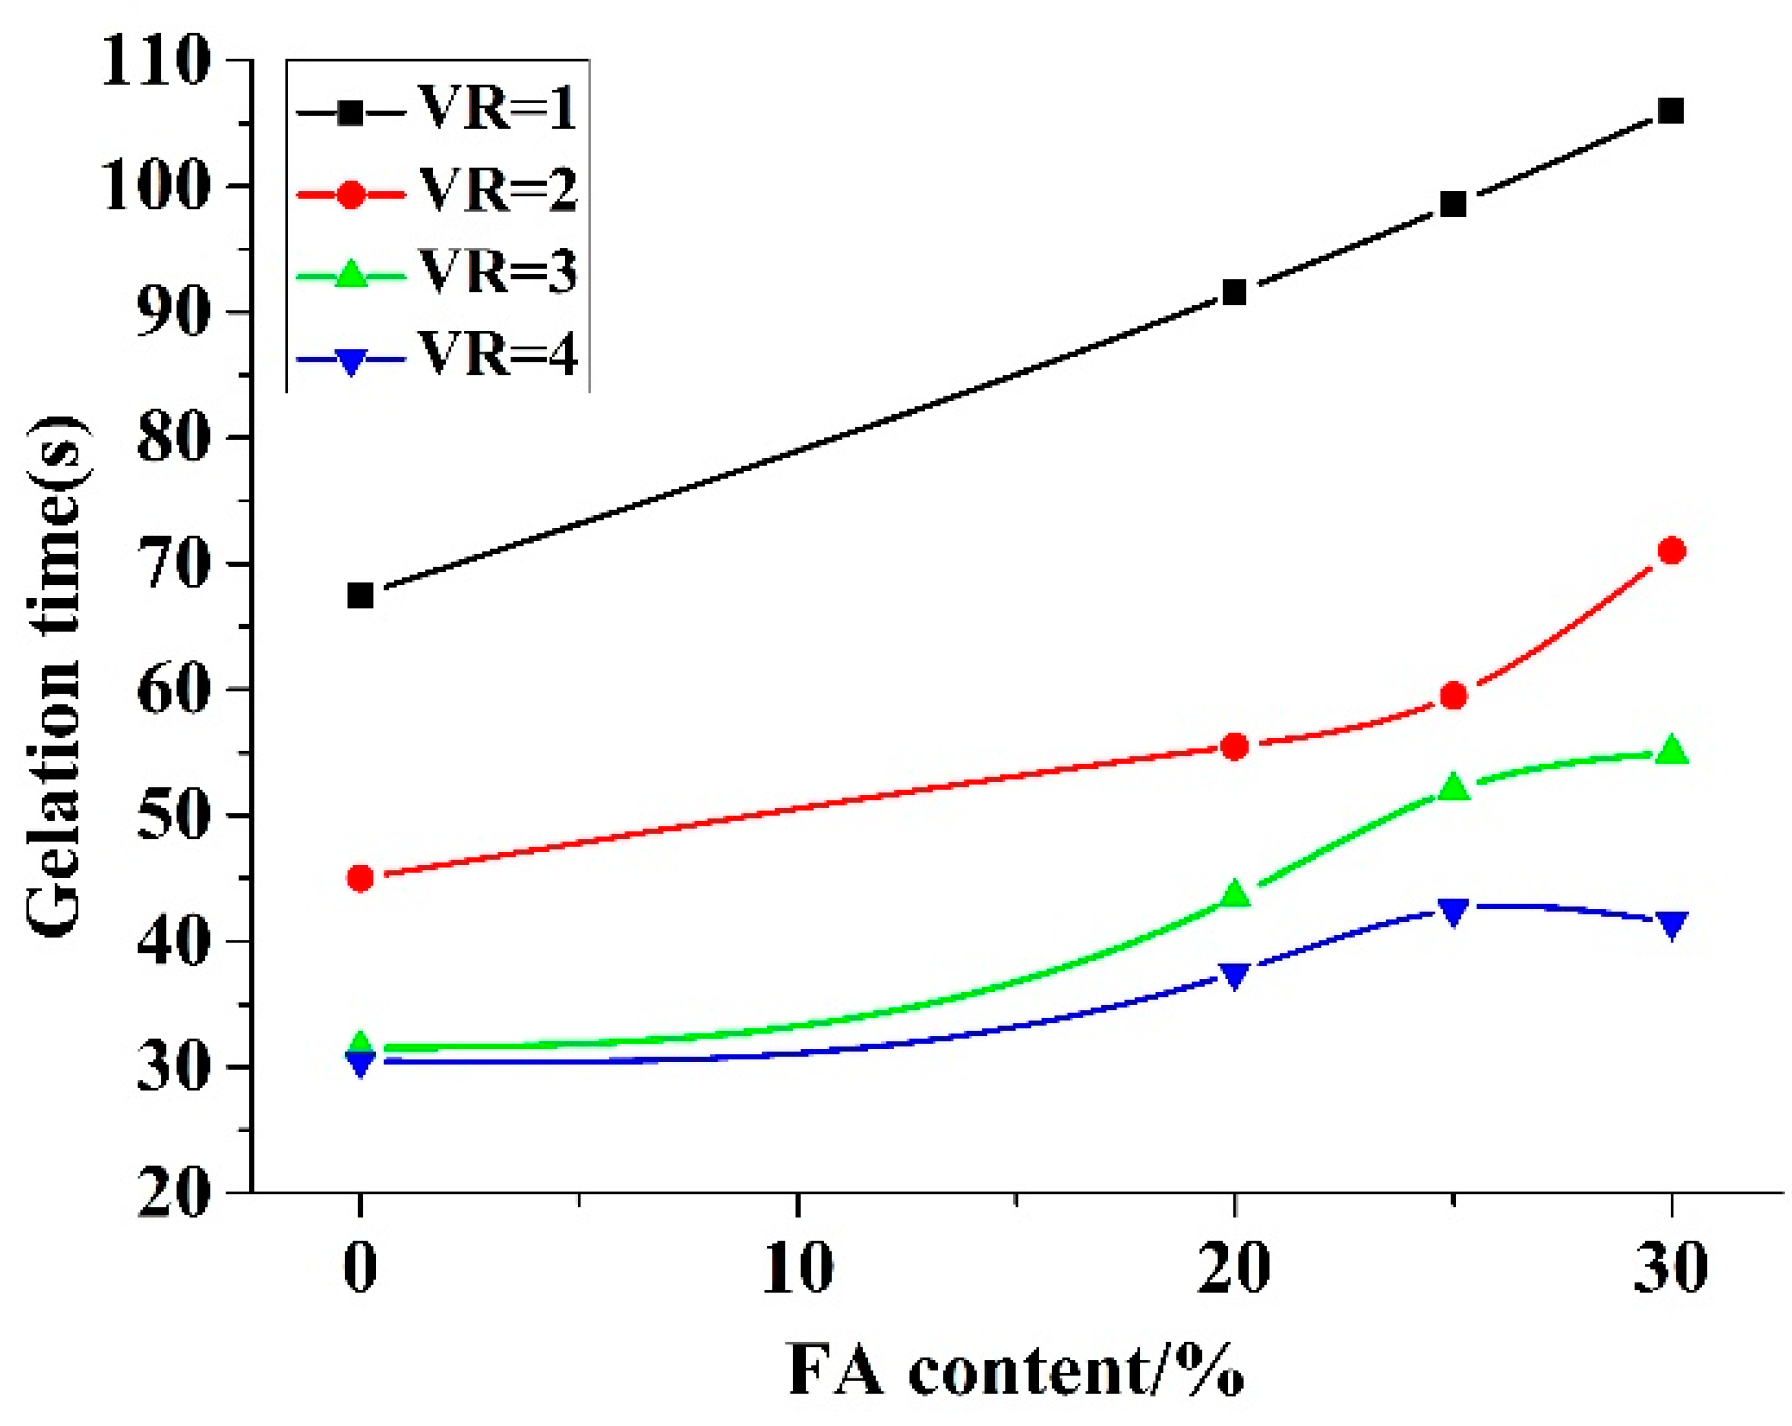
3.1. Gelation Time of the Slurry

The test results in terms of gelation time of the slurry are shown in Figure 7. The gelation time prolongs as fly ash content increases. When partly replacing cement with fly ash and bentonite, the water over cement ratio (W/C), that is a key factor in determining the setting time, decreases. In particular, the backfilled bentonite influences the hydration of cement and prolongs the gelation time. In practice, a slurry with appropriate gelation time is of great significance to avoid small range diffusion or water erosion. Therefore, the gelation time of slurry needs to be adjusted without greatly changing the slurry property by adding specific amount of fly ash.

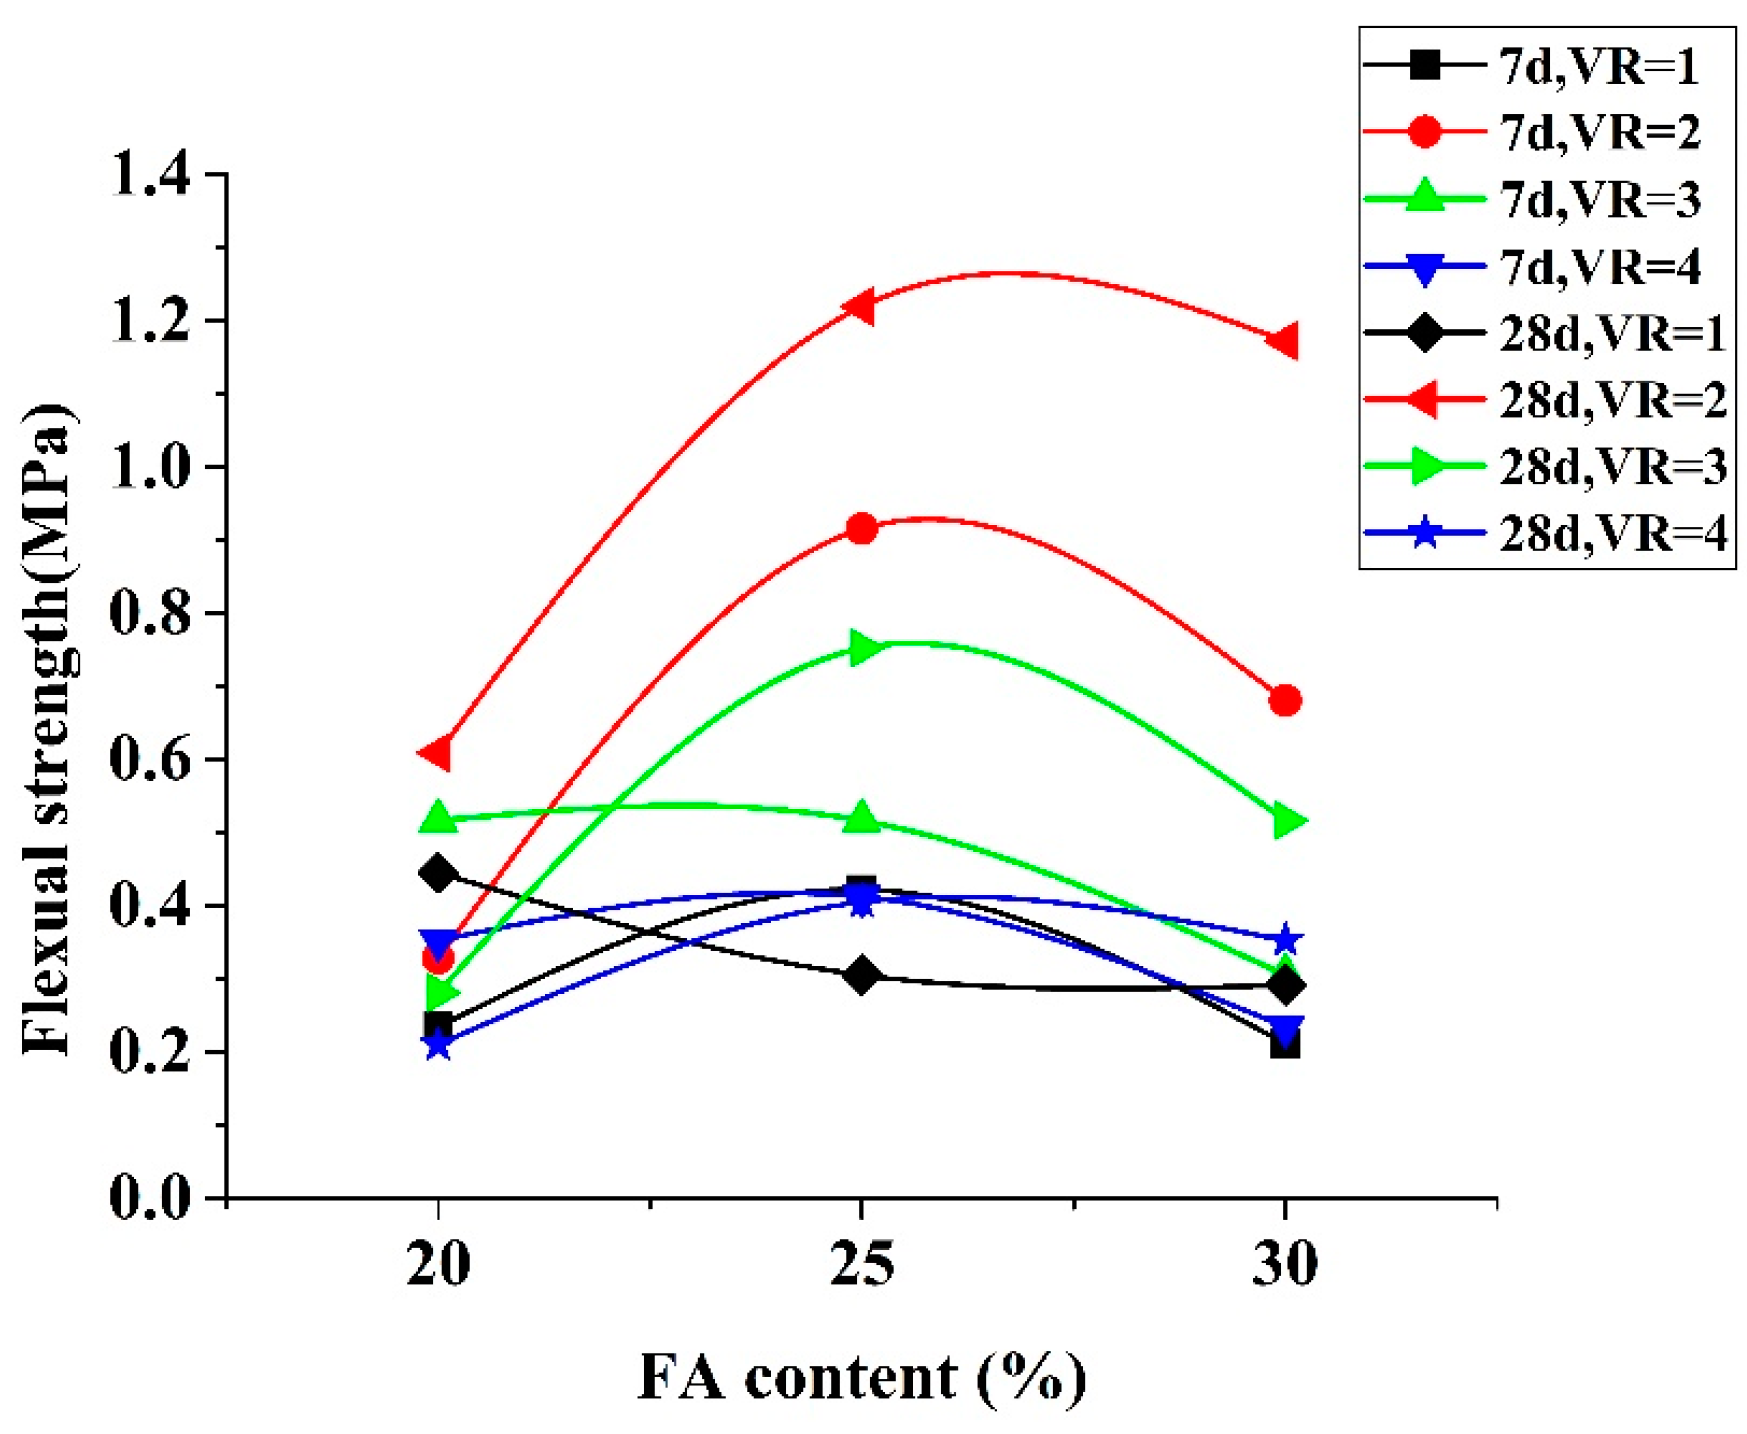
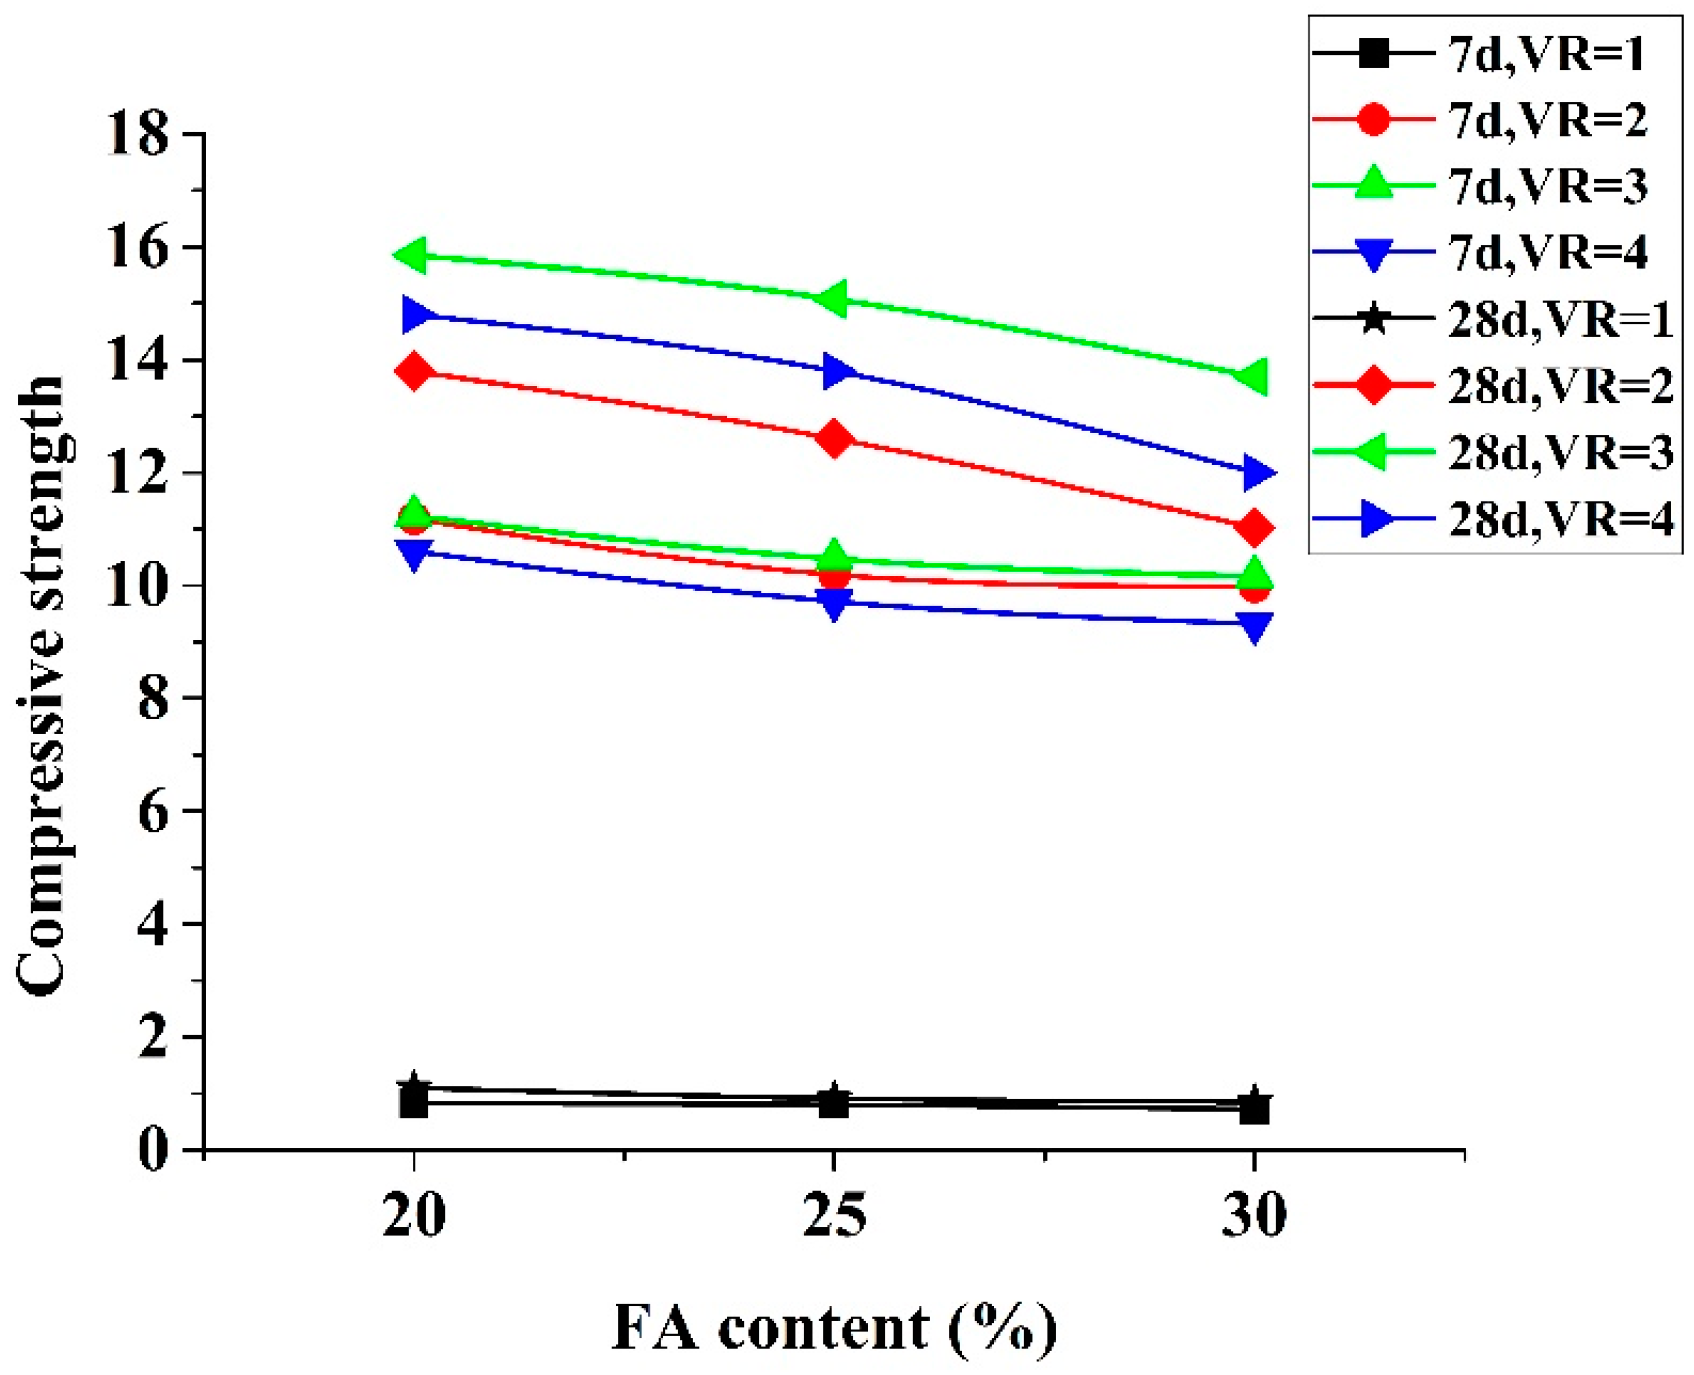
3.2. Strength of the Specimen

The tested flexural strength and compressive strength of the specimens are shown in Figure 8 and Figure 9 respectively. According to Figure 8, except for the case of 28-day maintenance and under the volume ratio of 1, all the other seven tests results show that the flexural strength firstly increases and then decreases as the fly ash content increases. The flexural strength reaches the peak when the fly ash content is in the range of approximately 25%. As to the result of compressive strength, it is noted that the compressive strength decreases as the fly ash content increases from 20 to 30%.
W/C influences concrete strength as a result of the weakening effects from cement hydration when incorporating fly ash and bentonite. While backfilling 20% fly ash, pozzolanic reaction between fly ash and the hydrate of cement (such as calcium hydroxide) can supplement concrete strength. In this case, fly ash is almost reacted and therefore its effect on improving the compactness of grout material is insignificant. When the percentage of fly ash increases to 25%, the hydration of fly ash further completes and the residual fly ash fills the pore in the concrete. However, the residual fly ash is redundant and plays a negative role to the compactness when the content of fly ash reaches to 30%. In seepage control engineering of embankment, the veins generated by fracture grouting tend to be relatively thin, which makes it more susceptible to bending [34]. Therefore, the optimum range of fly ash is in the range of approximately 25% where the flexural strength is relatively large under the test condition.
Regarding the influence of volume ratio, when it is in the range of 2, the hydration action is relatively complete and the strength maximizes. After a threshold value of approximately 2, the volume ratio is so large that the silicate is not sufficient to react with hydration products (like calcium hydroxide), which eventually results in slightly decrease of the mechanical strength of the specimens.

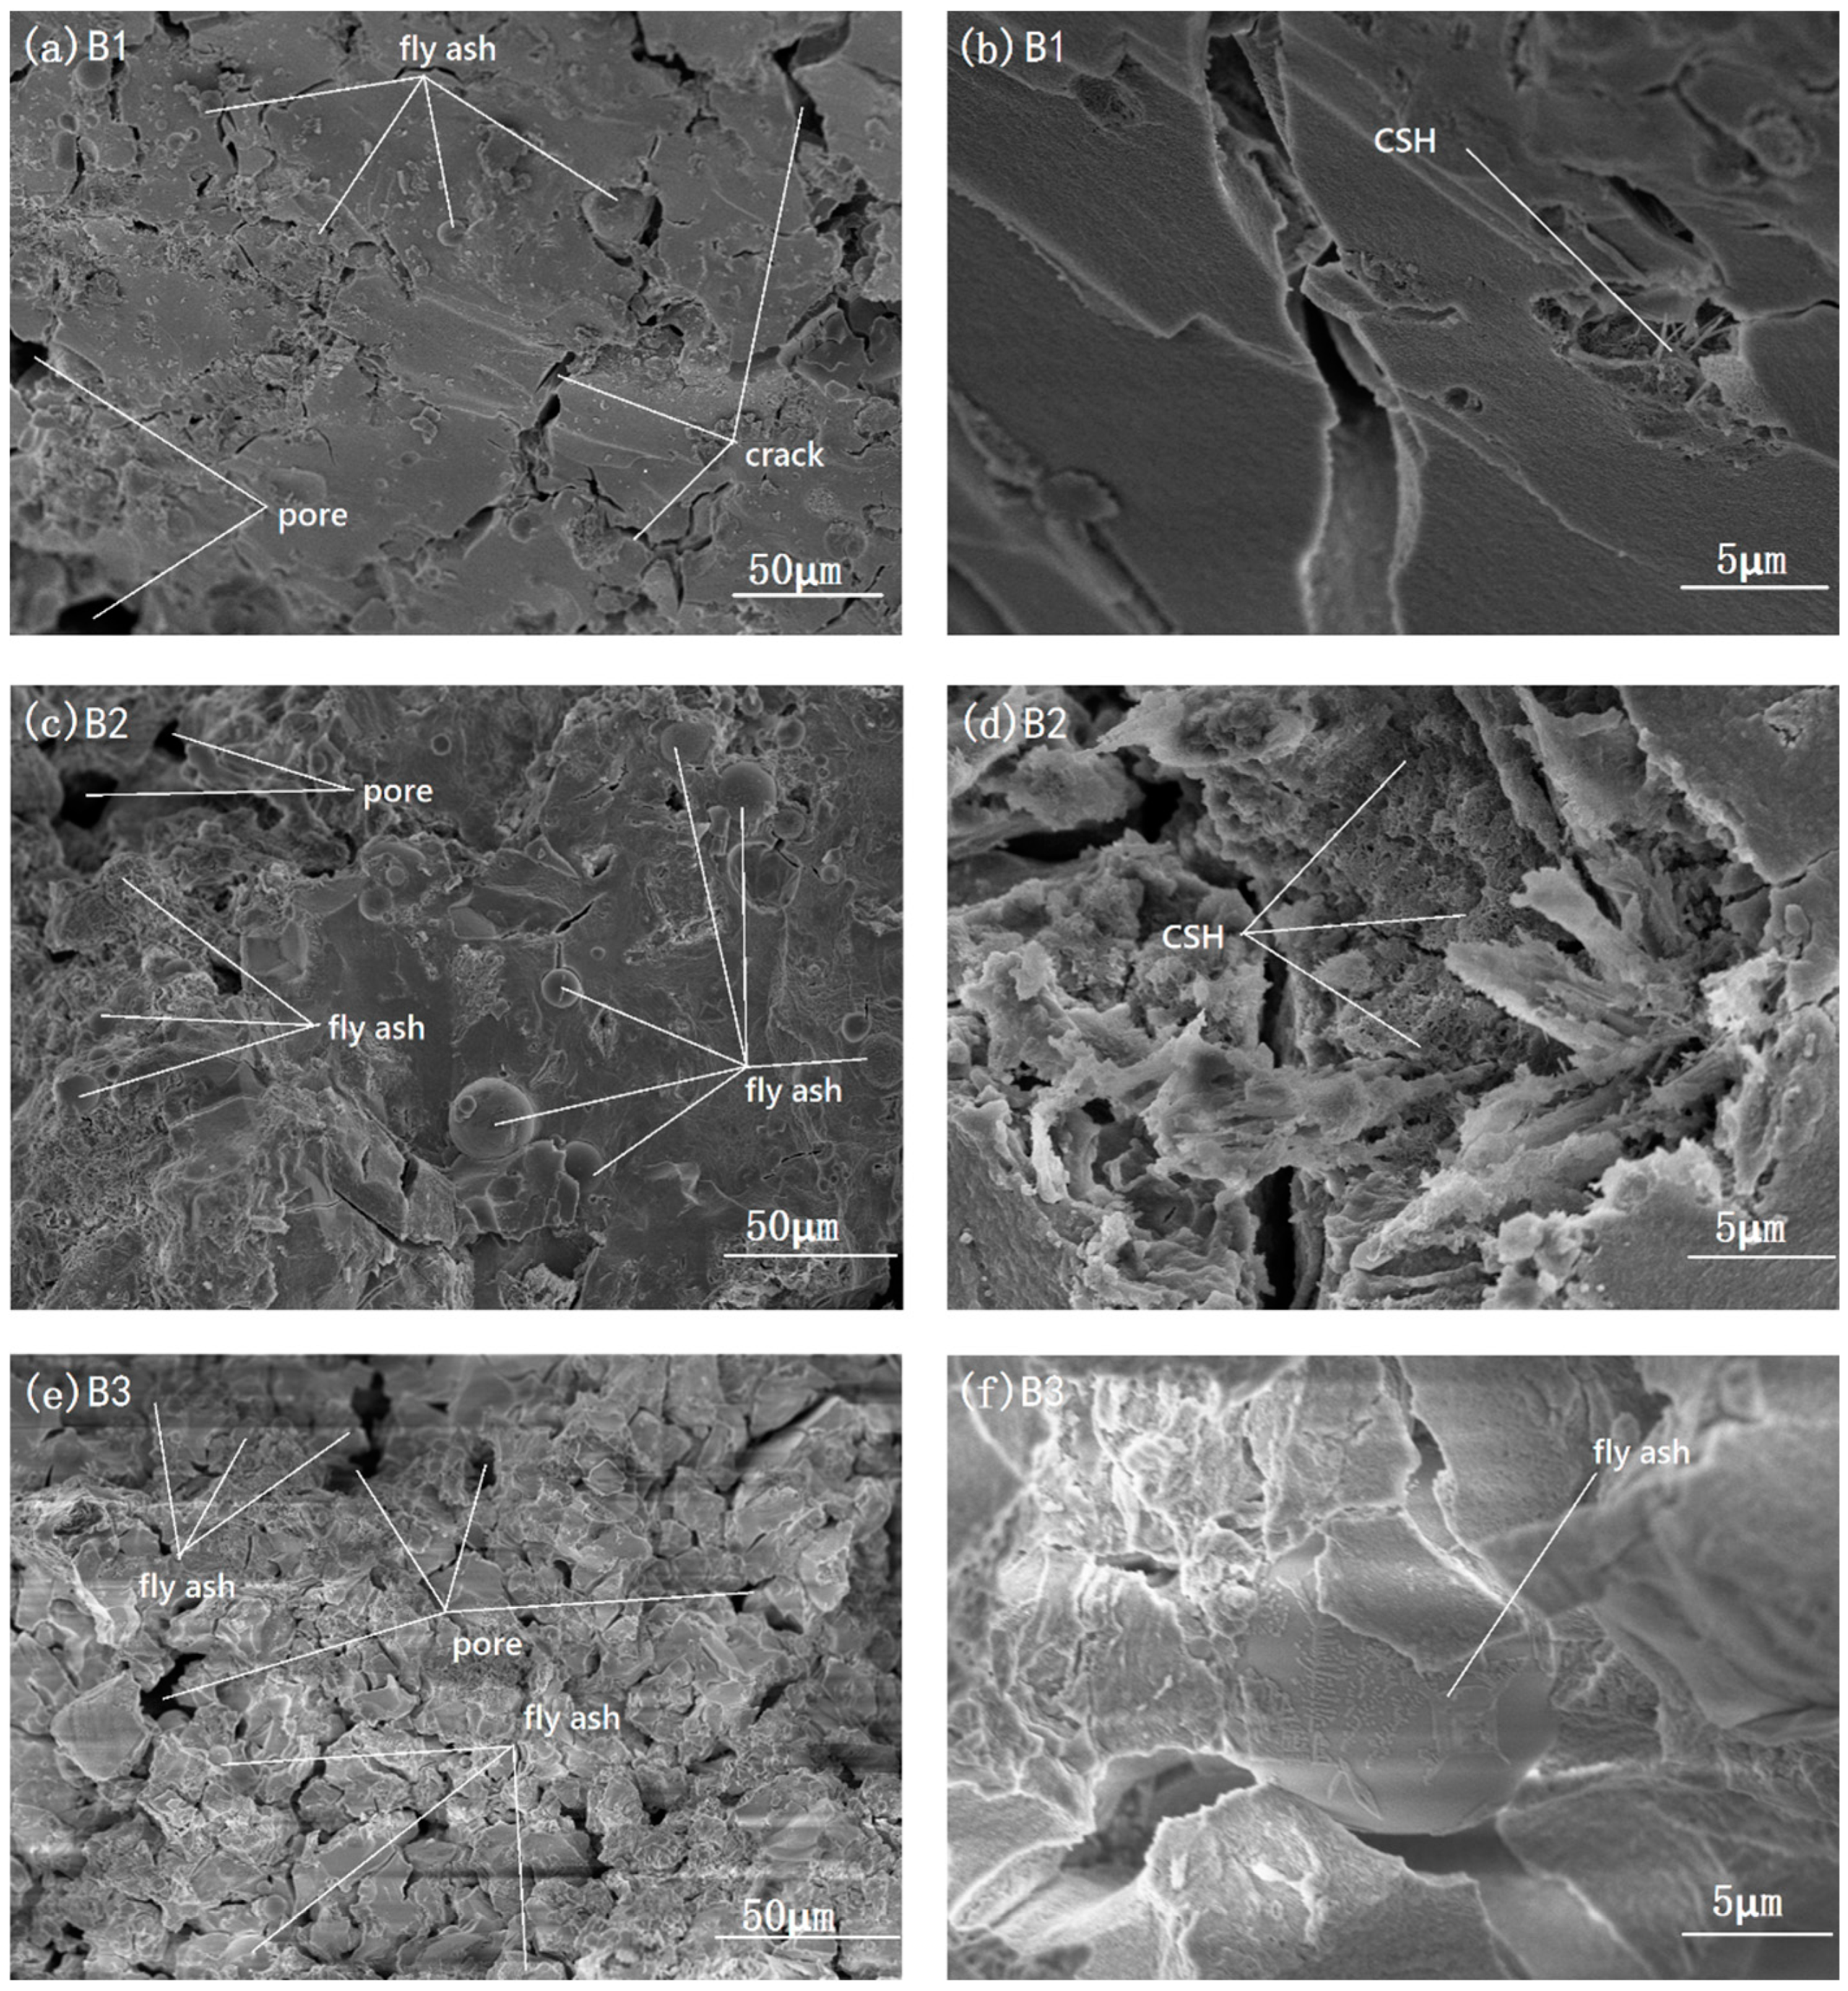
3.3. SEM Analysis of Specimen

According to the test result in 3.2, the specimen B1, B2 and B3 are selected to investigate the influence of fly ash on the microstructure for the volume ratio of 2 using the scanning electron microscope (SEM). The photographs of SEM of the specimens under different fly ash are shown in Figure 10.
According to Figure 10e, it is noted that the pores on the concrete of B3 (30%FA + 5%B + 65%PC, VR = 2) are large and numerous. It is presented in Figure 10f that there is a large amount of fly ash particles in the surface of the microstructure of B3. According to Figure 10c, the compactness of B2 (25%FA + 5%B + 70%PC, VR = 2) significantly increases compared with B3, and the micro-aggregate effect of fly ash is obvious with different sizes of fly ash particles embedded in the hydrates and those fly ash particles fill some void of the concrete. Furthermore, it is shown in Figure 10d that a large amount of calcium silicate hydrates (CSH) form, which increases concrete strength of B2. In Figure 10a, there are more cracks and less fly ash particles on the surface of the concrete of B1 (20%FA + 5%B + 75%PC) compared with B2. The unreacted fly ash is insufficient and therefore the filling effect is not obvious as the microstructure of B2 in Figure 10c.
Considering the results of mechanical strength and SEM, the macroscopic analysis and microscopic analysis show good agreements. In particular, the optimum mixing proportion of the grout is 70% cement, 25% fly ash and 5% bentonite, and the best volume ratio is 2 for the investigated cases. The slurry under this mix proportion is selected for the subsequent in situ grouting experiment.

4. Discussion of In Situ Test Results

Based on the obtained optimum admixture content, in situ grouting tests are carried out in the Jinan section of the Yellow River Embankment to investigate the anti-seepage effect of fracture grouting, where geophysical prospecting and pit prospecting methods are employed. In order to comprehensively discuss the grouting effect, the geophysical prospecting results are divided into two parts: results in the axial direction and vertical direction.

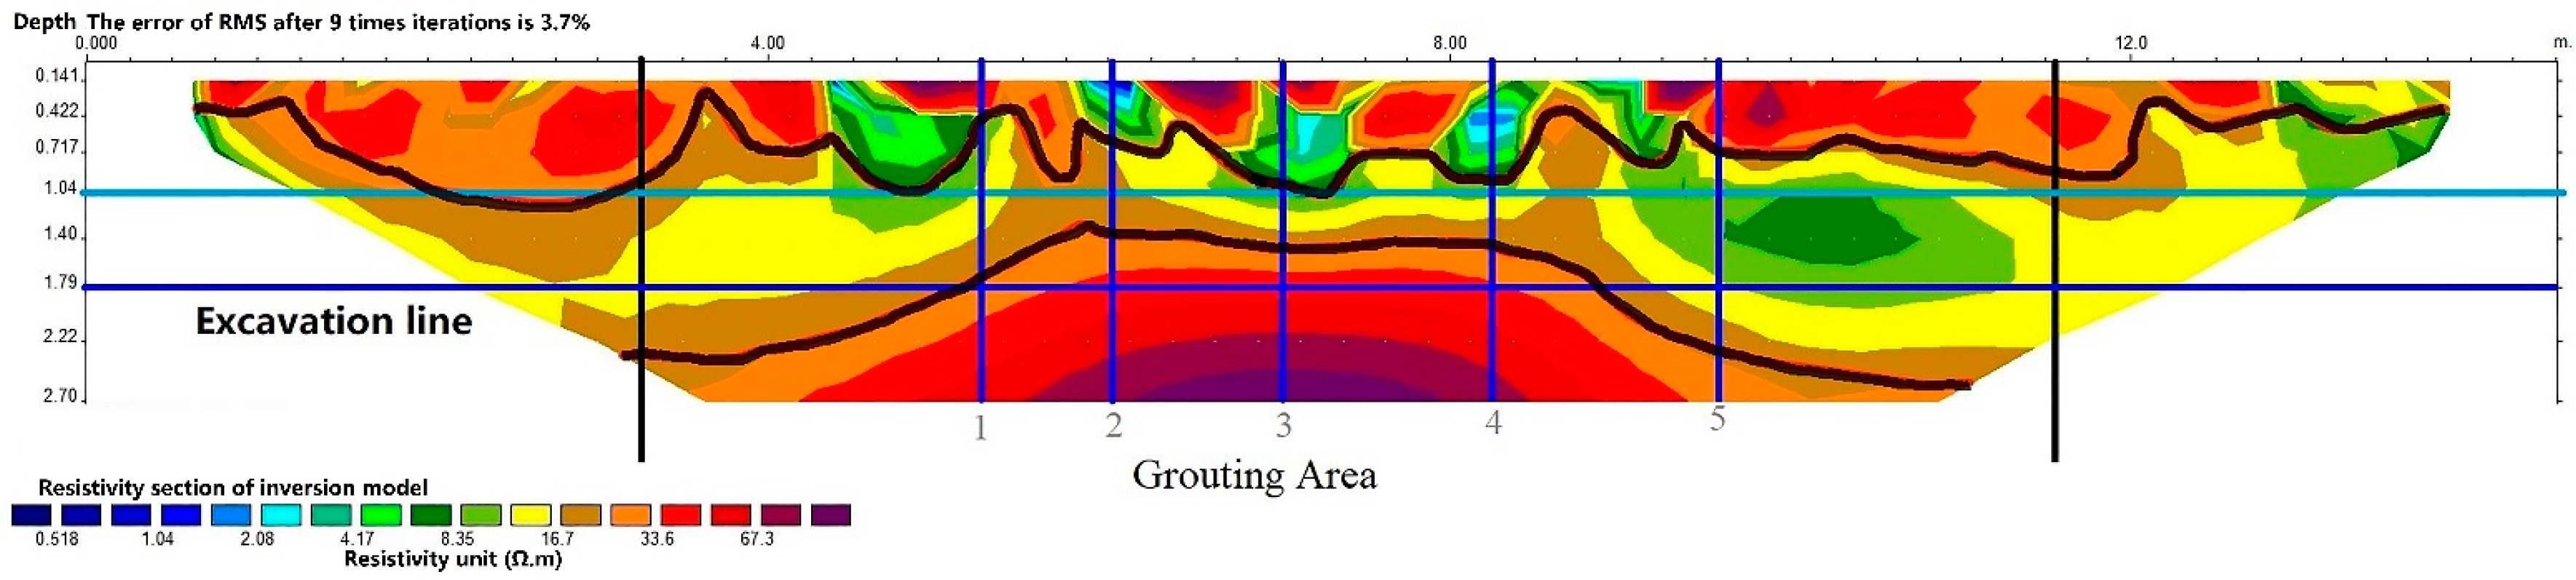
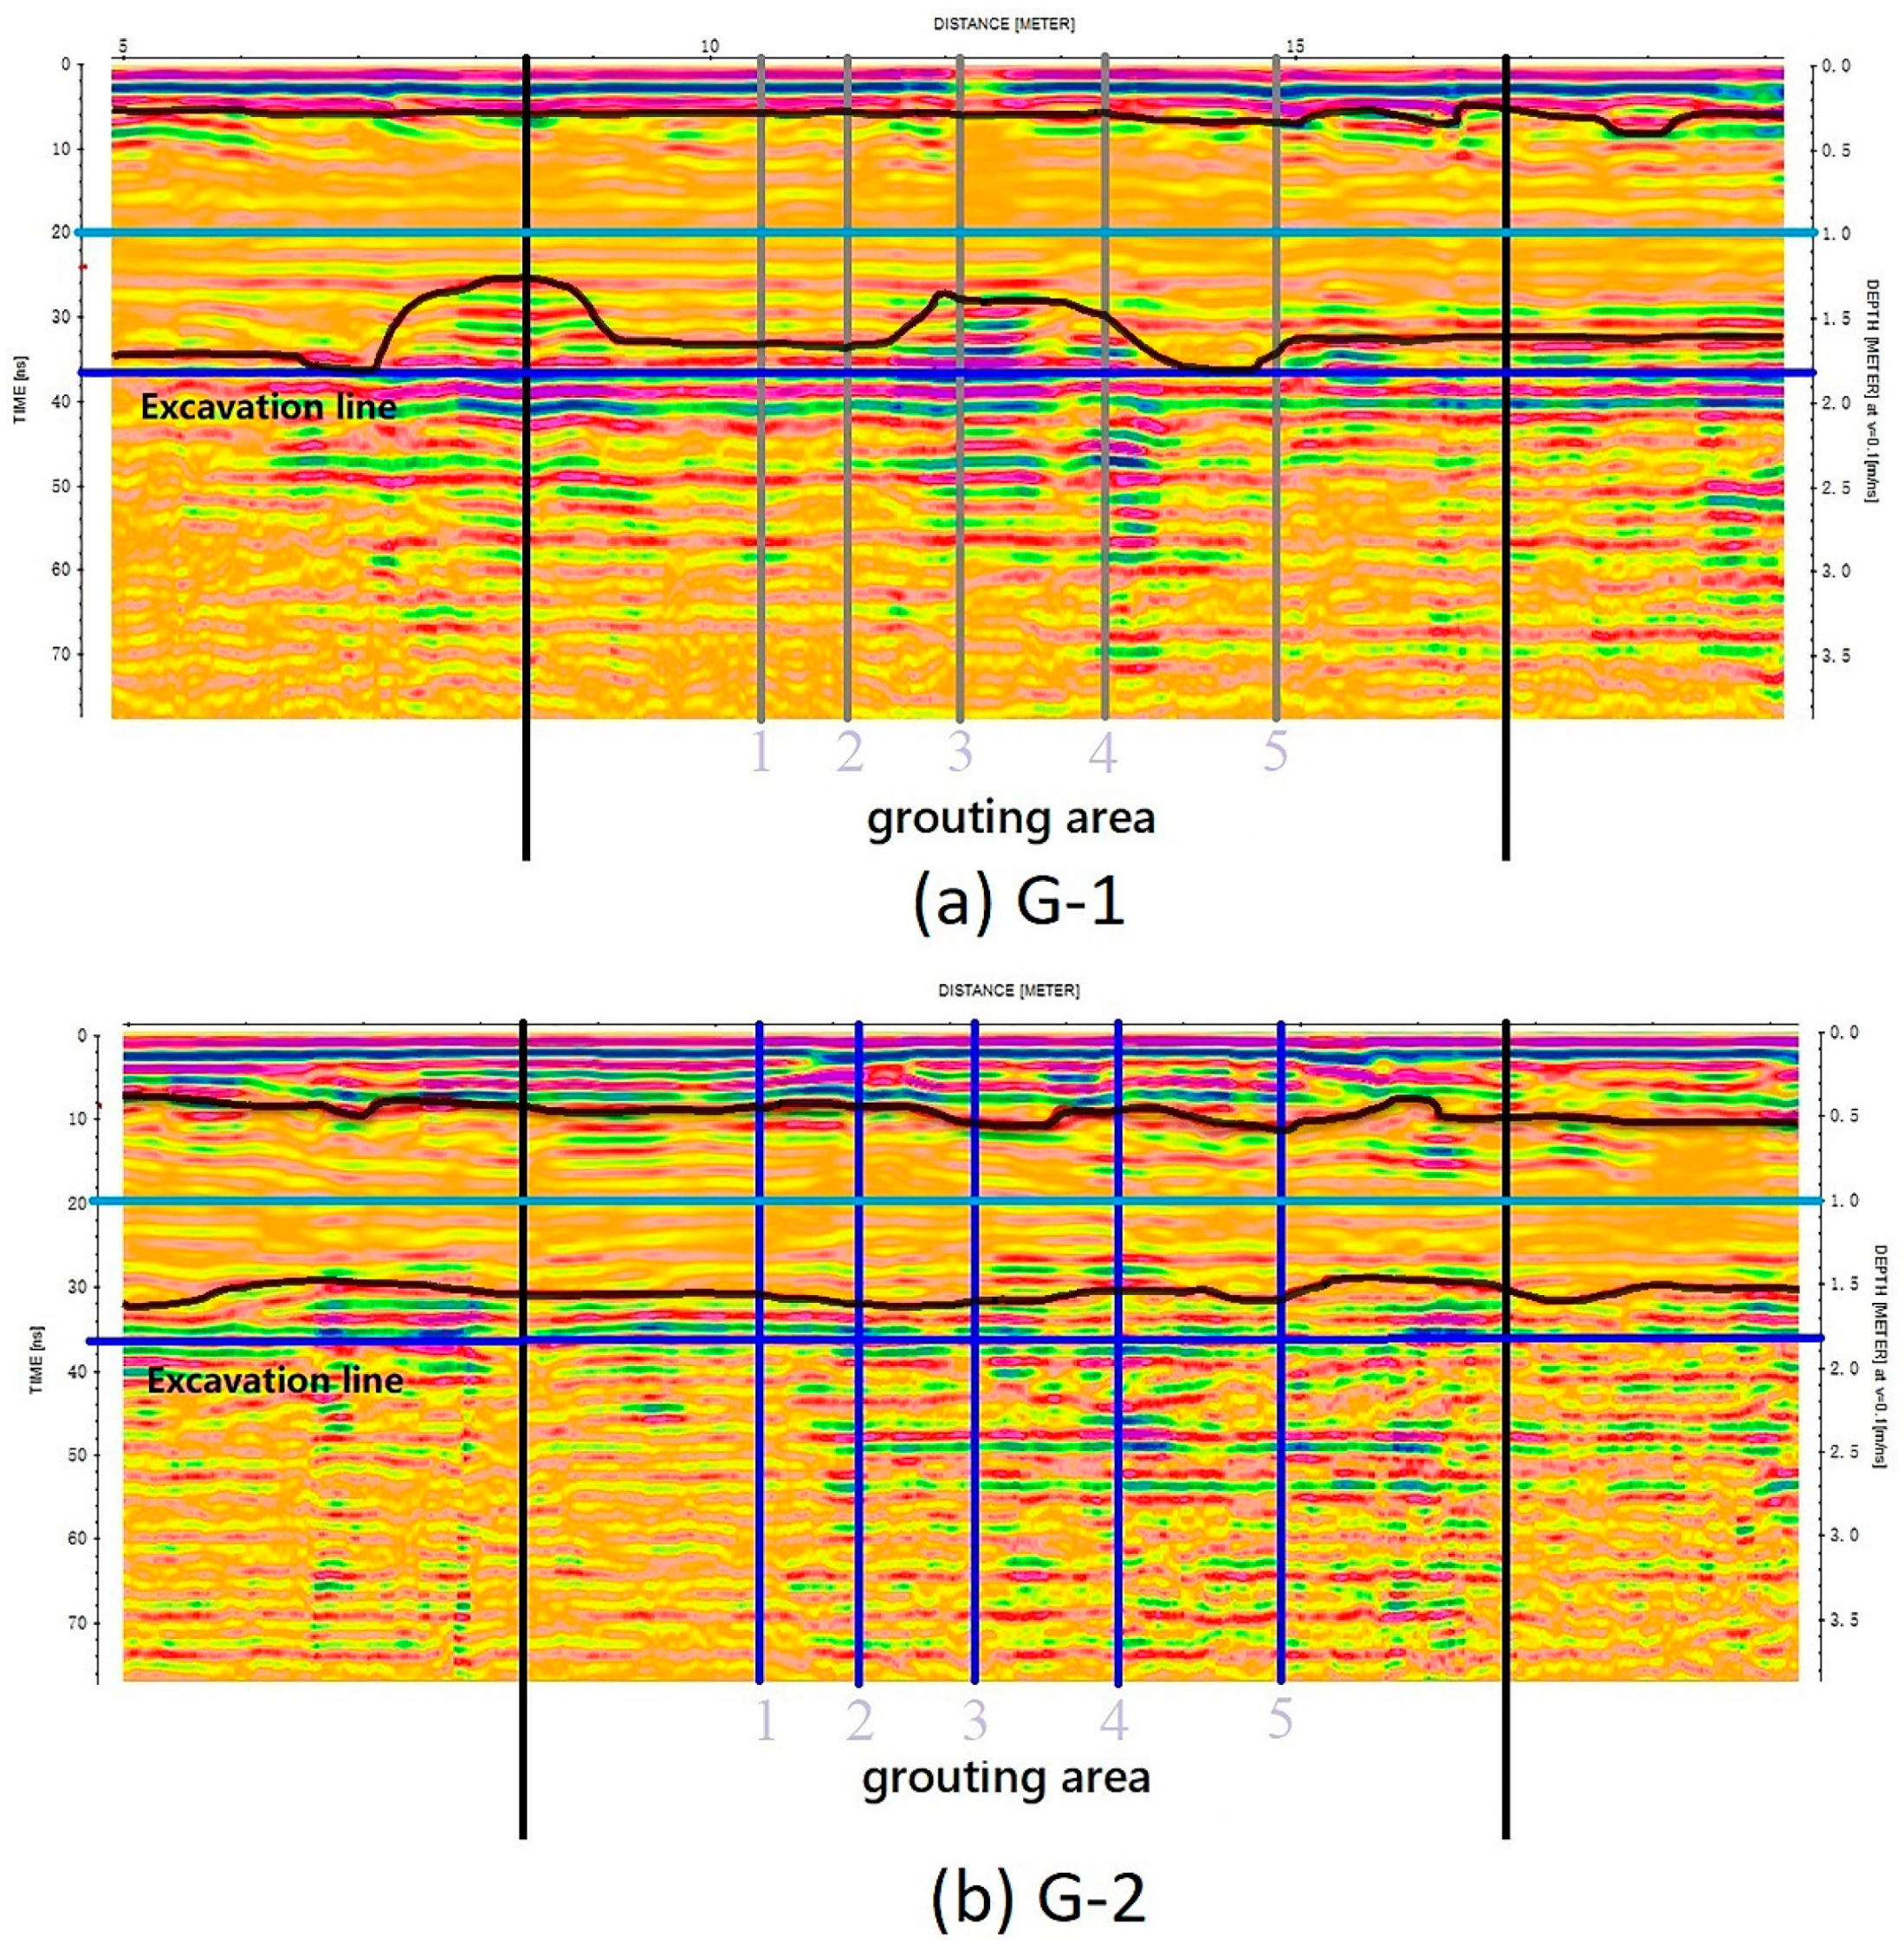
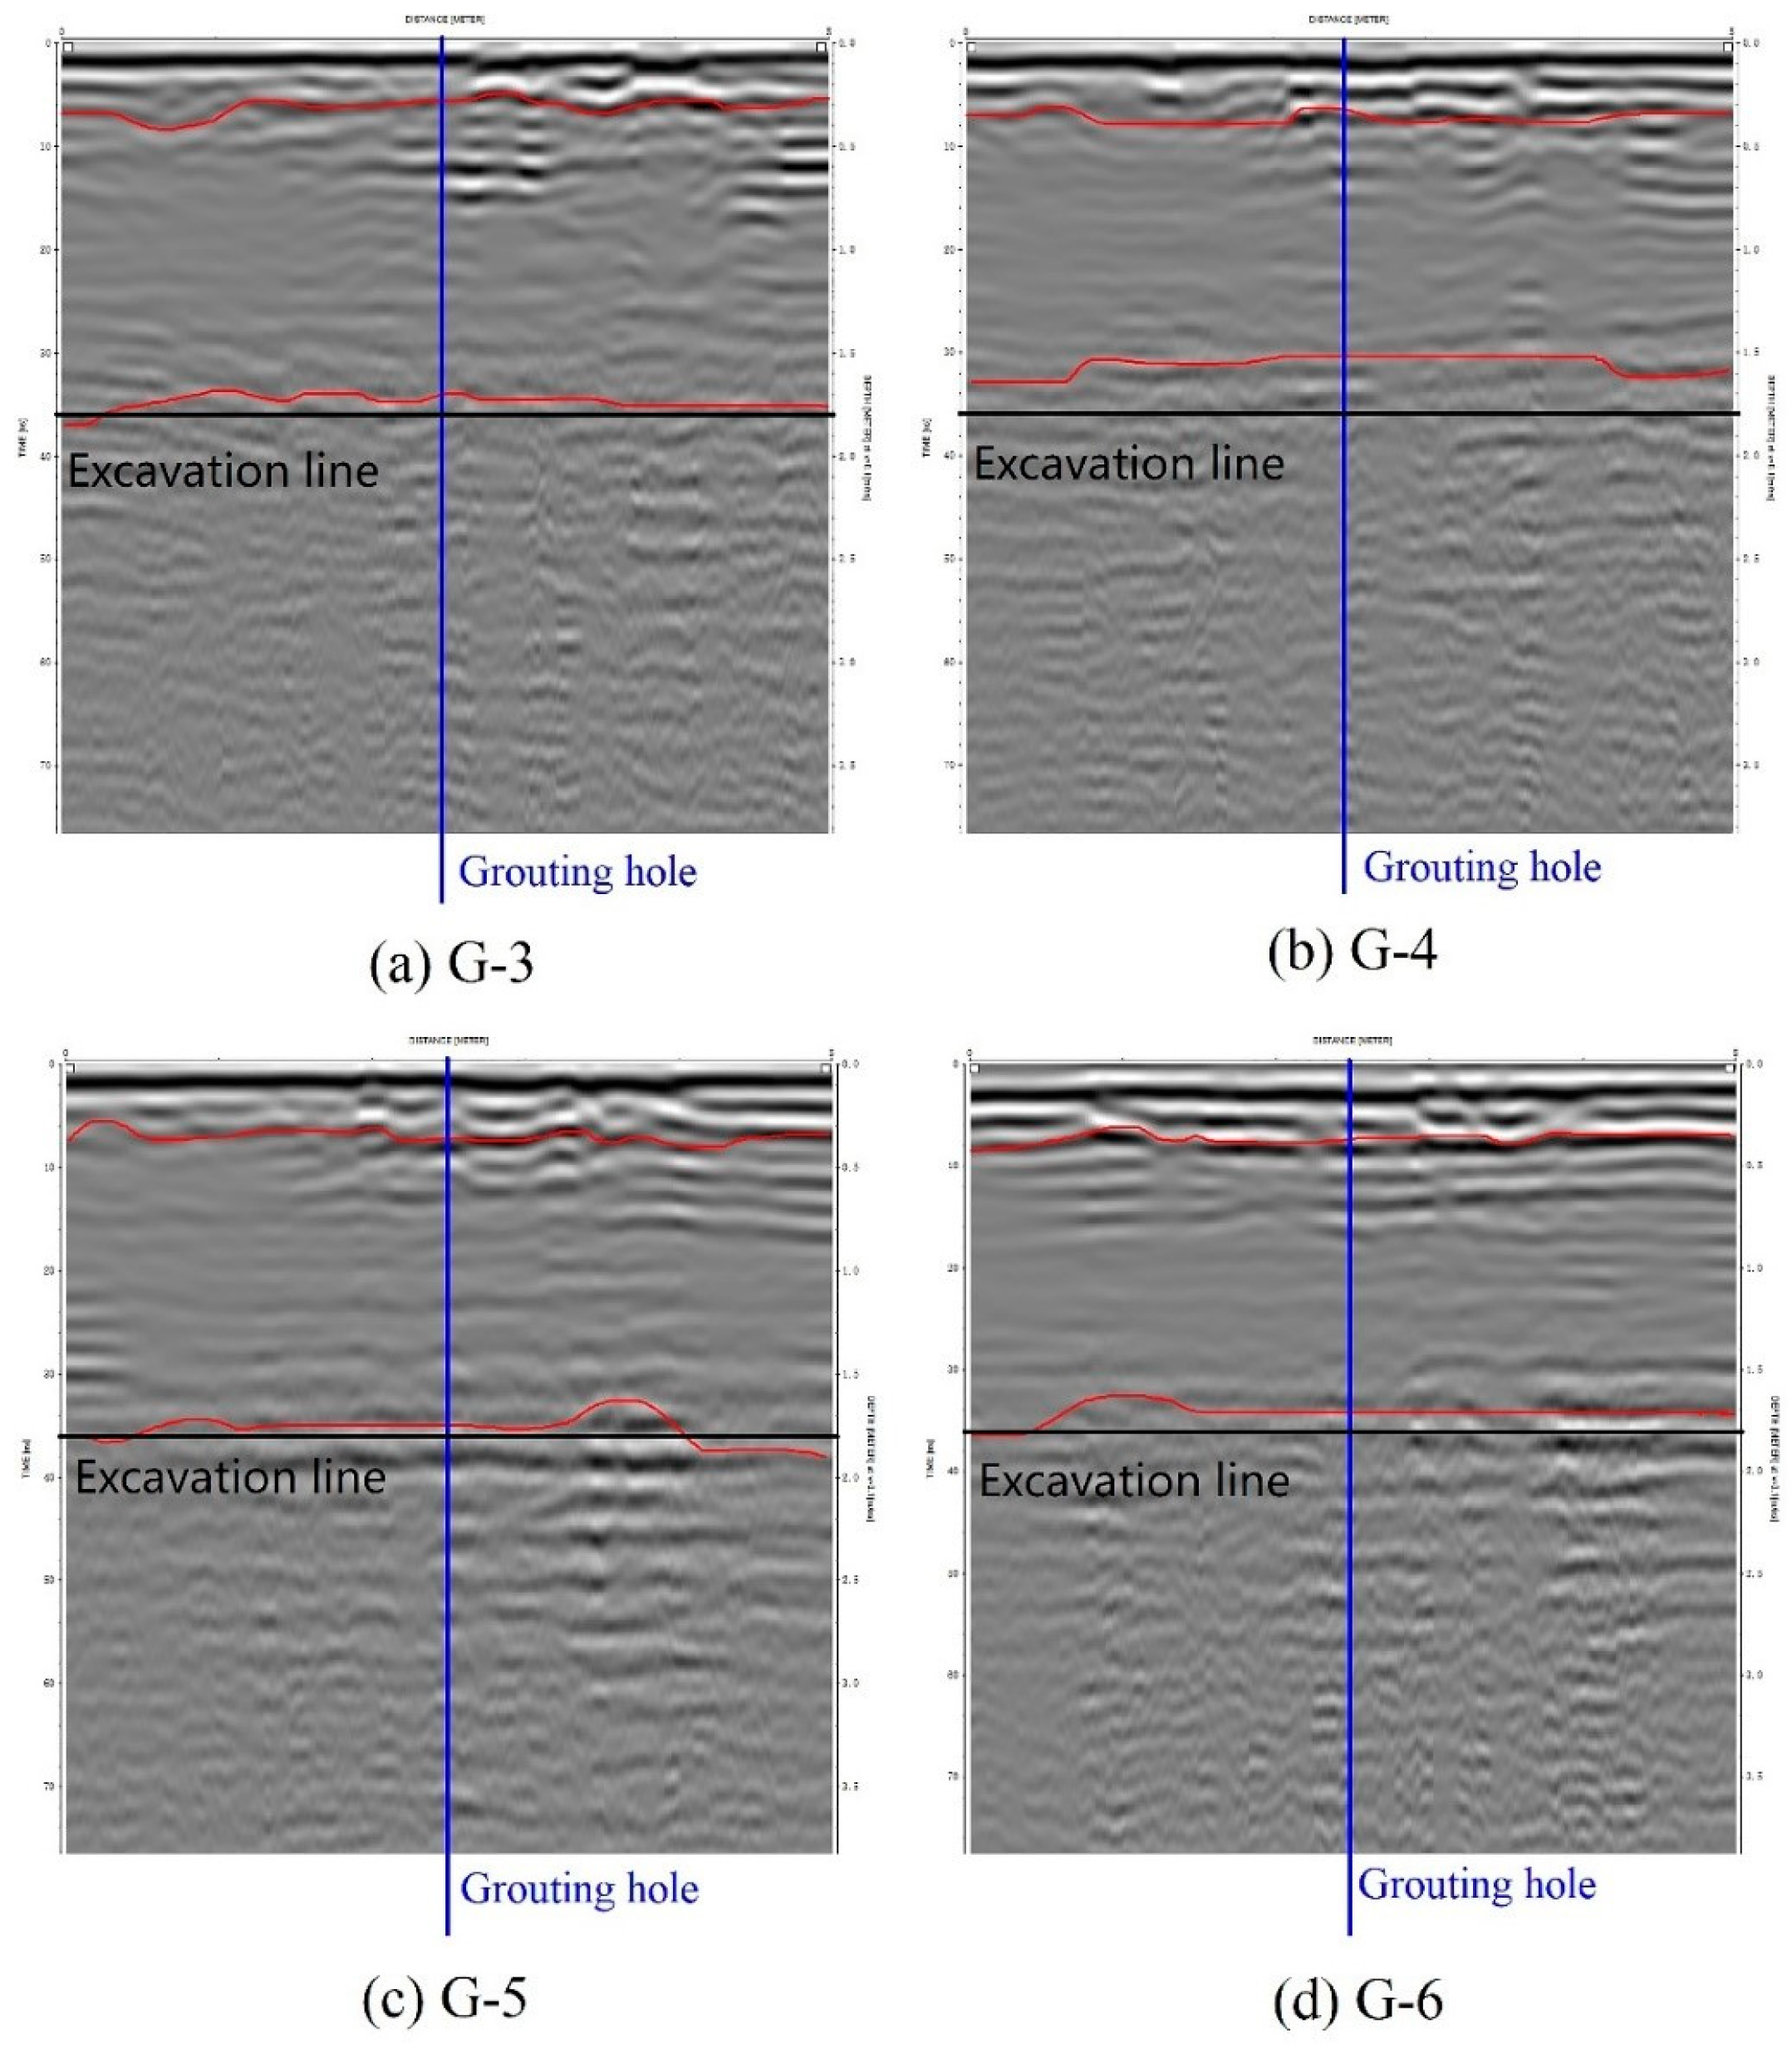
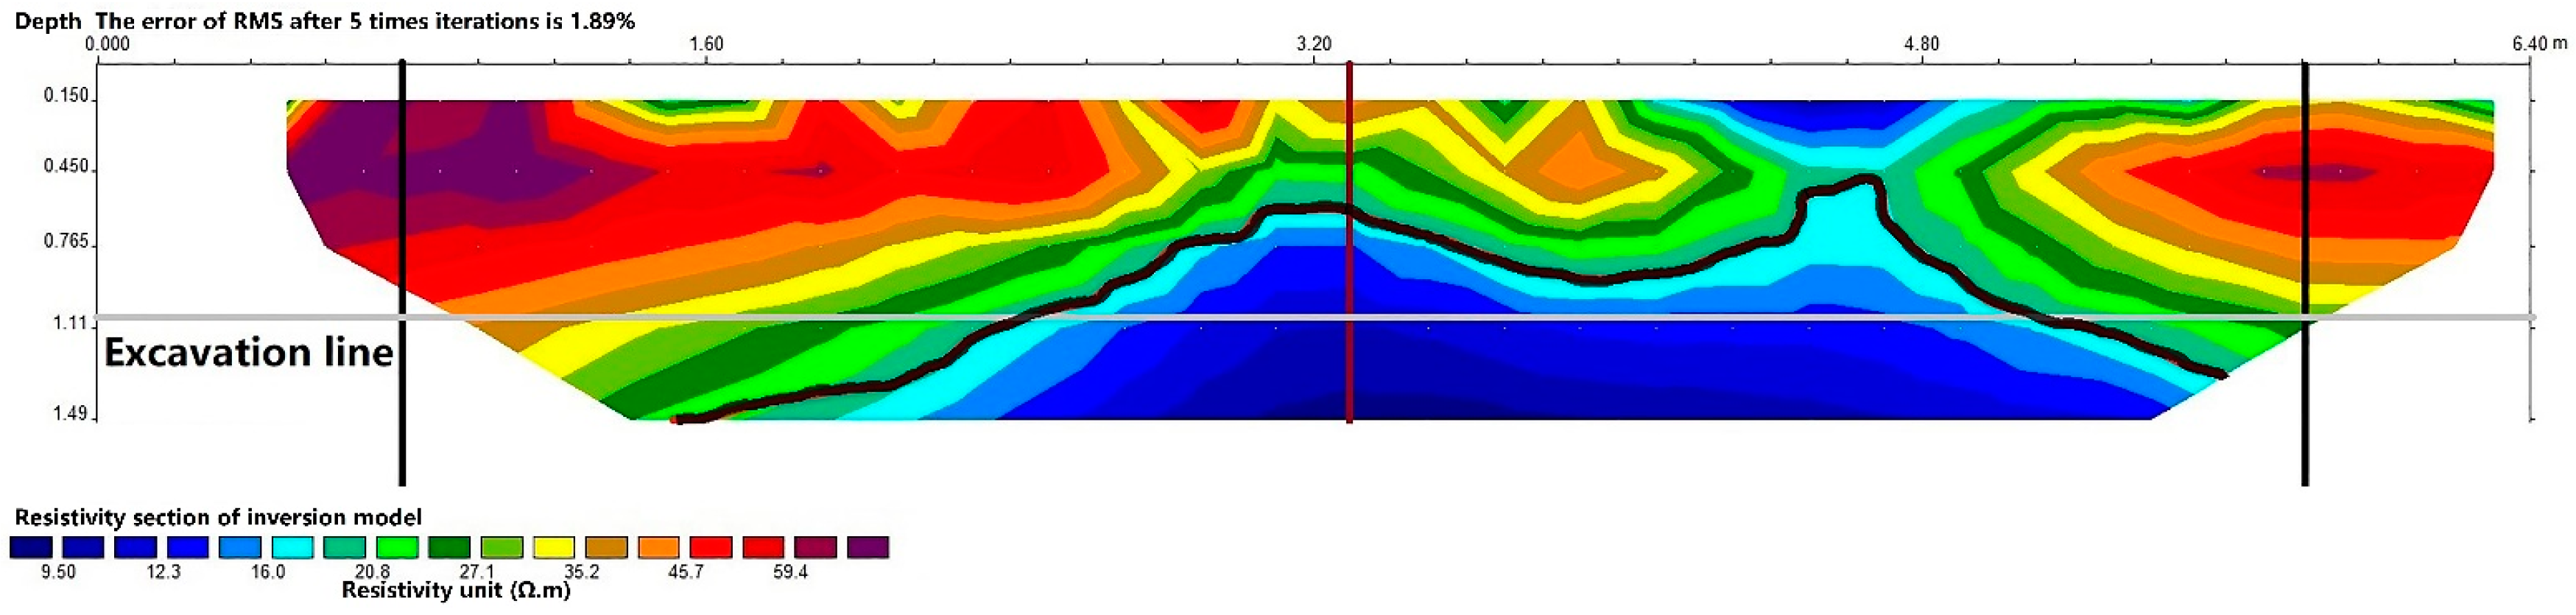
4.1. Geophysical Prospecting for Grouting Effectiveness

4.1.1. Results in Axial Direction

The results from the GPR and HDRM tests in the axial direction are shown in Figure 11 and Figure 12 respectively. According to Figure 11, the soil in the grouting area can be divided into three layers, with the grouting slab and miscellaneous filling in the first layer, the unreinforced Yellow River silt in the second layer and the strengthened silt in the third layer. The results show that there is continuous inhomogeneous medium close to the grouting pipe, which is defined as the grouting vein. It is noted that there is obvious inhomogeneous medium near the pipes, numbered 3 and 4 in the upper of the excavation line.
Based on the prospecting results in Figure 12, the distribution of resistivity includes three main horizontal layers in the grouting area. The first layer is a high-resistance region with an average thickness of 0.5 m, which consists of low water content soil in the upper layer. The second layer is low-resistance area with the depth of 1.5 m, without reinforcement. The third layer is a part with high resistivity compared with the second layer, where the overall water content is relatively low in this layer.
In summary, the grouting area can be divided into three layers and it shows good agreements with the actual grouting process. Regarding the grouting effectiveness, the mainly reinforcement area is the third layer where the water content is relatively low and there are grouting veins in the axial direction.

4.1.2. Vertical Direction

The results from the GPR and HDRM tests in the vertical direction are presented in Figure 13 and Figure 14 respectively. Similarly, the soil can be divided into three layers according to Figure 13. The depths of the first two layers are 0.30 m and 1.65 m respectively. The grouting materials are mainly found in the third layer. However, the grouting effectiveness is not as obviously observed as with the results in the axial direction, indicating that the grout mainly flows along the axial direction. Therefore, the treatment to the perforated pipe to induce the fracture direction is proved to be effective.
It is noted that the HDRM prospected depth in the vertical direction is only 1.91 m. Figure 14 shows that there are two layers in this range. The upper layer is a high-resistance area which is the grouting slab and miscellaneous filling. The lower part is a low-resistance region where there is no significant boundary in this layer in the depth of 1.5 m, which indicates that the water content of the soil keeps unchanged. In other words, the grouting effectiveness is low.

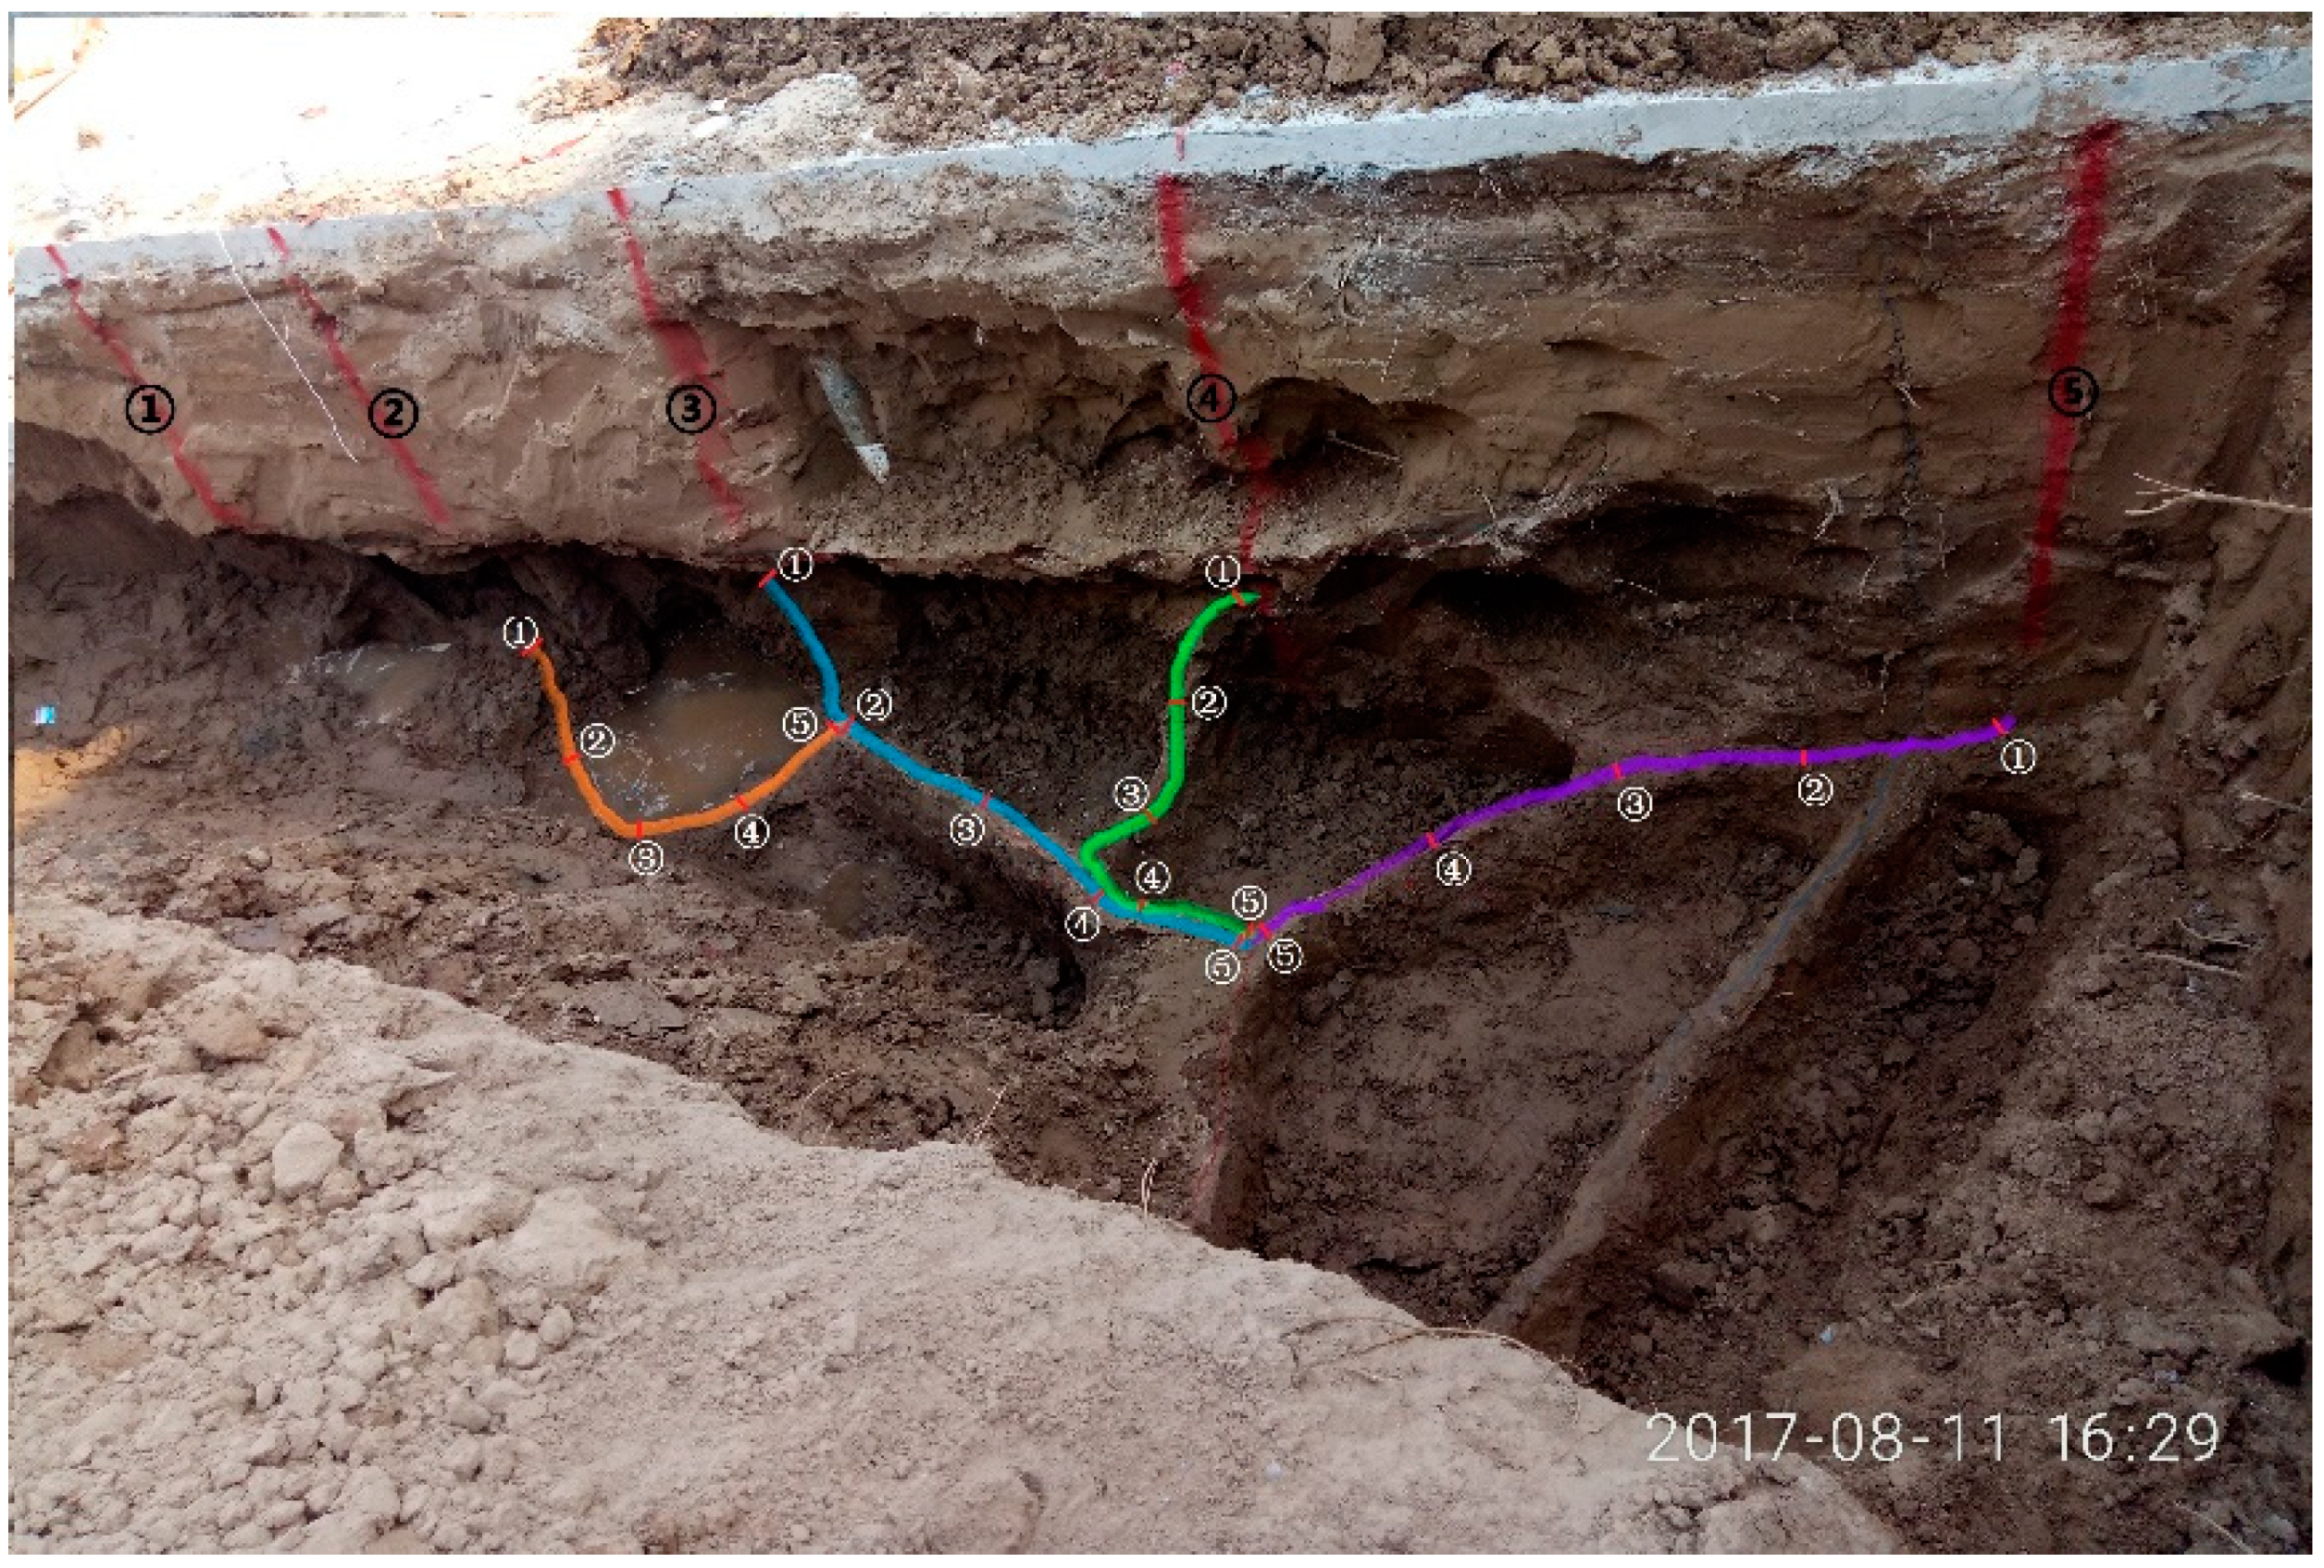
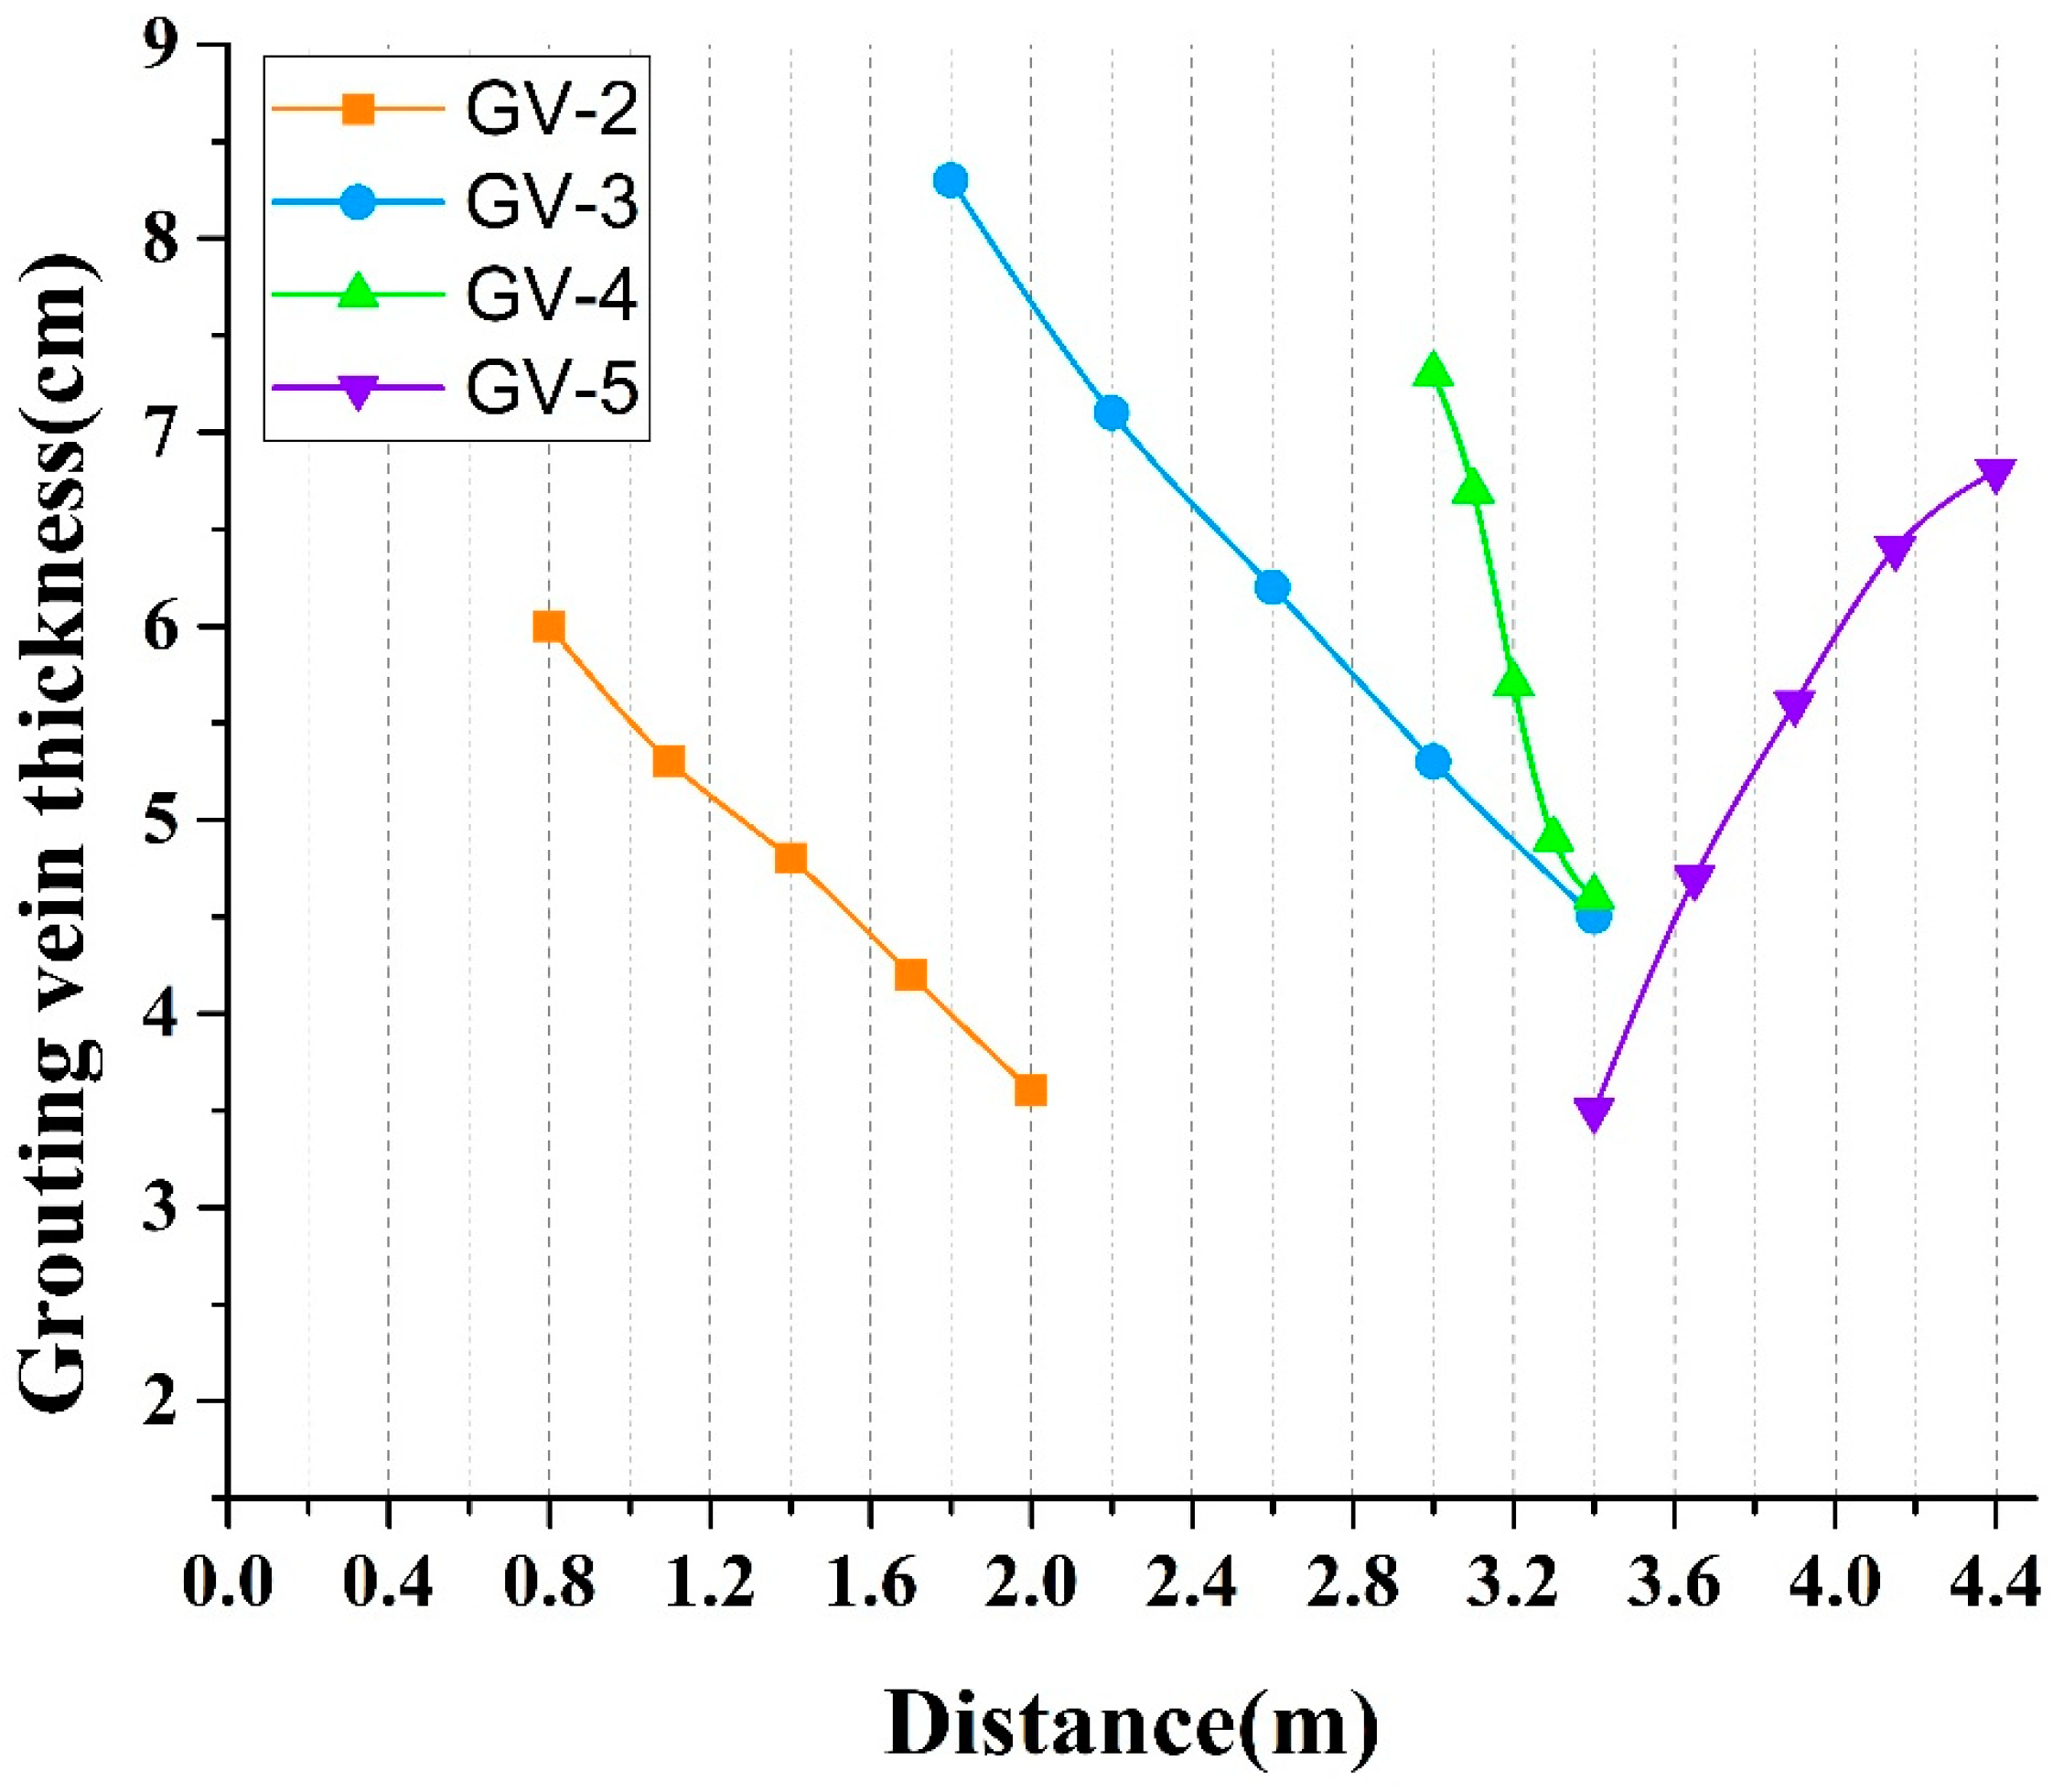
4.2. Pit Prospecting for Grouting Effectiveness

The pit prospecting result is presented in Figure 15. Considering that the groundwater level is 1.27 m and the mechanical strength of Yellow River silt is relatively low, the excavation depth is determined as 1.8 m. In Figure 15, the four color lines represent the grouting veins generated by grouting holes 2, 3, 4, and 5, respectively.
Based on Figure 15, it can be seen that the grouting type in the Yellow River Embankment is fracture grouting. The grouting veins between grouting holes 2 and 3 do not exactly follow the axial direction. The adjacent grouting overlaps at the vertical cross section of the grouting axis. When the interval distance of grouting holes is 1.2 m, the grouting veins induced by holes 3 and 4 laps and the thickness is relatively large, which indicates that the lapping effect is relatively satisfactory. When the grouting veins formed by grouting hole 5 laps with those of 4, it is evident that there is another grouting vein that is almost vertical to the axis. This is unfavorable for the reinforcement effect in generating anti-seepage curtain.
In order to quantitatively investigate the grouting effectiveness, the grouting veins are sampled and the thickness of the veins is measured in the laboratory. The test results are shown in Figure 16. It can be seen that the four grouting veins overlap and form an anti-seepage curtain in the ground, showing satisfactory anti-seepage effects. The thickness of the grouting veins decreases when they are further from the grouting hole. It is noted that the average thickness of the grouting vein induced by grouting holes 3 and 4 is relatively large, due to the appropriate grouting interval distance. After conducting permeability tests for the grouting vein samples from grouting veins 3 and 4, the permeability coefficient is found to be 1.6 × 10⁻⁶ cm/s on average. According to DL/T 5129-2013, the required permeability coefficient for an impervious body should be less than 1.0 × 10⁻⁵ cm/s. The modified cement silicate grouting material used in the in situ tests can meet the anti-seepage criterion in practical engineering.
According to the pit prospecting result, the pit test results show good agreement with the geophysical prospecting in the excavation range. The soil conditions within the excavation depth are well reflected by both the GPR and HDRM results. Therefore, the result of geophysical prospecting is reliable and the grouting effectiveness of the unexcavated part can be evaluated by geophysical prospecting. Moreover, when the interval hole distance is between 1.0 m and 1.2 m, the lap joint is relatively close to the grouting hole and the anti-seepage curtain can be easily controlled. When the interval distance is over 1.2 m, some grouting veins are almost vertical to the reinforcement direction and they are unfavorable to the reinforcement effect in generating anti-seepage curtain. Therefore, the optimum interval hole distance should be in the range of 1.2 m under the test conditions. After conducting a permeability test for the grouting vein samples from grouting veins 3 and 4, the permeability coefficient is found to be 1.6 × 10⁻⁶ cm/s on average, which meets the anti-seepage criterion in practical engineering. In summary, the grouting type in Yellow River silt is mainly fracture grouting. The grouting effectiveness of the field test is satisfactory based on the results of geophysical prospecting and pit prospecting tests.

5. Conclusions

In order to investigate grouting material and the anti-seepage effect of fracture grouting employed in the Yellow River Embankment, laboratory and in situ experiments were carried out to research the reinforcement effect of fracture grouting in the Jinan section of the Yellow River Embankment. In particular, laboratory tests concentrated on studying the optimum strength improvement for cement–silicate grout by varying the content of backfilled fly ash and bentonite as admixtures. Subsequently, in situ grouting tests were carried out in the Jinan section of the Yellow River Embankment to evaluate the anti-seepage effectiveness of fracture grouting, where geophysical prospecting and pit prospecting methods were employed. Based on the experimental results, the following conclusions can be drawn:
(1)
Compared with pure cement–silicate grouts, the gelation time of the improved slurry is longer and gelation time increases as fly ash content increases. The optimum mixing proportion of the compound cement–silicate grout is 70% cement, 25% fly ash, and 5% bentonite, and the best volume ratio is 2 for the investigated cases.
(2)
Good agreement is found between the ground-penetrating radar and high-density resistivity methods and the two geophysical prospecting methods can both reflect the anti-seepage effectiveness of fracture grouting on site.
(3)
The pit prospecting result shows that grouting material mainly flows along the axial direction of the embankment, which means that the treatment used to generate directional fracture is proven to be effective. The injection hole interval distance is suggested to be 1.2 m, where the lapping effect of the grouting veins is relatively significant.
(4)
For the investigated cases, the average thickness of the grouting veins is approximately 6.0 cm and the corresponding permeability coefficient is averagely 1.6 × 10⁻⁶ cm/s, which meets the anti-seepage criterion in practice.

Author Contributions

Conceptualization, Z.W. and J.L.; Methodology, J.L., Q.X. and B.H.; Software, C.L.; Validation, Z.W., J.L. and B.H.; Formal Analysis, Z.W.; Investigation, C.L. and R.L.; Resources, R.L.; Data Curation, M.C.; Writing—Original Draft Preparation, Z.W.; Writing—Review & Editing, B.H. and Q.X.; Visualization, C.L.; M.C.; Supervision, J.L.; Project Administration, J.L.; Funding Acquisition, J.L.; B.H.

Funding

This research was funded by the National Natural Science Foundation of China (Project No. 41172267), the National Science and Technology Support Program of China (Grant No. 2015BAB07B05), and the Natural Science Foundation of Shandong Province (Grant No. ZR2018QEE008).

Acknowledgments

We thank Hongtao Li, Yuying Li and Xuanzheng Li for their critical comments and suggestions.

Conflicts of Interest

The authors declare no conflicts of interest. The funding sponsors had no role in the design of the study; in the collection, analyses or interpretation of the data; in the writing of the manuscript; nor in the decision to publish the results.

References

  1. Liu, H.N.; Wang, J.M.; Wang, S.J.; Liu, H.D.; Hu, B. Seepage analysis of unsaturated soil levee slopes in lower reaches of Yellow River. Rock Soil Mech. 2006, 27, 1835–1840. [Google Scholar] [CrossRef]
  2. Zhao, Y.K.; Liu, H.D.; Li, Q.A. Slope stability analysis of lower reaches’ dikes of Yellow River under flood immersion and water level rapid drawdown. Rock Soil Mech. 2011, 32, 1495–1499. [Google Scholar] [CrossRef]
  3. Zhang, H.M.; Li, Z.B.; Yao, W.Y. Design method of drain system for dike in lower reaches of Yellow River. J. Hydraul. Eng. 2006, 37, 865–869. [Google Scholar] [CrossRef]
  4. Zhang, X.Y. Study on Failure Mechanism and Methodology of Safety Assessment of the Lower Yellow River Dike. Ph.D. Thesis, Hohai University, Nanjing, China, 2005. [Google Scholar]
  5. Bai, Y.N.; Liu, X.K. Grouting of the Earth Dam Body and Embankment; China Water Conservancy Press: Beijing, China, 1982; pp. 1–94. [Google Scholar]
  6. Luo, C.Q. Discussion on the construction technique of spit grouting in body of earth dam. Chin. J. Rock Mech. Eng. 2005, 24, 1605–1611. [Google Scholar] [CrossRef]
  7. Jorne, F.; Henriques, F.M.A. Evaluation of the grout injectability and types of resistance to grout flow. Constr. Build. Mater. 2016, 122, 171–183. [Google Scholar] [CrossRef]
  8. Azadi, M.R.; Taghichian, A.; Taheri, A. Optimization of cement-based grouts using chemical additives. J. Rock Mech. Geotech. Eng. 2017, 9, 623–637. [Google Scholar] [CrossRef]
  9. Pasian, L.; Secco, M.; Piqué, F.; Artioli, G.; Rickerby, S.; Cather, S. Lime-based injection grouts with reduced water content: An assessment of the effects of the water-reducing agents ovalbumin and ethanol on the mineralogical evolution and properties of grouts. J. Cult. Herit. 2018, 30, 70–80. [Google Scholar] [CrossRef]
  10. Liu, R.C.; Li, B.; Jiang, Y.J. Critical hydraulic gradient for nonlinear through rock fracture networks: The roles of aperture, surface roughness, and number of intersections. Adv. Water Resour. 2016, 88, 53–65. [Google Scholar] [CrossRef]
  11. Liu, R.C.; Jiang, Y.J.; Li, B.; Wang, X. A fracture model for characterizing fluid flow in fractured rock masses based on randomly distributed rock fracture networks. Comput. Geotech. 2015, 65, 45–55. [Google Scholar] [CrossRef]
  12. Warner, J.; Jefferies, M.; Garner, S. Compaction Grouting for Sinkhole Repair at WAC Bennett Dam. In Proceedings of the International Conference on Grouting and Ground Treatment, New Orleans, LA, USA, 10–12 February 2003; pp. 869–880. [Google Scholar]
  13. Grotenhuis, R. Fracture Grouting in Theory. Master’s Thesis, Delft University of Technology, Delft, The Netherlands, 2004. [Google Scholar]
  14. Tunçdemir, F.; Ergun, M.U. A Laboratory Study into Fracture Grouting of Fissured Ankara Clay. In Proceedings of the Geo-Frontiers Congress, Austin, TX, USA, 24–26 January 2005; pp. 1–12. [Google Scholar]
  15. Bezuijen, A.; Grotenhuis, R.T.; Tol, A.F.V.; Bosch, J.W.; Haasnoot, J.K. Analytical model for fracture grouting in sand. J. Geotech. Geoenviron. Eng. 2011, 137, 611–620. [Google Scholar] [CrossRef]
  16. Yoneyama, K.; Okuno, T.; Nakaya, A.; Tosaka, H. Experimental and numerical study on fracture grouting by fine particle cement. Chem. Lett. 2012, 1994, 9–12. [Google Scholar]
  17. Yun, J.W.; Park, J.J.; Kwon, Y.S.; Kim, B.K.; Lee, I.M. Cement-based fracture grouting phenomenon of weathered granite soil. KSCE J. Civil Eng. 2016, 21, 232–242. [Google Scholar] [CrossRef]
  18. Wang, Q.; Wang, S.; Sloan, S.W.; Sheng, D.; Pakzad, R. Experimental investigation of pressure grouting in sand. Soils Found. 2016, 56, 161–173. [Google Scholar] [CrossRef]
  19. Sun, F.; Zhang, D.L.; Chen, T.L.; Zhang, X.P. Meso-mechanical simulation of fracture grouting in soil. Chin. J. Geotech. Eng. 2010, 32, 474–480. [Google Scholar]
  20. Liu, Q.; Zheng, X.L.; Liu, H.J.; Wang, J.G.; Dong, S.Y. Experimental studies on liquefaction behavior of silt in the huanghe river delta. World Earthq. Eng. 2007, 23, 161–166. [Google Scholar] [CrossRef]
  21. Xiao, J.; Liu, J.; Peng, L.; Chen, L. Effects of compactness and water yellow-river alluvial silt content on its mechanical behaviors. Rock Soil Mech. 2008, 29, 409–414. [Google Scholar] [CrossRef]
  22. Song, X.G.; Zhang, H.B.; Wang, S.G.; Jia, Z.X.; Guan, Y.H. Hydrophilic characteristics and strength decay of silt roadbed in yellow river alluvial plain. Chin. J. Geotech. Eng. 2010, 32, 1594–1602. [Google Scholar]
  23. Zhu, D.Y.; Guan, Y.H.; Liu, H.Z.; Wang, Q.; Zhang, Q.T. Model tests on fracture grouting reinforcement of silt embankment by using soletanche method. Chin. J. Geotech. Eng. 2012, 34, 1425–1431. [Google Scholar]
  24. Chen, C.L.; Ma, S.X.; Li, L.L.; Cai, Z.P. Study on post-cyclic undrained deformation and strength characteristics of saturated silt in the floodplain of the Yellow river. J. Hydraul. Eng. 2014, 45, 801–808. [Google Scholar] [CrossRef]
  25. Shi, M.S.; Xia, W.Y.; W, F.M.; L, H.; Pan, Y.H. Experimental study on bond performance between polymer anchorage body and silt. Chin. J. Geotech. Eng. 2014, 36, 724–730. [Google Scholar]
  26. ASTM C618-05. Standard Specification for Coal Fly Ash and Raw or Calcined Natural Pozzolan for Use in Concrete; ASTM: West Conshohocken, PA, USA, 2005. [Google Scholar]
  27. Sha, F.; Li, S.; Liu, R.; Li, Z.; Zhang, Q. Experimental study on performance of cement-based grouts admixed with fly ash, bentonite, superplasticizer and water glass. Constr. Build. Mater. 2018, 161, 282–291. [Google Scholar] [CrossRef]
  28. Hwang, H.; Yoon, J.; Rugg, D.; Mohtar, C.S.E. Hydraulic Conductivity of Bentonite Grouted Sand. In Proceedings of the Geo-Frontiers Congress, Dallas, TX, USA, 13–16 March 2011; pp. 1372–1381. [Google Scholar]
  29. Liu, J.; Hu, L.Q.; Xu, B.J.; Yue, X.L.; Qi, B.L.; Zhong, Q. Study on cement-based seepage grouting materials for earth-rock dam. J. Shandong Univ. Eng. Sci. 2016, 47, 9–15. [Google Scholar]
  30. Chinese National Quality and Technical Supervision & Chinese Ministry of Construction. Method of Testing Cements-Determination of Strength; Standards Press of China: Beijing, China, 1999; pp. 1–12. [Google Scholar]
  31. Cui, X. Traffic-induced settlement of subgrade of low liquid limit silt in yellow river delta. China Civ. Eng. J. 2012, 45, 154–162. [Google Scholar]
  32. Collaboration of Rock and Soil Grouting Theory and Engineering Examples. Rock and Soil Grouting Theory and Engineering Examples; Science Press: Beijing, China, 2001; pp. 71–94. [Google Scholar]
  33. National Development and Reform Commission of the People’s Republic of China. Technical Specification of Grouting for Earth Dam; China Water & Power Press: Beijing, China, 2010; pp. 1–18. [Google Scholar]
  34. Shi, M.S.; Yu, D.M.; Wang, F.M. Bending Properties of a polymer grout. J. Mater. Sci. Eng. 2010, 28, 514–517. [Google Scholar]
Figure 1. Particle size distribution curve.
Processes 06 00075 g001
Figure 2. Layout of field test.
Processes 06 00075 g002
Figure 3. Flow chart of perforated pipe grouting and production of perforated pipe.
Processes 06 00075 g003
Figure 4. Ground-penetrating radar.
Processes 06 00075 g004
Figure 5. High-density resistivity method.
Processes 06 00075 g005
Figure 6. The layout of GPR and HDRM.
Processes 06 00075 g006
Figure 7. Test result of gelation time of the slurry (VR: the volume ratio).
Processes 06 00075 g007
Figure 8. Test result of flexural strength of the specimen (VR: the volume ratio).
Processes 06 00075 g008
Figure 9. Test result of compressive strength of the specimen (VR: the volume ratio).
Processes 06 00075 g009
Figure 10. Photographs of SEM of the specimens under different fly ash content.
Processes 06 00075 g010
Figure 11. Photographs of GPR in the axial direction.
Processes 06 00075 g011
Figure 12. Photographs of HDRM in the axial direction.
Processes 06 00075 g012
Figure 13. Photographs of GPR in the vertical direction.
Processes 06 00075 g013
Figure 14. Photographs of HDRM in the vertical direction.
Processes 06 00075 g014
Figure 15. Pit prospecting result.
Processes 06 00075 g015
Figure 16. Measured value of the grouting veins. GV: Grouting vein.
Processes 06 00075 g016
Table 1. Main chemical composition of PC and FA.
MaterialCaO (%)SiO2 (%)Al2O3 (%)Fe2O3 (%)
PC62.6022.614.352.46
FA3.7554.6428.096.20
Table 2. Main characteristics and properties of bentonite and silicate.
Water AbsorptionSwell VolumeColloid ValenceParticle Size (75 μm)Water Content
420% (2 h)49 mL/g630 mL/15 g95%9%
Table 3. Proportion of mixture of experimental grout. VR: Volume ratio; FA: Fly ash; PC: Portland cement; B: Bentonite.
NumberVRFA/%PC/%B/%
A11:120755
A21:125705
A31:130655
B12:120755
B22:125705
B32:130655
C13:120755
C23:125705
C33:130655
D14:120755
D24:125705
D34:130655

