Article

Study on the Preparation and Hydration Properties of a New Cementitious Material for Tailings Discharge

College of Resources & Safety Engineering, China University of Mining & Technology (Beijing), D11 Xueyuan Road, Haidian District, Beijing 100083, China
*
Author to whom correspondence should be addressed.
Processes 2019, 7(1), 47; https://doi.org/10.3390/pr7010047
Submission received: 27 November 2018 / Revised: 6 January 2019 / Accepted: 14 January 2019 / Published: 17 January 2019
(This article belongs to the Special Issue Fluid Flow in Fractured Porous Media)

Abstract

:
Blast furnace slag (BFS) is often used as a cement-based raw material for underground filling and surface cemented paste discharge of tailings during mining processes. This paper studied a new cement-based material (NCM) with BFS to replace ordinary Portland cement (OPC). A uniaxial compressive strength (UCS) experiment was used to test the mechanical strength of samples; X-ray diffraction and thermal gravity experiments were used to test the crystalline phases and amount of hydration products by samples; a scanning electron microscope experiment was used to observe the influence of the hydration products morphology by samples; mercury intrusion porosimetry experiment was used to analyze the pore size distribution of samples. The samples with NCM had an optimum UCS; the crystalline phases of the hydration products were similar in OPC and NCM. However, the amount of product formed in OPC was less than that in NCM at the same curing time; more ettringite and calcium silicate hydrate were produced in samples with NCM, which filled the pores and enhanced the UCS of the samples. The final mercury intrusion volume of the samples with NCM were lower than the samples with OPC at the same curing time, which showed that samples with NCM had lower porosities. For the samples with NCM and OPC cured from 7 days to 28 days, the mercury intrusion volume was reduced by 18% and 13%, and the most common pore size of the samples reduced by 53% and 29%, respectively. This showed after 21 days curing time, the pores of all the samples getting smaller; however, the samples with NCM were more compact. The main ingredients of the NCM were clinker, lime, gypsum and BFS, and its ratio was 14:6:10:70. The content of additives to NCM was 0.4%, and the ratio of sodium sulfate: alum: sodium fluorosilicate was 2:1:1.

1. Introduction

After the ore has been recovered from underground, tailings are usually treated in two ways [1]. One method is filling the tailings in the underground goafs. This treatment can reduce the accumulation of tailings on the ground, and ensure the safety of underground operations. This method has been widely promoted in underground mining operations [2]. The filling method can remove about 50% of the tailings, and the remaining part is usually discharged in the tailings pond [3,4,5]. However, this method is prone to dam breaks, environmental pollution, and cause casualties [6,7]. For example, on 8 September 2008, a major tailings dam broke in Xinta mining Co., Ltd., of Lixian county, Linfen city, Shanxi province, causing 281 deaths [8]. According to a study by the Clarke University’s pollution assessment team, the damage caused by tailings pond accidents ranked 18th among 93 types of accidents and hazards worldwide [9]. In view of the disadvantage of tailings pond, some scholars combined both methods and proposed the technology of cemented paste discharge of tailings (CPDT) [10,11]. The method involved adding some cement to the tailings and discharging them to valleys or subsidence areas; the tailings need to be transported by pipes or belts. This method guarantees the stability of the tailings for the cemented piles. In addition, mines no longer need to build tailings pond and can also achieve safe pile-up. Because the cemented tailings pile can be built up to a high height, the limited footprint can pile up more tailings than tailings ponds. Presently, this technology has been applied and developed in some metal mines [11].
During the cemented paste backfill, the amount of cement was 2% to 7% of the total weight of the tailing slurry, and it may be up to 10% to remain independent across pillar extraction process [12]. Cement costs account for more than 60–80% of the filling costs, as discussed by Li et al. [13]. The idea of CPDT was derived from cemented paste backfill, thus, the process of CPDT was similar to this, and the cost of cement also occupied a large proportion of CPDT costs. Therefore, the search for cheap, cementitious industrial by-products to replace cement and reduce the cost of CPDT is of great significance. Blast furnace slag (BFS) is one of the by-products released from blast furnace [14,15]. At present, China produces 0.3 billion tons of BFS every year [16], which causes a great waste of resources. The major chemical compositions consist of CaO, SiO2 and Al2O3. Moreover, it has a small amount of MgO, FeO and sulfide. The higher proportions of CaO, Al2O3 and MgO, the better activity of the BFS [17]. It was an alternative material to replace ordinary Portland cement (OPC), which could improve some properties and bring economic and environmental benefits [18]. Previous works have already studied the hydration activity of BFS and its excitation mechanisms such as alkali activation and mechanical activation [19,20,21]. He et al. [22] investigated the effect of BFS (both dry-separation and wet-milling) on the properties of cement slurry indicated that as the increase of dry-separation BFS, the initial and final setting time gradually decreased, while the wet-grinding BFS system showed the opposite trend. Yin et al. [23] investigated the environmental perspectives of recycling various combustion ashes in cement production and indicated that there was a range (5–10% by weight) of ashes for mixed cement production, beyond which may cause significant changes in cement composition. Cihangir et al. [24] studied the use of BFS in paste backfill by using scanning electron microscope (SEM) and X-ray diffraction (XRD) analysis, and drew the conclusion that the BFS has great potential for use as an alternative binder in cement paste backfill.
However, there is limited research on the performance of tailings under the condition of adding some additives when BFS, clinker, lime and gypsum were mixed according to a certain proportion. Therefore, the main purpose of this paper was to study the results of a new cement material’s effect on the strength and pore volume development for tailings. Clinker plus lime and gypsum were used as stimulants, and a small amount of sodium sulfate, alum and sodium fluorosilicate were used as additives to make a new type of tailings cementitious material (NCM). The effect of different amounts of compound activator on the uniaxial compressive strength (UCS) of CPDT samples with NCM was explored. Thermal gravity (TG) and differential thermal gravimetric (DTG) were carried out to assess the amount of hydration products of different cementitious materials on microstructural development [25]. The SEM was used to analyze the composition and microcosmic morphology of the hydration products of the samples with OPC and NCM at the same curing time [26]. Finally, the microscope pore structures of the samples were studied through the mercury intrusion porosimetry (MIP) experiment [27].

2. Materials and Methods

2.1. Materials

The materials consisted of water, OPC 42.5# (Jilong Cement Co., Ltd., Tangshan, China), BFS (Tangshan Iron and Steel Group Co., Ltd., Tangshan, China), lime (Yuanfeng Calcium Industry Co., Ltd., Xinxiang, China), gypsum (Longsheng Hengtong Gypsum Co., Ltd., Xingtai, China), clinker (Longfeng Cement Co., Ltd., Tangshan, China), sodium sulfate (Sinopharm Chemical Reagent Co., Ltd., Beijing, China), alums (Sinopharm Chemical Reagent Co., Ltd., Beijing, China), sodium fluosilicate (Sinopharm Chemical Reagent Co., Ltd., Beijing, China) and tailings (Lilou Iron Mine, Huoqiu, China).

2.1.1. Water and Binders

The water used for the experiment was tap water. OPC was the most familiar binder used in the disposing of the tailings [28]. NCM was made up of BFS, lime, gypsum, clinker, sodium sulfate, alums and sodium fluosilicate. The performance results of the NCM to CPDT were compared with OPC.

2.1.2. Tailings

The tailings taken back from the site were precipitated, dehydrated and dried, then, the particle size characteristics were analyzed. The results are shown in Table 1. The d10, d30, d50, d60 and d90 represent the cumulative content of the particle composition curve, with corresponding particle size of (volume fraction) 10%, 30%, 50%, 60% and 90%, respectively. The main chemical composition of the tailings was shown in Table 2. According to non-uniform coefficient and curvature coefficient, the tailings belong to the graded bad material category. The median particle size was 38.3 μm, which is characteristic of fine tailings.

2.1.3. NCM Ingredients

The specific surface area of the BFS was 475 m2/kg and the OPC was 312 m2/kg. The chemical composition of the materials used in this test is shown in Table 2.

2.1.4. Preparation of CPDT samples

In this study, the concentration of the CPDT samples was 78%, and the mix proportion adopted included a water-to-cement (w/c) ratio of 5.6 and a binder (NCM) content of 4.5 wt.% of the tailings. The w/c ratio and cement ratio in all mixtures remained constant. The basic principle of using this binder content was to balance cost and strength. According to the ratio of the tests, BFS, lime, gypsum and clinker were mixed to produce the new cement-based material [29,30,31]. The weighed tailings and dry materials were mixed in a container until a uniform color was obtained. Then, the weighed water was added to the container and mixed until a uniform paste was obtained. They were then stirred with a mixer for 7 min. The prepared CPDT samples were poured into plastic containers with a diameter of 5 cm and a height of 10 cm. They were cured with a controlled temperature of 20 ± 2 °C and more than 95% relative humidity for different curing time (3 days, 7 days and 28 days). Nearly 124 CPDT samples were prepared for the UCS, SEM MIP experiments.
Furthermore, samples for XRD and TG/DTG analysis were prepared according to the procedure above. The w/c ratio of all the samples was 2 (to represents the high volume of water in CPDT). Various tests were subjected to the NCM and the OPC samples after the required curing time. Nearly eight CPDT samples were prepared in this study.

2.2. Experimental Methods

2.2.1. The UCS Experiment

The mechanical strength or the stability of the CPDT samples was usually evaluated using UCS [12,32] in accordance with TYE-300D (Wuxi Jianyi Instrument Machinery Co., Ltd., Wuxi, China), as illustrated in Figure 1. UCS tests were carried out on the CPDT samples with different amount of NCM and OPC and curing 3, 7 and 28 days. The load was executed at a relatively slow rate (0.1 kN/s).

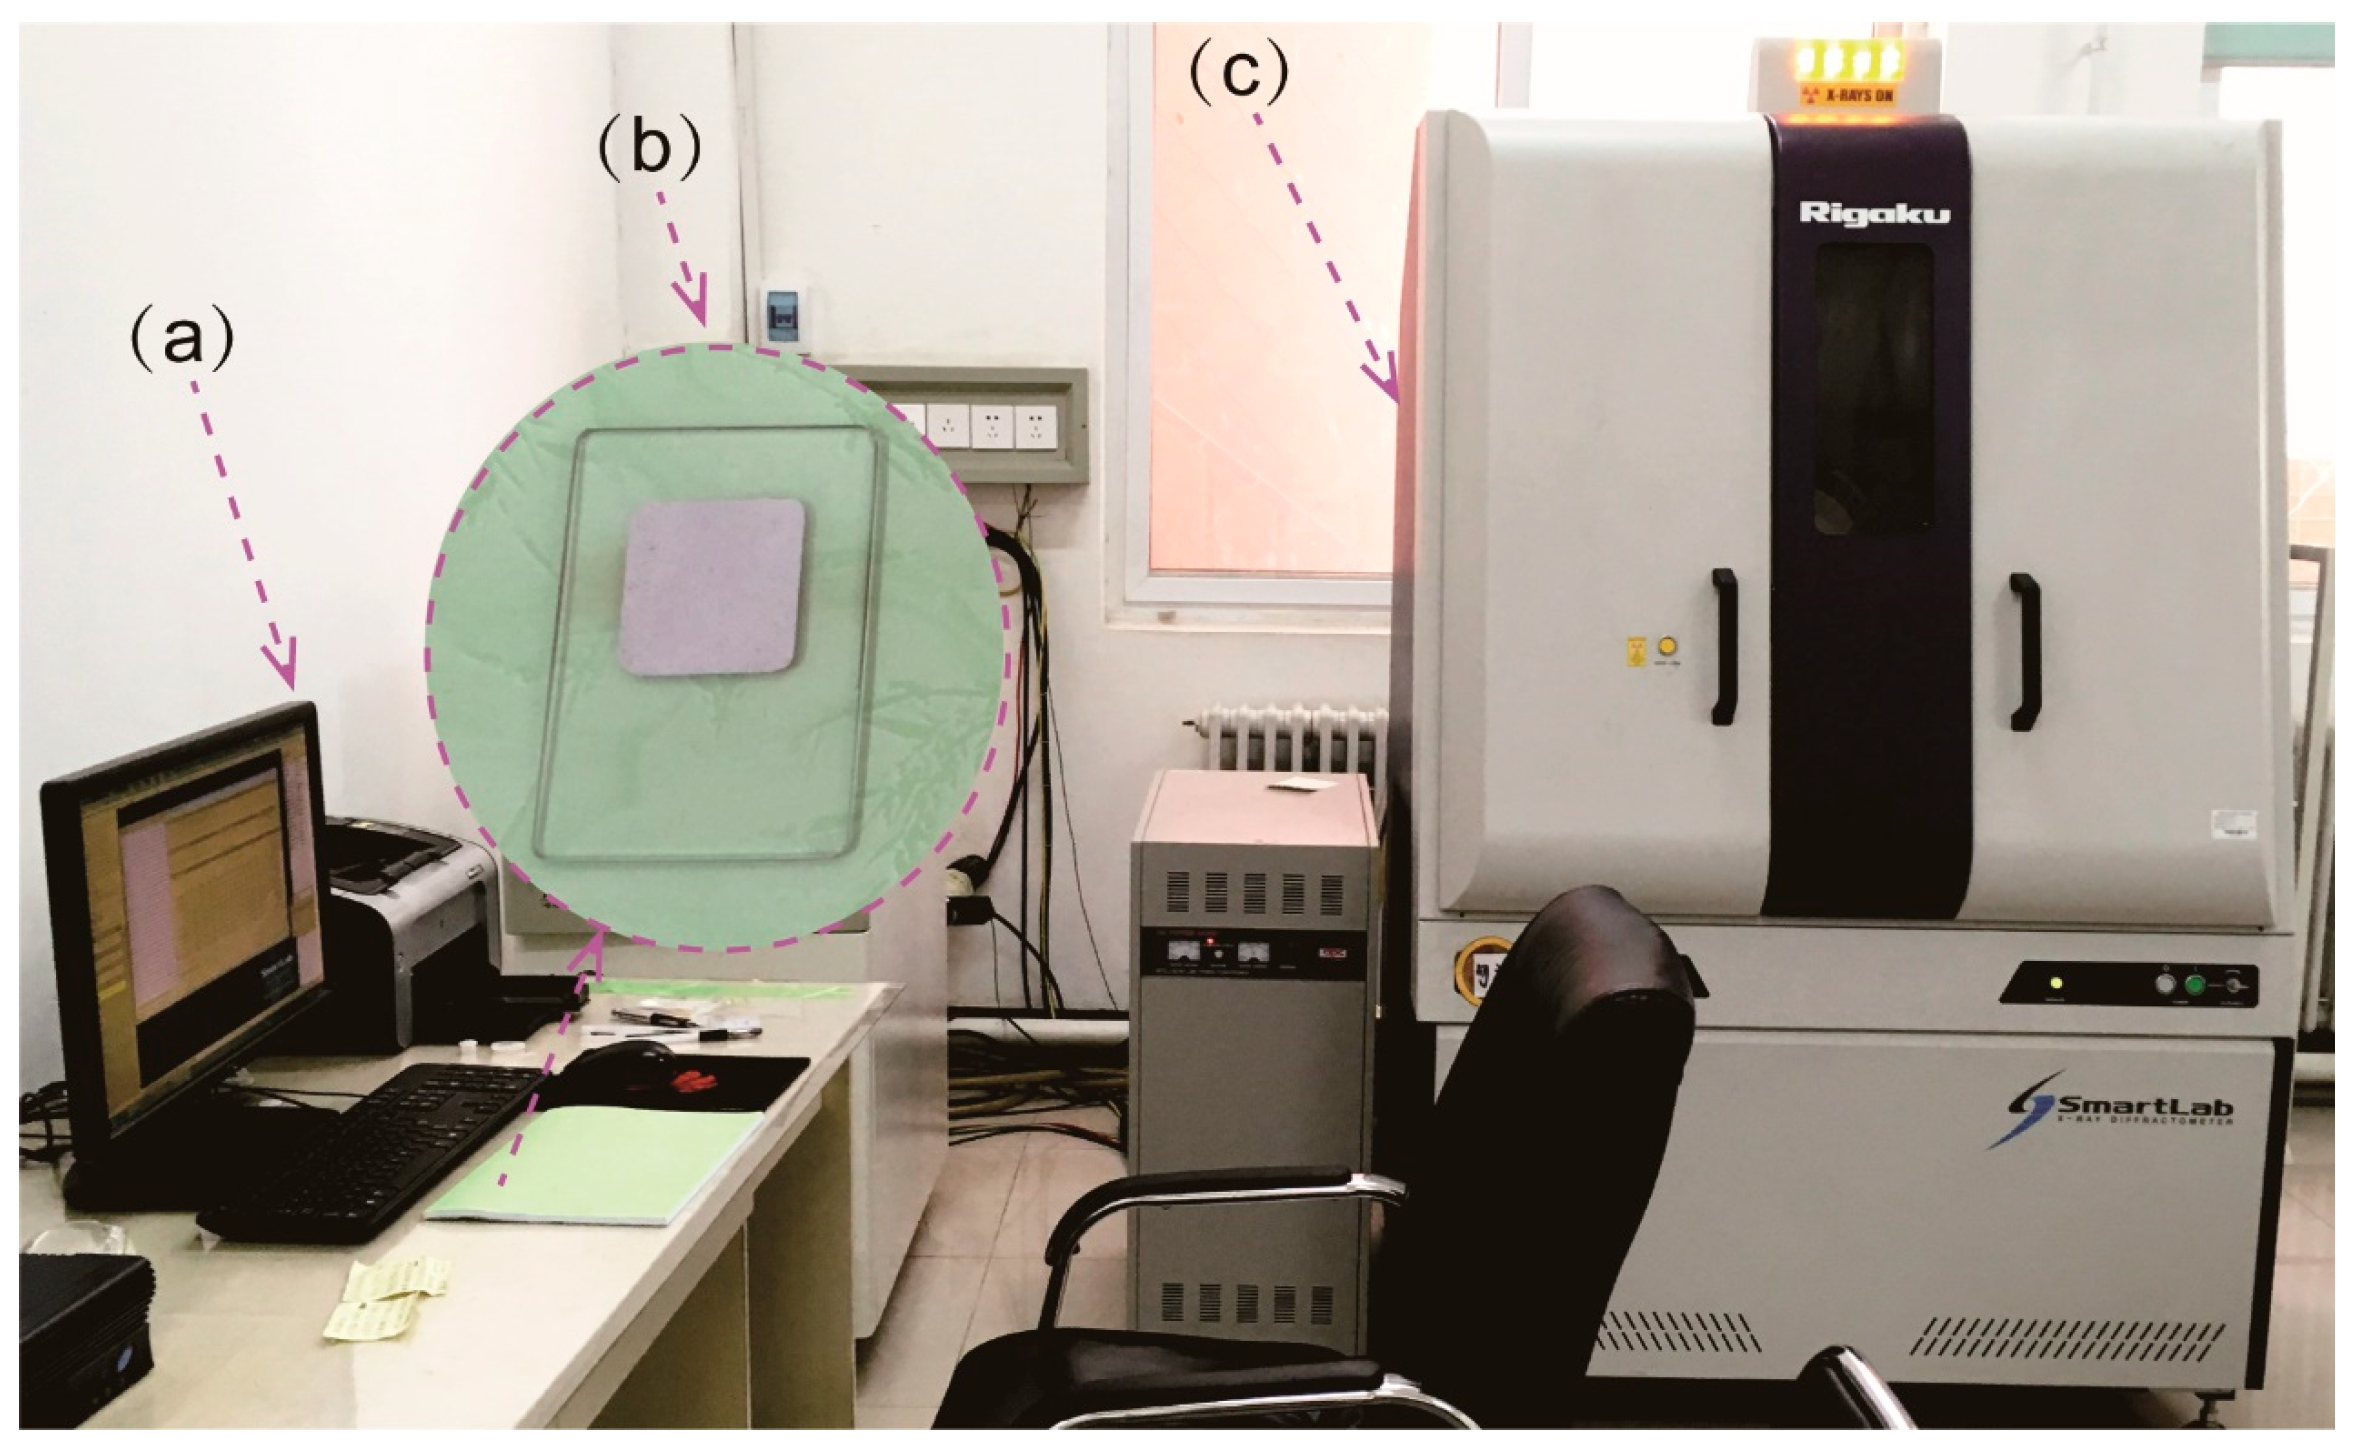
2.2.2. The XRD Experiment

XRD was a common measurement for crystal phases structure identification in cement-based materials slurry [21]. By using Empyrean Diffractometer, the analyses were carried out under the 2-θ range of 5–60° and 0.02° step to study the crystalline phases of the samples, as illustrated in Figure 2. XRD (PANalytical B.V., Almelo, The Netherlands) analyses were performed on dried and powdered cement-based slurry.

2.2.3. The TG/DTG Experiment

TG and DTG tests were performed to assess the amount of hydration products of the different cement-based materials on the microstructural development of the sample. This was done using a STA449F3 TG analyzer (NET Scientific Instruments Trading (Shanghai) Co., Ltd., Shanghai, China) that can raise temperatures up to 1200 °C, as illustrated in Figure 3. The temperature was increased from room temperature to 900 °C at a rate of 10 °C/min N2 purge. The reason why the temperature was not raised to 1200 °C was that the mass quality does not change when the temperature was higher than 900 °C. The weight change sensitivity 1 μg/min, the test standard has been followed GB/T 27761-2011. The samples used for TG and DTG experiment were the same that with XRD experiment.

2.2.4. The SEM Experiment

SEM analysis was used to observe the influence of the hydration products morphology on the samples with NCM and OPC [33]. The SEM observations were carried out under a 7001F analyzer (Japan Electronics Corporation, Shanghai, China), as illustrated in Figure 4. The magnification levels were in the range of 10–500 k.

2.2.5. The MIP Experiment

MIP is a high precision method for analyzing the micropore structure of materials [34]. Under continuous pressure, the volume of mercury invading the sample could be determined according to the external pressure, and the pore size distribution of the sample could be obtained. It was measured using a Micromeritics Auto Pore IV-9500 analyzer (Micromeritics Instrument (Shanghai) Ltd., Shanghai, China) with a range of 33,000 psia (228 MPa), as shown in Figure 5. The instrument can detect diameters ranging from 0.005 μm to 360 μm, while mercury injection volumes can be as accurate as 0.1 μL. The center samples were obtained from cylindrical specimens, weighing approximately 1.3 g. All of the samples were dried in a 50 °C oven until the quality was no longer reduced, the pore volume will not change at this drying temperature [35]. The samples were then immersed in mercury under gradually increasing pressure. The relationship between the test pressure and the diameter applies to Washburn–Laplace’s law, as the following equation [36]:
d = 4 σ   cos θ P
where, P was the applied pressure; d was the pore diameter of the sample, σ was the surface tension (N/m) and θ was the contact angle between the pore wall and the mercury. The contact angle was assumed 140° in this study [37,38].

3. Results and Discussion

3.1. Compound Activator Dosage Optimization

The hydration activity of BFS can only be stimulated under certain conditions. Common excitation methods included mechanical excitation, acid excitation and alkali excitation. In this test, the specific surface area of the BFS was controlled by 475 m2/kg. Lime and gypsum combined with clinker were used to carry out compound excitation. The influence of different activators on the UCS of the samples with NCM was studied to optimize the compound activator dosage.
According to the test analysis, the three levels of clinker were 12%, 14% and 16%; the three levels of lime were 4%, 6% and 8% and the three levels of gypsum were 8%, 10% and 12%. A three-level, four-factor orthogonal design test L9(34) was conducted in this study. The orthogonal test plan and test results were shown in Table 3. All proportions in this paper were mass percentages.
Range analysis is often used to analyze the most influential factors in experimental data. In this test, the UCS data were treated with this method; the results are shown in Table 4.
It can be seen from Table 4 that the UCS measures of 3 days, 7 days and 28 days for the activator optimum formula represented 14% of clinker, 6% of lime and 10% of gypsum. At these ratio conditions, the UCS of the samples with the NCM was the biggest. The reason for this was that under this ratio, BFS was hydrated to the fullest extent, and the remaining of lime and gypsum were hydrated the least, while the structure of the samples was more compact.
The range analysis cannot meticulously reflect the degree which the measured values agree with each other and data fluctuations caused by test errors during the experiment. It is also impossible to give an accurate quantitative estimate of the importance of the influence of the factors. To compensate for the lack of intuitive analysis, the variance was analyzed for the data above; the results are shown in Table 5.
In Table 5, we find that the results of the variance and range analyses were consistent. For the UCS of 3 days, X3(gypsum) had the greatest impact, X2(lime) was second and X1(Clinker) had minimal impact. For the UCS of 7 days, X2 had the greatest impact, X1 was second and X3 had minimal impact. For the strength of 28 days, X1 had the greatest impact, X2 was second and X3 had minimal impact. This showed that for the CPDT samples at the time of 3 days, gypsum had the greatest effect on the hydration reaction, while the role of gypsum was gradually reduced from 7 to 28 days. The reason for this phenomenon was that a large amount of SO 4 2 in gypsum can promote the hydration reaction of cementitious materials in the early stage. The absorption of SO 4 2 due to the hydration products of the C-S-H gels resulted in the decrease of SO 4 2 in the solution, which has a negative effect on the development of the UCS. Lime contained a large amount of OH , and excitation agents need to work in alkaline solution; thus, from 3 to 7 days, the effect of lime on the UCS of the samples gradually increased. From 7 to 28 days, due to the progress of the hydration reaction and self-drying, the moisture in the samples gradually decreased. Additionally, the effect of OH on the hydration reaction gradually decreased, which was consistent with the findings of Cui and Fall [39]. The influence of BFS on the UCS increased from 3 to 28 days. This showed that with the progress of the hydration reaction, BFS was the main component of the cementitious materials.
Based on the analysis above, the optimal ratio was 14% for clinker, 6% for lime, 10% for gypsum and 70% for BFS. The UCS of the test samples gathered by adding this ratio of materials was compared with that adding OPC; the results were shown in Table 6. The UCS of the samples with NCM was higher than that with OPC across all aging time.
The same method was used to optimize the addition of sodium sulfate, alum and sodium fluorosilicate. The results were obtained when the materials ratio of clinker: lime: gypsum: BFS was 14:6:10:70, and the amount of admixture added was 0.4% of NCM. The ratio of sodium sulfate: alum: sodium fluorosilicate was 2:1:1, and the samples had the highest UCS across all ages. 0.831 MPa at 3 days, 2.019 MPa at 7 days, 3.307 MPa at 28 days with NCM were 2.4, 2.4 and 1.7 times higher as compared with OPC. The reason for this was that the fineness of the slag was larger than with OPC, and the finer of the slag, the larger the specific surface area and surface energy, significantly improving the activity of the slag. The fine particles of the slag filled in smaller pores to lower the porosity of the samples, which could also increase the strength of the samples (the conclusion will be confirmed in part 3.4). In addition, the slag had been stimulated at the beginning because of the addition of admixtures and more hydration products were produced in the earlier time. From the discussion above, it seems the NCM can replace OPC with regards to strength.

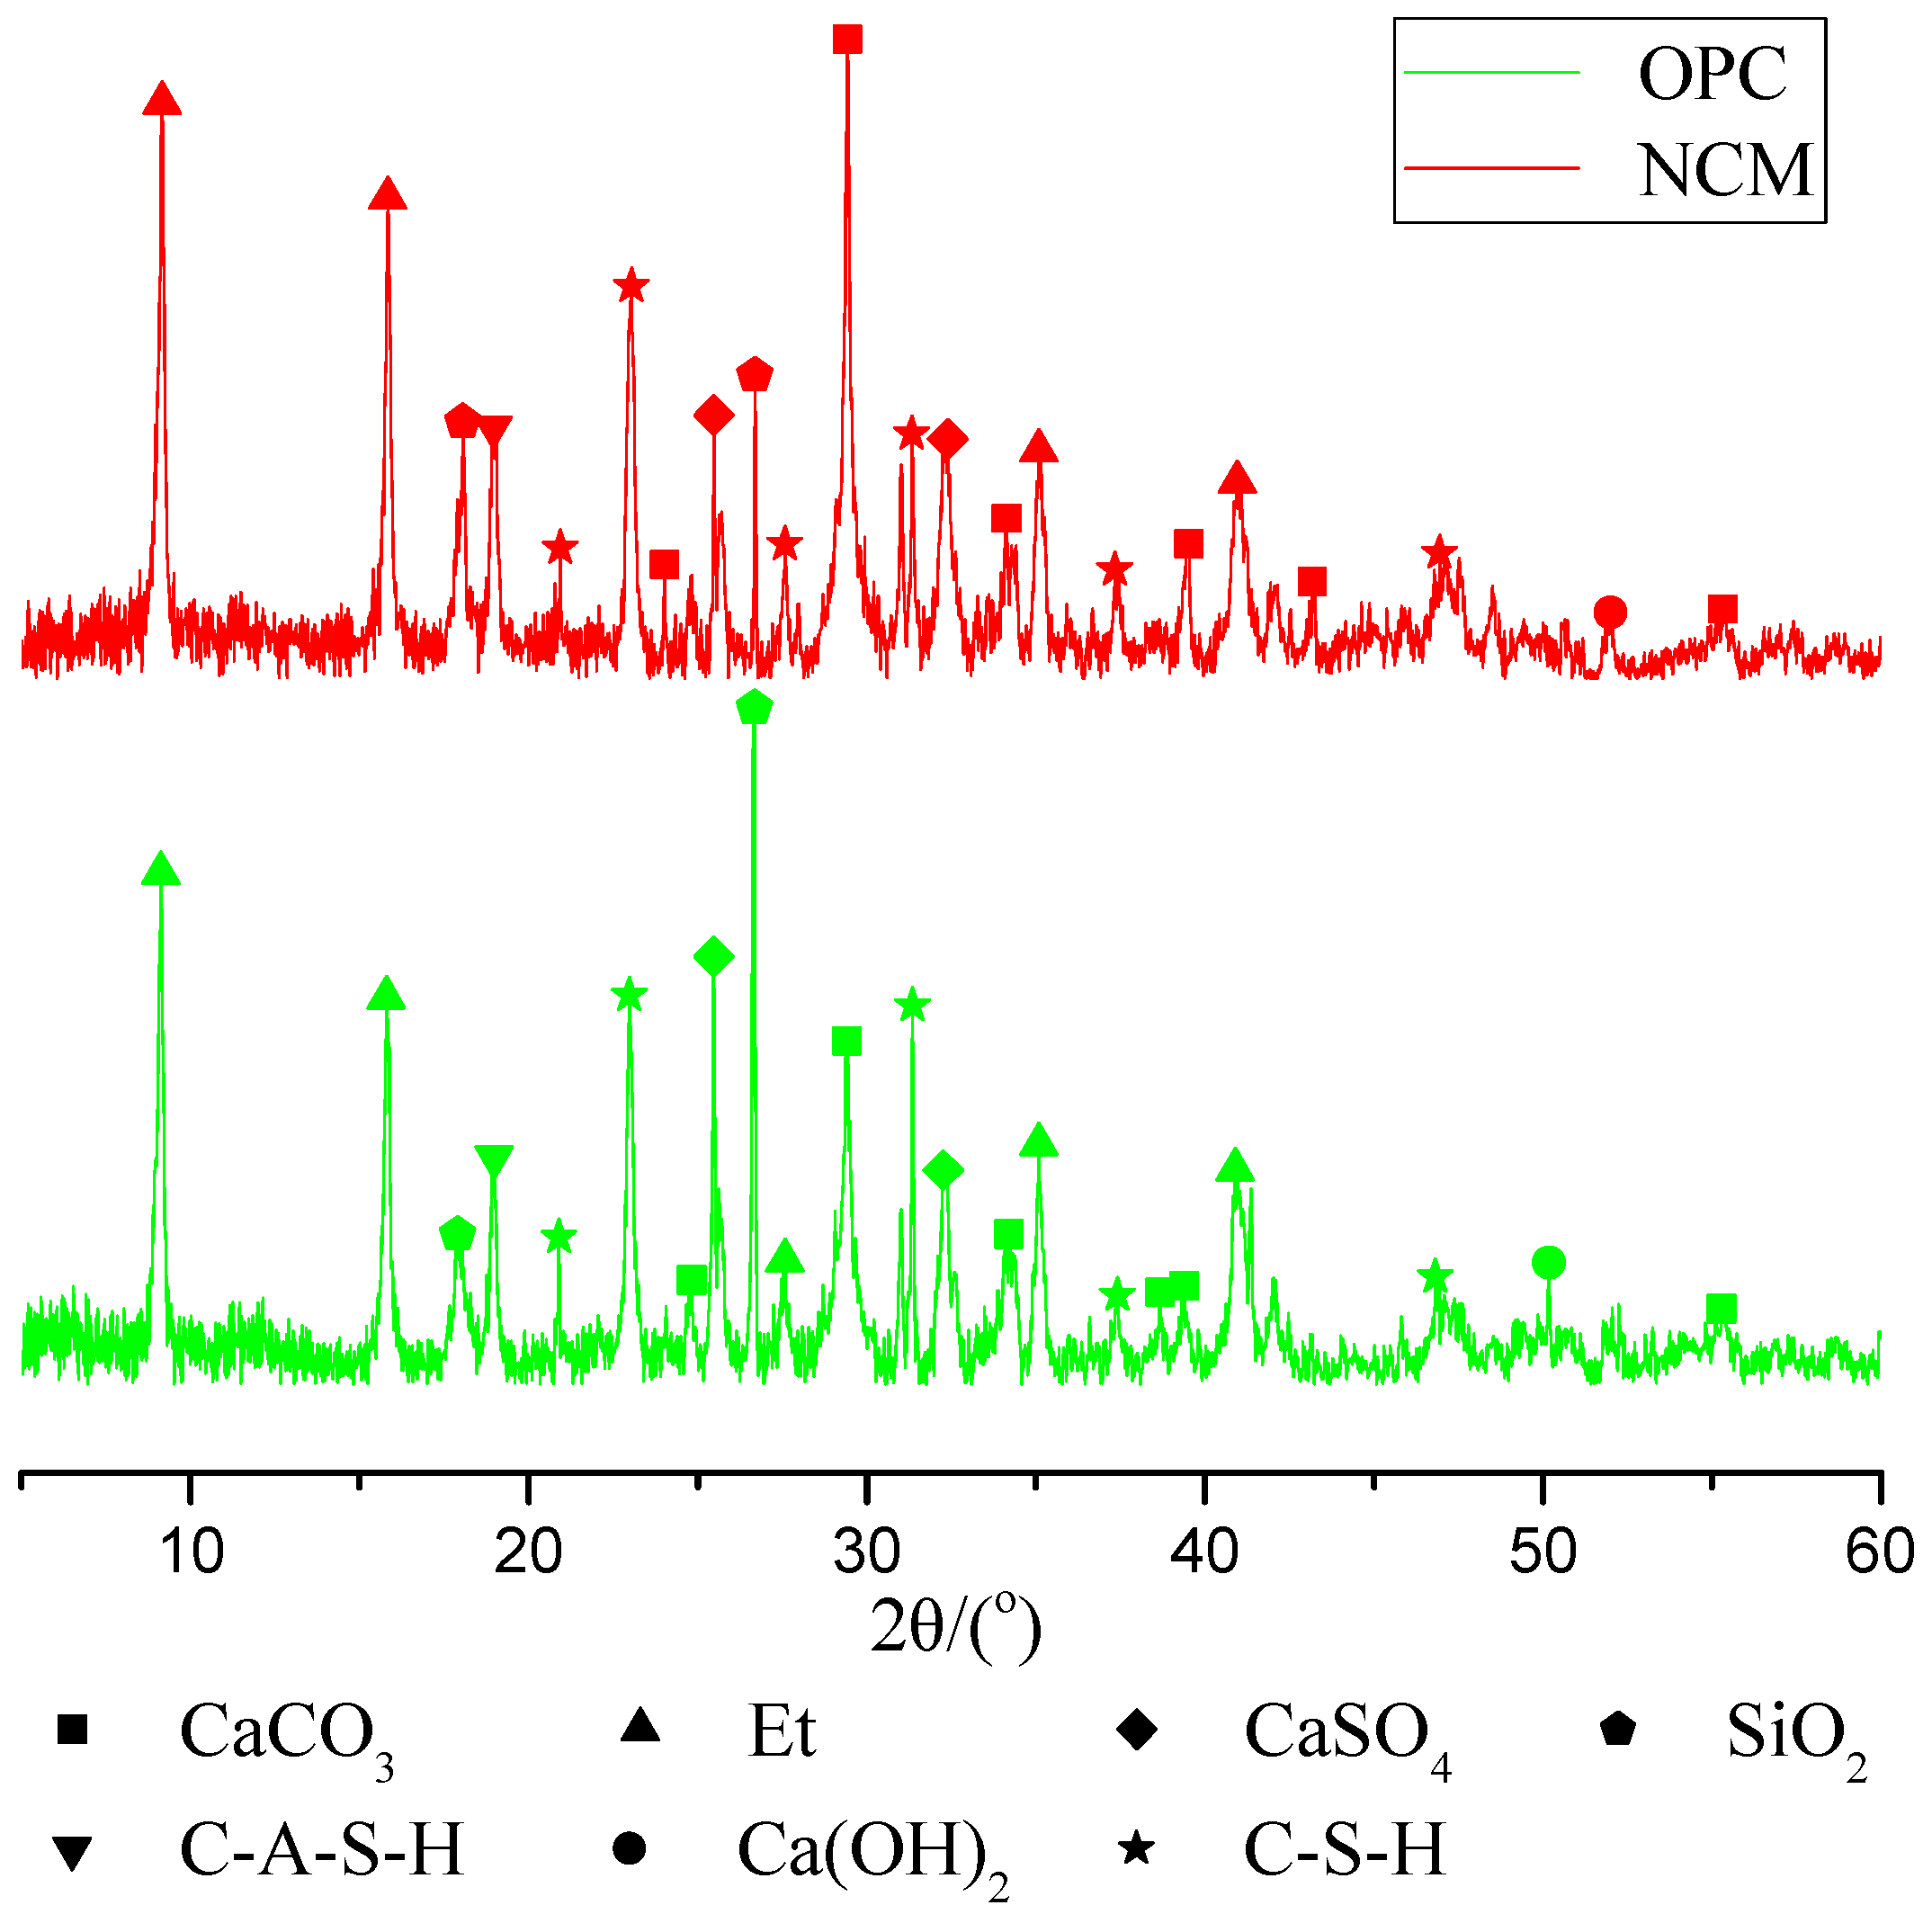
3.2. The Crystalline Phases and Amount of Hydration Products of NCM and OPC

The samples of NCM and OPC were prepared and cured at 20 ± 2 °C with relativity humidity greater than 95% for 7 and 28 days. The hydration reaction was then dried in a 50 °C oven until the quality was no longer reduced. The coupling excitation of the alkaline environment and mechanical grinding promotes the pozzolanic reaction of BFS, thus contributing to the development of the UCS for the samples. The crystalline phases of cement-based materials hydration products of NCM and OPC was demonstrated by the experimental evidence presented in Figure 6 and Figure 7 for curing time of 7 and 28 days. The increasing amount of them were presented in Figure 8 and Figure 9. These figures present the results of XRD, TG and DTG analyses of the powdered cemented materials. It can be seen from Figure 6 and Figure 7 that the crystalline phases of the cement materials hydration products and the materials that do not participate in reaction like SiO2 were almost the same. However, from 7 to 28 days, the diffraction peaks of CaCO3 and C-S-H were stronger than those at 7 days, and the diffraction peaks of Et and calcium hydroxide (CH) became weak, whether it was OPC or NCM. It indicated that the phases produced by NCM was similar to that produced by OPC, however, the amount of each product changed.
From Figure 8 and Figure 9, the valleys at these different temperatures range (50 °C to 800 °C) showed the existence of C-S-H, ettringite, calcium hydroxide (CH) and calcite as demonstrated in several studies [40,41,42]. The weight loss between 50 °C and 105 °C was due to the disappearance of free water and bound water. The weight loss between 110 °C and 200 °C was due to the dehydration of ettringite, gypsum and C-S-H. The weight loss between 450 °C and 500 °C was attributed to the decomposition of CH, and the significant weight loss at 650–750 °C results from the decomposition of calcite. The comparison of the TG curves of the samples with OPC and NCM showed that the weight loss of water evaporation was almost the same, however, the weight loss caused by the dehydration of the cement-based hydration products (110 °C–200 °C) of NCM was greater than OPC. This indicated that more cement-based hydration products were generated in NCM. It can also be seen from Figure 8 and Figure 9 that the amount of CH decreased, indicating that more CH participated in the hydration reaction, generating stronger hydration products and enhancing the strength of the CPDT samples. Both figures showed that the amount of bound water and the residual quality of OPC were greater than in NCM, indicating that there were more unstable hydration products in OPC; NCM produces more stable hydration products.

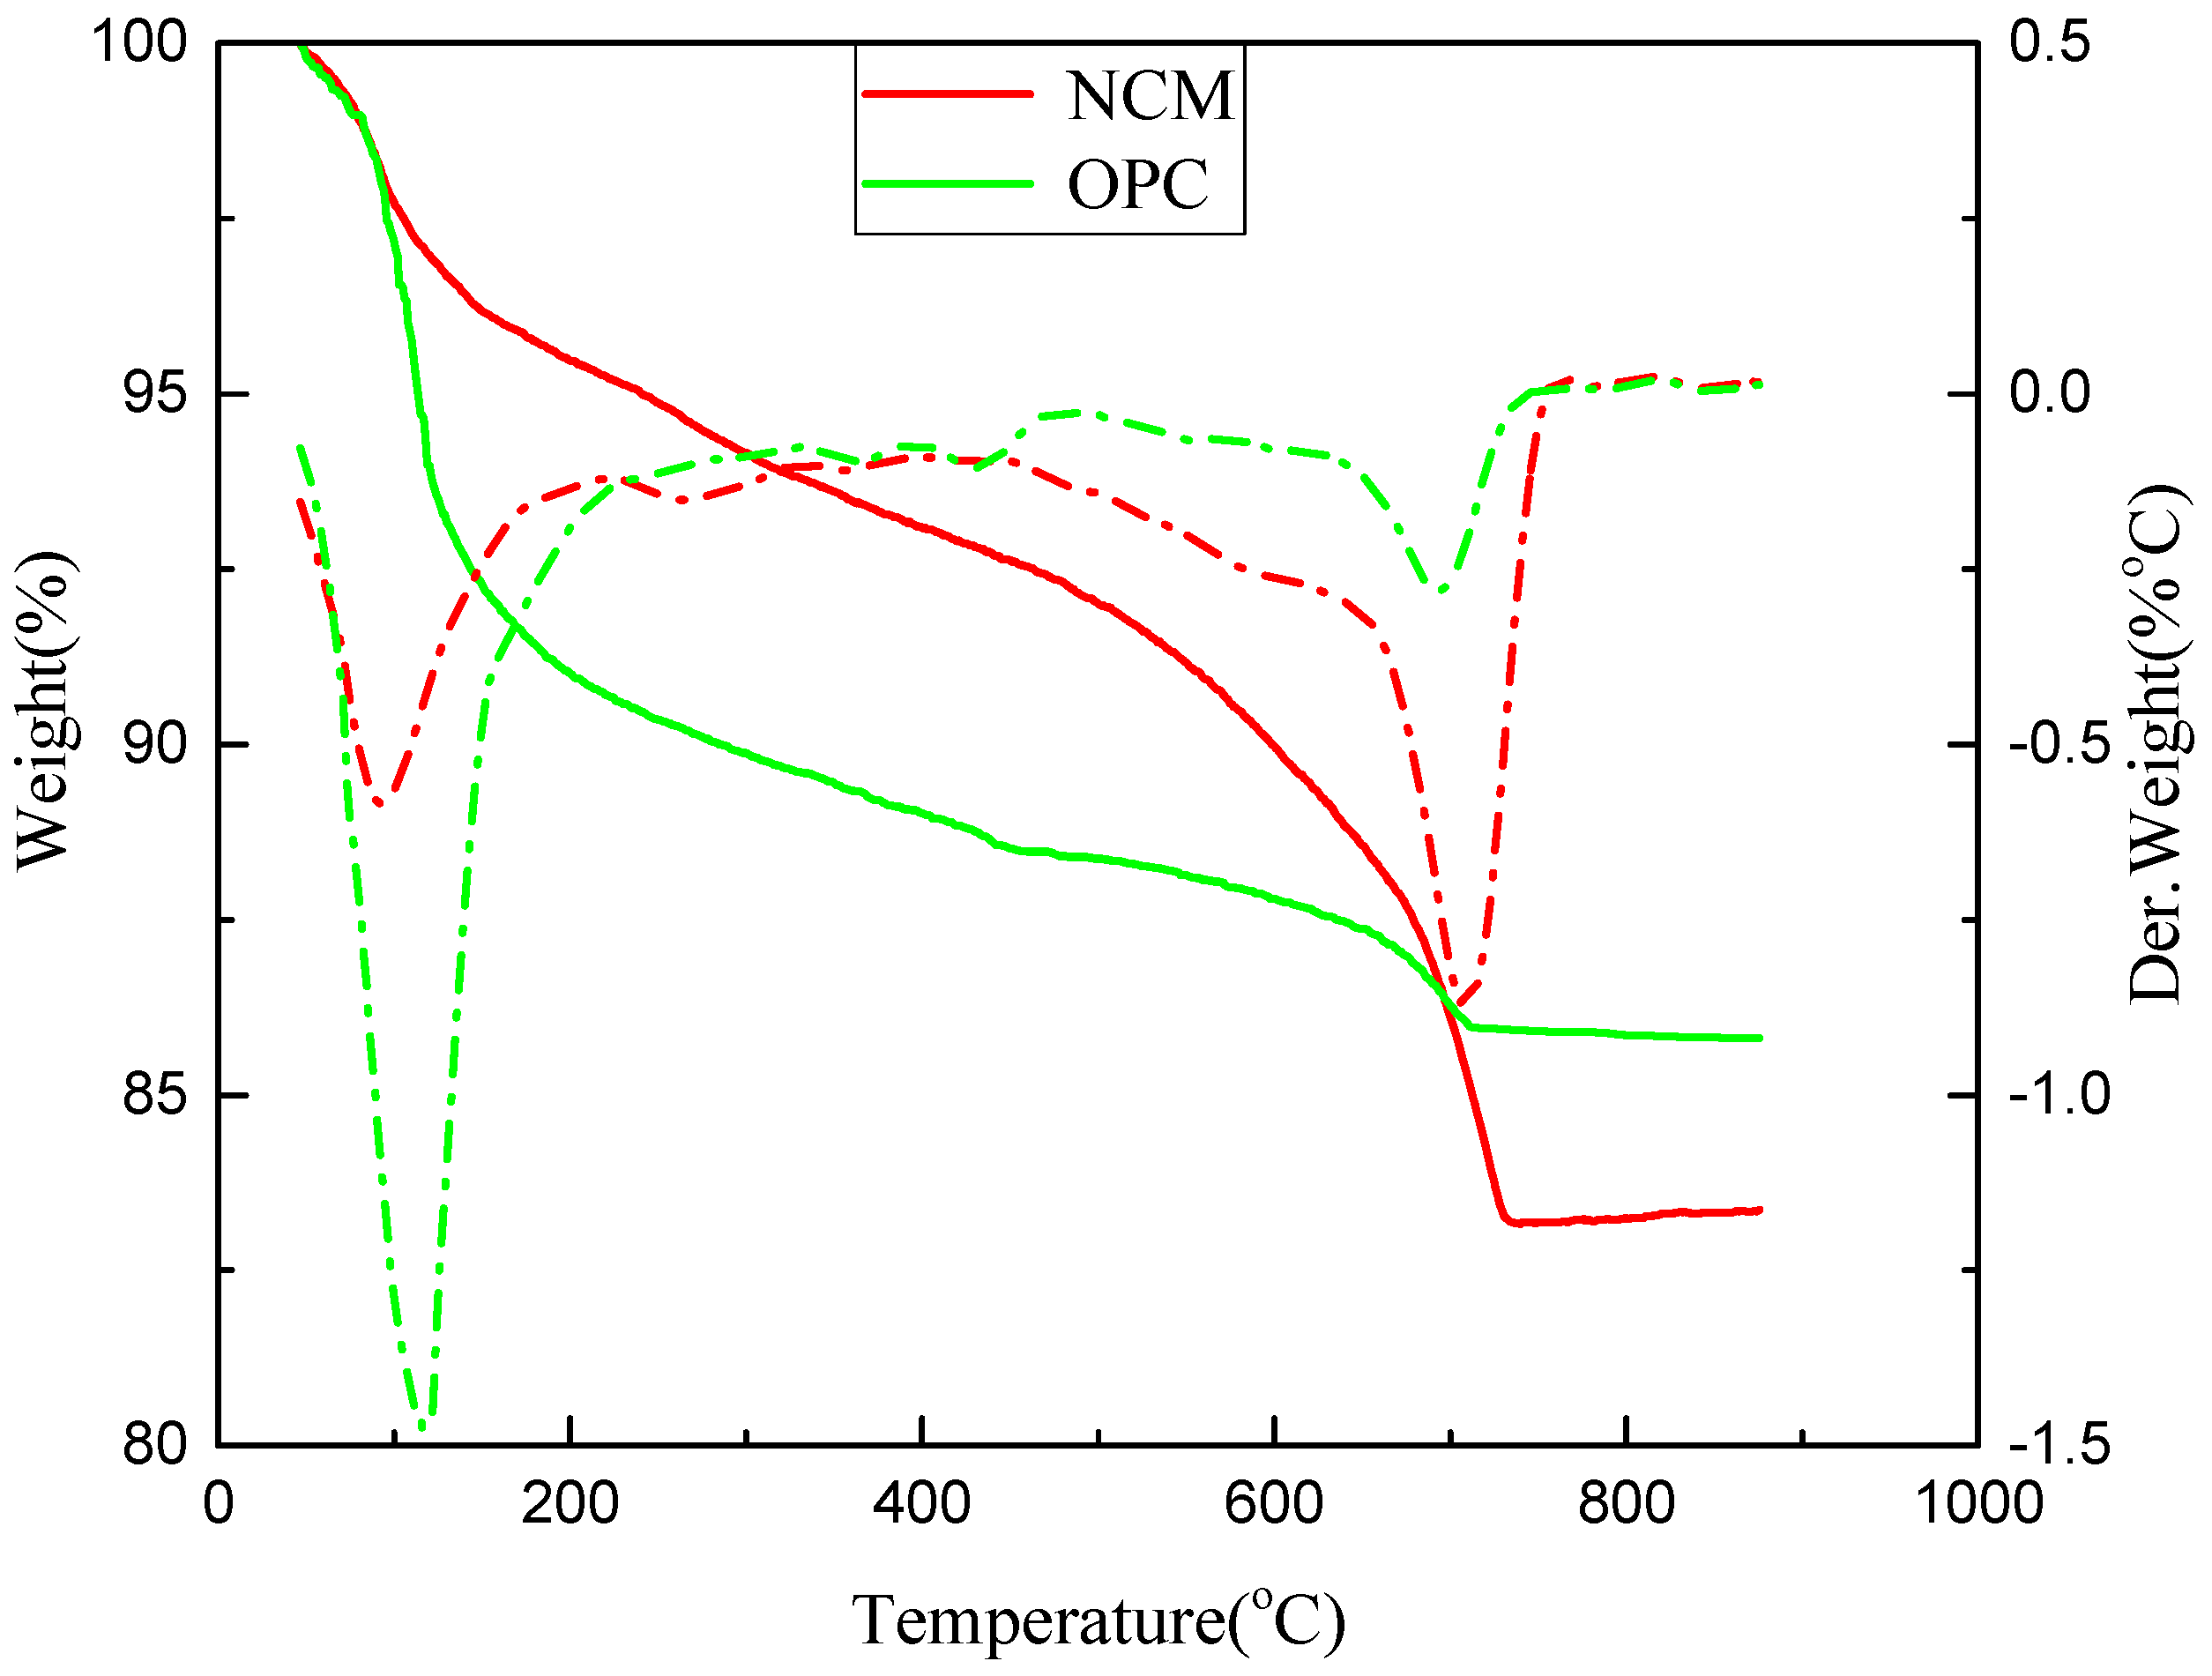
3.3. The Hydration Mechanism of NCM and OPC

The CPDT samples made of the optimum ratio of the NCM were cured at 20 ± 2 °C with relative humidity greater than 95% for 3, 7, and 28 days. The hydration reaction was then terminated with anhydrous ethanol and dried in a 50 °C oven until the quality no longer reduced. The samples were sprayed with gold and placed in an SEM experimental setup for microanalysis. The hydration products composition and microstructure of the samples with NCM determined the macroscopic strength of the CPDT samples. Figure 10, Figure 11 and Figure 12 show the SEM images of the hydration products morphologies at 3, 7 and 28 days, respectively.
In Figure 10a, the CPDT samples with NCM which had been hydrated for 3 days generated a large amount of ettringite and a small amount of C-S-H gels. While Figure 10b showed the sample with OPC hydrated for 3 days, the hydration product was only ettringite. In Figure 11a, the hydration reaction of the sample with NCM was observed for 7 days. The ettringite was reduced, which a large amount of C-S-H gels encapsulated the ettringite and the porosity decreased. The UCS of the sample with NCM showed great improvement, as seen in Table 6. On the other hand, in Figure 11b, the amount of C-S-H produced in the sample with OPC was less than that with NCM at 7 days, a large amount of ettringite was exposed on the surface, and the degree of envelopment for the ettringite was not as high as that with the NCM. In Figure 12a, the sample with NCM at 28 days produced a large amount of C-S-H gels and the ettringite was completely encapsulated and existed in entirety, which greatly increased the UCS of the CPDT sample. At the same time, in Figure 12b, the external surface of the sample with OPC was uneven. A large amount of C-S-H gels were generated too, however, some of the ettringite was still exposed on the surface, which showed that the amount of C-S-H generated was relatively less. This affects the UCS of the CPDT sample.
The reason why the microscopic structure images of the sample with NCM at the same ages were more compact than that with OPC can be explained as follows: when gypsum and lime are added to NCM, the lime provides Ca2+ (a raw material for hydration reactions) and OH . In the alkaline environment of the reaction, calcium sulfate provides Ca2+ and SO 4 2 , and SO 4 2 reacts with C3A to produce secondary ettringite. The resulting ettringite was filled in the pores, and the strength of the samples was enhanced. The SO 4 2 was absorbed by the C-S-H so that the amount of ettringite was produced and thus the pore structure was coarsened. This was not only related to OH concentration, but also related to SO 4 2 concentration. A high concentration of SO 4 2 can increase the amount of secondary C-S-H and ettringite.
The BFS itself was not active, however, in the calcium hydroxide solution, a significant hydration reaction occurred, thereby inspiring its pozzolanic effect. Hydration was faster in the saturated calcium hydroxide solution. The hydration reaction was generally considered to be the following:
xCa ( OH ) 2 + SiO 2 + mH 2 O xCaO · SiO 2 nH 2 O
xCa ( OH ) 2 + Al 2 O 3 + mH 2 O xCaO Al 2 O 3 n   H 2 O
where the value of x depends on the type of mixture, the ratio of lime and active silica, the ambient temperature and the duration of the action. The value was generally equal to 1 or was slightly larger, and the value of n generally between 1 and 2.5.
The process of the CH interacting with SiO2 was such that the amorphous silicic acid absorbs Ca2+ to form an indefinite component of the adsorption system, and an amorphous hydrated calcium silicate was then formed. This transformed into microcrystalline or crystalline calcium silicate gels after a long time period. CH interacts with Al2O3 to form calcium aluminate hydrate (3CaO·Al2O3·6H2O). Hydrated calcium sulfoaluminate is a water-insoluble needle crystal that precipitated around the clinker particles and impeded moisture. Therefore, entry has played an important role in delaying the coagulation of cement-based materials. When gypsum was present in the liquid phase, it reacted with the calcium hydrated aluminate to form high-sulfur hydration calcium sulfoaluminate (3CaO·Al2O3·3CaSO4·31H2O, ettringite). When the gypsum was completely consumed, part of it became monosulfur-type hydrated calcium sulfo-aluminate (3CaO·Al2O3·3CaSO4·12H2O), which has a relatively high strength.
3 CaO Al 2 O 3 6 H 2 O + 3 ( CaSO 4 2 H 2 O ) 3 CaO Al 2 O 3 3 CaSO 4 31 H 2 O
3 CaO Al 2 O 3 3 CaSO 4 31 H 2 O + 2 ( 3 CaO Al 2 O 3 6 H 2 O ) 3 ( 3 CaO Al 2 O 3 3 CaSO 4 12 H 2 O )

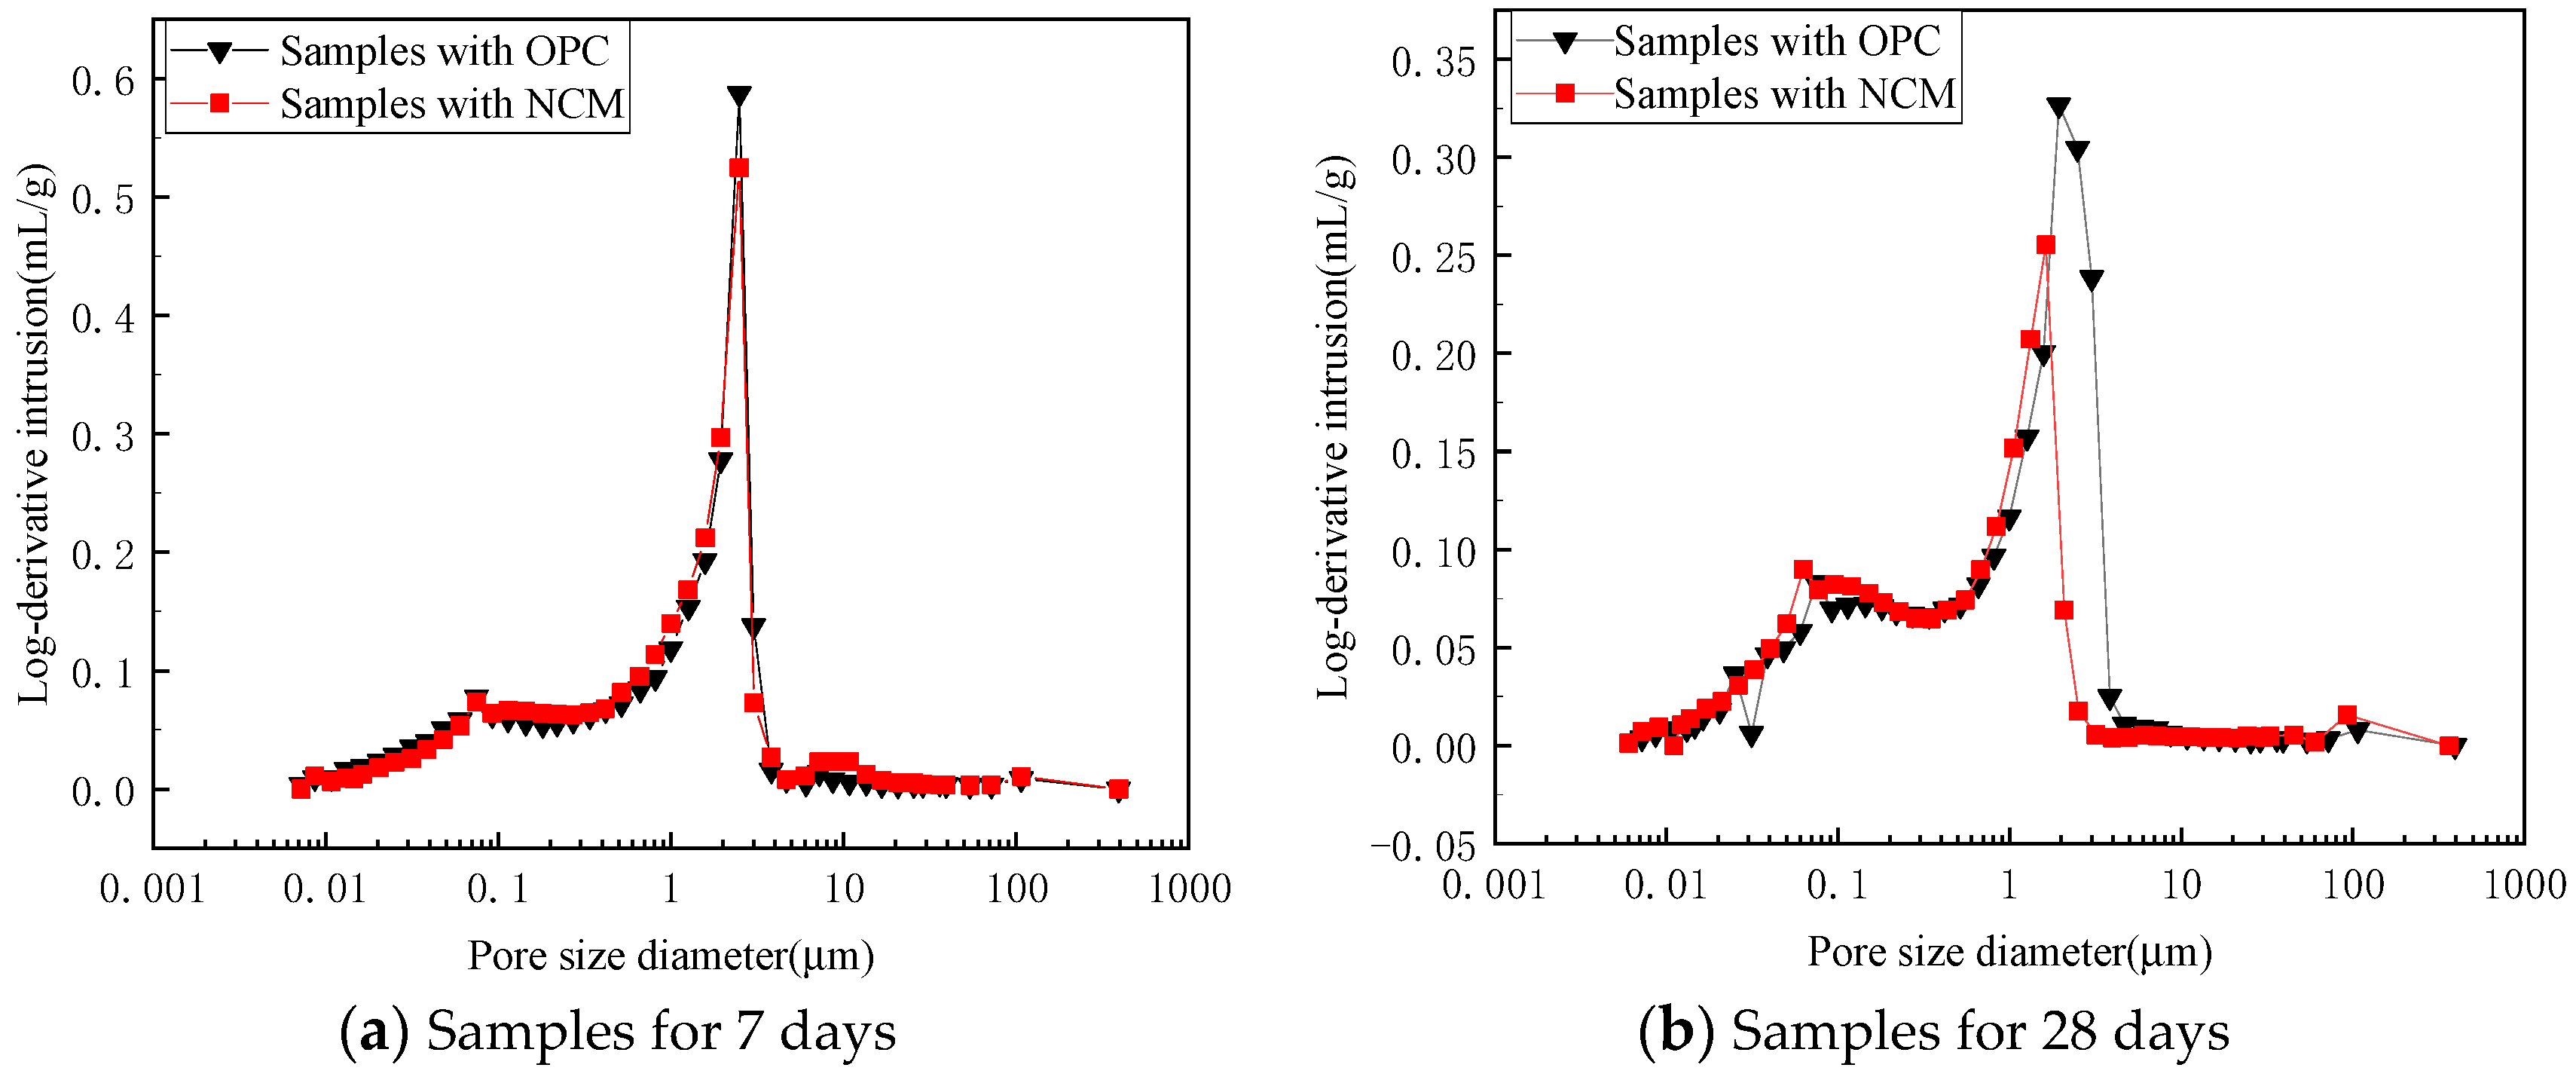
3.4. The Pore Size Distribution of CPDT Samples with NCM and OPC

For research the effects of the new cement-based material on the pore size distribution of the tailings, the MIP tests on CPDT samples were carried out after curing 7 and 28 days. The volumes of invading mercury obtained by the MIP tests were compared with the pore diameters of the CPDT samples, which was plotted in Figure 13. According to the functional relationship of Equation (1), the pressure applied by the device was inversely proportional to the pore size. The intrusion volume of mercury increases as the intrusive pressure increases.
In Figure 13, the normalized volume increased slowly at the beginning of the lower pressure, where, primarily, pores larger than 7.2 μm were intruded. It increased rapidly at pore sizes of 4.9–6 μm. When the pressure caused the tailings particles rearrange, the normalized volume will rise to a larger value under smaller pressure. Thereafter, pores of less than 0.01 μm would be filled with mercury. However, even under nearly the highest pressure condition, it was difficult for mercury to enter the smallest and closed pores in the sample. Therefore, the mercury intrusion curve eventually tended to flatten.
In Figure 13a, for the normalized volume of the samples after curing for 7 days, the final normalized volume of the sample with NCM was about 8.0% larger than that with OPC. In Figure 13b, for the final normalized volume of the sample after curing for 28 days, the sample with NCM was about 11% larger than that with OPC. It can be seen from Figure 13a and Figure 13b that after curing for 28 days, the porosity of the sample with OPC was reduced by 13%, and with NCM it was reduced by 18% compared with samples cured for 7 days. This showed that as the curing time increased, the porosity of samples with OPC and NCM decreased; however, the porosity of the sample with NCM decreased more, and the sample with OPC had a higher porosity than that with NCM, whether it was 7 days or 28 days. The low porosity indicated that the hydration reaction of the sample with NCM was quicker and more complete than that with OPC at 7 days and 28 days. More hydration products were generated and filled in the interparticle pores; the results made the samples more compact and stronger.
Figure 14 showed the Log-derivative mercury volume curves of the samples after curing for 7 and 28 days. For the 7 days sample, in Figure 14a, the most common pore diameters of the samples with OPC and NCM were 2.49 μm and 2.48 μm, respectively, representing a decrease of 0.4%. For the 28 days samples, in Figure 14b, the most common pore sizes of the samples with OPC and NCM were 1.93 μm and 1.62 μm, respectively, representing a decrease of 19%. From 7 days to 28 days, the most common pore size of the sample was reduced. The sample with OPC reduced by 29%, and with NCM reduced by 53%. This showed that during this time, the hydration reaction was kept on going, however, the hydration reaction of the sample with NCM was more complete, which was consistent with the analysis in Figure 13. In addition, for either the 7 days or the 28 days log-derivative mercury volume curves, the samples with NCM had a left shift relative to that with OPC, which indicated that the most probable pore size decreased.
When the mercury intrusion of the sample with OPC occurred at 7 days and the pore size ranged from 0.6 μm to 1.9 μm, the value was larger than that with NCM, which means that in this range, the pore volume of the sample with OPC was relatively larger. From 0.09 to 1.9μm, the curves of the sample with NCM were higher than that with OPC, and from 0.008 to 0.09 μm, the curve of the sample with OPC was higher than that with NCM. This showed that the sample with NCM had more macropores transformed into mesopores relative to that with OPC, and some small pores turned into dense parts. When the mercury intrusion of the samples occurred at 28 days, and the pore size ranged from 0.5 to 1.5 μm, the curves of the sample with NCM were higher than that with OPC, and from 0.2 to 0.5 μm, the sample with OPC were higher than that with NCM. When it was less than 0.2 μm, the curves of the sample with NCM were higher than that with OPC. The reason for this was that the curve of the sample with NCM shifted to the left too much after 28 days; additionally, there were more macropores converted to small and medium pores.

4. Conclusions and Future Work

In this paper, a new type of cementitious material was produced and compared with OPC 42.5# with the hydration reaction characteristics after curing for 3, 7 and 28 days. The analyses of crystalline phases and amount of hydration products were carried out with XRD and TG/DTG. The SEM was used to analyze the formation of hydration products at different curing time. The MIP method was used to analyze the changes in pore size distribution after 7 days and 28 days. The major findings of this study included the following:
(1) The compound activator composed of gypsum, lime and clinker, together with some additives, had a good hydration activation effect on BFS. The ratio of the NCM was clinker: lime: gypsum: BFS equal to 14:6:10:70, the amount of admixture added was 0.4% of NCM and the ratio of sodium sulfate: alum: sodium fluorosilicate was 2:1:1. The UCS of the CPDT samples was 0.831 MPa at 3 days, 2.019 MPa at 7 days and 3.307 MPa at 28 days, which were 2.4, 2.4 and 1.7 times higher than those found with OPC. This indicates that the samples with NCM had the optimum UCS across all aging time.
(2) The hydration products crystalline phases of NCM and OPC were similar, however, a greater amount of hydration products formed in NCM at the same curing time, which resulted in a higher strength of CPDT samples with NCM. This showed NCM had a higher hydration reactivity.
(3) The NCM produced a large amount of ettringite and some C-S-H gels after 3 days. A large amount of C-S-H gels formed after 7 days. The ettringite was gradually wrapped and pores were filled. More C-S-H gels were formed after 28 days. The complete wrapping of ettringite greatly enhanced the UCS of the CPDT samples.
(4) Comparing the pore size distribution of the samples after curing for 7 and 28 days, the pore volume of the sample with OPC reduced by 13% and with NCM was reduced by 18%. The most probable pore size of the sample with OPC was reduced by 29%, and with NCM reduced by 53%. This means the porosity of all the samples reduced, however, the samples with NCM reduced more.
The study of the NCM in this paper was focused on CPDT, however, the NCM also applicable to cemented paste backfill. However, the experiments used in this paper were iron tailings, thus, the NCM may not necessarily be suitable for other metal or coal mines. In other mines, the ratio of cementitious materials needs to be re-tested. This paper provides ideas and methods for the study of cement-based materials, which was applicable to all mines.

Author Contributions

Y.H. and P.D. conceived and designed the experiments; P.D., X.Z. and D.H. performed the experiments; S.C. and D.H. collected and analyzed the data; Y.H. contributed materials/analysis tools; Y.H. and P.D. wrote the paper.

Funding

This work is supported by the National Natural Science Foundation of China (no.51674263) and the Fundamental Research Funds for the Central Universities (2011YZ02).

Conflicts of Interest

The authors declare no conflict of interest.

References

  1. Li, W.; Fall, M. Sulphate effect on the early age strength and self-desiccation of cemented paste backfill. Constr. Build. Mater. 2016, 106, 296–304. [Google Scholar] [CrossRef]
  2. Kesimal, A.; Ercikdi, B.; Yilmaz, E. The effect of desliming by sedimentation on paste backfill performance. Miner. Eng. 2003, 16, 1009–1011. [Google Scholar] [CrossRef]
  3. Khademi, H.; Abbaspour, A.; Martínez-Martínez, S.; Gabarrón, M.; Shahrokh, V.; Faz, A.; Acosta, J.A. Provenance and environmental risk of windblown materials from mine tailing ponds, Murcia, Spain. Environ. Pollut. 2018, 241, 432–440. [Google Scholar] [CrossRef] [PubMed]
  4. He, Z.; Wu, C. Research of Risk Assessment System on Tailings Pond Water Pollution. Procedia Eng. 2011, 26, 1788–1797. [Google Scholar] [CrossRef] [Green Version]
  5. Wang, T.; Zhou, Y.; Lv, Q.; Zhu, Y.; Jiang, C. A safety assessment of the new Xiangyun phosphogypsum tailings pond. Miner. Eng. 2011, 24, 1084–1090. [Google Scholar] [CrossRef]
  6. Milanović, P.T. Dam Engineering and Its Environmental Aspects; Springer: New York, NY, USA, 2012. [Google Scholar]
  7. Zhang, L.; Huang, Y.; Wu, X.; Skibniewski, M.J. Risk-based estimate for operational safety in complex projects under uncertainty. Appl. Soft Comput. 2017, 54, 108–120. [Google Scholar] [CrossRef]
  8. Mei, G.D. Quantitative Assessment Method Study Based on Weakness Theory of Dam Failure Risks in Tailings Dam. Procedia Eng. 2011, 26, 1827–1834. [Google Scholar] [CrossRef] [Green Version]
  9. Men, Y.; Cai, J. Safety Status and Accident Control Measures of Tailings Storage in China. Chin. J. China Safe Prod. Sci. Technol. 2009, 5, 48–52. [Google Scholar] [CrossRef]
  10. He, Z.; Tian, S.; Sui, L.; Xie, W. Mine Tailings Emission Status and Effective Ways of Disposal. Chin. J. Min. Technol. 2008, 8, 78–80. [Google Scholar] [CrossRef]
  11. Hou, Y.; Tang, J.; Wei, S. Study on Tailings Consolidation Emissions Technology. Chin. J. Met. Mine 2011, 06, 59–62. [Google Scholar]
  12. Fall, M.; Pokharel, M. Coupled effects of sulphate and temperature on the strength development of cemented tailings backfills: Portland cement-paste backfill. Cem. Concr. Compos. 2010, 32, 819–828. [Google Scholar] [CrossRef]
  13. Li, W.; Zhou, X.; Liao, M.; Lin, Q. Research and Practice of Cement Filling Substitute Materials. Chin. J. Min. Technol. 2011, 11, 19–21. [Google Scholar] [CrossRef]
  14. Kim, G.; Khalid, H.R.; Kim, H.J.; Lee, H.K. Alkali activated slag pastes with surface-modified blast furnace slag. Cem. Concr. Compos. 2017, 76, 39–47. [Google Scholar] [CrossRef]
  15. Bong, S.; Hoon, H.; Yong, C. Effects of aluminate rich slag on compressive strength, drying shrinkage and microstructure of blast furnace slag cement. Constr. Build. Mater. 2017, 140, 293–300. [Google Scholar] [CrossRef]
  16. Zhu, J. High Temperature Resistance of Alkali Slag Cementitious Materials and Its Application in Engineering. Ph.D.Thesis, Harbin Institute of Technology, Harbin, China, 2014. [Google Scholar]
  17. Fu, X.; Hou, W.; Yang, C.; Li, D.; Wu, X. Studies on Portland cement with large amount of slag. Cem. Concr. Res. 2000, 30, 645–649. [Google Scholar] [CrossRef]
  18. Escalante, J.I.; Gómez, L.Y.; Johal, K.K.; Mendoza, G.; Mancha, H.; Méndez, J. Reactivity of blast-furnace slag in Portland cement blends hydrated under different conditions. Cem. Concr. Res. 2001, 31, 1403–1409. [Google Scholar] [CrossRef]
  19. Agyei, N.M.; Strydom, C.A.; Potgieter, J.H. The removal of phosphate ions from aqueous solution by fly ash, slag, ordinary Portland cement and related blends. Cem. Concr. Res. 2002, 32, 1889–1897. [Google Scholar] [CrossRef]
  20. Motz, H.; Geiseler, J. Products of steel slags an opportunity to save natural resources. Waste Manag. 2001, 21, 285. [Google Scholar] [CrossRef]
  21. Vuk, T.; Tinta, V.; Gabrovšek, R.; Kaučič, V. The effects of limestone addition, clinker type and fineness on properties of Portland cement. Cem. Concr. Res. 2001, 31, 135–139. [Google Scholar] [CrossRef]
  22. He, X.; Ma, M.; Su, Y.; Lan, M.; Zheng, Z.; Wang, T.; Strnadela, B.; Zeng, S. The effect of ultrahigh volume ultrafine blast furnace slag on the properties of cement pastes. Constr. Build. Mater. 2018, 189, 438–447. [Google Scholar] [CrossRef]
  23. Yin, K.; Ahamed, A.; Lisak, G. Experimental investigation on the relationship between pore characteristics and unconfined compressive strength of cemented paste backfill. Waste Manag. 2018, 78, 401–416. [Google Scholar] [CrossRef]
  24. Cihangir, F.; Ercikdi, B.; Kesimal, A.; Turan, A.; Deveci, H. Utilisation of alkali-activated blast furnace slag in paste backfill of high-sulphidemill tailings: Effect of binder type and dosage. Miner. Eng. 2012, 30, 33–43. [Google Scholar] [CrossRef]
  25. Haha, M.B.; Lothenbach, B.; Saout, L.; Winnefeld, F. Influence of slag chemistry on the hydration of alkali-activated blast-furnace slag—Part I: Effect of MgO. Cem. Concr. Res. 2011, 41, 955–963. [Google Scholar] [CrossRef]
  26. Yang, S.; Arvanitis, A.; Cao, Z.; Sun, X.; Dong, J. Synthesis of Silicalite Membrane with an Aluminum-Containing Surface for Controlled Modification of Zeolitic Pore Entries for Enhanced Gas Separation. Processes 2018, 6, 13. [Google Scholar] [CrossRef]
  27. To, A. Characterization of Microscopic Pore Structures of Rock Salt through Mercury Injection and Nitrogen Absorption Tests. Geofluids 2018, 2018, 9427361. [Google Scholar] [CrossRef]
  28. Pokharel, M.; Fall, M. Combined influence of sulphate and temperature on the saturated hydraulic conductivity of hardened cemented paste backfill. Cem. Concr. Compos. 2013, 38, 21–28. [Google Scholar] [CrossRef]
  29. Bentz, D.P. A review of early-age properties of cement-based materials. Cem. Concr. Res. 2008, 38, 196–204. [Google Scholar] [CrossRef] [Green Version]
  30. Tian, B.; Cohen, M.D. Does gypsum formation during sulfate attack on concrete lead to expansion? Cem. Concr. Res. 2000, 30, 117–123. [Google Scholar] [CrossRef]
  31. Zhu, G.; Zheng, H.; Zhang, Z.; Tshukudu, T.; Zhang, P.; Xiang, X. Characterization and coagulation–flocculation behavior of polymeric aluminum ferric sulfate (PAFS). Chem. Eng. J. 2011, 178, 50–59. [Google Scholar] [CrossRef]
  32. Yang, X.; Wang, J.; Hou, D.; Zhu, C.; He, M. Effect of Dry-Wet Cycling on the Mechanical Properties of Rocks: A Laboratory-Scale Experimental Study. Processes 2018, 6, 199. [Google Scholar] [CrossRef]
  33. You, Z.; Lai, Y.; Zhang, M.; Liu, E. Quantitative analysis for the effect of microstructure on the mechanical strength of frozen silty clay with different contents of sodium sulfate. Environ. Earth Sci. 2017, 76, 143. [Google Scholar] [CrossRef]
  34. Wu, S.; Yang, J.; Yang, R.; Zhu, J.; Liu, S.; Wang, C. Investigation of microscopic air void structure of anti-freezing asphalt pavement with X-ray CT and MIP. Constr. Build. Mater. 2018, 178, 473–483. [Google Scholar] [CrossRef]
  35. Ghirian, A.; Fall, M. Coupled Behavior of Cemented Paste Backfill at Early Ages. Geotech. Geol. Eng. 2015, 33, 1141–1166. [Google Scholar] [CrossRef]
  36. Zhang, Z.L.; Cui, Z.D. Effects of freezing-thawing and cyclic loading on pore size distribution of silty clay by mercury intrusion porosimetry. Cold Reg. Sci. Technol. 2018, 145, 185–196. [Google Scholar] [CrossRef]
  37. Cui, Z.; Tang, Y. Microstructures of different soil layers caused by the high-rise building group in Shanghai. Environ. Earth Sci. 2011, 63, 109–119. [Google Scholar] [CrossRef]
  38. Zhang, L.M.; Li, X. MicroPorosity Structure of Coarse Granular Soils. J. Geotech. Geoenviron. Eng. 2010, 136, 1425–1436. [Google Scholar] [CrossRef]
  39. Cui, L.; Fall, M. An evolutive elasto-plastic model for cemented paste backfill. Comput. Geotech. 2016, 71, 19–29. [Google Scholar] [CrossRef]
  40. Zhou, Q.; Glasser, F. Thermal Stability and Decomposition Mechanisms of Ettringite at <120 °C. Cem. Concr. Res. 2001, 31, 1333–1339. [Google Scholar] [CrossRef]
  41. Alarconruiz, L.; Platret, G.; Massieu, E.; Ehrlacher, A. The use of thermal analysis in assessing the effect of temperature on a cement paste. Cem. Concr. Res. 2005, 35, 609–613. [Google Scholar] [CrossRef]
  42. Fall, M.; Célestin, J.C.; Pokharel, M.; Touré, M. A contribution to understanding the effects of curing temperature on the mechanical properties of mine cemented tailings backfill. Eng. Geol. 2010, 114, 397–413. [Google Scholar] [CrossRef]
Figure 1. The TYE-300D and sample. (a) The TYE-300D test instrument; (b) the experiment bench; (c) the sample.
Processes 07 00047 g001
Figure 2. The Empyrean Diffractometer and sample. (a) The experiment bench; (b) the sample; (c) the X-ray diffraction (XRD) analyzer.
Processes 07 00047 g002
Figure 3. STA449F3 and samples. (a) The experiment bench; (b) the thermal gravity (TG) analyzer; (c) the samples.
Processes 07 00047 g003
Figure 4. The JSM-7001F and samples. (a) The scanning electron microscope (SEM); (b) the experiment bench; (c) the samples.
Processes 07 00047 g004
Figure 5. The AutoPore IV and sample. (a) Mercury intrusion porosimetry; (b) the high-pressure test pipeline; (c) the low-pressure test pipeline; (d) the sample.
Processes 07 00047 g005
Figure 6. XRD images of NCM and OPC for 7 days of curing time (NCM: new cement-based material; OPC: ordinary Portland cement).
Processes 07 00047 g006
Figure 7. XRD images of NCM and OPC for 28 days of curing time.
Processes 07 00047 g007
Figure 8. TG/ differential thermal gravimetric (DTG) images of NCM and OPC for 7 days of curing time.
Processes 07 00047 g008
Figure 9. TG/DTG images of NCM and OPC for 28 days of curing time.
Processes 07 00047 g009
Figure 10. SEM images of samples with NCM and OPC for 3 days of curing time.
Processes 07 00047 g010
Figure 11. SEM images of samples with NCM and OPC for 7 days of curing time.
Processes 07 00047 g011
Figure 12. SEM images of NCM and OPC samples for 28 days of curing time.
Processes 07 00047 g012
Figure 13. The intrusion and extrusion curves for samples with different cement materials and curing time.
Processes 07 00047 g013
Figure 14. The log-derivative pore volume curves for samples with different cement materials and curing time.
Processes 07 00047 g014
Table 1. Physical properties of the materials.
Element Unitd10/μmd30/μmd50/μmd60/μmd90/μmCuCc
Tailings14.5526.6138.3254.2782.333.730.89
Table 2. Main chemical properties of the materials (OPC: ordinary Portland cement).
Element UnitMgO
(wt.%)
Al2O3
(wt.%)
SiO2
(wt.%)
CaO
(wt.%)
SO3
(wt.%)
Fe2O3
(wt.%)
Total
Tailings2.413.8582.052.460.188.0198.96
Slag8.3814.7933.8136.950.280.8995.09
Clinker2.454.4722.0164.312.453.4599.14
Gypsum2.140.120.9845.8542.450.1191.66
Lime0.560.230.3872.290.130.2673.84
OPC2.1915.4921.8663.592.422.6696.97
Table 3. Orthogonal test table and uniaxial compressive strength (UCS) results.
NumberingConcentration (%)w/cCementitious Material Mass Fraction (%)Compressive Strength (Mpa)
X1X2X3X43 Day7 Day28 Day
H-1785.6:11248760.6071.3842.536
H-2785.6:112610720.8611.8792.623
H-3785.6:112812680.8111.8352.466
H-4785.6:114410720.8631.6262.502
H-5785.6:114612680.8961.9412.673
H-6785.6:11488700.7071.8262.549
H-7785.6:116412680.7241.2731.774
H-8785.6:11668700.7261.6112.333
H-9785.6:116810660.7821.7662.303
Where X1 denotes clinker, X2 deontes lime, X3 denotes gypsum and X4 denotes blast furnace slag (BFS).
Table 4. Range analysis results for the UCS data.
Ages/DayFactorClinkerLimeGypsumInfluence SequenceOptimum Combination
3Average of UCS/MPaLevel 10.7600.7310.680X3 > X2 > X1X1(Level 2) X2(Level 2) X3(Level 2)
Level 20.8690.8750.835
Level 30.7440.7670.810
R 1/MPa0.1250.1440.178
7Average of UCS/MPaLevel 11.6991.4281.607X2 > X1 > X3X1(Level 2) X2(Level 2) X3(Level 2)
Level 21.7981.8101.757
Level 31.5501.8091.683
R/MPa0.2480.3820.150
28Average of UCS/MPaLevel 12.5422.2712.473X1 > X2 > X3X1(Level 2) X2(Level 2) X3(Level 2)
Level 22.5752.5432.476
Level 32.1372.4392.304
R/MPa0.4380.2720.172
1 R = the difference between maximum value and minimum value.
Table 5. Variance analysis results.
Ages/DaySource of VarianceDeviationDegrees of FreedomMean Square DeviationFSignificanceClosure Probability
3X10.02820.0148.225X3 > X2 > X10.108
X20.03420.0179.8840.092
X30.05620.02816.5180.057
Error0.00320.002
7X10.09320.04738.231X2 >X1 > X30.025
X20.29220.146119.5780.008
X30.03420.01713.8290.067
Error0.00220.001
28X10.35720.1786.544X1 > X2 >X30.133
X20.11320.0572.0780.325
X30.05820.0291.0600.485
Error0.05520.027
Table 6. The results of UCS with OPC and new cement-based material (NCM).
Cementitious MaterialsThe UCS
3 Day7 Day28 Day
Samples with NCM0.5451.4532.181
Samples with OPC0.3440.8531.943

