Investigation of Nonthermal Plasma Assisted Charcoal Gasification for Production of Hydrogen-Rich Syngas


Abstract
:
1. Introduction
2. Experiments
2.1. Concept
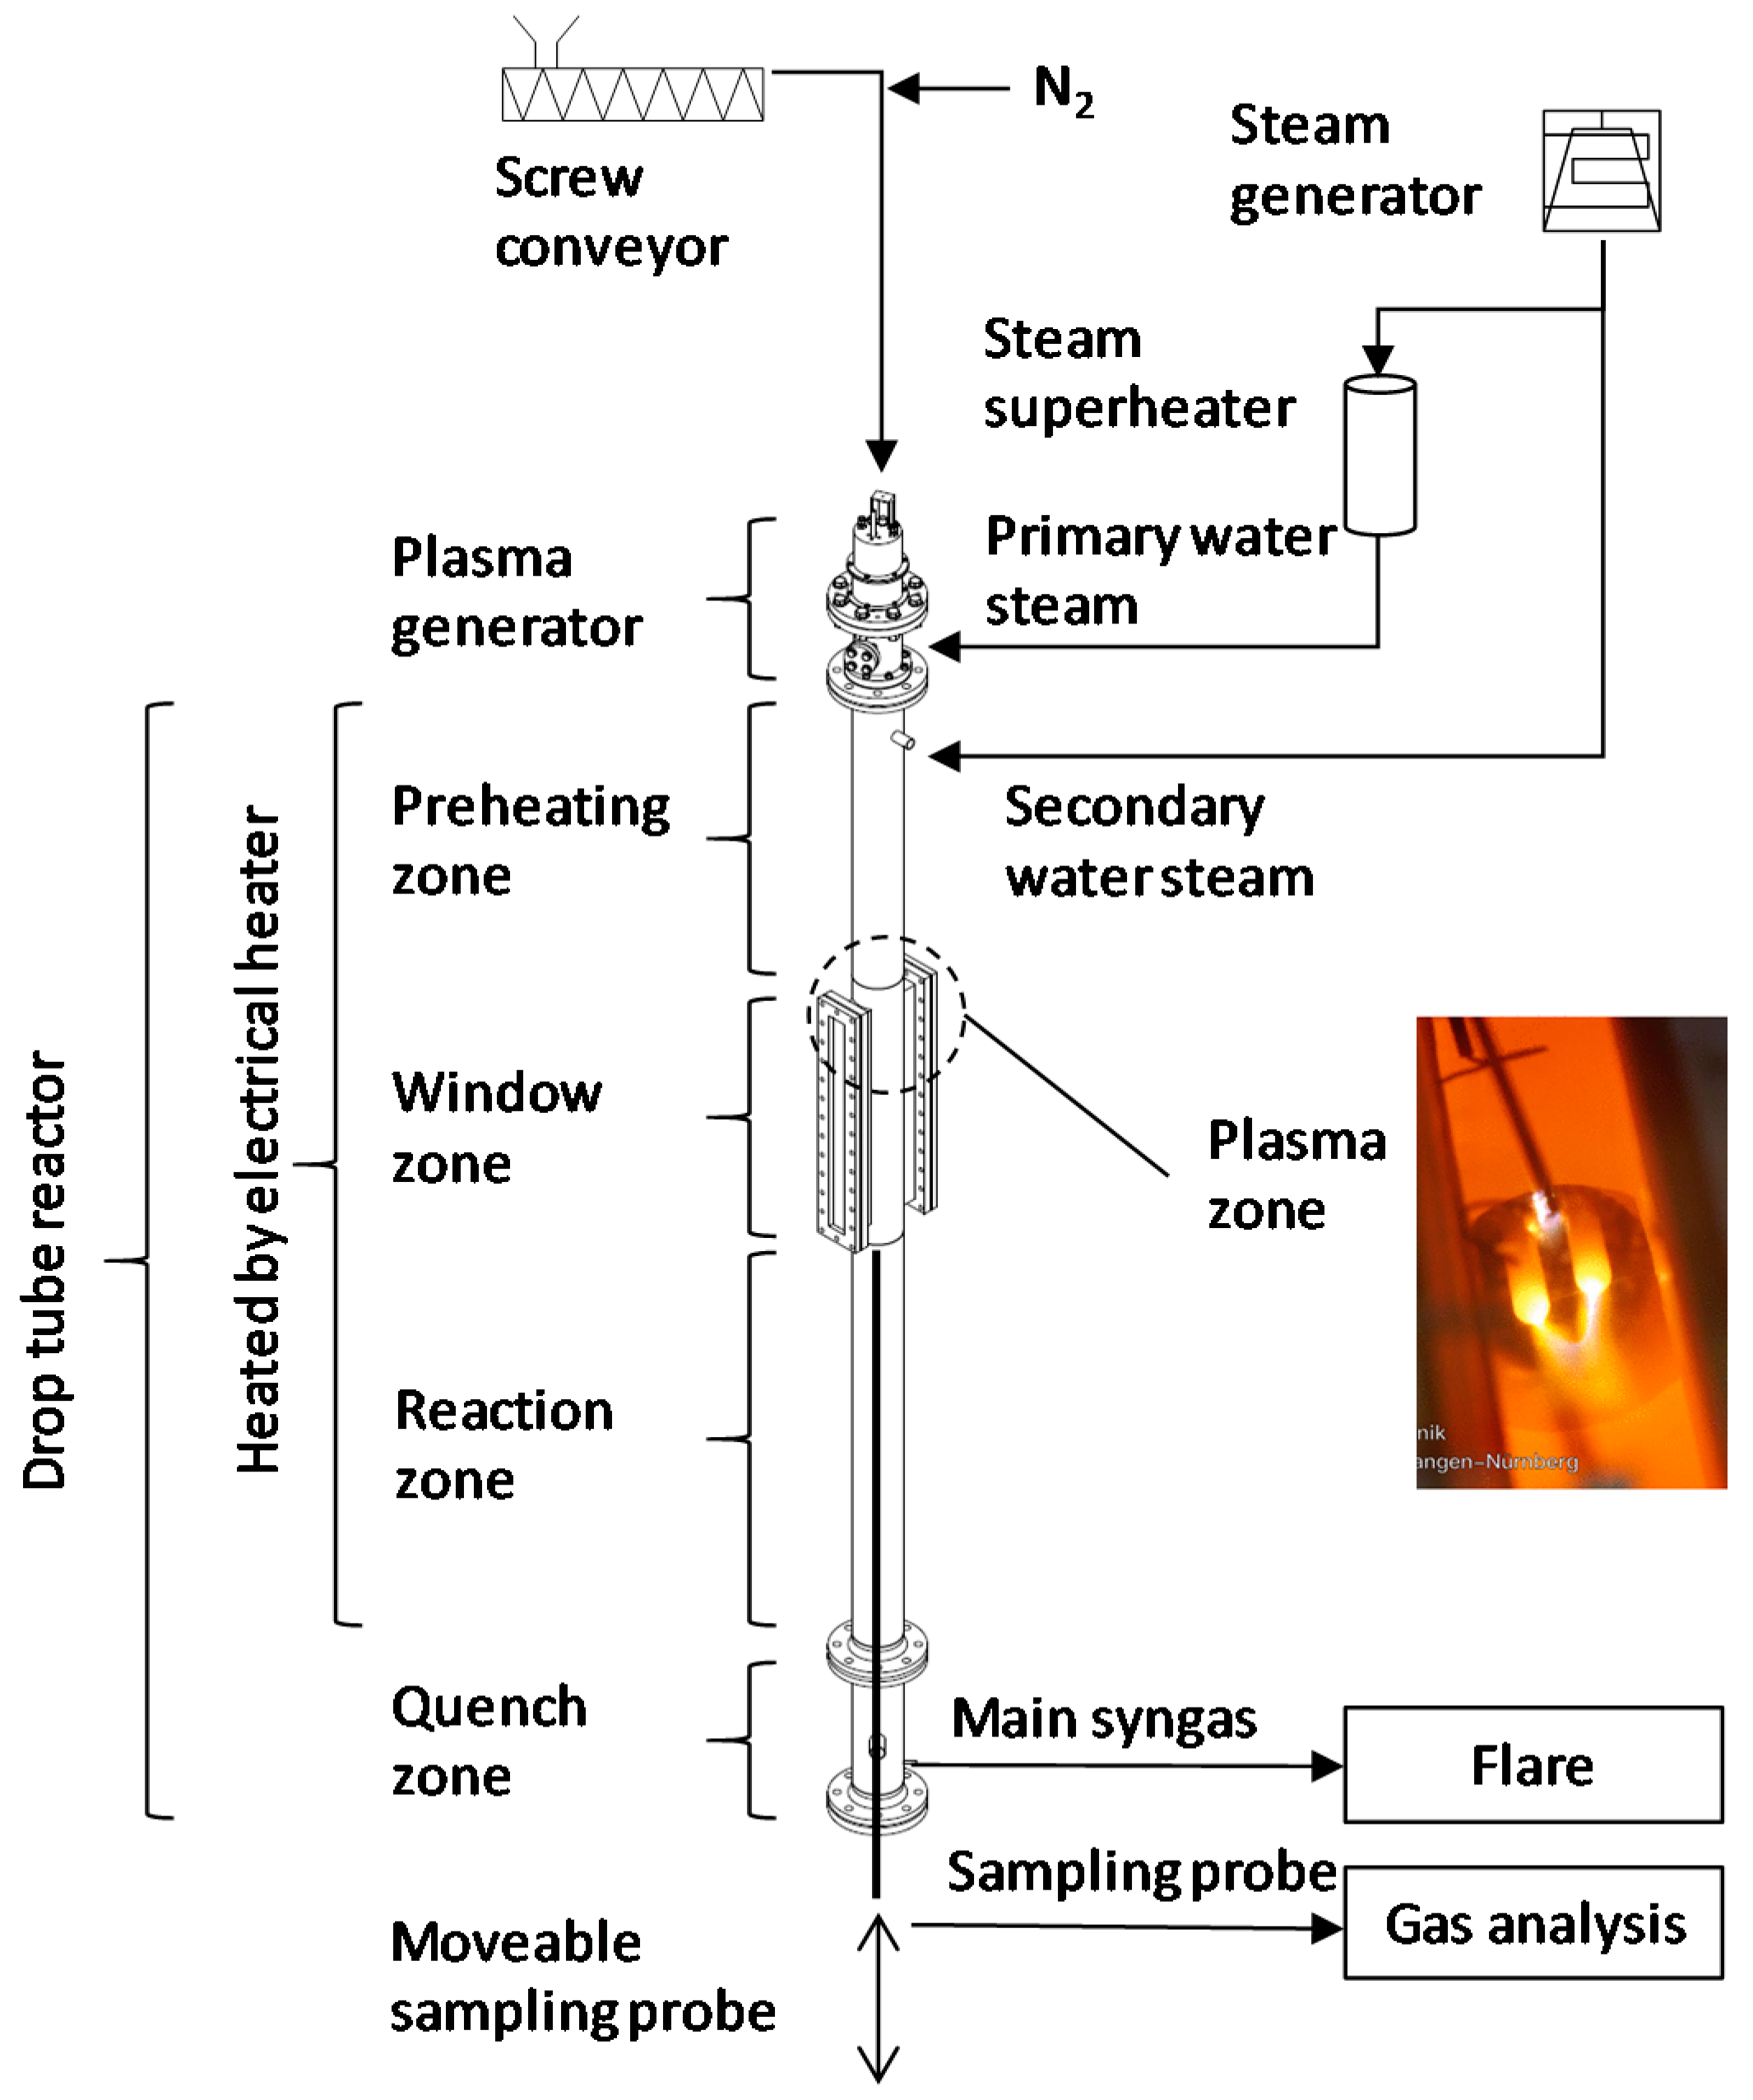
2.2. Test-Rig
2.3. Test Conditions
3. Results
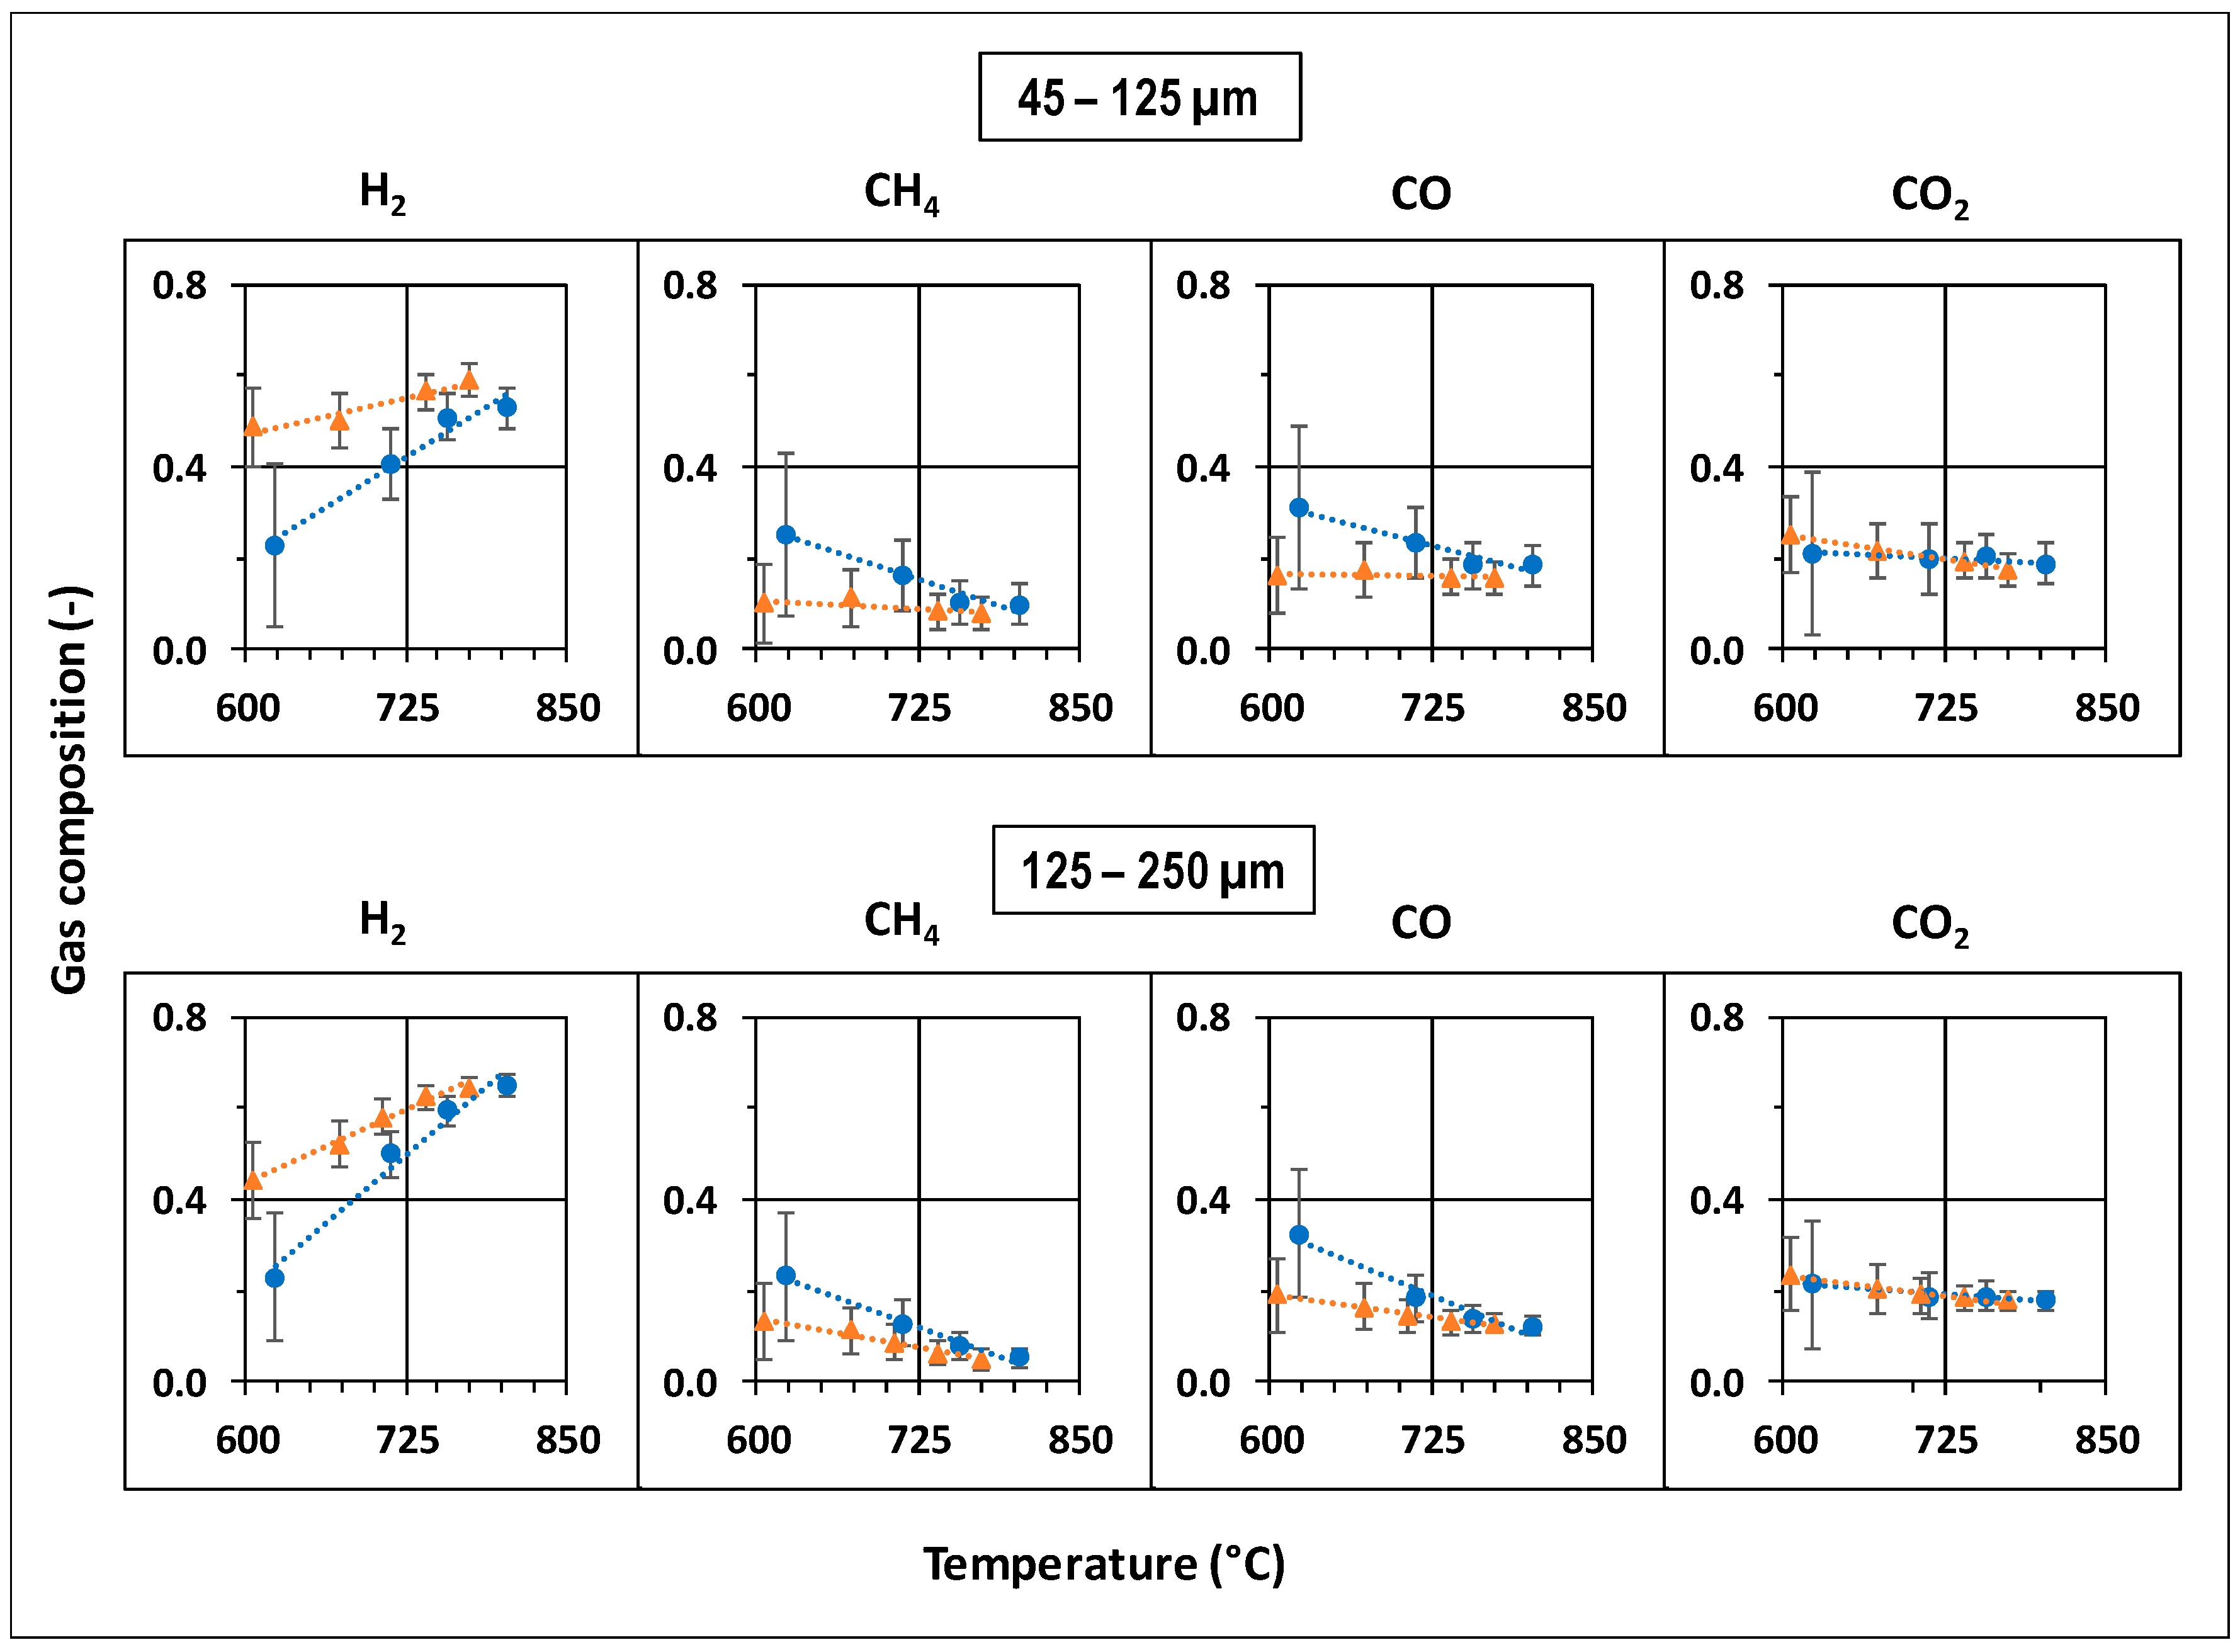
3.1. Syngas Composition
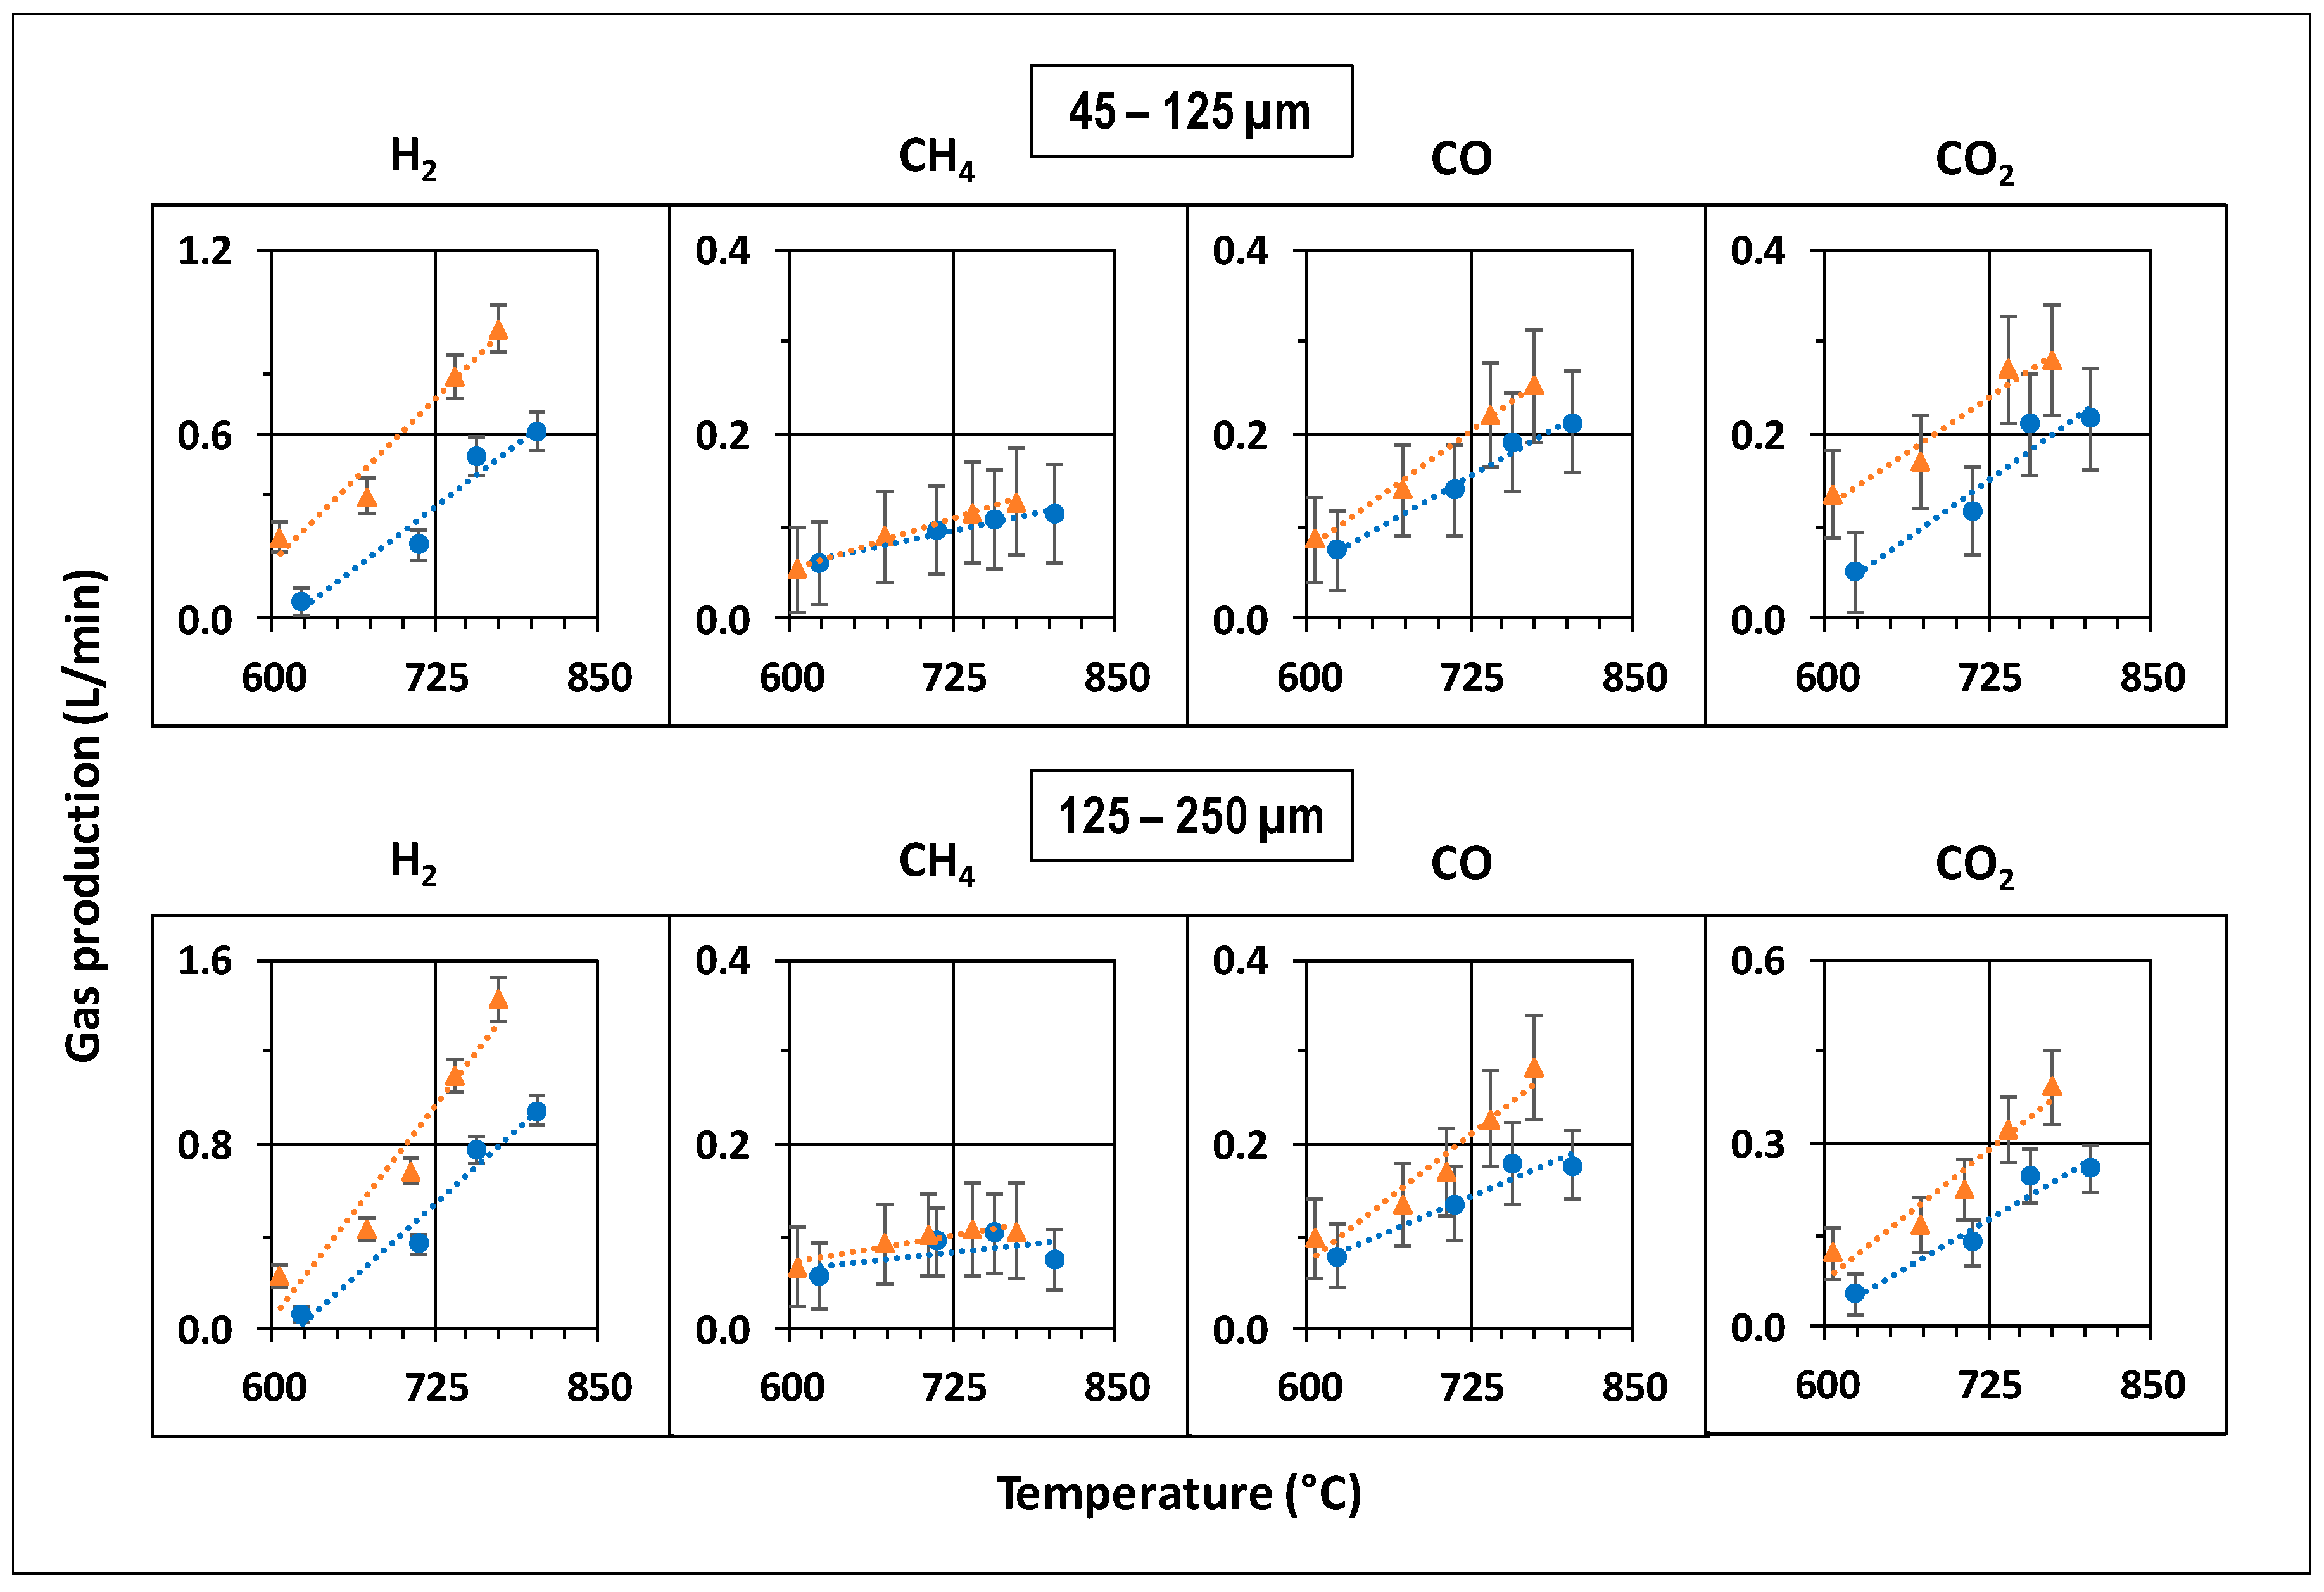
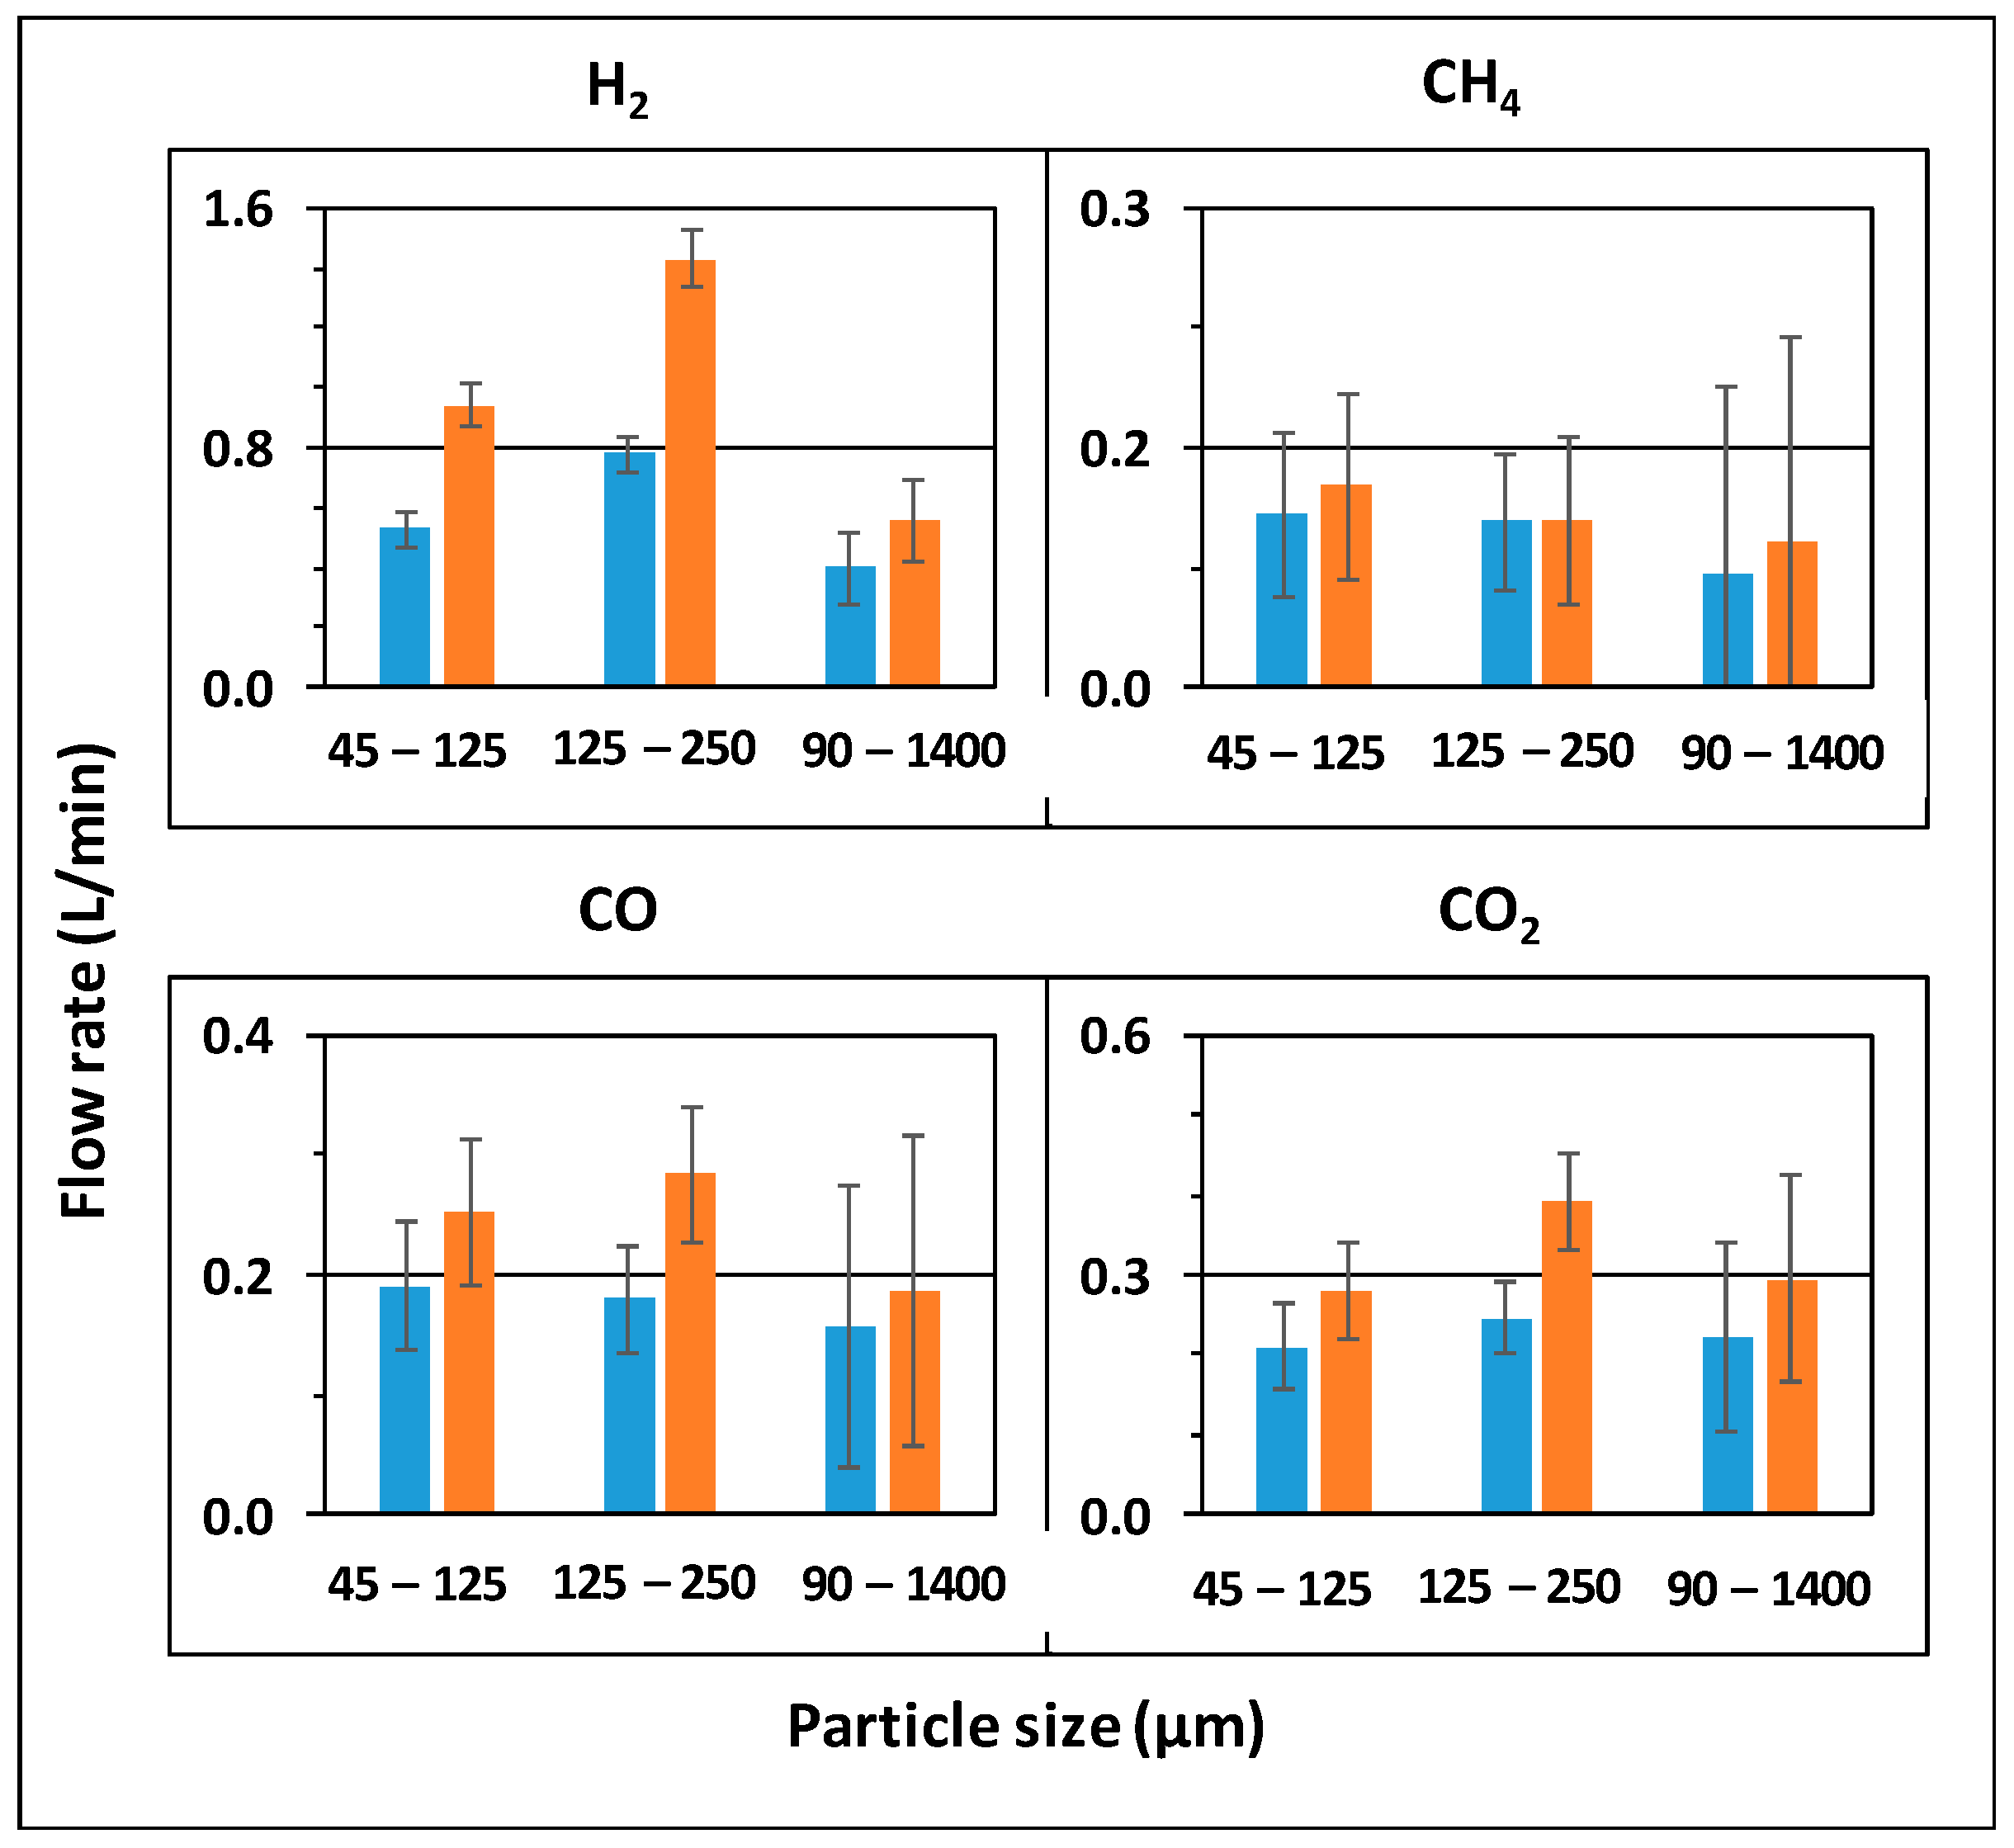
3.2. Syngas Production
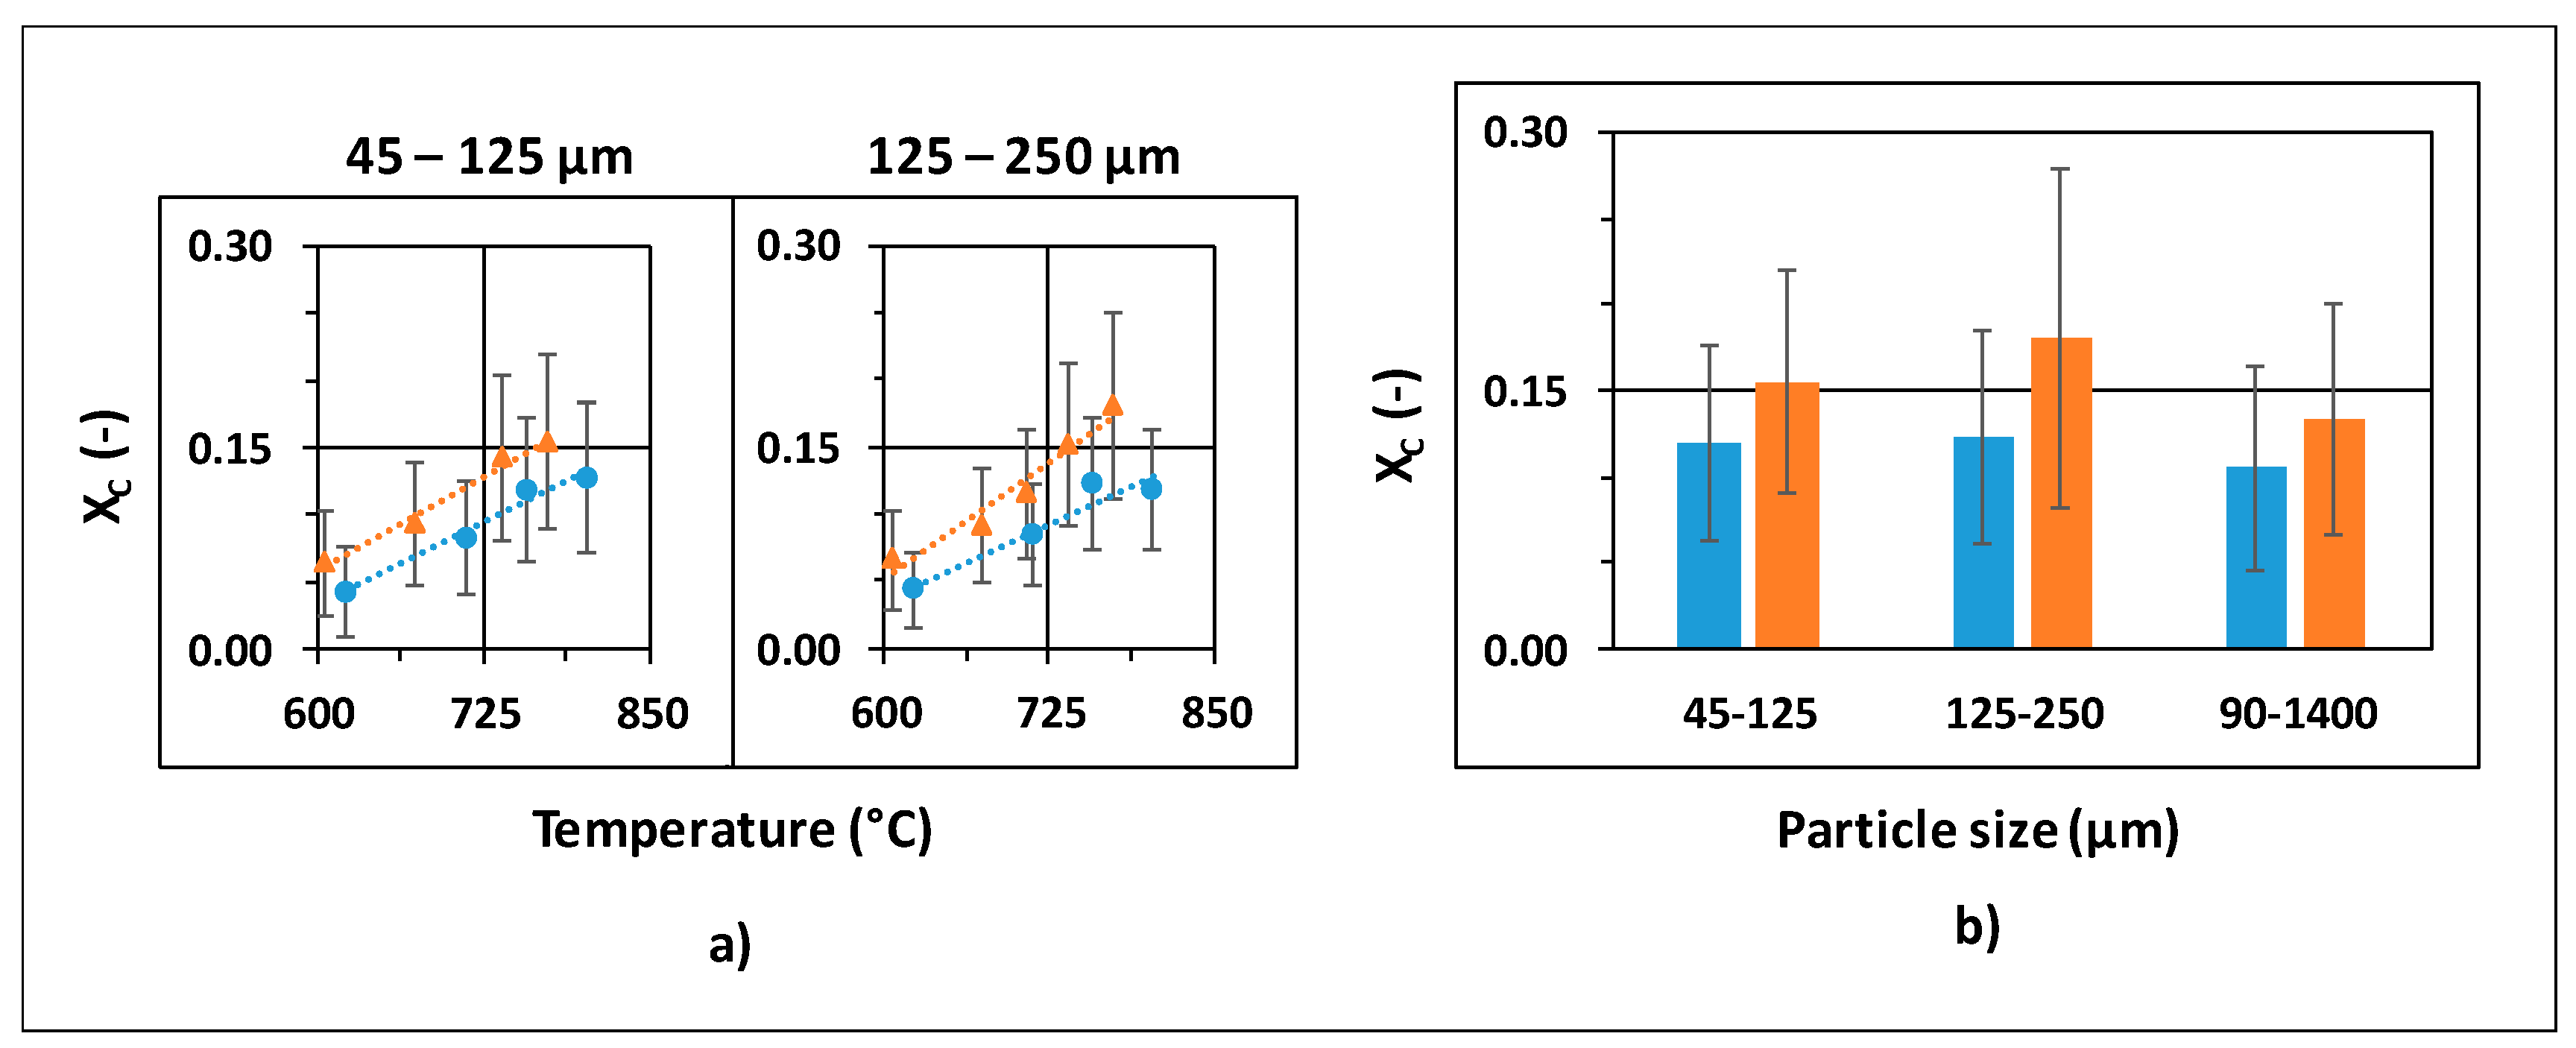
3.3. Carbon Conversion
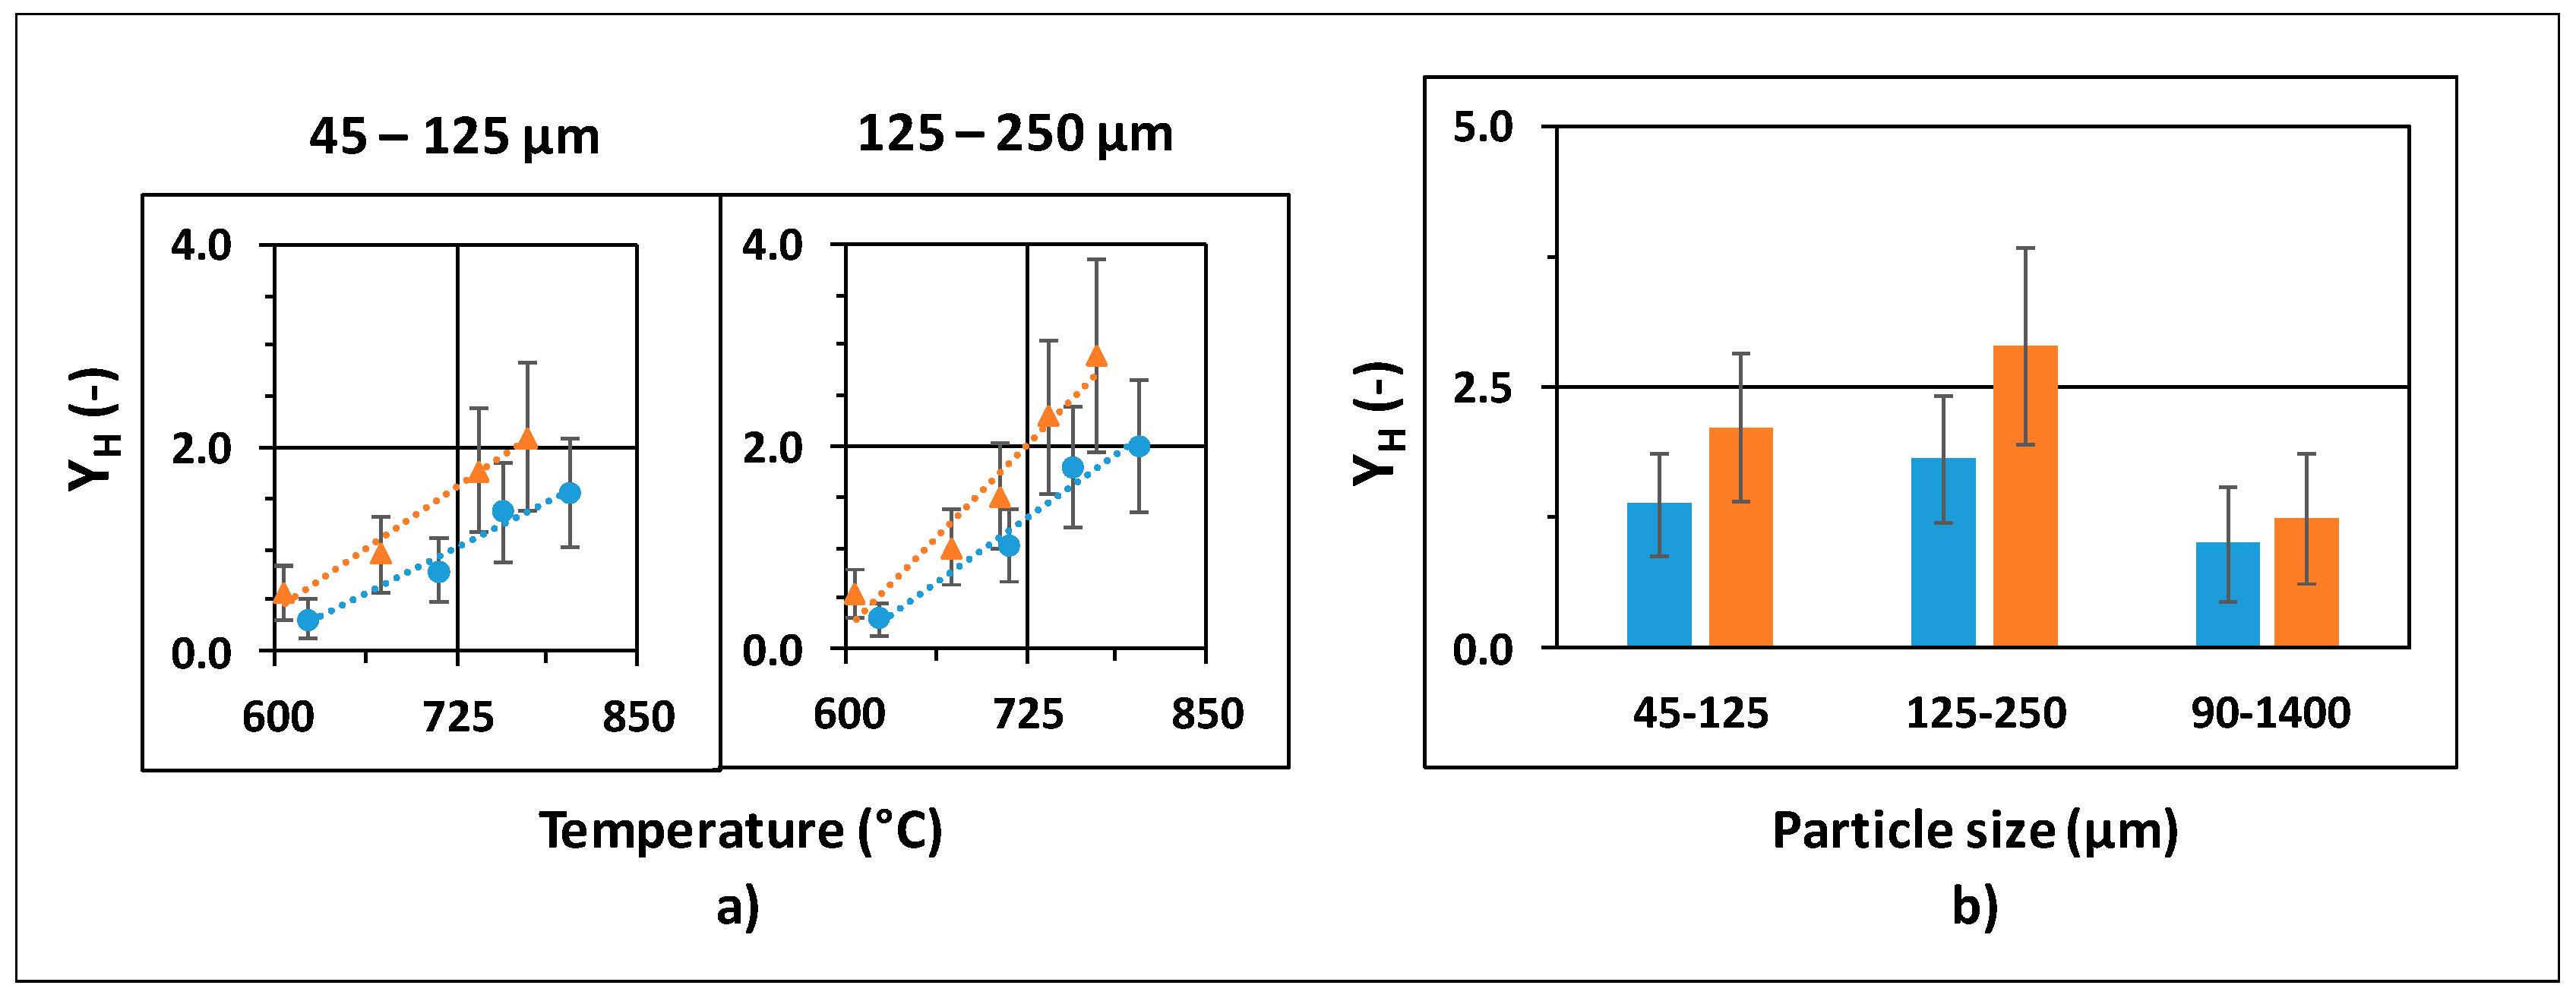
3.4. Hydrogen Release
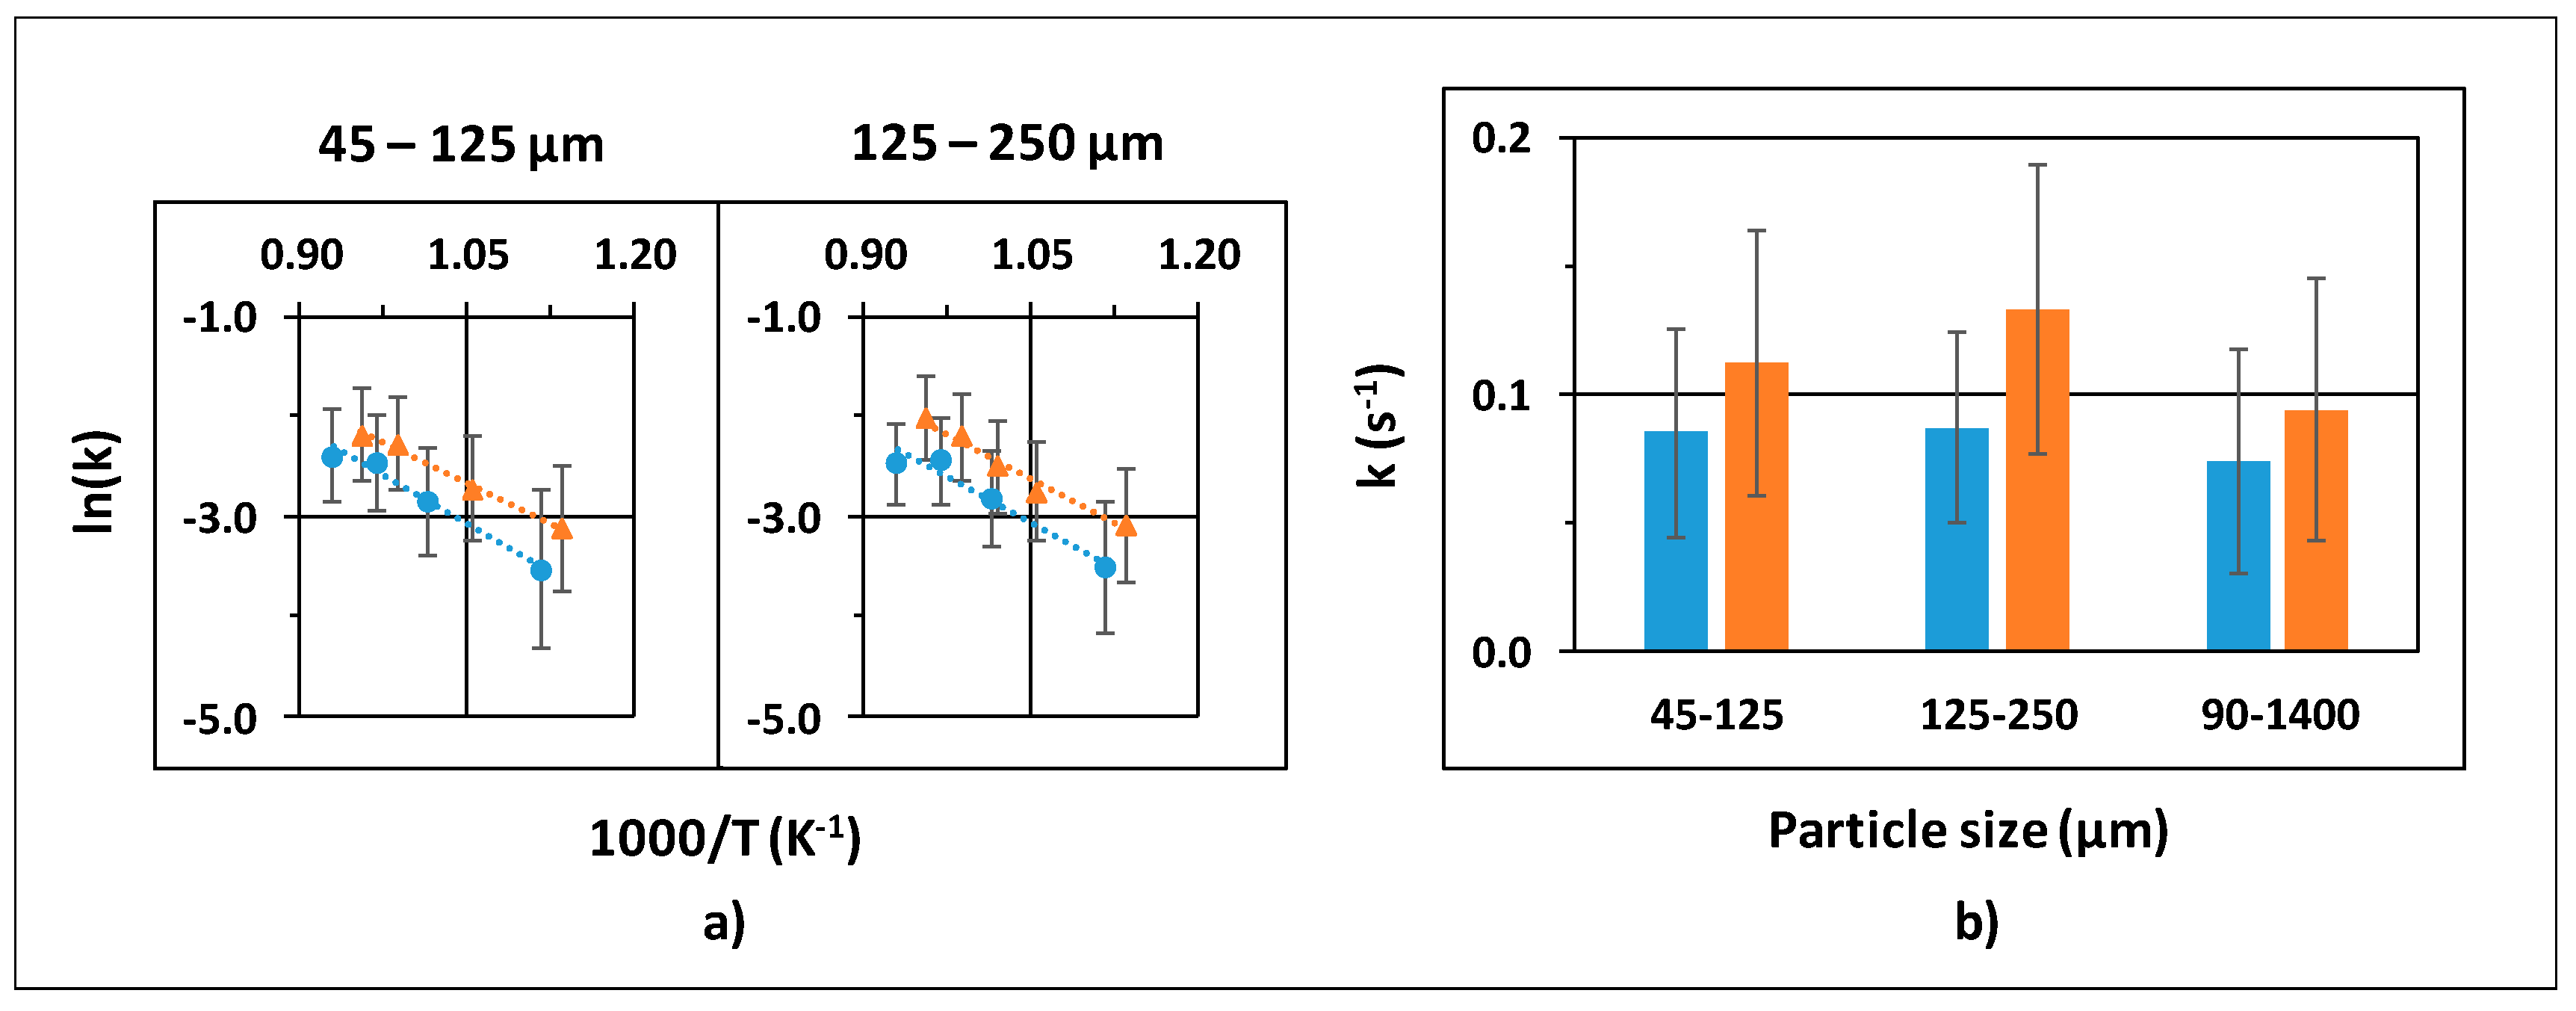
3.5. Reaction Kinetics
3.6. Cold Gas Efficiency
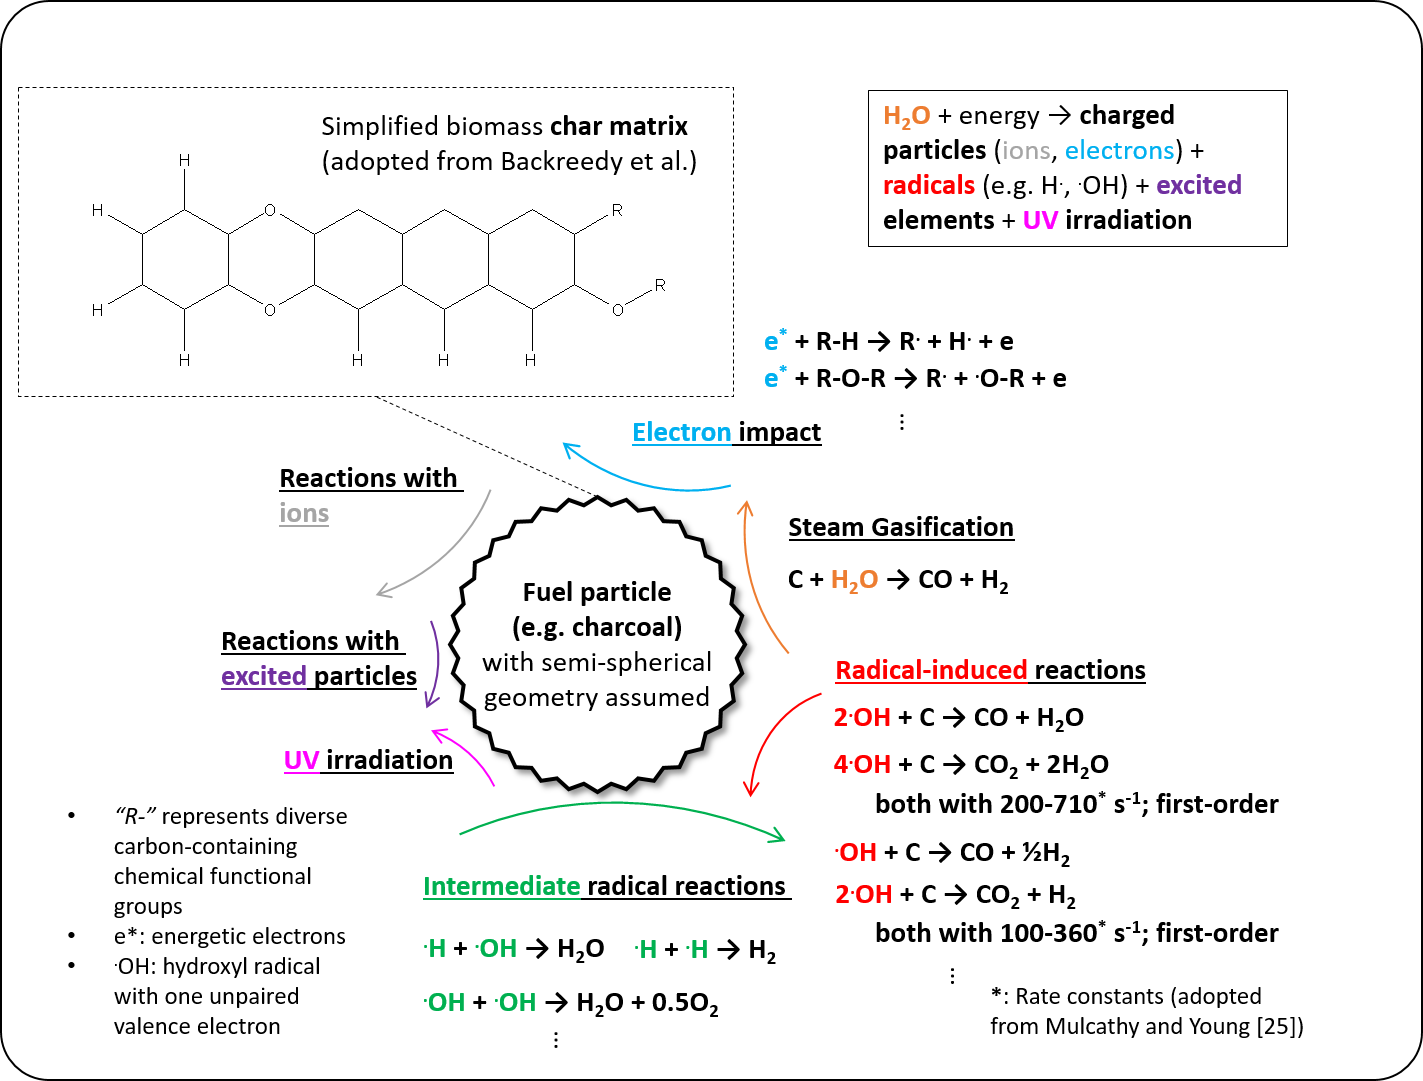
3.7. Proposed Reacton Mechanism Based on Literature and Own Results
radicals (e.g., ·H, ·OH) + charged particles (e.g., e−, H+, OH−) + excited particles
+ UV irradiation
4. Conclusions
Author Contributions
Acknowledgments
Conflicts of Interest
Nomenclature
| A | Pre-exponential factor |
| BDE | Bond dissociation energy |
| CGE | Cold gas efficiency |
| DC | Direct current |
| EA | Activation energy |
| k | Reaction rate coefficient |
| Carbon mass flow of carbon monoxide | |
| Carbon mass flow of carbon dioxide | |
| Carbon mass flow of methane | |
| Carbon mass flow of feedstock | |
| Hydrogen mass flow of feedstock | |
| Hydrogen mass flow of hydrogen | |
| Hydrogen mass flow of methane | |
| Hydrogen mass flow from the plasma-assisted water dissociation | |
| NTP | Nonthermal plasma |
| R | Gas constant |
| S/C | Steam to carbon |
| T | Temperature |
| XC | Syngas-based carbon conversion |
| YH | Syngas-based hydrogen release |
References
- Karl, J. Dezentrale Energiesysteme, Neue Technologien im liberalisierten Energiemarkt; De Gruyter: Berlin, Germany, 2012. [Google Scholar]
- Karl, J.; Pröll, T. Steam gasification of biomass in dual fluidized bed gasifiers: A review. Renew. Sustain. Energy Rev. 2018, 98, 64–78. [Google Scholar] [CrossRef]
- Li, R.; Zhang, J.; Wang, G.; Ning, X.; Wang, H.; Wang, P. Study on CO2 gasification reactivity of biomass char derived from high-temperature rapid pyrolysis. Appl. Therm. Eng. 2017, 121, 1022–1031. [Google Scholar] [CrossRef]
- Bui, H.-H.; Wang, L.; Tran, K.-Q.; Skreiberg, Ø. CO2 gasification of charcoals produced at various pressure. Fuel Process. Technol. 2016, 152, 207–214. [Google Scholar] [CrossRef]
- Yuan, S.; Chen, X.; Li, J.; Wang, F. CO2 Gasification Kinetics of Biomass Char Derived from High-Temperature Rapid Pyrolysis. Energy Fuels 2011, 25, 2314–2321. [Google Scholar] [CrossRef]
- Wang, G.; Zhang, J.; Shao, J.; Liu, Z.; Wang, H.; Li, X. Experimental and modeling studies on CO2 gasification of biomass chars. Energy 2016, 114, 143–154. [Google Scholar] [CrossRef]
- Dahou, T.; Defoort, F.; Thiéry, S.; Grateau, M.; Campargue, M.; Bennici, S.; Jeguirim, M.; Dupont, C. The Influence of Char Preparation and Biomass Type on Char Steam Gasification Kinetics. Energies 2018, 11, 2126. [Google Scholar] [CrossRef]
- Yoon, S.J.; Lee, J.-G. Hydrogen-rich syngas production through coal and charcoal gasification using microwave steam and air plasma torch. Int. J. Hydrog. Energy 2012, 37, 17093–17100. [Google Scholar] [CrossRef]
- Guizani, C.; Jeguirim, M.; Gadiou, R.; Sanz, F.J.E.; Salvador, S. Biomass char gasification by H2O, CO2 and their mixture: Evolution of chemical, textural and structural properties of the chars. Energy 2016, 112, 133–145. [Google Scholar] [CrossRef]
- Reschmeier, R.; Karl, J. Experimental study of wood char gasification kinetics in fluidized beds. Biomass Bioenergy 2016, 85, 288–299. [Google Scholar] [CrossRef]
- Bouraoui, Z.; Dupont, C.; Jeguirim, M.; Limousy, L.; Gadiou, R. CO2 gasification of woody biomass chars: The influence of K and Si on char reactivity. C. R. Chim. 2016, 19, 457–465. [Google Scholar] [CrossRef]
- Hengel, T.L.T.D.; Walker, P.L., Jr. Catalysis of lignite char gasification by exchangeable calcium and magnesium. Fuel 1984, 63, 1214–1220. [Google Scholar] [CrossRef]
- Tamošiūnas, A.; Chouchène, A.; Valatkevičius, P.; Gimžauskaitė, D.; Aikas, M.; Uscila, R.; Ghorbel, M.; Jeguirim, M. The Potential of Thermal Plasma Gasification of Olive Pomace Charcoal. Energies 2017, 10, 710. [Google Scholar] [CrossRef]
- Zhu, J.; Ehn, A.; Gao, J.; Kong, C.; Aldén, M.; Salewski, M.; Leipold, F.; Kusano, Y.; Li, Z. Translational, rotational, vibrational and electron temperatures of a gliding arc discharge. Opt. Express 2017, 25, 20243–20257. [Google Scholar] [CrossRef] [PubMed]
- Bahr, L.A.; Fendt, P.; Pang, Y.; Karl, J.; Hammer, T.; Braeuer, A.S.; Will, S. Temperature determination of superheated water vapor by rotational-vibrational Raman spectroscopy. Opt. Lett. 2018, 43, 4477–4480. [Google Scholar] [CrossRef] [PubMed]
- Pang, Y.; Bahr, L.; Fendt, P.; Zigan, L.; Will, S.; Hammer, T.; Baldauf, M.; Fleck, R.; Müller, D.; Karl, J. Plasma-Assisted Biomass Gasification with Focus on Carbon Conversion and Reaction Kinetics Compared to Thermal Gasification. Energies 2018, 11, 1302. [Google Scholar] [CrossRef]
- Prüfung fester Brennstoffe—Bestimmung des Wassergehaltes und der Analysenfeuchtigkeit (DIN 51718:2002-06); Beuth-Verlag: Berlin, Germany, 2002.
- Prüfung fester Brennstoffe—Bestimmung des Aschegehaltes (DIN 51719:1997-07); Beuth-Verlag: Berlin, Germany, 1997.
- Prüfung fester Brennstoffe—Bestimmung des Gehaltes an Flüchtigen Bestandenteilen (DIN 51720:2001-03); Beuth-Verlag: Berlin, Germany, 2001.
- Prüfung fester Brennstoffe—Immediatanalyse und Berechnung des Fixen Kohlenstoffs (DIN 51734:2008-12); Beuth-Verlag: Berlin, Germany, 2008.
- Prüfung fester Brennstoffe—Bestimmung des Gesamtgehaltes an Kohlenstoff, Wasserstoff und Stickstoff-Instrumentelle Methoden (DIN 51732:2014-07); Beuth-Verlag: Berlin, Germany, 2014.
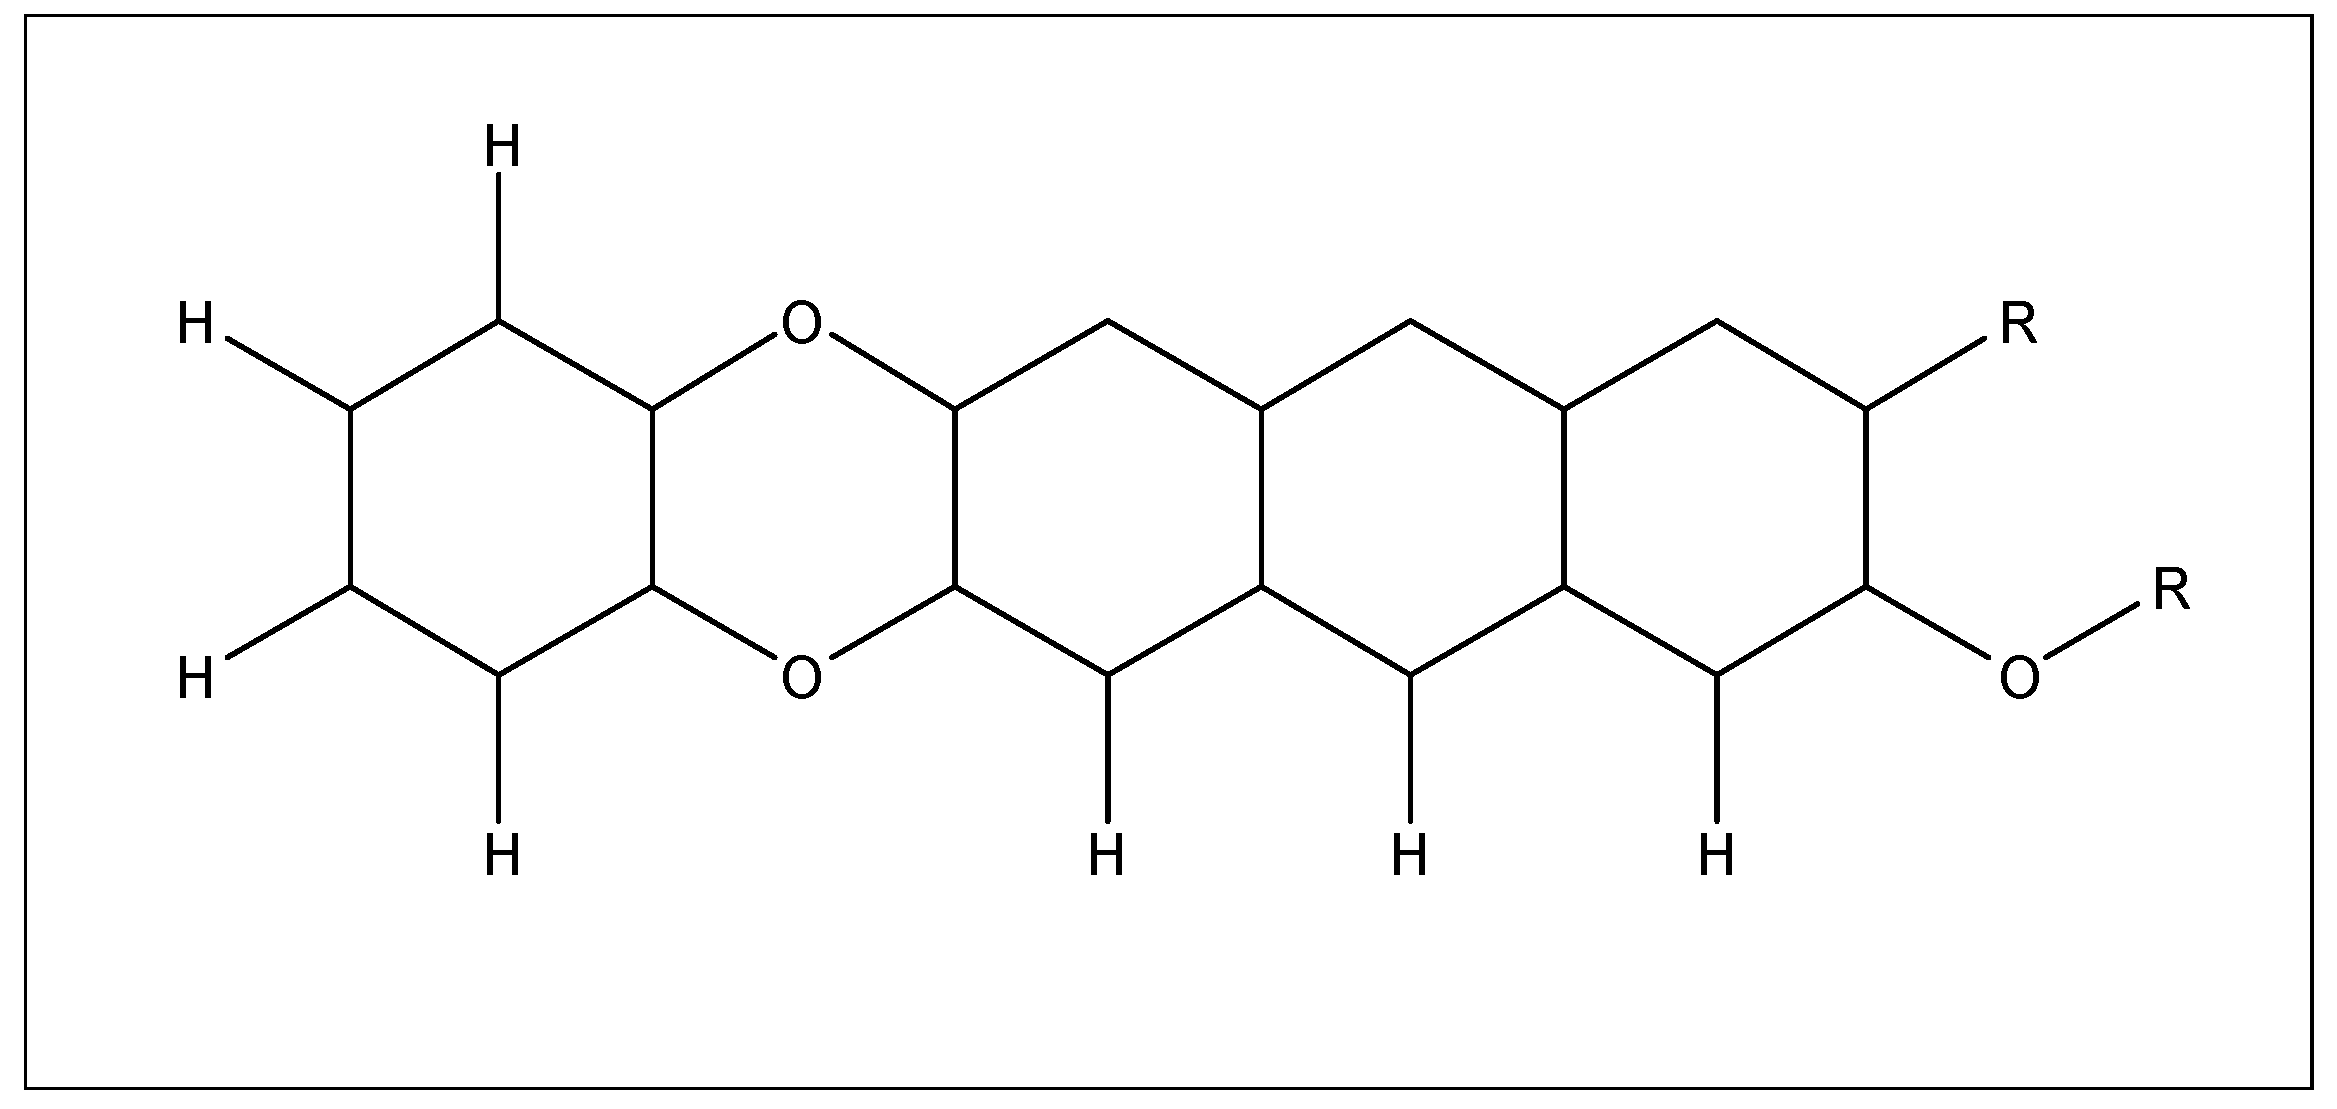
- Backreedy, R.I.; Jones, J.M.; Pourkashanian, M.; Williams, A. Modeling the reaction of oxygen with coal and biomass chars. Proc. Combust. Inst. 2002, 29, 415–421. [Google Scholar] [CrossRef]
- Braithwaite, N.S.J. Introduction to gas discharges. Plasma Sources Sci. Technol. 2000, 9, 517. [Google Scholar] [CrossRef]
- Fridman, A. Plasma Chemistry; Cambridge University Press: Philadelphia, PA, USA, 2008. [Google Scholar]
- Wired Chemist—Common Bond Energies and Bond Lengths. Available online: http://www.wiredchemist.com/chemistry/data/bond_energies_lengths.html (accessed on 26 September 2018).
- Mulcahy, M.F.R.; Young, B.C. The reaction of hydroxyl radicals with carbon at 298 K. Carbon 1975, 13, 115–124. [Google Scholar] [CrossRef]


| Sources: | This Work | Tamosiunas et al. [13] | Yoon and Lee [8] |
|---|---|---|---|
| Fuel Type | Charcoal (derived from wood) | Charcoal (derived from Olive pomace) | Charcoal (derived from oak) |
| Moisture (wt.%) | 4.6 | 22 | 0.6 |
| Proximate analysis (wt.%, dry) | |||
| Volatile | 21.3 | 17.4 | 27.6 |
| Ash | 2.3 | 5.6 | 1.4 |
| Fixed carbon | 76.4 | 77 | 70.4 |
| Ultimate analysis (wt.%, dry) | |||
| Carbon | 84.5 | 80.4 | 83.3 |
| Hydrogen | 3.1 | 2.9 | 3.6 |
| Nitrogen | 0.5 | 0.4 | 0.4 |
| Oxygen | 9.2 | 16.3 | 11.2 |
| Sources: | This Work | Tamosiunas et al. [13] | Yoon and Lee [8] |
|---|---|---|---|
| Feedstock | |||
| Particle size (µm) | 45–125; 125–250 | <2000 | 75 |
| Mass flow (kg/h) | 0.16 | 4.7 | 1.3 |
| Nitrogen purge (L/min) | 4 | - | - |
| Steam | |||
| Flow rate (kg/h) | 8 | 12.7 | 2.2 |
| Temperature (°C) | 270 (plasma); 650 (thermal) | n.a. | >100 |
| Plasma | |||
| Electric power (kW) | 0.9 (plasma); 0 (thermal) | 50 | 5 |
| Current amplitude (A) | 0.4–0.7 [16] | 180 | n.a. |
| Electric heater | |||
| Heating power (kW) | 2.5 | - | - |
| Reactor | cylindrical | cylindrical | cylindrical |
| Diameter (m) | 0.1 | 0.4 | 0.058 |
| Length (m) | 4 | 1 | 0.1 |
| Wall temperature (°C) | 700–950 | n.a. | n.a. |
| Pressure | atm. | atm. | atm. |
| Sources: | H2 (vol.%) | CO (vol.%) | CH4 (vol.%) | CO2 (vol.%) |
|---|---|---|---|---|
| This work, d = 45–125 mm, p | 58.9 ± 4 | 15.8 ± 4 | 7.9 ± 4 | 17.5 ± 4 |
| This work, d = 45–125 mm, t | 51.0 ± 5 | 18.4 ± 5 | 10.4 ± 5 | 20.3 ± 5 |
| This work, d = 125–250 mm, p | 64.7 ± 2 | 12.8 ± 2 | 4.8 ± 2 | 17.7 ± 2 |
| This work, d = 125–250 mm, t | 59.6 ± 3 | 13.7 ± 3 | 7.9 ± 3 | 18.8 ± 3 |
| Tamosiunas et al. [13] | 41.2 | 13 | - | 18.7 |
| Yoon and Lee [8] | 60 | 17 | 3 | 21 |
| Type of Reaction | Particle Size (µm) | Ea (kJ/mol) | A (s−1) |
|---|---|---|---|
| plasma-assisted | 45–125 | 43.8 | 17.7 |
| thermal | 45–125 | 52.6 | 35.2 |
| plasma-assisted | 125–250 | 49.8 | 38.7 |
| thermal | 125–250 | 50.0 | 25.4 |
| plasma-assisted | 90–1400 | 34.0 | 4.6 |
| thermal | 90–1400 | 38.4 | 6.3 |
| Type of Bonds | BDE (kJ/mol) | BDE (eV) |
|---|---|---|
| H-O | 459 | 4.8 |
| C-H | 411 | 4.3 |
| C-O | 358 | 3.7 |
| C=O | 799 | 8.3 |
| C-C | 346 | 3.6 |
| C=C | 602 | 6.2 |
| C≡C | 835 | 8.7 |
© 2019 by the authors. Licensee MDPI, Basel, Switzerland. This article is an open access article distributed under the terms and conditions of the Creative Commons Attribution (CC BY) license (http://creativecommons.org/licenses/by/4.0/).
Share and Cite
Pang, Y.; Hammer, T.; Müller, D.; Karl, J. Investigation of Nonthermal Plasma Assisted Charcoal Gasification for Production of Hydrogen-Rich Syngas. Processes 2019, 7, 114. https://doi.org/10.3390/pr7020114
Pang Y, Hammer T, Müller D, Karl J. Investigation of Nonthermal Plasma Assisted Charcoal Gasification for Production of Hydrogen-Rich Syngas. Processes. 2019; 7(2):114. https://doi.org/10.3390/pr7020114
Chicago/Turabian StylePang, Yin, Thomas Hammer, Dominik Müller, and Jürgen Karl. 2019. "Investigation of Nonthermal Plasma Assisted Charcoal Gasification for Production of Hydrogen-Rich Syngas" Processes 7, no. 2: 114. https://doi.org/10.3390/pr7020114
APA StylePang, Y., Hammer, T., Müller, D., & Karl, J. (2019). Investigation of Nonthermal Plasma Assisted Charcoal Gasification for Production of Hydrogen-Rich Syngas. Processes, 7(2), 114. https://doi.org/10.3390/pr7020114