Experimental Study on Electric Potential Response Characteristics of Gas-Bearing Coal During Deformation and Fracturing Process


Abstract
:1. Introduction
2. Experimental Materials and Methods
2.1. Specimen System
| 1 | loading plate | 13 | data transmission line |
| 2 | chamber cover | 14 | supporting base |
| 3 | loading shaft | 15 | data acquisition control host |
| 4 | specimen | 16 | EP controller |
| 5 | exhausting hole | 17 | AE controller |
| 6 | inflating hole | 18 | loading controller |
| 7 | chamber | 19 | visible window |
| 8 | gas transmission line | 20 | industrial camera |
| 9 | waveguide rod | 21 | illumination source |
| 10 | vacuum pump | 22 | triangular bracket |
| 11 | AE sensor | 23 | gas cylinder |
| 12 | exhaust line |
2.2. Specimen Preparation
2.3. Experimental Scheme
3. Experimental Results and Analyses
3.1. Test Results of Multi-parameters during the Damage of Gas-Bearing Coal under Load
3.2. The EP Response Results under Different Gas Pressures
4. Discussion
4.1. Damaging and Fracturing Process of Gas-Bearing Coal
4.2. The EP Response Analyses
4.3. The Influence of Gas on EP Effect
4.4. Analysis of the EP Response of Gas-Bearing Coal in Different Loading Stages
4.5. Research Significance of the EP Effect of Gas-Bearing Coal
5. Conclusions
Author Contributions
Funding
Acknowledgments
Conflicts of Interest
Abbreviations
| Ultimate gas adsorption | Distances of imaging charges to the measurement point | ||
| Molar gas constant | Distances of imaging charges to the measurement point | ||
| Reflection coefficient of the dielectric To | Absolute temperature | ||
| Reflection coefficients while represent the superscripts of reflecting interface separately parallel to axes and | EP at the point | ||
| Reflection coefficients while represent the superscripts of reflecting interface separately parallel to axes and | EP at the point | ||
| Another corresponding times of mirror imaging reflection | EP at the measurement point | ||
| Corresponding times of mirror imaging reflection | Molar volume | ||
| Gas pressure | Semi-infinite dielectrics of coal | ||
| Charge quantity of initial charge | Semi-infinite dielectrics of gas | ||
| Molar gas constant | Equivalent pore coefficient | ||
| Distance of To point | Apparent density | ||
| Distance of to the point | Effective stress | ||
| Distance of to the point | Relative broken strength | ||
| Distances of imaging charges to the measurement point | Loading stress | ||
| Distances of imaging charges to the measurement point |
References
- Song, X.; Li, X.; Li, Z.; Zhang, Z.; Cheng, F.; Chen, P.; Liu, Y. Study on the characteristics of coal rock electromagnetic radiation (EMR) and the main influencing factors. J. Appl. Geophys. 2018, 148, 216–225. [Google Scholar] [CrossRef]
- Yuan, L. Theory and practice of integrated coal production and gas extraction. Int. J. Coal Sci. Technol. 2015, 2, 3–11. [Google Scholar] [CrossRef]
- Lu, S.; Li, L.; Cheng, Y.; Sa, Z.; Zhang, Y.; Yang, N. Mechanical failure mechanisms and forms of normal and deformed coal combination containing gas: Model development and analysis. Eng. Fail. Anal. 2017, 80, 241–252. [Google Scholar] [CrossRef]
- Ma, C.; Wang, P.; Jiang, L.; Wang, C. Deformation and Control Countermeasure of Surrounding Rocks for Water-Dripping Roadway Below a Contiguous Seam Goaf. Processes 2018, 6, 77. [Google Scholar] [CrossRef]
- Hebblewhite, B.; Galvin, J. A review of the geomechanics aspects of a double fatality coal burst at Austar Colliery in NSW, Australia in April 2014. Int. J. Min. Sci. Technol. 2017, 27, 3–7. [Google Scholar] [CrossRef]
- Tang, Z.; Yang, S.; Wu, G. Occurrence Mechanism and Risk Assessment of Dynamic of Coal and Rock Disasters in the Low-Temperature Oxidation Process of a Coal-Bed Methane Reservoir. Energy Fuels 2017, 31, 3602–3609. [Google Scholar] [CrossRef]
- Freund, F.; Sornette, D. Electro-magnetic earthquake bursts and critical rupture of peroxy bond networks in rocks. Tectonophysics 2007, 431, 33–47. [Google Scholar] [CrossRef]
- Marland, S.; Merchant, A.; Rowson, N. Dielectric properties of coal. Fuel 2001, 80, 1839–1849. [Google Scholar] [CrossRef]
- Lamich, D.; Marschalko, M.; Yilmaz, I.; Bednářová, P.; Niemiec, D.; Kubečka, K.; Mikulenka, V. Subsidence measurements in roads and implementation in land use plan optimisation in areas affected by deep coal mining. Environ. Earth Sci. 2016, 75, 69. [Google Scholar] [CrossRef]
- Lu, P.; Li, P.; Chen, J.; Zhang, C.; Xue, J.; Yu, T. Gas drainage from different mine areas: Optimal placement of drainage systems for deep coal seams with high gas emissions. Int. J. Coal Sci. Technol. 2015, 2, 84–90. [Google Scholar] [CrossRef]
- Pillalamarry, M.; Harpalani, S.; Liu, S. Gas diffusion behavior of coal and its impact on production from coalbed methane reservoirs. Int. J. Coal Geol. 2011, 86, 342–348. [Google Scholar] [CrossRef]
- Mishchuk, N.; Ralston, J.; Fornasiero, D. Influence of dissolved gas on van der Waals forces between bubbles and particles. J. Phys. Chem. A 2002, 106, 689–696. [Google Scholar] [CrossRef]
- Karacan, C.; Okandan, E. Adsorption and gas transport in coal microstructure: Investigation and evaluation by quantitative X-ray CT imaging. Fuel 2001, 80, 509–520. [Google Scholar] [CrossRef]
- Archer, J.; Dobbs, M.; Aydin, A.; Reeves, H.; Prance, R. Measurement and correlation of acoustic emissions and pressure stimulated voltages in rock using an electric potential sensor. Int. J. Rock Mech. Min. Sci. 2016, 89, 26–33. [Google Scholar] [CrossRef]
- Steffanson, M.; Bone, D.J. Apparatus and Method for Electromagnetic Radiation Sensing. U.S. Patent 9,851,256, 26 December 2017. [Google Scholar]
- Enomoto, Y.; Shimamoto, T.; Tsutumi, A. Rapid electric charge fluctuation prior to rock fracturing: Its potential use for an immedi-ate earthquake precursor. In Proceedings of International Workshop on Electromagneticphenomenarelat to Earthquake Prediction; Hayakawa, M., Fujinawa, Y., Eds.; Terra Scientific Publishing Co.: Tokyo, Japan, 1993; pp. 64–65. [Google Scholar]
- Freund, F.T.; Takeuchi, A.; Lau, B.W. Electric currents streaming out of stressed igneous rocks—A step towards understanding pre-earthquake low frequency EM emissions. Phys. Chem. Earth Parts A/B/C 2006, 31, 389–396. [Google Scholar] [CrossRef]
- Vallianatos, F.; Triantis, D.; Tzanis, A.; Anastasiadis, C.; Stavrakas, I. Electric earthquake precursors: From laboratory results to field observations. Phys. Chem. Earth Parts A/B/C 2004, 29, 339–351. [Google Scholar] [CrossRef]
- He, X.; Nie, B.; Chen, W.; Wang, E.; Dou, L.; Wang, Y.; Liu, M.; Hani, M. Research progress on electromagnetic radiation in gas-containing coal and rock fracture and its applications. Saf. Sci. 2012, 50, 728–735. [Google Scholar] [CrossRef]
- Wang, X.; Liu, X.; Wang, E.; Li, X.; Zhang, X.; Zhang, C.; Kong, B. Experimental research of the AE responses and fracture evolution characteristics for sand-paraffin similar material. Constr. Build. Mater. 2017, 132, 446–456. [Google Scholar] [CrossRef]
- Yoshida, S.; Clint, O.C.; Sammonds, P.R. Electric potential changes prior to shear fracture in dry and saturated rocks. Geophys. Res. Lett. 1998, 25, 1577–1580. [Google Scholar] [CrossRef]
- Takeuchi, A.; Lau, B.W.; Freund, F.T. Current and surface potential induced by stress-activated positive holes in igneous rocks. Phys. Chem. Earth Parts A/B/C 2006, 31, 240–247. [Google Scholar] [CrossRef]
- Wang, E.; Li, Z.; Liu, Z.; Li, Y.; Song, X. An Experimental Study on Surface Electric Potential of Loaded Coal. Chin. J. Geophys. 2009, 52, 641–649. [Google Scholar] [CrossRef]
- Wang, E.Y.; Liu, X.F.; Li, Z.H.; Liu, Z.; He, X.Q. Application of Electromagnetic Radiation (EMR) Technology in Monitoring and Warning of Coal and Rock Dynamic Disasters; Springer International Publishing: Berlin, Germany, 2014; p. 4. [Google Scholar]
- Li, Z.H.; Wang, E.Y.; He, X.Q. Study on Theory and Mechanism of Surface Potential during Coal Fracture; China University of Mining and Technology Press: Xuzhou, China, 2013. [Google Scholar]
- Niu, Y.; Li, Z.; Kong, B.; Wang, E.; Lou, Q.; Qiu, L.; Kong, X.; Wang, J.; Dong, M.; Li, B. Similar simulation study on the characteristics of the electric potential response to coal mining. J. Geophys. Eng. 2017, 15, 42. [Google Scholar] [CrossRef]
- Stavrakas, I.; Anastasiadis, C.; Triantis, D.; Vallianatos, F. Piezo stimulated currents in marble specimen: Precursory and concurrent-with-failure signals. Nat. Hazards Earth Syst. Sci. 2003, 3, 243–247. [Google Scholar] [CrossRef]
- Aydin, A.; Dobbs, M.R.; Reeves, H.J.; Kirkham, M.P.; Graham, C.C. Stress Induced Electric Field Measurements of Different Rock Lithology Using the Electric Potential Sensor; American Rock Mechanics Association: New York, NY, USA, 2013. [Google Scholar]
- Haas, A.K.; Revil, A.; Karaoulis, M.; Frash, L.; Hampton, J.; Gutierrez, M.; Mooney, M. Electric potential source localization reveals a borehole leak during hydraulic fracturing. Geophysics 2013, 78, D93–D113. [Google Scholar] [CrossRef]
- Cai, Y.; Liu, D.; Mathews, J.P.; Pan, Z.; Elsworth, D.; Yao, Y.; Li, J.; Guo, X. Permeability evolution in fractured coal—Combining triaxial confinement with X-ray computed tomography, acoustic emission and ultrasonic techniques. Int. J. Coal Geol. 2014, 122, 91–104. [Google Scholar] [CrossRef]
- Hou, W. Identification of coal and gangue by feed-forward neural network based on data analysis. Int. J. Coal Prep. Util. 2019, 39, 33–43. [Google Scholar] [CrossRef]
- Kong, X.; Wang, E.; Hu, S.; Li, Z.; Liu, X.; Fang, B.; Zhan, T. Critical slowing down on acoustic emission characteristics of coal containing methane. J. Nat. Gas Sci. Eng. 2015, 24, 156–165. [Google Scholar] [CrossRef]
- Lomas, H.; Roest, R.; Wells, A.; Wu, H.; Jiang, Z.; Sakurovs, R.; Stuart, R.; North, L.; Thorley, T.; Mahoney, M.R. Estimating coke fracture toughness using acoustic emissions and changes in coefficient of friction during scratch testing. Fuel 2018, 226, 564–572. [Google Scholar] [CrossRef]
- Yin, G.Z.; Wang, D.K.; Zhang, D.M.; Huang, G. Solid-gas coupling dynamic model and numerical simulation of coal containing gas. Chin. J. Geotech. Eng. 2008, 30, 1430–1436. [Google Scholar]
- Polesek-Karczewska, S. Estimation of the structure-related share of radiation heat transfer in a carbonised packed coal bed. Fuel 2017, 195, 243–252. [Google Scholar] [CrossRef]
- Dokukin, M.; Olac-Vaw, R.; Guz, N.; Mitin, V.; Sokolov, I. Addressable photocharging of single quantum dots assisted with atomic force microscopy probe. Appl. Phys. Lett. 2009, 95, 173105. [Google Scholar] [CrossRef]
- He, X.; Liu, X.; Nie, B.; Song, D. FTIR and Raman spectroscopy characterization of functional groups in various rank coals. Fuel 2017, 206, 555–563. [Google Scholar] [CrossRef]
- Revil, A.; Ehouarne, L.; Thyreault, E. Tomography of self-potential anomalies of electrochemical nature. Geophys. Res. Lett. 2001, 28, 4363–4366. [Google Scholar] [CrossRef]
- Patella, D. Introduction to ground surface self-potential tomography. Geophys. Prospect. 1997, 45, 653–681. [Google Scholar] [CrossRef]
- Long, H.L.; Hao, J.Q. The Theoretical and Experimental Research on Self-Potential Tomography. Chin. J. Geophys. 2005, 48, 1408–1415. [Google Scholar] [CrossRef]
- He, X.; Wang, E.; Lin, H. Coal deformation and fracture mechanism under pore gas action. J. China Univ. Min. Technol. 1996, 25, 6–11. [Google Scholar]
- Liu, X.; Wang, X.; Wang, E.; Kong, X.; Zhang, C.; Liu, S.; Zhao, E. Effects of gas pressure on bursting liability of coal under uniaxial conditions. J. Nat. Gas Sci. Eng. 2017, 39, 90–100. [Google Scholar] [CrossRef]
- Su, F.; Itakura, K.; Deguchi, G.; Ohga, K. Monitoring of coal fracturing in underground coal gasification by acoustic emission techniques. Appl. Energy 2017, 189, 142–156. [Google Scholar] [CrossRef]


| Shielding Effect for Electromagnetic Signal | Threshold Value for AE Signal Acquisition | Axial Loading Rate of the Press | Gas Pressure in Chamber |
|---|---|---|---|
| 85 dB | 45 dB | 50 N/s | 2 MPa |
| Time (s) | LS Level (%) | Stress Response | EP Response | Crack Expansion |
|---|---|---|---|---|
| 100.1 | 37.1 | Steady increase | Recover after the sudden change | No significant cracks |
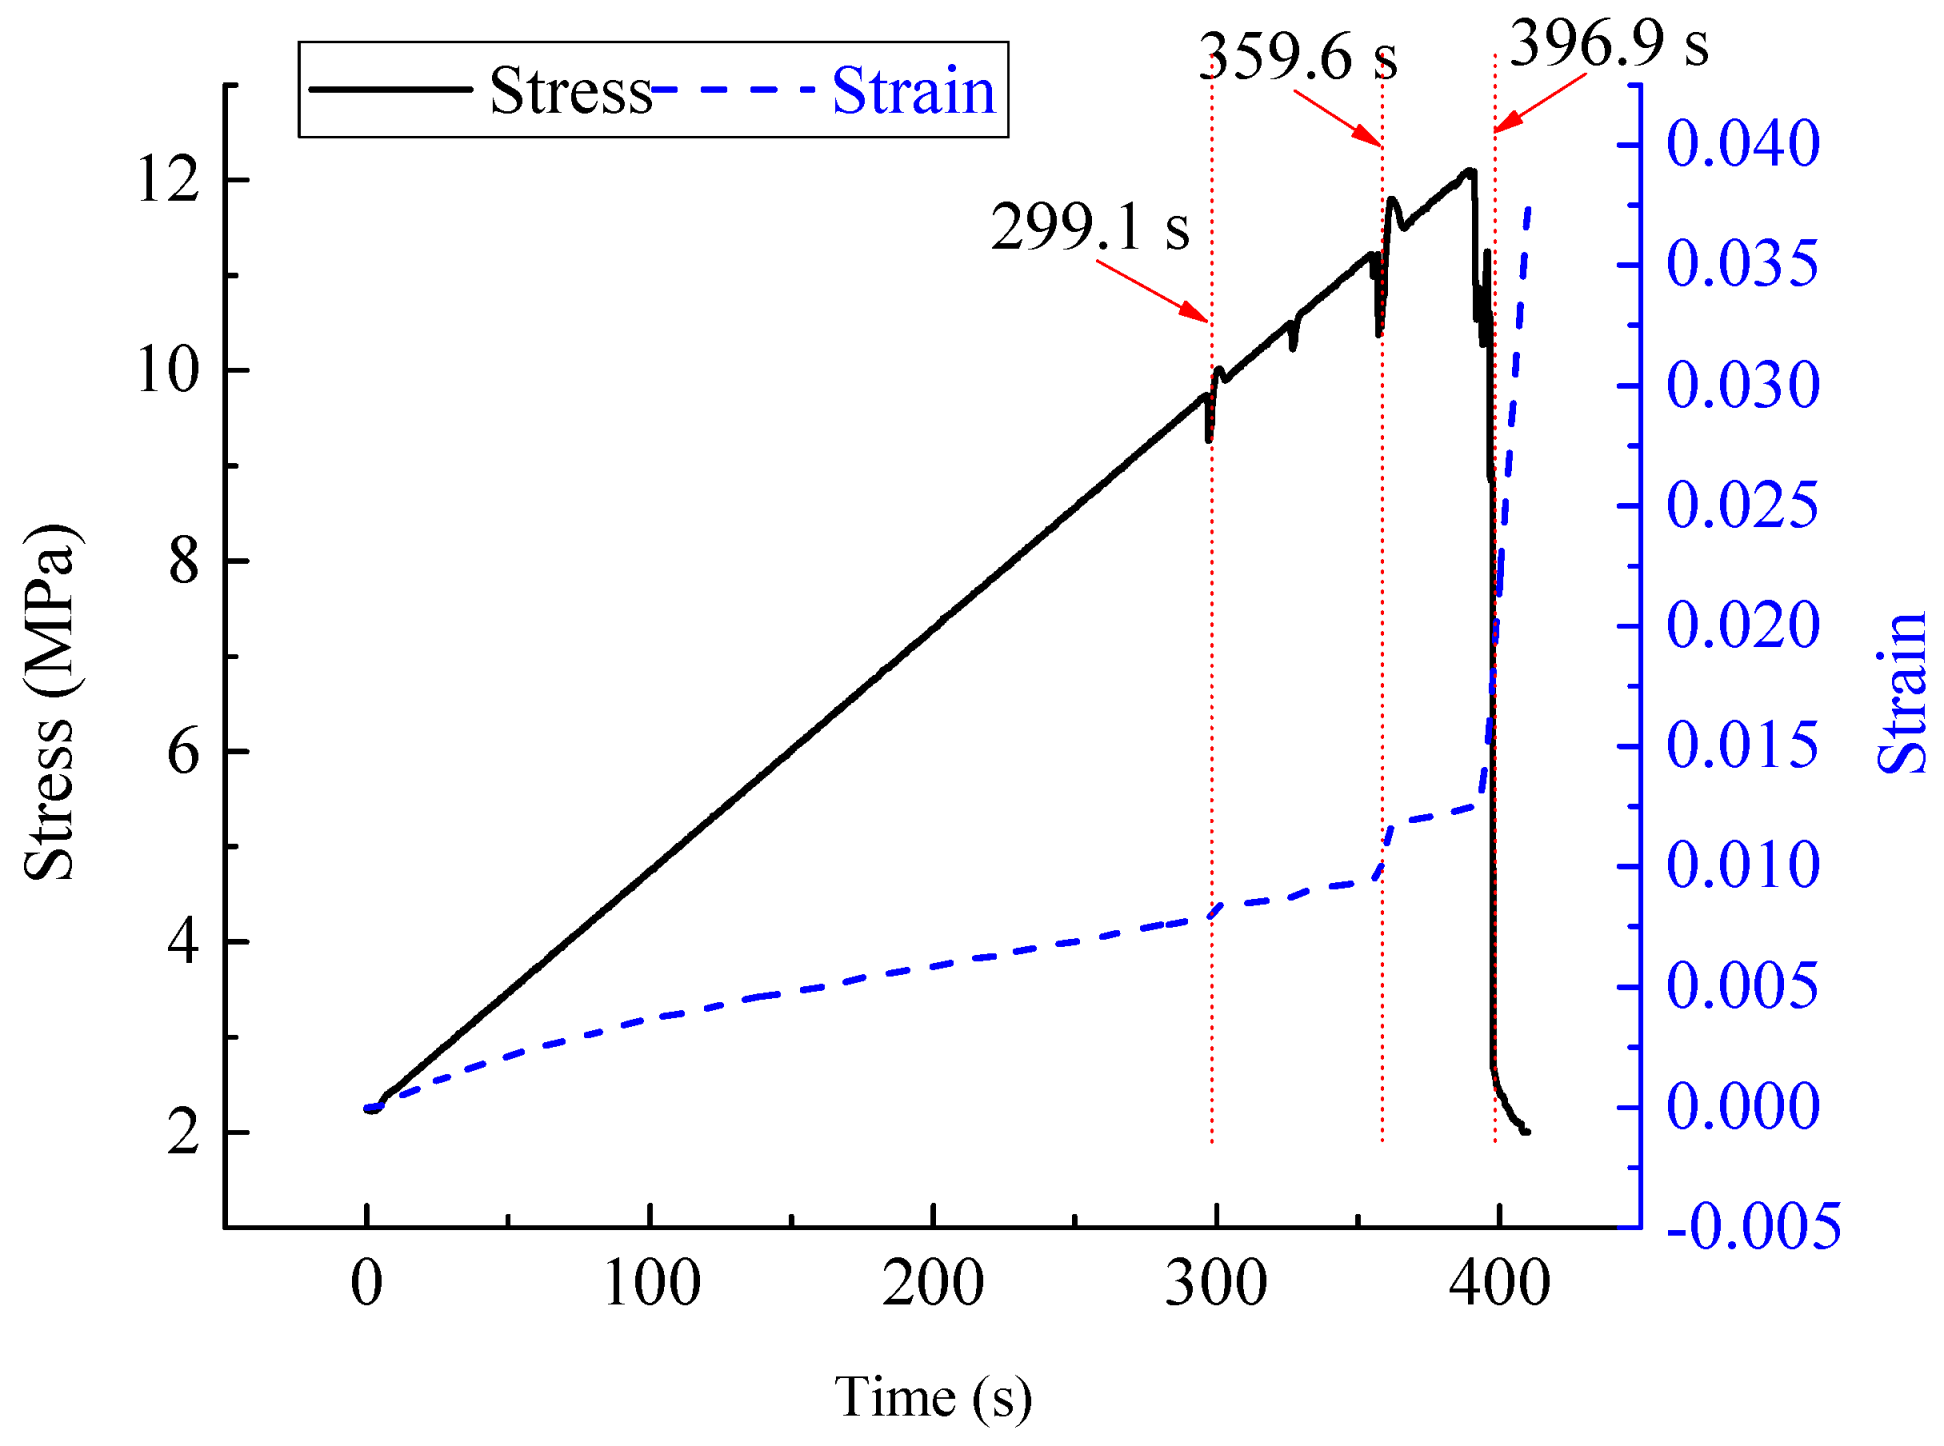
| 299.1 | 80.3 | Recover after the sudden change | Rise after the sudden change | Two thin and long cracks |
| 359.6 | 93.7 | Recover after the sudden change | Rise after the sudden change | Cracks running from the top to the bottom |
| 396.9 | 100 | Cliff-type reduction | Sudden change to the maximum and then reduce | Increases in crack width and length |
© 2019 by the authors. Licensee MDPI, Basel, Switzerland. This article is an open access article distributed under the terms and conditions of the Creative Commons Attribution (CC BY) license (http://creativecommons.org/licenses/by/4.0/).
Share and Cite
Li, Z.; Niu, Y.; Wang, E.; Liu, L.; Wang, H.; Wang, M.; Ali, M. Experimental Study on Electric Potential Response Characteristics of Gas-Bearing Coal During Deformation and Fracturing Process. Processes 2019, 7, 72. https://doi.org/10.3390/pr7020072
Li Z, Niu Y, Wang E, Liu L, Wang H, Wang M, Ali M. Experimental Study on Electric Potential Response Characteristics of Gas-Bearing Coal During Deformation and Fracturing Process. Processes. 2019; 7(2):72. https://doi.org/10.3390/pr7020072
Chicago/Turabian StyleLi, Zhonghui, Yue Niu, Enyuan Wang, Lanbo Liu, Honghao Wang, Mingfu Wang, and Muhammad Ali. 2019. "Experimental Study on Electric Potential Response Characteristics of Gas-Bearing Coal During Deformation and Fracturing Process" Processes 7, no. 2: 72. https://doi.org/10.3390/pr7020072