1. Introduction
Advanced biofuels obtained from microalgae have attracted great interest in the research field because they can be grown on non-arable land, and, therefore, they do not compete with food production. In addition, microalgae can fix CO
2 from the air through photosynthesis, which allows for a reduction of CO
2 emissions [
1,
2,
3].
Among the different biomass-to-biofuel thermochemical processes, hydrothermal liquefaction (HTL) has proven to be a likely option for the production of biofuels from microalgae [
4,
5,
6,
7], as it allows for the direct processing of wet algal biomass, thus avoiding the costs related to the drying step [
8,
9]. Moreover, HTL is not limited to the lipid fraction of the algal biomass because carbohydrates and proteins can also be converted into the biofuel product [
10,
11]. Furthermore, HTL microalga processing enhances the recovery of nutrients that can be recycled for microalga growth [
12,
13].
A moderate temperature (250–375 °C), pressure (4–22 MPa), and reaction time within the range of 5–60 min are commonly used in HTL [
9,
14,
15]. Under these conditions, the aqueous medium, near the critical point, promotes the degradation of macromolecules present in the algal biomass, as well as the polymerization of the resultant smaller molecules [
13]. A variety of products can be obtained from HTL: liquid organic phase (biocrude), aqueous phase compounds, solid residue, and gas phases, all of whose yields and quality are strongly affected by the operating conditions and the microalga used as feedstock. Thus, the influence of temperature, pressure, reaction time and slurry concentration on biocrude yield and quality have been deeply investigated [
16]. As reported elsewhere, the temperature is the most important parameter that affects HTL [
17], producing biocrude yields between 40 and 50 wt.% within a temperature range of 250–375 °C, depending on the microalga used as feedstock.
It has been reported that the maximization of the biocrude yield is favored at high temperatures. However, in these conditions, the biocrude is simultaneously enriched in N (derived from microalgae chlorophyll and proteins) [
17,
18]. Therefore, the HTL of microalgae yields biocrudes with a larger content of O (10–20 wt.%) and N (1–8 wt.%) than the conventional crude [
14]. This has a negative effect, not only on the final properties of the biocrude (high viscosity), but also on the possibilities of using it in conventional refinery operations due to catalyst poisoning [
14,
19]. Likewise, the potential application of biocrude as a biofuel is also limited due to the NOx emissions partially derived from N compounds [
16]. In addition, the high amount of O in the biocrude reduces its heating value. In order to decrease the N and O contents of the biocrude, different strategies can be devised. One of them is a low temperature HTL (<200 °C), which has been evaluated as a previous pretreatment to increase the quality of the final biocrude and to enhance the energy efficiency of the overall process [
14,
20,
21,
22]. This is an advantageous option, because it allows for the hydrolysis of proteins into small molecules, which remain solubilized in the aqueous phase, diminishing the N content in the pretreated residue and consequently reducing the N content in the final biocrude. In addition, P and N compounds can be recovered from the aqueous phase and used for microalga cultivation [
20]. The use of this pretreatment in combination with other processes is currently under study, but more focus has been spent on the reduction of the N content of the microalga, whereas the also necessary O content decrease has been less studied in literature. In this sense, the pyrolysis of algal biomass pretreated by HTL has been reported in a batch reactor, yielding biocrude with a low N content [
23]. Another approach is the use of this low temperature pretreatment of the microalgae in combination with a final HTL process at a high temperature. This scheme has been applied to microalga processing, obtaining biocrudes with a low N content in a batch reactor [
14,
20,
21] and also in a semi-continuous reactor [
24,
25]. A low N biocrude was also obtained from the yeast
Cryptococcus curvatus through this sequential HTL in batch operation mode [
26].
Though a low temperature pretreatment appears to be a promising alternative in reducing the N compounds of the final biocrude, the relationship between operating conditions, pretreated microalga yield, and properties has not been fully established. Additionally, the necessary reduction of O in the biomass has not yet been deeply studied. In this context, the use of models to determine the optimal conditions of this pretreatment to reduce both N and O concentrations in the pretreated biomass could be of great interest to achieve the desired objectives in subsequent processing. In this work, a low temperature wet pretreatment of the microalga Nannochloropsis gaditana was carried out to evaluate the optimal conditions and the effects of temperature, reactor loading, and reaction time in order to maximize the yield of the pretreated biomass and the N and O content transferred from biomass to the aqueous phase. The process was developed and optimized by the factorial design and response surface methodology, which is a powerful tool that has not been applied to the hydrothermal microalga pretreatment to reduce the N and O content of the final biocrude.
2. Materials and Methods
2.1. Materials
The microalga selected for this study was N. gaditana, which was purchased from AlgaEnergy S.A. (Madrid, Spain) and received in freeze-dried form. Dry biomass is more feasible for long-term storage and its use on the small scale. In large-scale HTL, wet microalga can be directly used as the feedstock without any dewatering and drying processes.
The elemental composition of N. gaditana was 48.7% C, 7.1% H, 6.8% N, 0.9% S and 21.2% O. Freshly deionized water prepared in the laboratory was used throughout the experiments. All other chemicals used in this research were obtained commercially and used as received.
2.2. Experimental Procedure
In a typical pretreatment essay, a solution of the desired amount of N. gaditana powder and 75 mL of fresh deionized water were added to the reactor. The amount of microalga depends on the assay and was between 2 and 5 g. The high pressure and high temperature batch reactor employed was E010SS 100 mL EZE-SEAL 316SS from Autoclave Engineers (Erie, PA, USA) with gas inlet and outlet connections, a thermocouple, and a cooling coil.
The reactor was sealed and purged using N2. Then, it was heated to the desired temperature using an electrical heating jacket and held at that temperature for the predefined pretreatment time. At the end of the reaction, the reactor was cooled to room temperature by passing a solution of water and ethylene glycol at 5 °C through the cooling coils of the system to quench the reaction.
Before opening the reactor, pressure was relieved by a purge valve. The mixture in the reactor was transferred to a beaker, and the reactor was washed twice with 15 mL of dichloromethane (DCM), ensuring that all components were extracted. The mixture contained three phases: An aqueous phase, a solid phase (pretreated microalga), and a phase of biocrude with DCM.
The pretreated biomass was separated using filter paper with a Büchner funnel. After filtration, this solid phase and the filter paper were dried in an oven at 110 °C for 12 h before they were weighed. The weight of the solid residue was calculated by subtracting the weight of the filter paper. The aqueous and biocrude phases were separated by decantation in a separatory funnel. The top phase was the aqueous phase and the biocrude phase with DCM was at the bottom. To evaporate water and DCM from the aqueous phase and the biocrude layer, respectively, both were dried in an oven during 24 h at 100 °C for the aqueous phase and 40 °C for the biocrude phase, and then weighed. The oven used had an extractor to avoid the evaporated solvent being transferred to workspace.
The elemental analyses of the microalga and all product phases were carried out using a Flash 2000 analyzer (Thermo Fisher Scientific, Waltham, MA, USA) equipped with a thermal conductivity detector (TCD). The contents of C, N, S, and H were determined by an oxidation/reduction reactor kept at a temperature of 900 °C. The O determination was achieved through an oxygen-specific pyrolysis reactor heated at 1060 °C. Triplicate analyses were conducted for each sample, and the average values were taken.
3. Results and Discussion
3.1. Result of the Design of Experiments
The experimental design applied to the study of the hydrothermal pretreatment was a 23 full factorial design. The central point experiment was carried out four times in order to determine the variability of the results and to evaluate the experimental error. According to the response surface methodology, a second order model was required because of the significant curvature effect found in the linear model. Additional experiments (star points) were included in the factorial design to produce a face-centered central composite design.
The responses selected were: The yield of the pretreated biomass phase obtained in the hydrothermal pretreatment in relation to the mass of dry matter microalga loaded (hereinafter referred to as the yield of the solid phase, YSP), the N recovery in the aqueous phase in relation to the N content in the microalga dry matter (NRAP), and the O recovery in the aqueous phase referred to the O content in the dry microalga (ORAP). The design goal was to maximize these three responses. A high solid phase yield is required in the pretreatment stage to increase, in turn, the final biocrude yield obtained in HTL. Additionally, it is necessary to transfer high amounts of N and O from the microalga to the aqueous phase (rising NRAP and ORAP) to obtain a solid phase with lower N and O content that can be converted into a biocrude with a low heteroatom concentration through a conventional HTL process.
The selection of the factors was based on the operating conditions that have a significant influence on HTL reactions [
27]. Therefore, the factors studied were temperature (T), reaction time (t) and the biomass:water ratio (B:W).
The selection of the levels was based on results obtained in previous studies [
14,
20,
24]. The lower and upper temperature levels were 100 and 200 °C, respectively, since higher temperatures enter the range of HTL conditions. The levels of the reaction time were 5 and 120 min, and the levels of the biomass:water ratio were 26.7 and 66.7 mg/mL.
The experimental matrix and the results are presented in
Table 1. The factorial levels on a natural scale are illustrated in columns 2, 3 and 4, whereas columns 5, 6 and 7 denote the 0 and ±1 encoded factorial levels on a dimensionless scale. Experiments were carried out randomly to minimize errors due to possible systematic tendencies in the operating conditions.
Table 1 also shows the results for the three responses.
Using non-linear multiple regression analysis and assuming a second-order polynomial model, mathematical models (Equations (1)–(6)) were attained from the matrix generated by the experimental pretreatment results. The statistical models (Equations (1)–(3)) were calculated from encoded levels that showed the real influence of the three operating variables on the pretreatment process, and the technological models (Equations (4)–(6)) were obtained from the real values corresponding to these operating conditions. The analysis of variance showed that the quadratic model selected to fit the experimental results was adequate because the lack-of-fit test presented p-values > 0.05 in all cases.
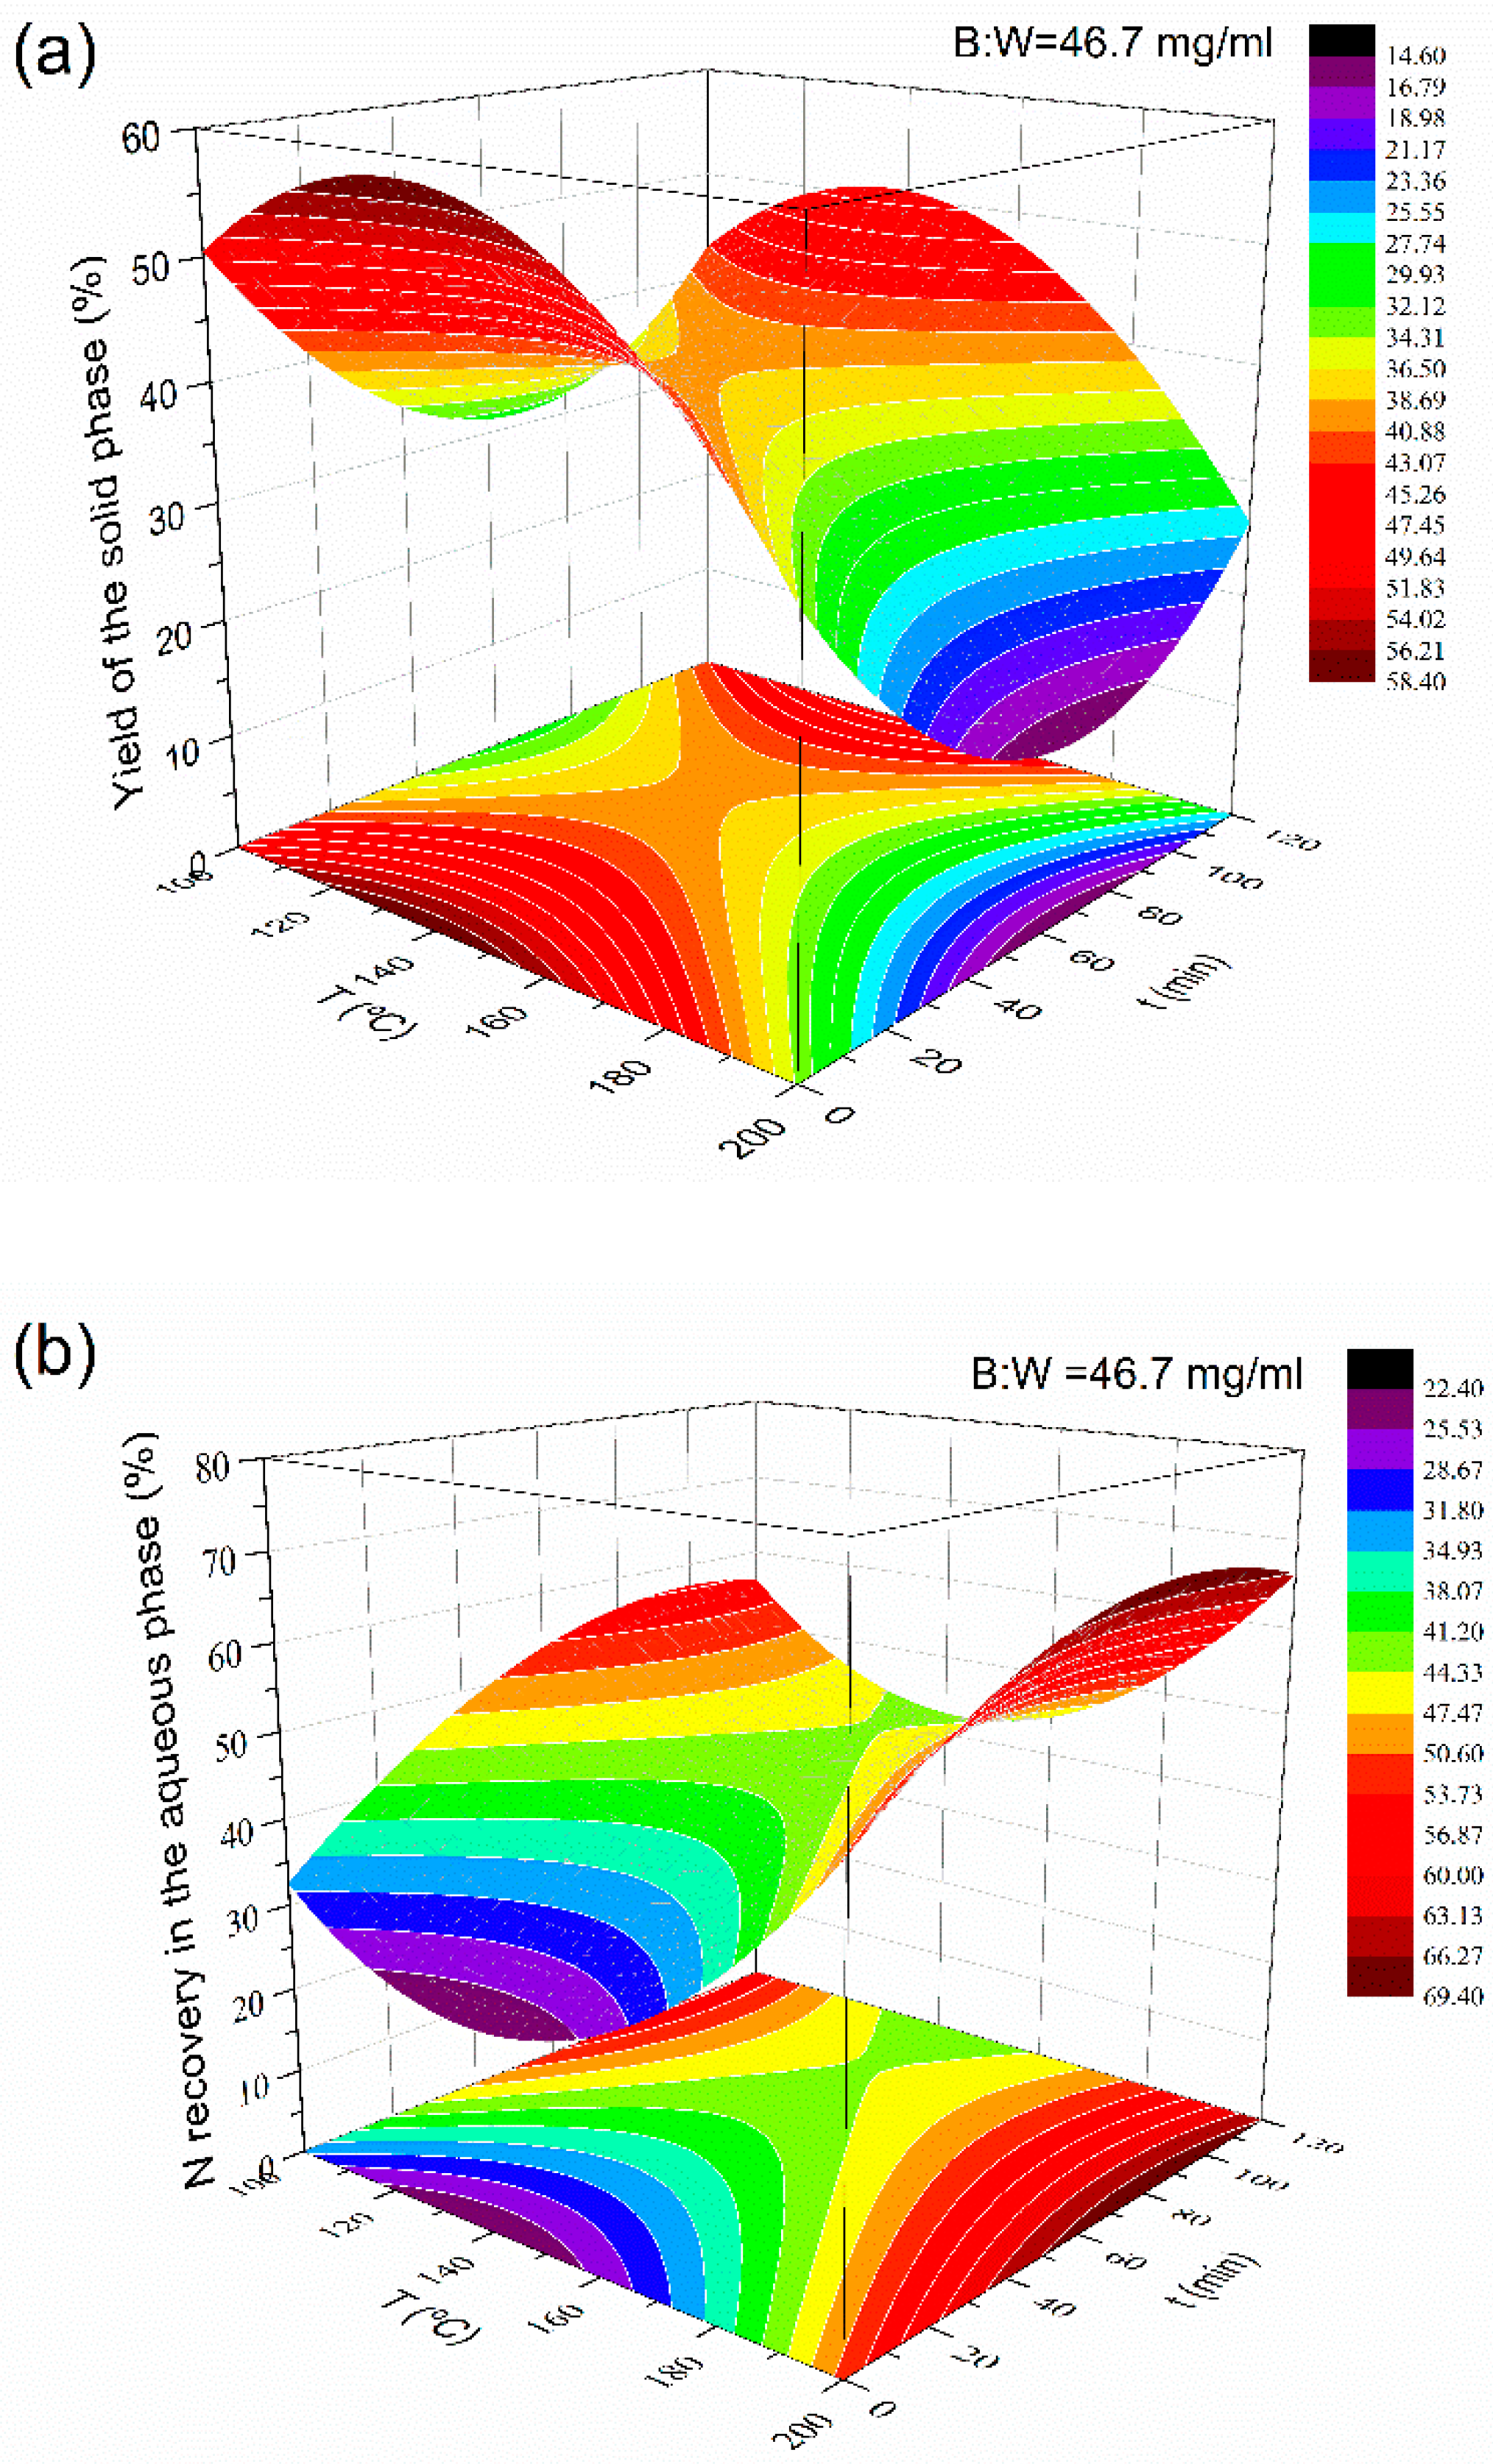
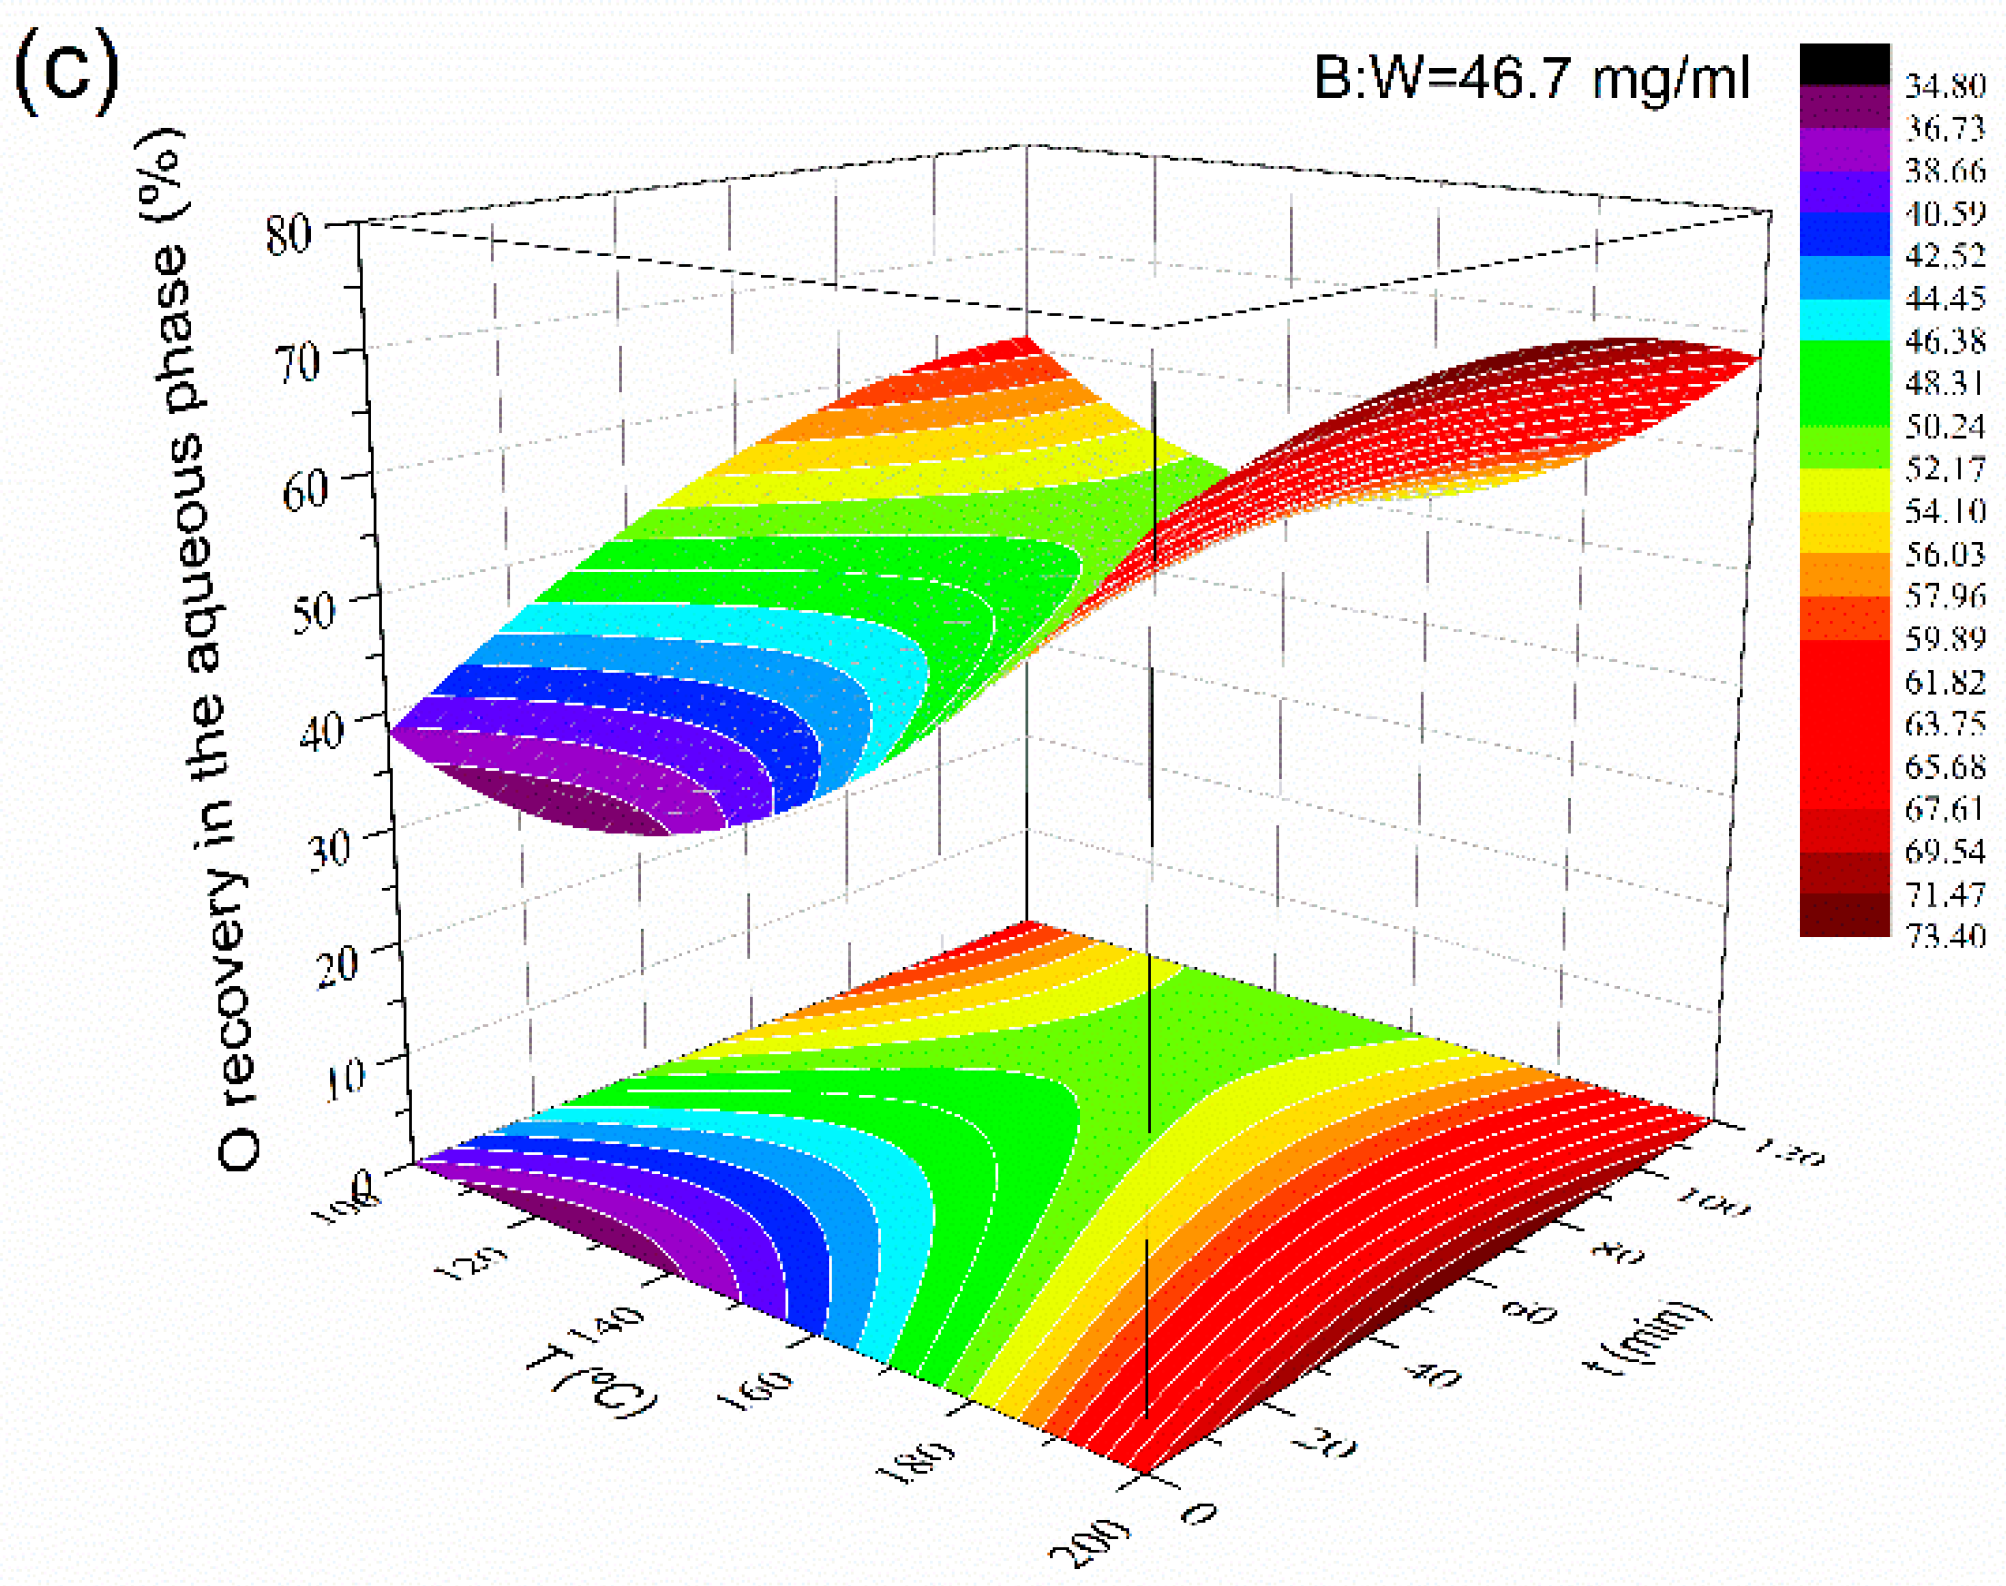
For each response, the second-order models could be plotted on 3D graphs (response surfaces) as a function of two of the three factors at the center point of the third one. For instance,
Figure 1 shows the response surfaces for the predicted values of the solid phase yield (
Figure 1a), the N recovery in the aqueous phase (
Figure 1b), and the O recovery in the aqueous phase (
Figure 1c) as a function of temperature and pretreatment reaction time at a biomass:water ratio of 46.7 mg/mL, which corresponds to the center point value of this factor.
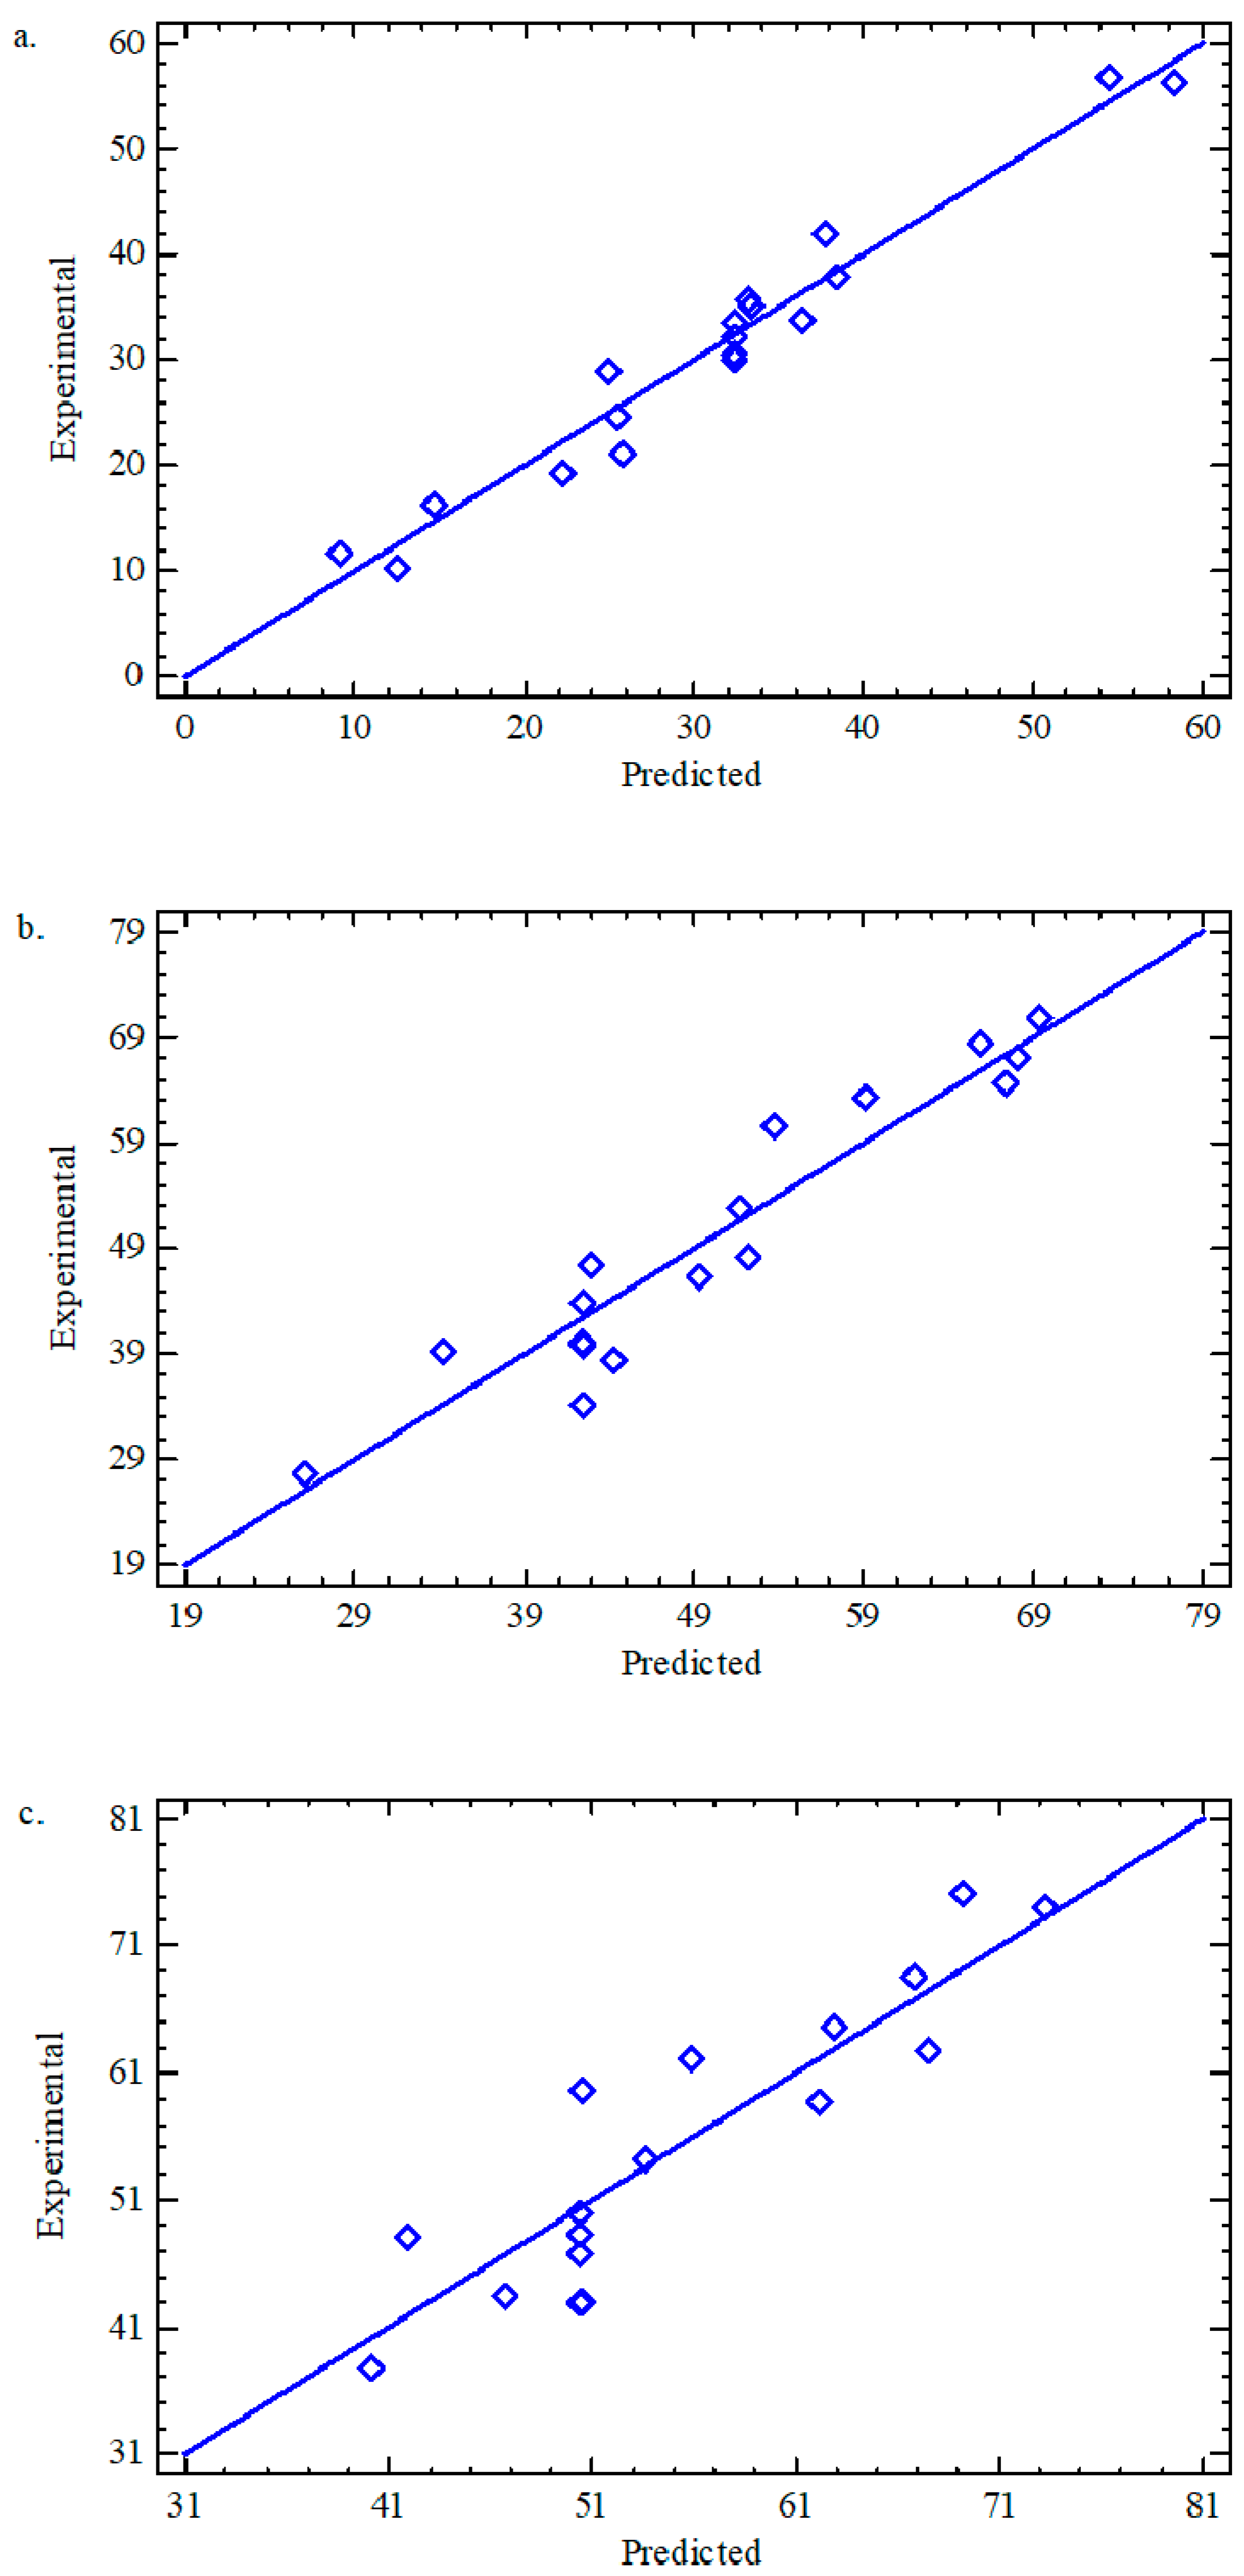
Figure 2 shows the relationship between experimental and predicted values for the yield of the solid phase, the N recovery in the aqueous phase, and the O recovery in the aqueous phase. For the three responses evaluated, the values calculated with the predictive non-linear models were very close to those obtained experimentally, indicating the high accuracy of the models attained. In addition, the analysis of variance (ANOVA) indicated that the second-order models were adequate to represent the experimental results for the three responses analyzed, since the
p-values of the lack-of-fit were higher than the significance level (0.05). Thus, the values were 0.0512, 0.2050 and 0.2020 for the yield of the solid phase, the N recovery in the aqueous phase and the O recovery in the aqueous phase, respectively.
3.2. Influence of Operating Conditions on the Yield of the Solid Phase
According to the statistical analysis of the experimental range evaluated, the temperature (X
T) was the most important factor in the yield of the solid phase obtained in the HTL pretreatment (
p = 0.0005). The second factor in importance was pretreatment reaction time (Xt) (
p = 0.0005), although the interaction between them was not significant (
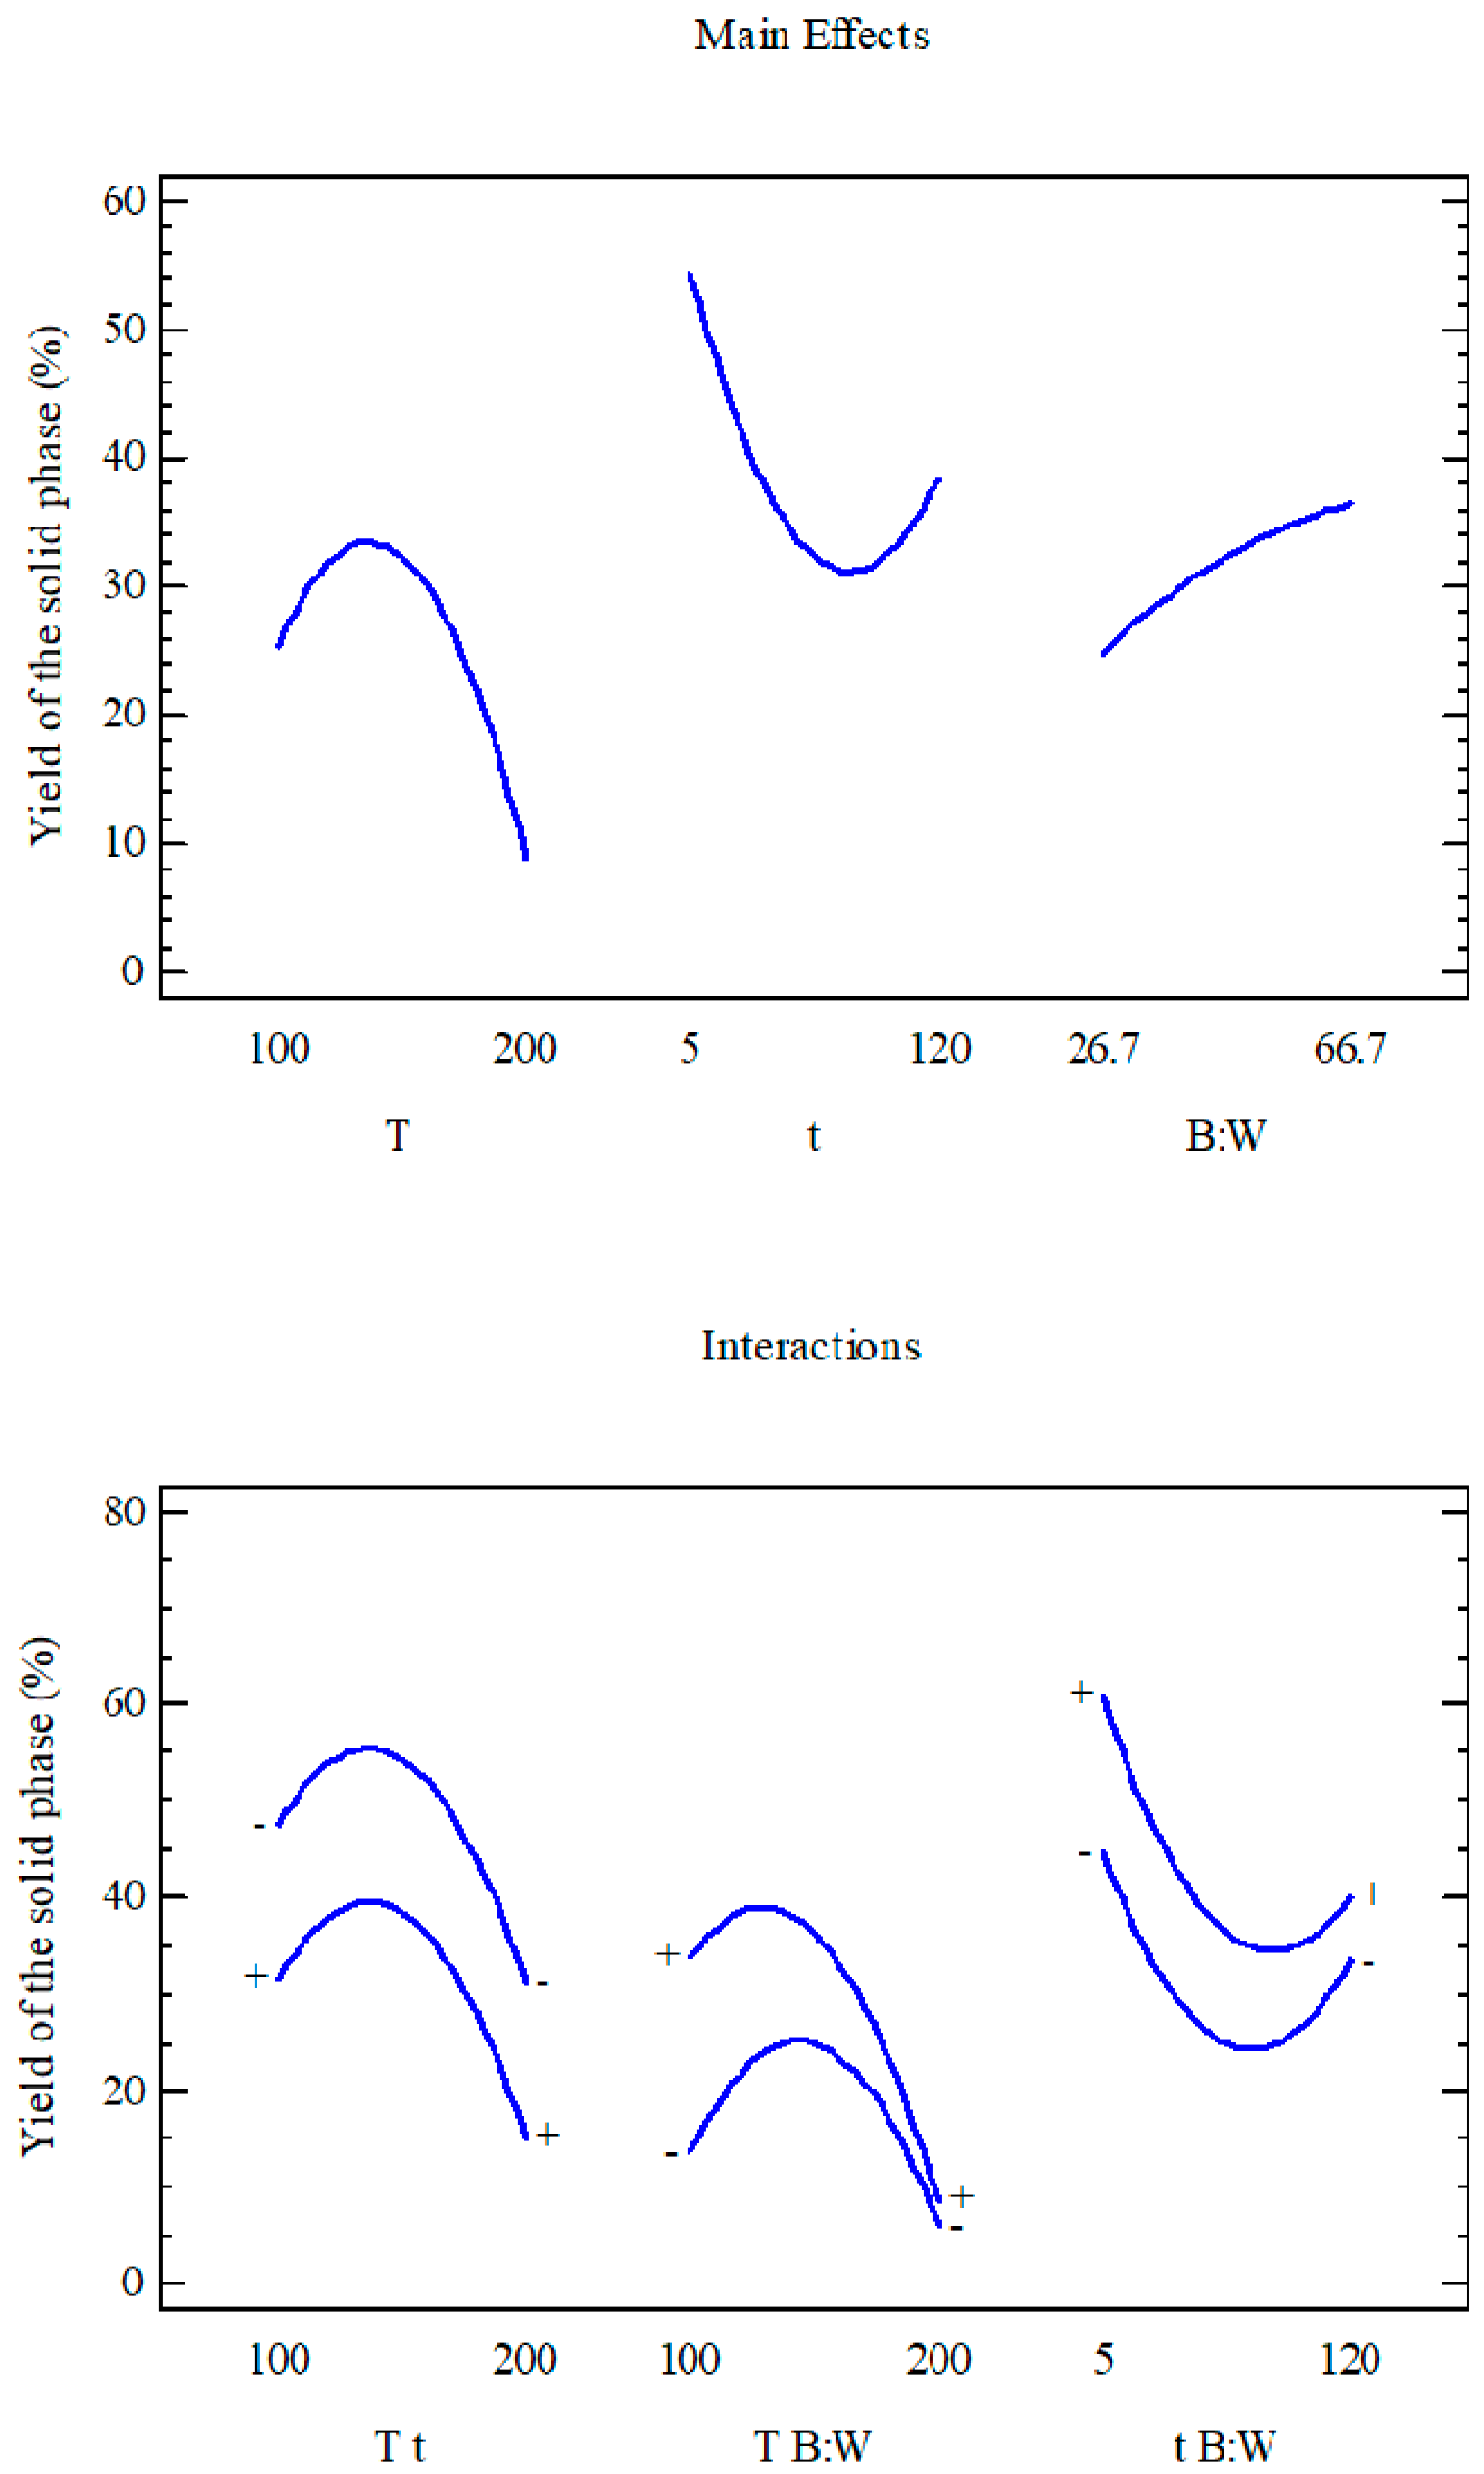
p = 0.9668). As shown in
Figure 3 and Equation (1), temperature and time had a negative influence on the solid phase yield: An increase in these factors produced an overall decrease in the amount of pretreated biomass obtained during the studied hydrothermal pretreatment process. The effect of temperature and time on the yield of treated biomass was similar to the ones reported previously for HTL in mild conditions [
14,
23,
26]. The drop of the solid phase yield with increased pretreatment temperature and time was due to the effect of the biomass cell break, which allowed for the hydrolysis of the extracted proteins and carbohydrates from the microalga into their corresponding single molecules (amino acids and sugars, respectively) in the aqueous phase. Therefore, an increase in the temperature and time promoted the hydrolysis reactions, decreasing the solid phase yield.
However, the quadratic effect of the temperature (X
2T) had a significant negative influence on the yield of the solid phase (Equation (1);
p = 0.0005). This, in turn, meant that the increase of temperature did not imply a constant decrease in this response because the curvature effect was significant at lower temperatures (
Figure 3). In fact, the yield of the solid phase achieved a maximum at a temperature of approximately 140 °C. In this sense, the hydrolysis of proteins and carbohydrates did not become significant until that temperature was achieved.
In the same way, the quadratic time effect (X
2t) was also significant (
p = 0.0007), but its effect was positive (Equation (1)). Therefore, the increase of time did not again produce a constant reduction in the response analyzed, since the curvature effect was significant at long reaction times (
Figure 3). Accordingly, the pretreatment at longer reaction times (>75 min) reached a minimum yield in the solid phase without further decreasing the amount of this pretreated biomass. Consequently, protein and carbohydrate hydrolysis reactions were no longer significant at these long pretreatment times. Higher yields of the solid phase were obtained at shorter reaction times, which could significantly reduce the cost and energy requirements of the mild pretreatment.
Figure 3 and Equation (1) show that the biomass:water ratio (X
B:W) had a positive effect on the amount of solid obtained from the HTL pretreatment (
p = 0.0014). For this reason, an increase of the initial slurry concentration was somewhat beneficial to this response at the mild temperatures utilized in this study. This was due to the increase in available biomass with increasing slurry concentrations. However, the influence of the quadratic effect of this factor (X
2B:W) was not significant (
p = 0.1723).
Conversely, the temperature–biomass:water ratio interaction (XT–XB:W) had a small negative influence on the yield of the solid phase (Equation (1); p = 0.0041). At low temperatures, an increase in the biomass:water ratio significantly increased the response, but the yield of the solid phase remained nearly constant at high temperatures for any slurry biomass concentration. Thus, the slurry concentration was no longer significant at high temperatures because the effect of the hydrolysis reactions of the proteins and carbohydrates became more important at these temperatures, producing low solid yields.
The time–biomass:water ratio interaction (X
t–X
B:W) was also significant in the quantity of solids attained in the pretreatment (
p = 0.0226), showing a significant negative effect (
Figure 3 and Equation (1)). At lower pretreatment times, an increase in the slurry concentration led to a significant increase of the solid phase yield. However, the increase of this response with the initial slurry concentration at high temperatures was lower. This interaction can be explained as the temperature–biomass:water ratio interaction. At high temperatures, the hydrolysis reactions became more important, and therefore the influence of the biomass:water ratio was less important.
From the point of view of the solid phase yield obtained during the mild pretreatment, the optimal values were the medium temperature (130 °C), the shortest time (5 min) and the higher biomass:water ratio (67 mg/mL). At these operating conditions, the yield of solids predicted by the non-linear models (Equations (1) or (4)) was 63.5%. This predicted value was confirmed with the experimental result at the same operating conditions (63.24%).
3.3. Influence of Operating Conditions on the N Recovery in the Aqueous Phase
The influence of operating conditions on the N recovery in the aqueous phase is now discussed using the statistical models shown in Equation (2) as well as the main effects and interaction plots (
Figure 4) and the ANOVA. The most important factor was the biomass:water ratio (X
B:W) (
p = 0.0060). This factor had a negative influence on the N content in the aqueous phase. Therefore, an increase in the biomass:water ratio produced a remarkable decrease in the N content in the aqueous phase. This fact disadvantaged the goal of increasing N recovery because it is interesting to work at lower biomass:water ratios to reduce the cost of the biomass drying in order to obtain low concentrations of the initial biomass slurry. The influence of the quadratic effect of this factor (X
2B:W), however, was not significant (
p = 0.8676). The next factors in importance were pretreatment reaction time (
p = 0.0066) and temperature (
p = 0.0106). Overall, an increase in temperature and time improved the N recovery in the aqueous phase. That increase drove the hydrolysis of proteins into small molecules, which remained solubilized in the aqueous phase, decreasing the N content in the pretreated biomass obtained [
20].
The quadratic effect of the temperature (X
2T) achieved the most remarkable value (
p = 0.0047). It had the most significant positive influence on the N recovery in the aqueous phase (Equation (2)). This means that the increase of temperature did not imply a constant increase in this response because the curvature effect was very significant at lower temperatures (
Figure 4). In fact, the N recovery in the aqueous phase reached a minimum at a temperature of approximately 140 °C. This result is in agreement with the maximum yield of pretreated biomass achieved at this temperature. Temperatures higher than 140 °C increased the ionic product of the water, thus promoting the hydrolysis of proteins and enhancing both the removal of N from the microalga and the solid phase yield at the same time [
20].
The temperature–biomass:water ratio interaction (X
T–X
B:W) in the N recovery was also significant (
p = 0.0239) and positive (Equation (2) and
Figure 4). At low temperatures, an increase in the biomass:water ratio led to a significant decrease in N recovery in the aqueous phase. However, this response achieved similarly high values at high temperatures for any slurry biomass concentration.
On the other hand, the quadratic effect of the time (X
2t) had a small negative influence on the N recovery in the aqueous phase. This means that the increase of time did not imply a constant increase in this response because the curvature effect was significant at higher pretreatment times (
Figure 4). In fact, the N recovery achieved a maximum at approximately 90 min, keeping constant for longer reaction times. Therefore, pretreatment times of about 90 min or higher were adequate to obtain higher values for the N recovery in the aqueous phase, but short pretreatment times were preferred from the point of view of the cost and energy requirements for this stage.
Finally, the influence of the temperature–time and the time–biomass:water ratio interactions ((X
T–X
t, X
t–X
B:W, respectively) was not significant on the N recovery in the aqueous phase since the
p-values were higher than 0.05 in both cases (
Figure 4 and Equation (2)).
From the point of view of the N recovery in the aqueous phase during the HTL pretreatment, the optimal values were the lowest temperature (100 °C), the medium time (93.5 min) and the lowest biomass:water ratio (26.7 mg/mL). At these operating conditions, the NRAP predicted by the non-linear models (Equations (2) or (5)) and the corresponding experimental value were 71.1% and 73.0%, respectively.
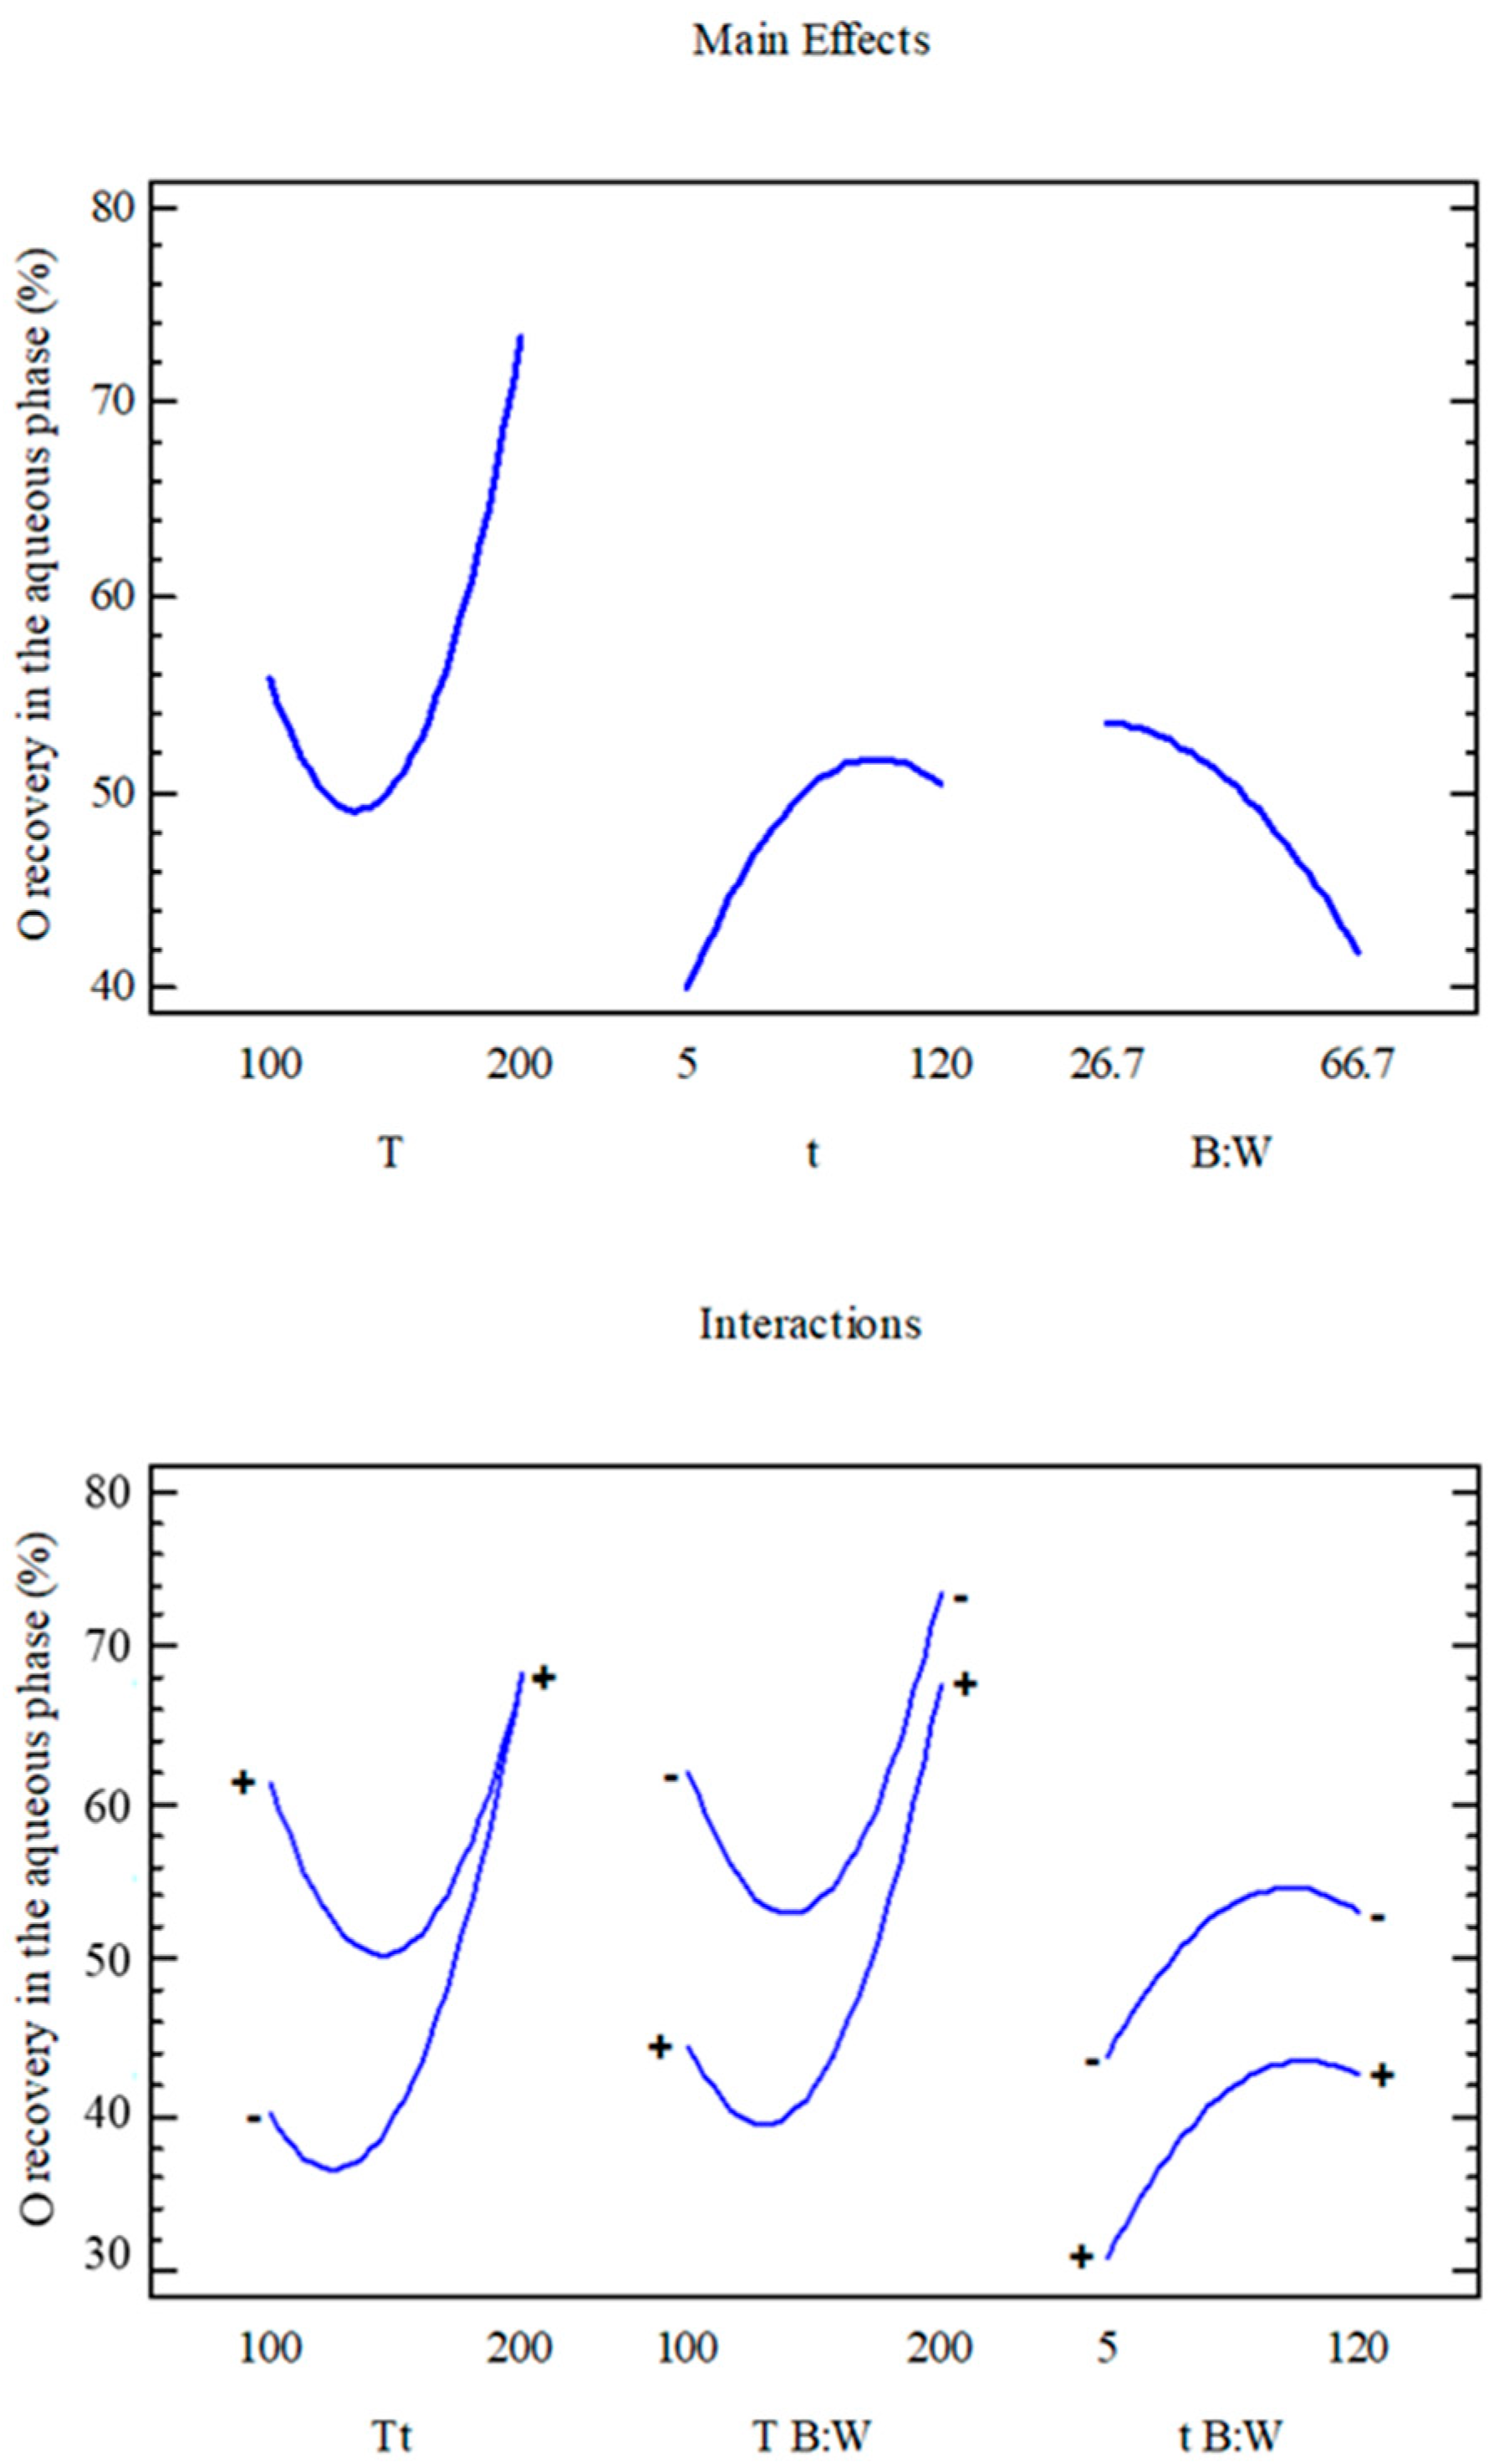
3.4. Influence of Operating Conditions on the O Recovery in the Aqueous Phase
The temperature (X
T) was identified as the most important factor for the O recovery in the aqueous phase (
p = 0.0027). As shown in Equation (3) and
Figure 5, this operating condition had an overall positive effect on the O removal from biomass, achieving O recovery values in the aqueous phase of nearly 73% at high temperatures. Therefore, this response grew when the temperature increased. The N removal from the biomass also increased with temperature, but the O elimination was predominant. As the ionic product of water increased with temperature, high values of this operating condition favored the hydrolysis of proteins, carbohydrates and lipids catalyzed by H
+ and OH
−, enhancing the recovery of O from the microalga in the aqueous phase. The quadratic effect of this factor (X
2T) had a significant (
p = 0.0044) positive influence on this response (Equation (3)). However, its absolute value was smaller than that of its corresponding main effect. This indicates that the increase in temperature did not produce a constant rise in the O content in the aqueous phase because the curvature effect was significant at lower temperatures with a minimum at approximately 135 °C (
Figure 5). Consequently, the hydrolysis of the biomass compounds did not become significant, at least at 135–140 °C.
The biomass:water ratio (X
B: W), the time (X
t), and the temperature–time interaction (X
T-X
t) were significant with
p-values of 0.0085, 0.0117 and 0.0143, respectively, but they had a lower effect on this response than temperature and its quadratic effect. The biomass:water ratio had a negative linear influence on the O recovery in the aqueous phase, as shown in
Figure 5. Accordingly, the influence of the quadratic effect of this factor (X
2B:W) was not significant (
p = 0.2326). As far as this response is concerned, low biomass:water ratios were required to maximize the O recovery in the aqueous phase, because more H
+ and OH
− were available to catalyze the hydrolysis of proteins, carbohydrates and lipids, which improved the removal of O from the biomass in the aqueous phase.
In addition, pretreatment time (X
t) had a positive effect on this heteroatom recovery in the aqueous phase, and the quadratic effect (X
2t) of this factor was not significant (
p = 0.0656). The maximum value of the O recovery was 52%, which was achieved at long pretreatment times (
Figure 5). The time had a similar effect to temperature on the O removal from the biomass, but its influence, as shown, was less significant. Time also favored the hydrolysis of biomass compounds, increasing the O recovery.
On the other hand, the temperature–time interaction (X
T–X
t) had a negative influence on the O recovery in the aqueous phase. It was the only interaction that had a significant effect (
p = 0.0143) since the temperature–biomass:water ratio interaction (X
T–X
B:W) and the time–biomass:water ratio interaction (X
t–X
B:W) did not have a significant effect on this response (
p = 0.0696 and
p = 0.6098, respectively). At short pretreatment times, an increase in the temperature produced a great increase in the O recovery. However, at long times, this response decreased to a minimum and later increased to 68% (
Figure 4). At low temperatures, an increase of the time remarkably enhanced the O recovery. However, this response achieved its maximum value at high temperatures irrespective of the pretreatment time because the temperature influence was more significant than time.
According to these results, the optimal values to maximize the O recovery in the aqueous phase are the highest temperature (200 °C), an intermediate time (59.6 min), and a value of 35.8 mg/mL of the biomass:water ratio. At these operating conditions, the O recovery in the aqueous phase predicted by the non-linear models (Equations (3) or (6)) was 74.1%. The experimental result of O recovery at the optimal operating conditions was slightly higher (76.3%).

 ,
, 


