Review

Product Concentration, Yield and Productivity in Anaerobic Digestion to Produce Short Chain Organic Acids: A Critical Analysis of Literature Data

by
Serena Simonetti
1,
Agus Saptoro
2,
Claudia Fernández Martín
1 and
Davide Dionisi
1,*
1
School of Engineering, Materials and Chemical Engineering Group, University of Aberdeen, Aberdeen AB24 3UE, UK
2
Department of Chemical Engineering, Curtin University Malaysia, CDT 250 Miri, Sarawak 98009, Malaysia
*
Author to whom correspondence should be addressed.
Processes 2020, 8(12), 1538; https://doi.org/10.3390/pr8121538
Submission received: 23 October 2020 / Revised: 19 November 2020 / Accepted: 19 November 2020 / Published: 25 November 2020
(This article belongs to the Special Issue Anaerobic Digestion for Bioenergy and Biochemicals Production)

Abstract

:
In order to make anaerobic digestion-based processes for short chain organic acid (SCOA) production attractive, the key performance variables, i.e., concentration, yield, and productivity of the produced SCOAs need to be maximised. This study analysed recent literature, looking for the effect of process operating parameters (feed concentration, pH, temperature, and residence time) on the performance variables. Data from 551 experiments were analysed. Mean values of the SCOA concentration, yield, and productivity were 10 g l−1, 32% (chemical oxygen demand (COD) COD−1), and 1.9 g l−1 day−1, respectively. Feed concentration and residence time had the most important effect. Higher feed concentration corresponded to higher product concentration and productivity, but to lower yield. The mean feed concentration was 109 gCOD l−1 and 19 gCOD l−1 in the experiments with the highest product concentrations and in the experiments with the highest yields, respectively. Shorter residence times corresponded to higher productivity. The mean HRT (hydraulic residence time) in the experiments with the highest productivities was 2.5 days. Sequencing batch reactors gave higher values of the performance variables (mean values 29 g l−1, 41% COD COD−1, and 12 g l−1 day−1 for product concentration, yield, and productivity, respectively) than processes without phase separation.

1. Introduction

Anaerobic digestion is an industrially established process where microorganisms degrade the organic matter in the absence of air. Anaerobic digestion is typically used to produce biogas, used as power and heat source or transport fuel, and digestate, a nutrient-rich fertiliser. Recently, the use of anaerobic digestion for the production of short-chain organic acids (SCOAs) is attracting interest [1]. SCOAs (e.g., acetic, propionic, butyric acids) are important chemicals widely used in the chemical industry for the synthesis of plastics, as food additives, and for many other uses [2]. The production of acetic acid alone was approximately 18 Mt in 2019. The vast majority of the current SCOA production uses natural gas as primary feedstock. However, natural gas is a non-renewable resource and, furthermore, the conversion of natural gas into SCOAs requires high temperature, with the associated energy consumption and process costs, and metal catalysts, which are also non-renewable.
SCOAs are the main intermediates of anaerobic digestion and can be produced from carbohydrates, proteins, and lipids. Production of SCOAs from anaerobic digestion, rather than from natural gas, would have important environmental benefits, mainly because of the use of a waste as feedstock, of the need of milder conditions of temperature and pressure and of the avoidance of metal catalysts. However, currently there is no commercial production of SCOAs from anaerobic digestion, because of several limitations: SCOAs from anaerobic digestion are typically produced as diluted mixtures in water, requiring energy-intensive and expensive separation, and anaerobic digestion is typically a slow process, with low volumetric productivity (where productivity is defined as the SCOA production rate per unit of reactor volume) [3,4,5,6]. In order to make the production of SCOAs from anaerobic digestion competitive with current production processes, it is important to maximise the key performance variables, i.e., the concentration of the produced SCOAs, their yield on the feedstock, and their productivity. Indeed, high SCOA concentration corresponds to lower separation costs and high productivity, high SCOA yield corresponds to high conversion of the feedstock into SCOA, and high productivity corresponds to high SCOA production rate per unit of reactor volume.
Various process operating parameters influence the SCOA concentration, yield, and productivity. The nature of the feedstock used influences its biodegradability, while its concentration influences the SCOA concentration and their productivity. If the feedstock or the products are inhibiting, high substrate concentration can also negatively affect the yield. Temperature affects any chemical reactions, and anaerobic digestion is usually favoured by mesophilic or thermophilic conditions. pH also affects any biochemical reactions and the activity of the various microbial species involved in anaerobic digestion. The residence time is also an important variable. The hydraulic residence time (HRT) is expected to influence the process productivity, while the solids residence time (SRT) is expected to influence the conversion of the feedstock and therefore the SCOA concentration, yield, and productivity. It is therefore important to choose the process operating parameters in order to optimise process performance.
This study analysed the literature on SCOA production using anaerobic digestion with the aim to identify the range of operating parameters used; the range of SCOA concentration, yield, and productivity obtained; general trends in the effect of operating parameters on SCOA concentration, yield, and productivity; and gaps in our current knowledge that should be filled with further research.

2. Methodology

2.1. Data Collection and Analysis

Articles were researched using the words “VFA” (volatile fatty acids), “SCOA”, “acidogenic fermentation”, “anaerobic fermentation”, and “anaerobic digestion” on Google Scholar in 2019 and 2020, selecting all the studies that could provide enough information on the process conditions and experimental data to be able to calculate the parameters of interest. After selection, 57 papers were used for our analysis, resulting in 551 experiments. The list of all the studies considered, with substrates types, operational parameters investigated, and analysed products, is reported in the the Table S1 of the Supplementary Materials [7,8,9,10,11,12,13,14,15,16,17,18,19,20,21,22,23,24,25,26,27,28,29,30,31,32,33,34,35,36,37,38,39,40,41,42,43,44,45,46,47,48,49,50,51,52,53,54,55,56,57,58,59,60,61,62,63].
For each experiment, the following operating conditions were obtained: feed concentration (g chemical oxygen demand (COD) l−1), temperature (°C), pH, HRT (hydraulic residence time) and SRT (solids residence time) for continuous or semi-continuous experiments, and experiment length for batch experiments.
The considered liquid phase products were ethanol and the following acids: acetic, propionic, butyric, valeric, caproic, heptanoic, lactic, formic, succinic, and caprylic. Most studies only reported and measured some of the considered liquid phase products. Therefore, even though each study aimed to measure the most important SCOAs produced under their experimental conditions, the total production of SCOAs may be underestimated and the actual concentration, yield, and productivity in the considered studies may be higher than the reported values.
For each experiment, where applicable, the following performance variables were calculated or obtained directly from the papers: product concentration (as total concentration of liquid phase products), product yield (as total yield of the products from the fed substrate), and productivity (as total products produced per unit volume and time). The performance variables were calculated with Equations (1)–(3), with Equation (3a) used for continuous or semi-continuous experiments and Equation (3b) for batch experiments:
P r o d u c t   c o n c e n t r a t i o n   ( g   l 1 ) =   s u m   o f   l i q u i d   p r o d u c t s   ( g ) v o l u m e   ( l )
Y i e l d   ( %   C O D   C O D 1 ) =   %   t o t a l   l i q u i d   p r o d u c t s   ( g C O D   l 1 ) s u b s t r a t e   c o n c e n t r a t i o n   ( g C O D   l 1 )
P r o d u c t i v i t y   ( g   l 1 d 1 ) = P r o d u c t   c o n c e n t r a t i o n   ( g   l 1 )   H R T   ( d )
P r o d u c t i v i t y   ( g   l 1 d 1 ) = P r o d u c t   c o n c e n t r a t i o n   ( g   l 1 )   L e n g t h   o f   t h e   e x p e r i m e n t   ( d )
The yield was expressed in COD (chemical oxygen demand) units to have a uniform basis for comparing different products and substrates and because, for any substrates and products, a 100% product yield is the theoretical maximum in COD units. In the considered literature studies, the concentrations of the feedstock and of the products were reported in different units, e.g., COD, volatile solids (VS), etc. In order to convert the data in uniform units, we used the conversion factors presented in Table 1. For SCOAs and cellulose, conversion to COD units was obtained from the chemical formulas, using the general oxidation reaction of organic matter, as described in Equations (4) and (5):
O r g a n i c   m a t t e r   o x i d a t i o n :  
C n H a O b N d + ¼   ( 4 n + a 2 b 3 d ) O 2 > n C O 2 + 1 / 2   ( a 3 d )   H 2 O + d N H 3
C O D   c o n v e r s i o n   f a c t o r :  
f   ( g C O D   g 1 ) = ( 8 ( 4 n + a 2 b 3 d ) ) / ( 12 n + a + 16 b + 14 d )

2.2. Statistical Analysis: Regression Modelling and Pearson’s r Test

Regression modelling was employed to correlate each of the process performance variables (dependent variables: product concentration, product yield, and productivity) with the operating parameters (independent variables: feed concentration, pH, temperature, and residence time). This correlation was then used to identify the influence of changes in independent variables on the dependent variables. The general form of regression equation is given in Equation (6), where y represents each dependent variable, xi represents the independent variables, a is the intercept, bi are regression coefficients, and ε is the residual.
y   =   a 0   +   b 1 x 1   +   b 2 x 2   +   . . . . . . +   b n x n   +   ε
Independent variables were fitted to the respective dependent variable and ANOVA was performed to assess the significance of each independent variable in the developed model. Effects and significance of independent variable on the product yield, concentration, and productivity were then studied on the basis of the regression coefficient and p-values.
Pearson’s r test was applied to verify any significant linear correlation between the single operational parameters and process performance parameters [69], without considering the possible interactions between the operating parameters.
Microsoft Excel 365 (Version 2010) was used for the regression as well as for the profiles of performance variables. The software IBM SPSS Statistics (Version 25) was used for Pearson’s r test and descriptive statistics.

3. Results and Discussion

3.1. General Observation and Descriptive Statistics

Table 2 shows the substrate types in the considered studies. Food waste included artificial, simulated, or real food waste/garbage waste/kitchen waste, or organic fraction of municipal organic waste. Carbohydrate-rich substrate included vegetable-derived waste or wastewater, while protein-rich waste mainly included animal-derived waste. Sludge included primary and secondary sludge and sewage sludge, and pure substrate comprised pure substrates such as glucose, peptone, and glycerol, separately or in a mixture. Manure included chicken manure and cow manure, alone or in co-digestion with crop waste. Table 2 reports the substrate with the higher percentage when co-digestion was investigated. Almost half of the experiments were performed using food waste, followed by protein-rich substrates and sludge.

3.2. Range of Operating Parameters and Performance Variables

Table 3 shows the minimum, maximum, mean, and 90th percentile values for the operating parameters and performance variables from the considered experiments.
Although the maximum substrate concentration in the feed was just over 200 gCOD l−1, the mean value was 53 gCOD l−1 and only 10% of the experiments were carried out with feed concentration higher than 127 gCOD l−1. Various types of organic waste have a high concentration of organic matter; however, the availability of highly concentrated feedstocks may also have limited the number of studies in this range. For example, the concentration of undiluted food waste has been measured at over 300 gCOD l−1. Manure can also have a high concentration of COD. Therefore, Table 3 shows that there is relatively little investigation of process performance with highly concentrated substrates. One possible reason is the difficult mixing of highly concentrated feedstocks. However, since it is expected that higher feed concentration results in higher product concentration and higher productivities, this analysis highlights the need for more investigation on concentrated feedstocks.
As far as the residence time is concerned, for batch experiments, the residence time of the microorganisms coincides with the run length. For continuous or semi-continuous experiments, we can distinguish the hydraulic residence time (HRT; residence time of the liquid) and the solids residence time (SRT; residence time of the microorganisms). The HRT and the SRT coincide in CSTR (continuous stirred-tank reactor) experiments without solid–liquid separation, while they are different in SBR (sequencing batch reactor) experiments. Since the vast majority of continuous or semi-continuous experiments were carried out without solid–liquid separation, as discussed in Section 3.4, in the vast majority of the considered experiments, the SRT and HRT coincided and the mean values of the HRT and SRT were very similar (6.33 and 6.89 days, respectively).
The literature studies were carried out in a wide range of temperatures and pH values. The highest product concentration in the considered studies was 57 g l−1; however, the mean value was just below 10 g l−1 and only 10% of the experiments obtained a product concentration higher than 23 g l−1. Considering that high concentration is important to obtain economic separation of the products, this analysis confirms the need for more studies aimed at achieving high product concentration. In COD units, the highest reported product yield was close to 100%; however, the mean value was 32% and the 90th percentile was 64%. The highest productivity was 55 g l−1 day−1; however, the mean and 90th percentile values were much lower (1.87 and 5.05 g l−1 day−1).

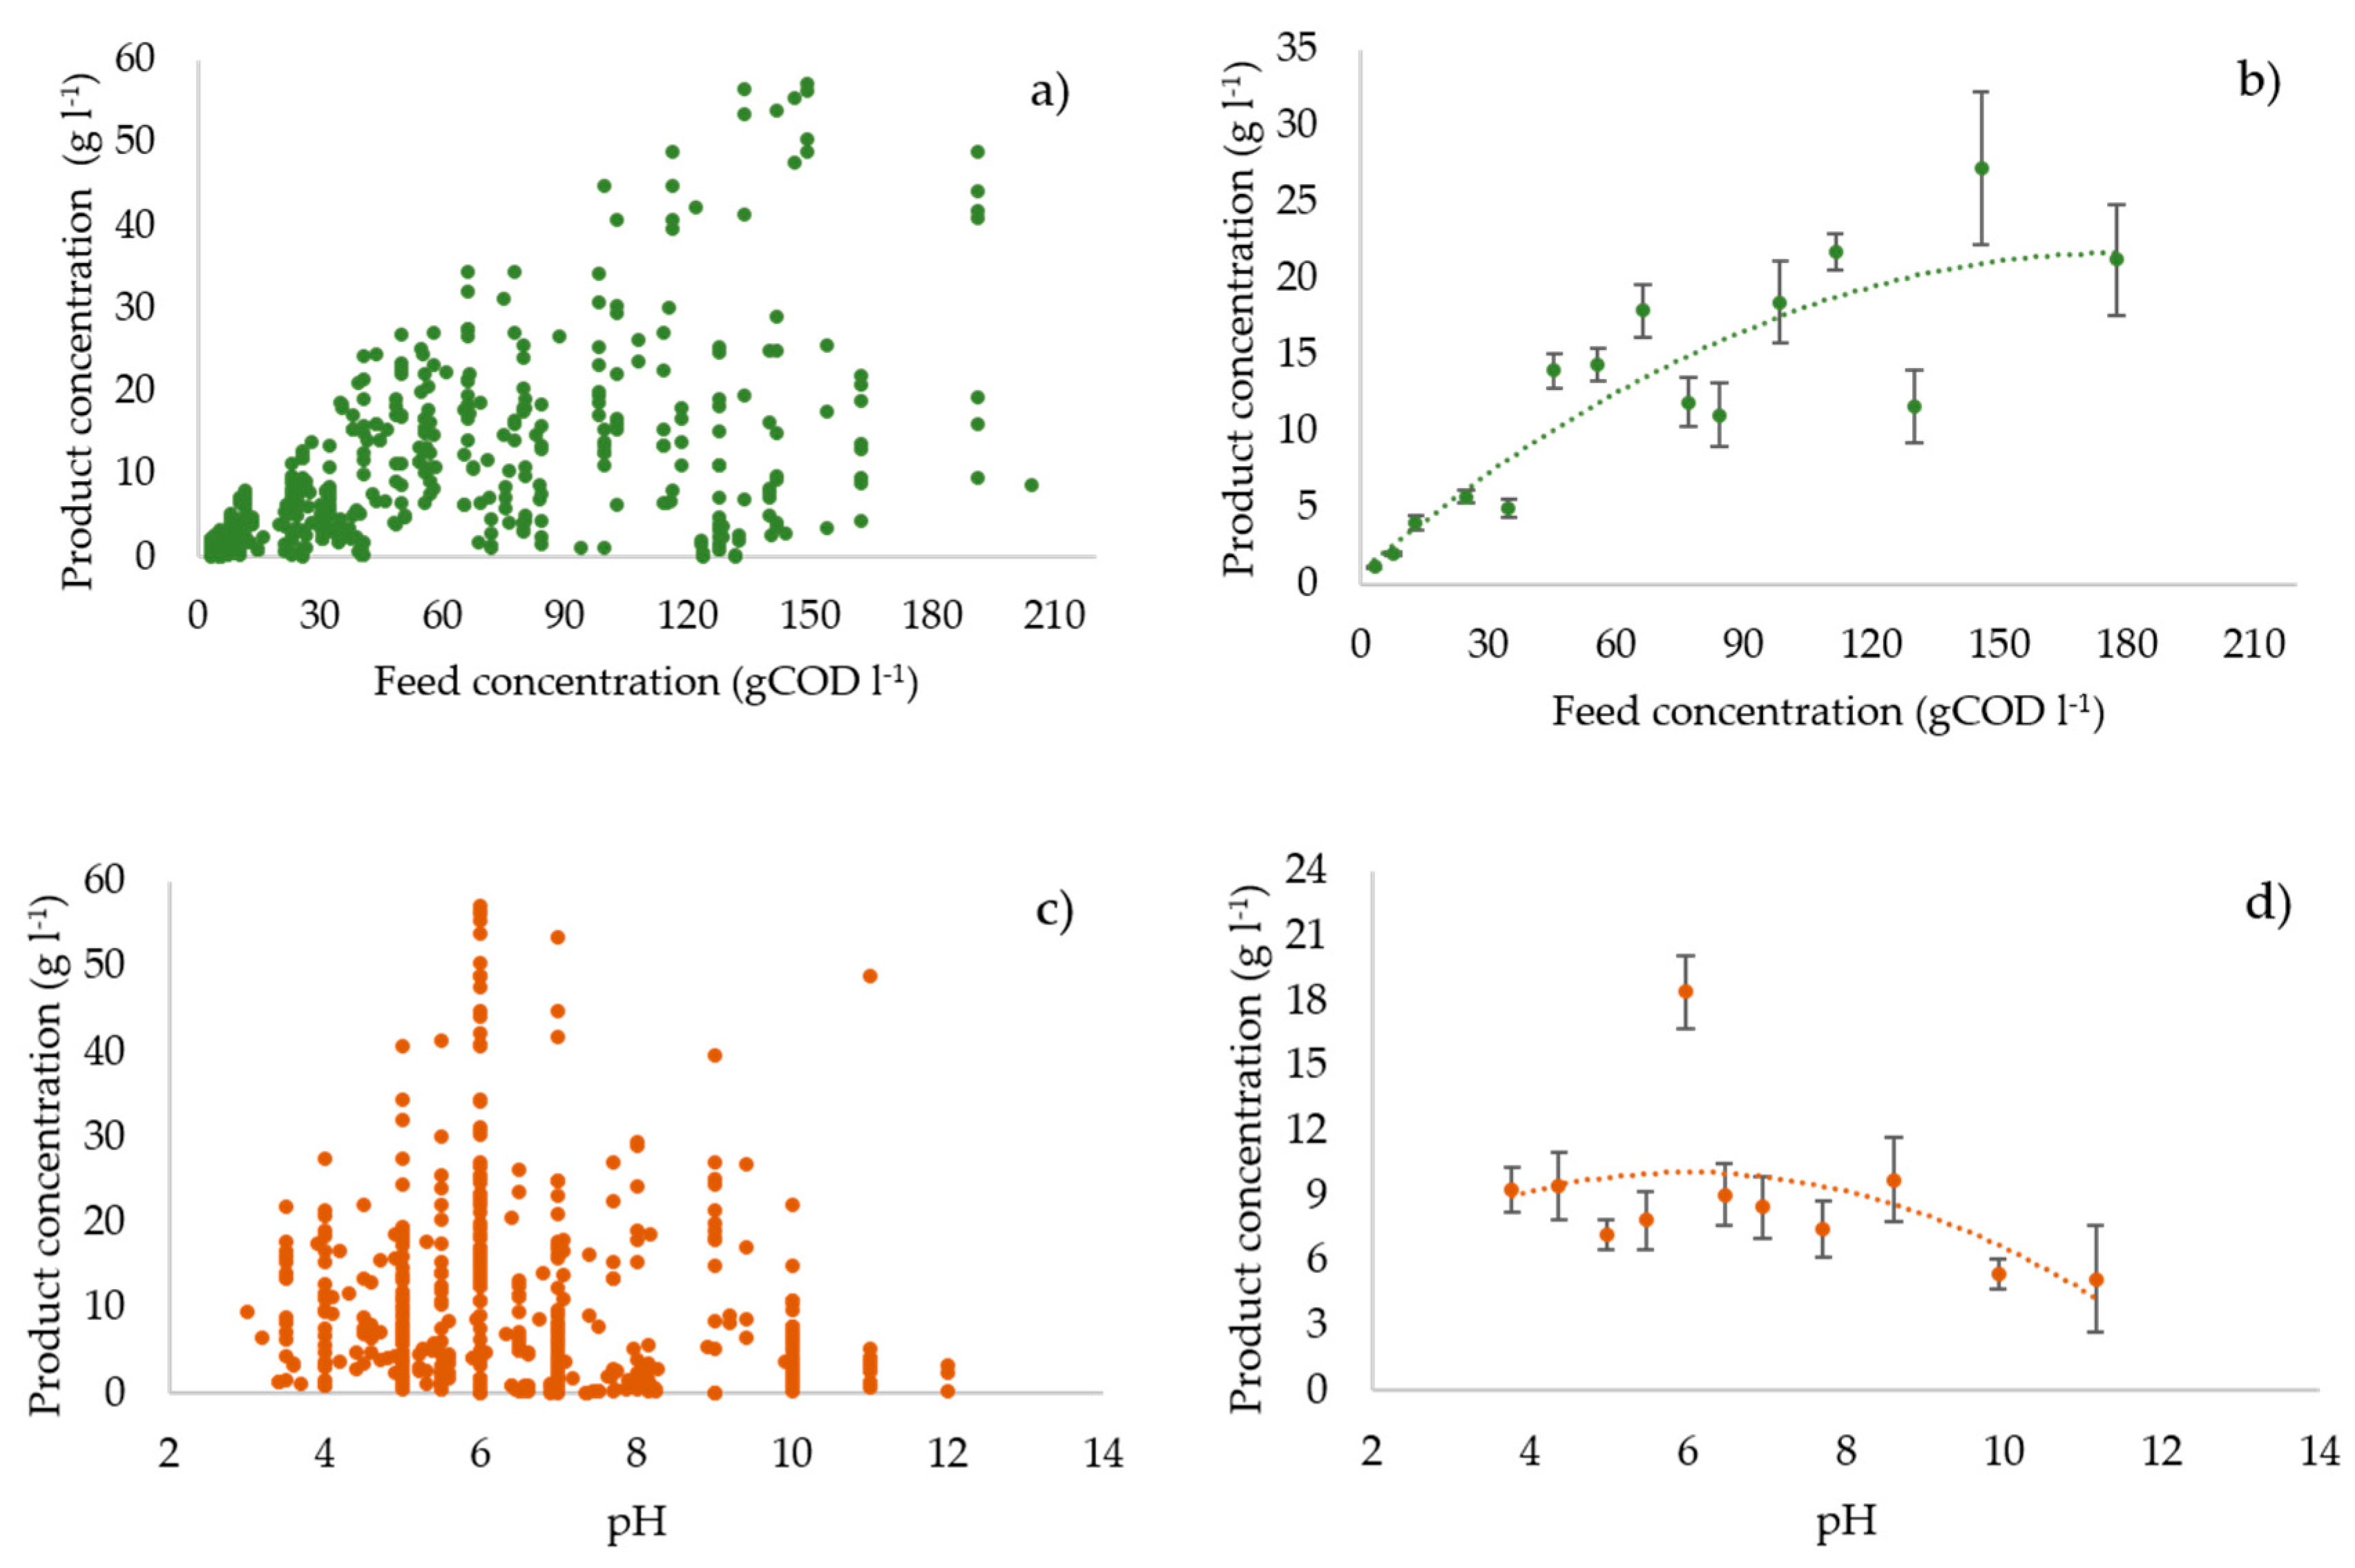
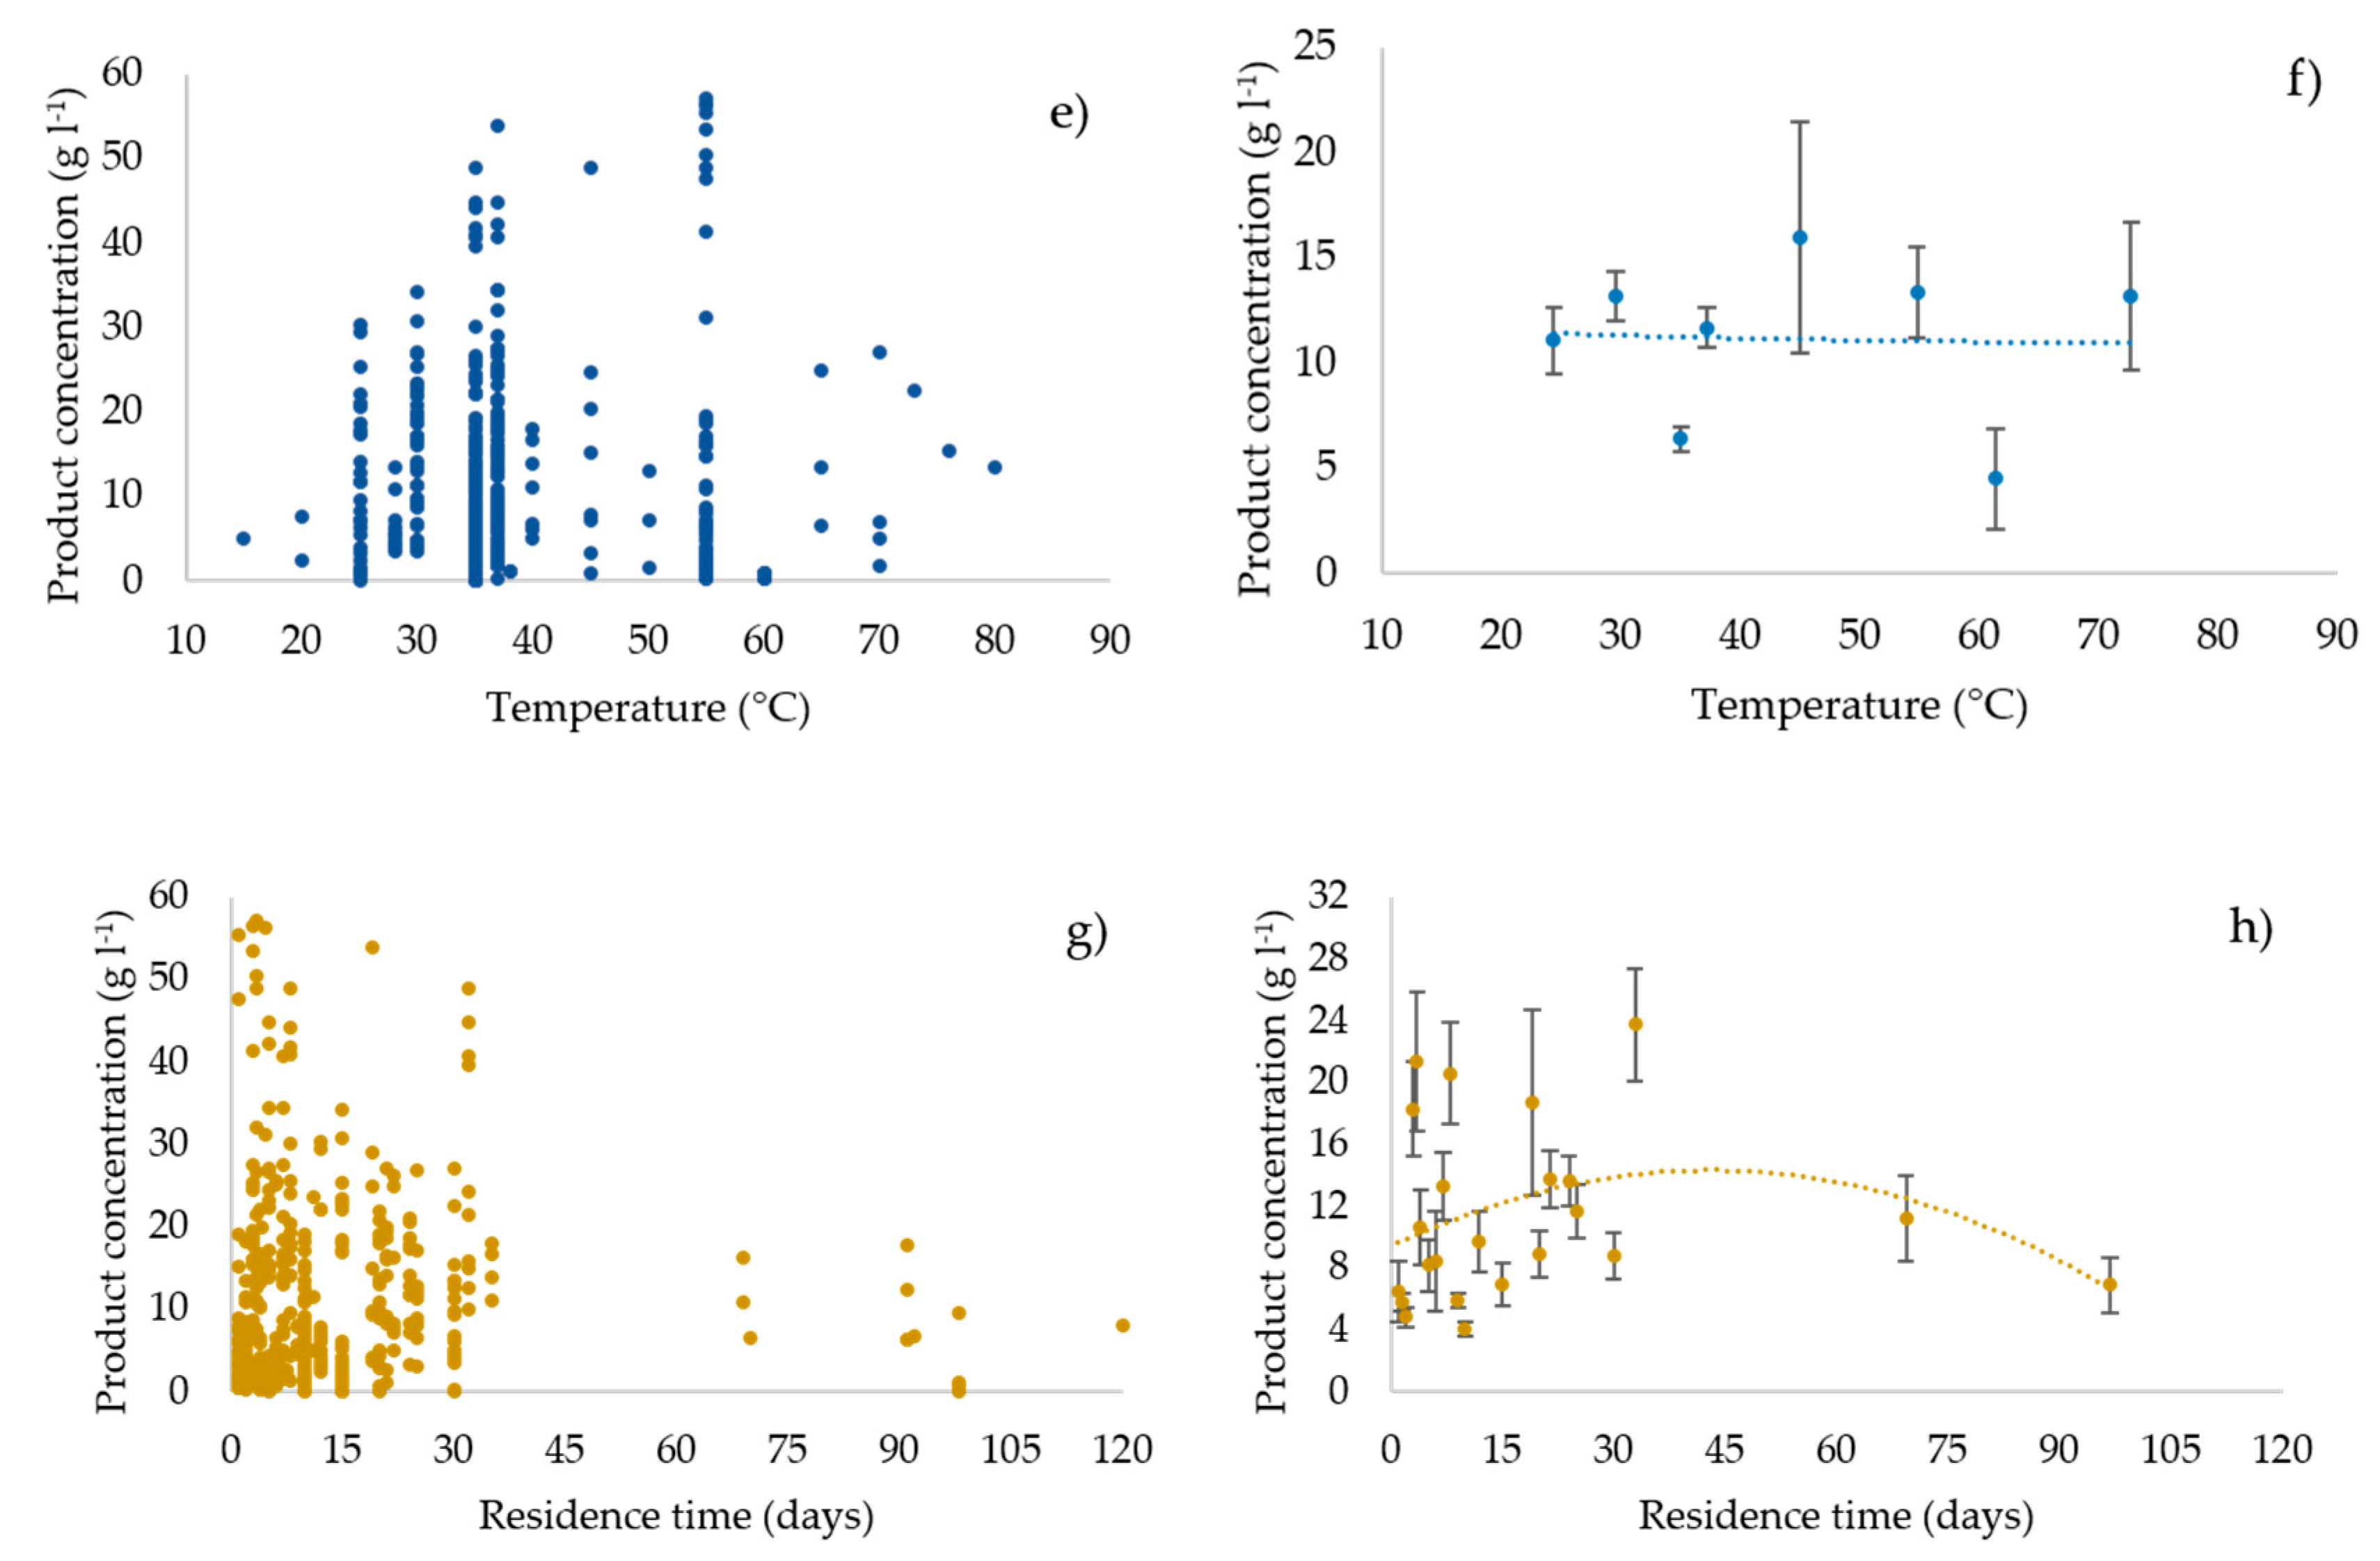
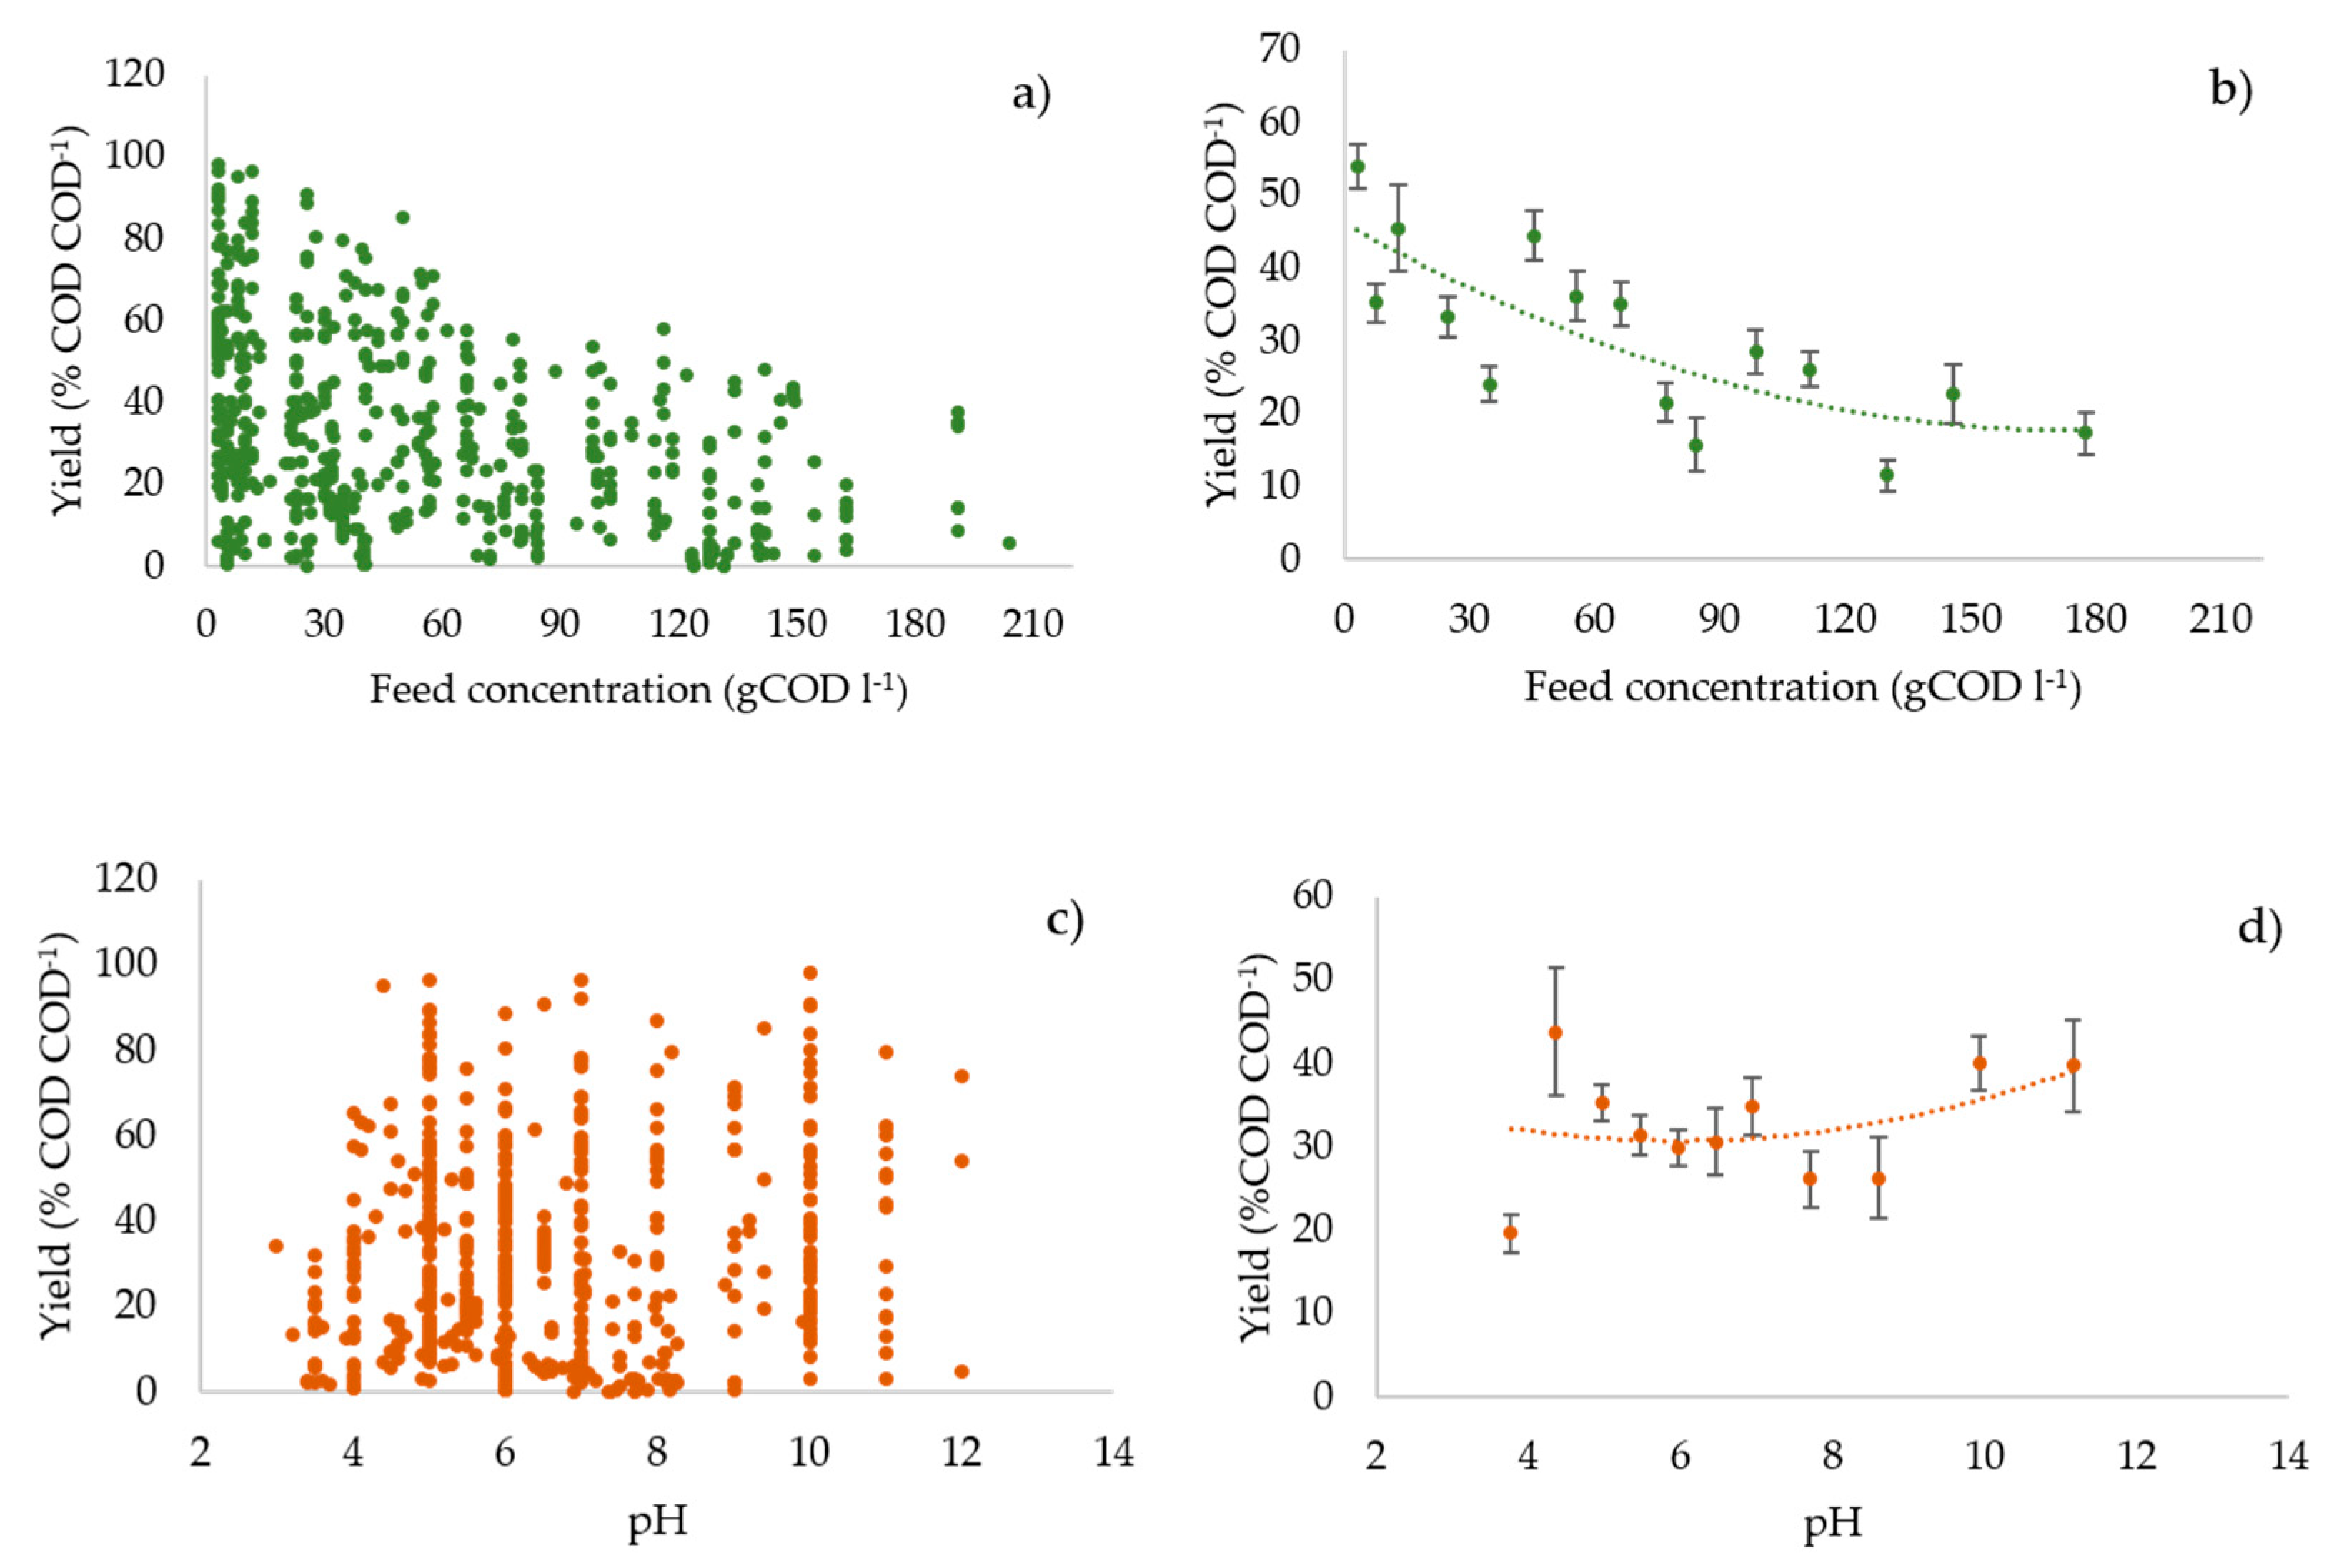
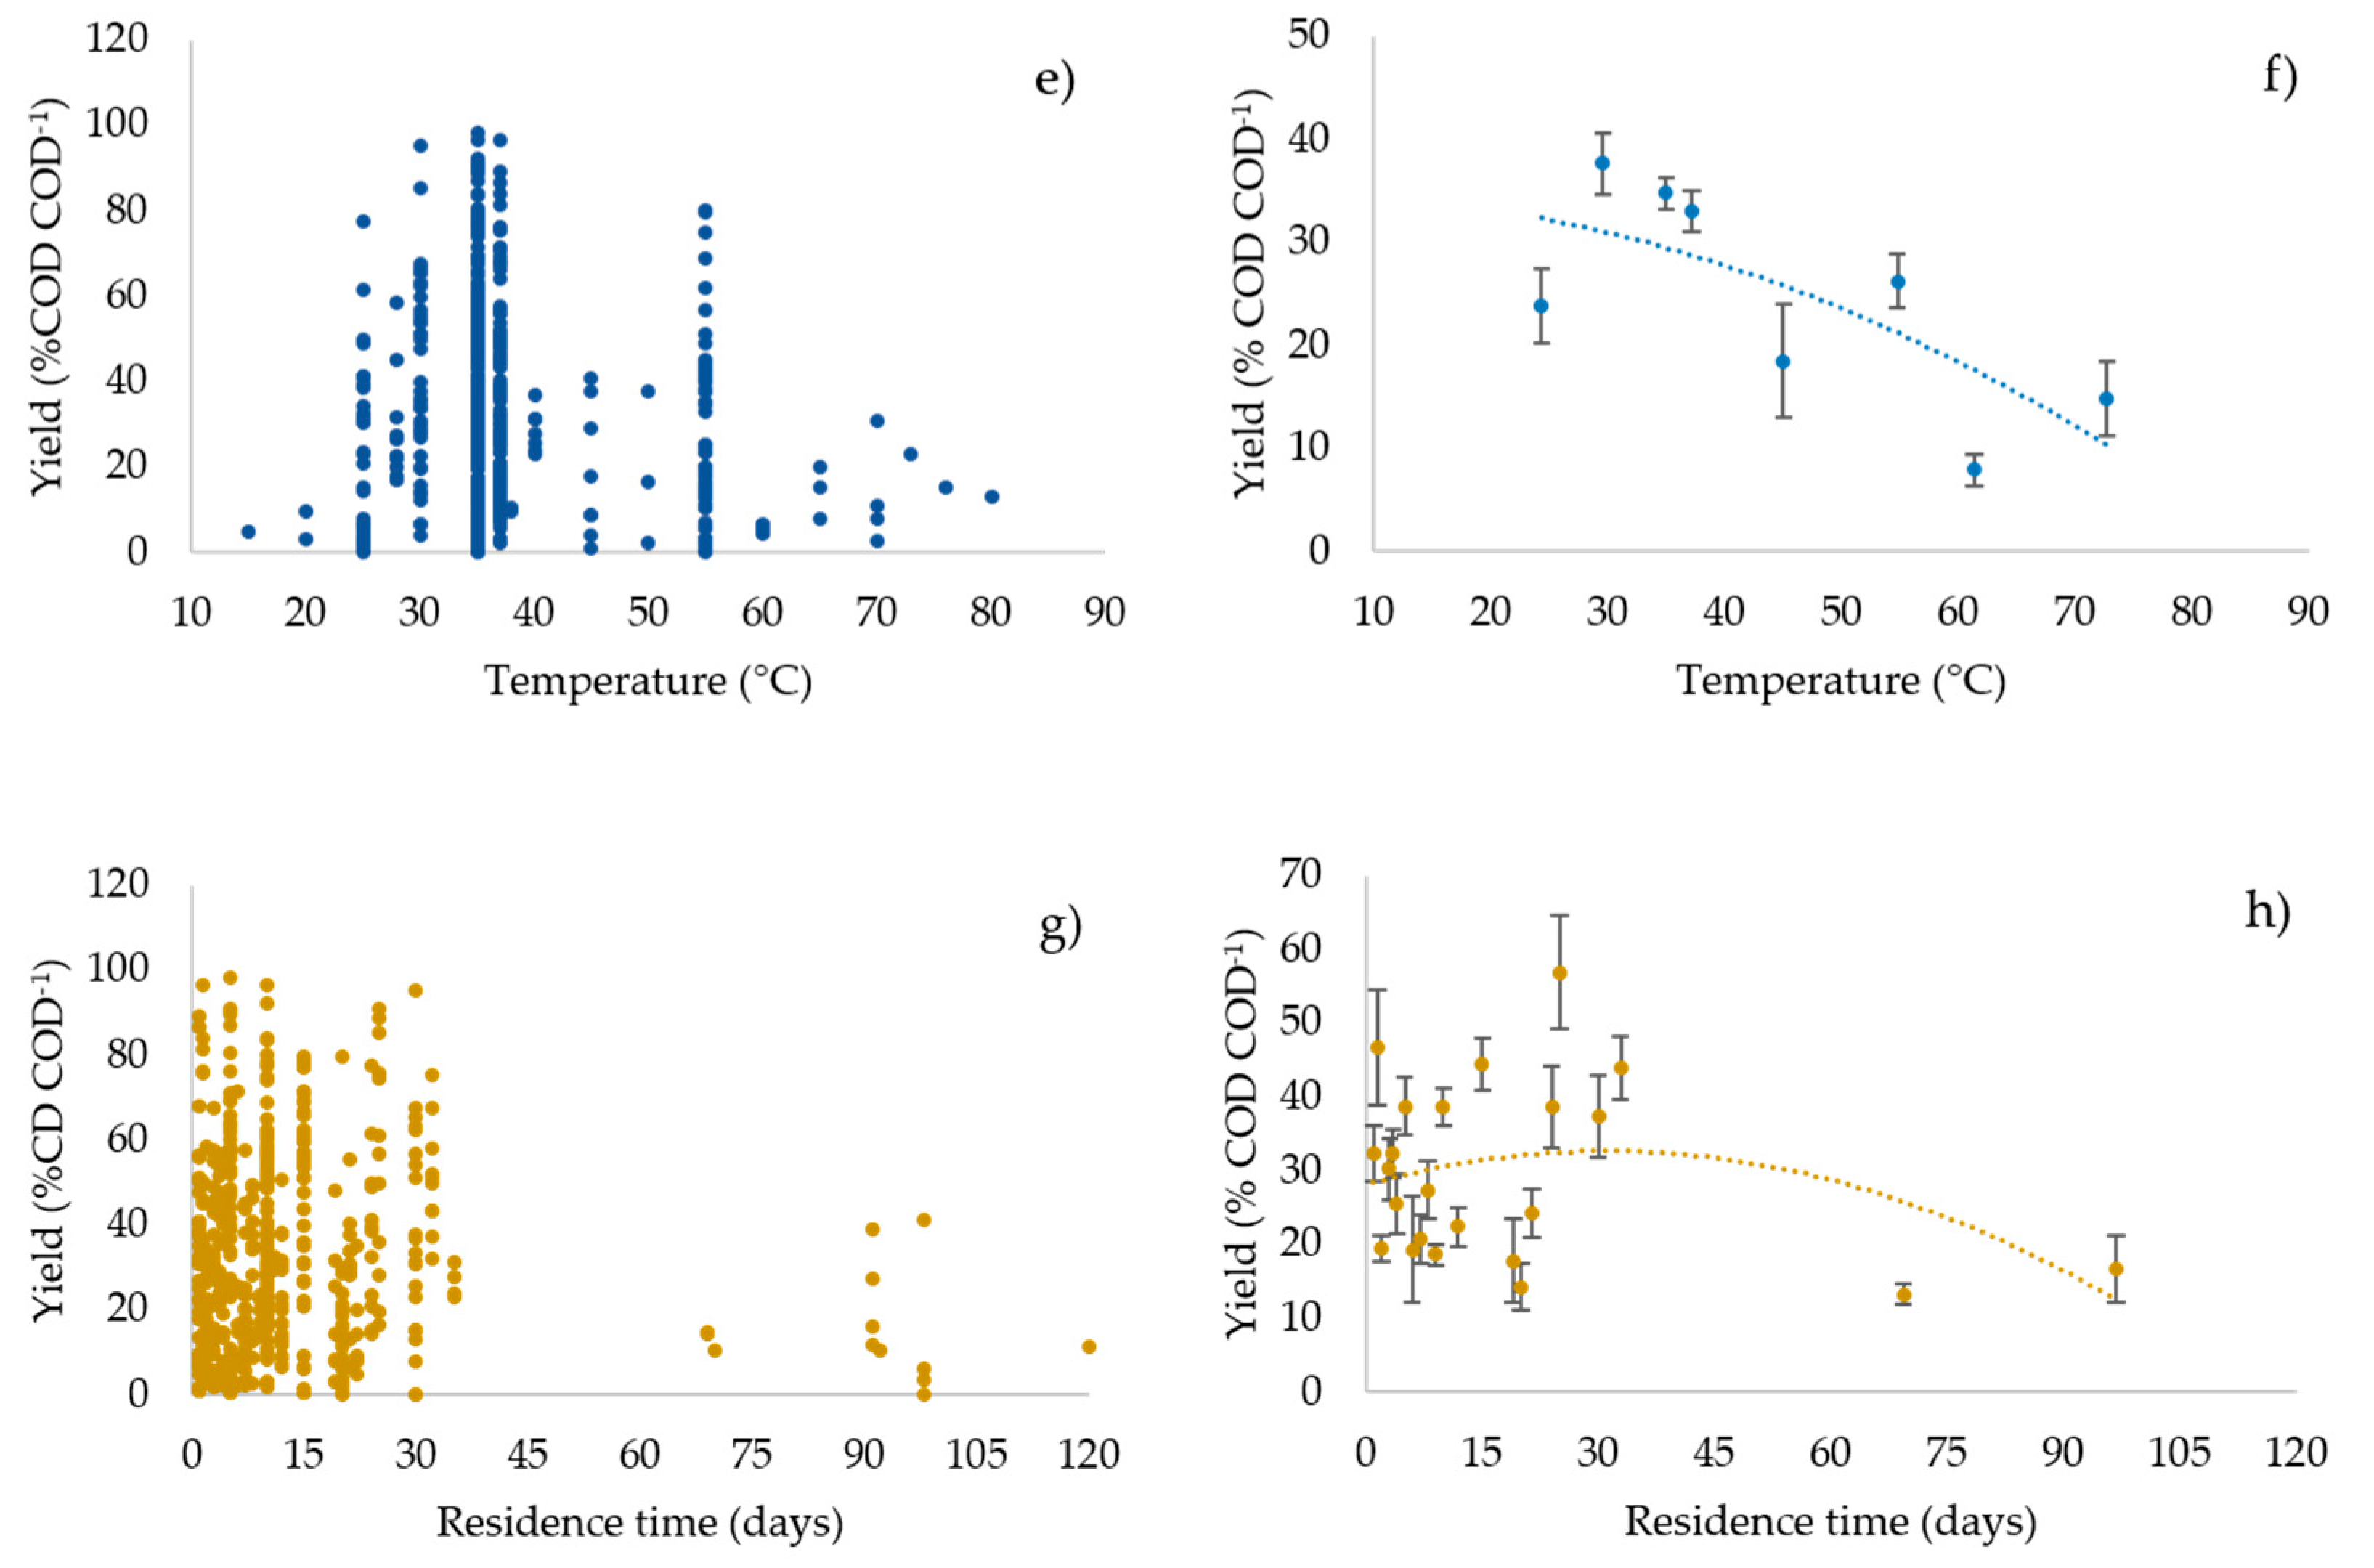
3.3. Profiles of the Performance Variables vs. the Operating Parameters

Figure 1, Figure 2 and Figure 3 show the process performance variables: product concentration (Figure 1), yield (Figure 2), and productivity (Figure 3) vs. the four operating parameters considered (feed concentration, pH, temperature, and residence time). Figure 1a,c,e,g, Figure 2a,c,e,g, and Figure 3a,c,e,g show all the data, while Figure 1b,d,f,h, Figure 2b,d,f,h, and Figure 3b,d,f,h show the mean values and standard error of the performance variables.
Product concentration (Figure 1) shows an increasing trend vs. the feed concentration, as expected. However, the increase was less than linearly proportional to the substrate concentration, especially for the highest substrate concentrations. As far as the effect of the pH is concerned, average values of product concentration were relatively unaffected by the pH in the pH range 4–9.7, but decreased for higher values of the pH. The product concentration was also relatively unaffected by the temperature in the whole range 25–75 °C, while it showed a maximum for intermediate values of the residence time, although the data were highly scattered. The highest product concentrations were reached by fermenting kitchen waste, with thermophilic temperature, pH 6, and using batch or SBR with HRT between 1 and 5 days [48]. The products obtained were lactic acid, acetic acid, and butyric acid. Most of the experiments with the longest residence times were carried out in batch. Only two semi-continuous experiments used a residence time longer than 20 days (30 days), achieving a product concentration of 12.7 g l−1 [15].
The product yield (Figure 2) showed a gradual decrease with the substrate concentration in the feed, staying relatively constant within different values of the pH and decreasing for temperatures above 35 °C and for retention time ≥ 70 days. Maximum yields (close to 100%) were reached with very diluted substrates as low as 3 gCOD l−1. Yields above 88% were reached with a substrate up to 25.6 gCOD l−1 [10,11,42,56], mainly using readily biodegradable substrates such as glucose, whey protein, and potato processing waste stream.
The most important parameters that affect the productivity (Figure 3) are the feed concentration and the residence time. The productivity generally increased as the substrate concentration in the feed increased, and decreased as the residence time increased. These effects can be explained considering that higher feed concentrations tended to give higher product concentration (and therefore higher productivity) and shorter residence times corresponded to smaller reactor volume or shorter reaction time, giving higher productivity. The productivity decreased for higher values of pH (above 6) and showed a maximum for intermediate values of the temperature (45–55 °C). The highest productivities (above 10 g l−1 day−1) were found for feed concentrations between 128 and 149 gCOD l−1 [28,48] and HRT between 1 and 5 days (Figure 3a,b,g,h).

3.4. Comparison of Operating Modes

Table 4 shows the operating parameters and performance variables in the considered studies [7,8,9,10,11,12,13,14,15,16,17,18,19,20,21,22,23,24,25,26,27,28,29,30,31,32,33,34,35,36,37,38,39,40,41,42,43,44,45,46,47,48,49,50,51,52,53,54,55,56,57,58,59,60,61,62,63] as a function of the operating mode: batch, CSTR, and SBR. CSTR operating mode here includes any continuous or semi-continuous processes without solid–liquid separation (i.e., with HRT = SRT), while SBR processes were characterised by solid–liquid separation with SRT > HRT. Section 3.4 gives an insight into the process performance for the different operating modes; however, a complete comparison of all parameters could not be performed, since very few parameters could be considered across these modes at statistically high enough numbers.
The vast majority of the considered experiments were carried out either in batch or in CSTR mode, with only 3% of the experiments carried out in SBR. Batch experiments obtained higher mean yield than CSTR experiments (35 vs. 25%), possibly because the mean run length in batch was longer than the residence time in CSTR (16 vs. 6 days). However, other factors can contribute to this difference, such as the higher pH and lower feed concentration in batch experiments. The mean productivity in CSTR processes was higher than in batch processes (2.50 vs. 1.04 g l−1 day−1) due to the shorter residence time. SBR processes obtained better performance in terms of product concentration, yield, and productivity (mean values 28.79 g l−1, 41.35% COD COD−1, and 12.12 g l−1 day−1, respectively) than batch and CSTR processes. The main reasons for these effects were probably the higher feed concentration (expected positive effect on the product concentration and on the productivity), the higher SRT (expected positive effect on the yield and therefore on the product concentration and productivity), and the shorter HRT (expected positive effect on the productivity) used in SBR processes. However, the nature of the feedstock may also explain some of these differences, since several SBR studies were carried out with glucose, which is readily biodegradable, as a model substrate. This analysis highlights the potential interest of SBR technology to improve the performance of anaerobic fermentation to produce SCOAs. However, as stated above, only very few experiments have been carried out in SBR and there is need of more studies using this technology.

3.5. Analysis of Experiments with the Best Performance

Table 5 summarises and compares the mean operating parameters of the experiments with the best performance in order to showcase which operating parameters gave the best performance, i.e., those with product concentration, yield, and/or productivity over the 90th percentile.
The experiments that showed the highest product concentrations were run with the highest feed concentration. The mean value of feed concentration for the experiments with the highest product concentration was 109 gCOD l−1, while the mean value of the feed concentration in all the experiments was 53 gCOD l−1 (Table 3). The highest product yields were obtained with lower substrate concentrations (mean value 19 gCOD l−1) and with longer SRT. The mean SRT in the experiments with the highest yields was 10 days, while the mean SRT in all the experiments was about 7 days (Table 3). The highest productivities were obtained with relatively high feed concentration (86 gCOD l−1) and for short HRT (2.5 days vs. 6 days as average HRT value of all the experiments, Table 3).

3.6. Statistical Analysis: Regression Model and Pearson’s r Test Results

Statistical analysis of the data was performed with a regression model and with Pearson’s r test. Regressions were performed to correlate product yield, concentration, and productivity to the selected independent variables (feed concentration, mode of operation (batch: 0; CSTR/SBR: 1), temperature, pH, and residence time/HRT). These models follow the generic regression expression in Equation (4). Table 6 summarises the values of regression coefficients and their associated p-values.
Table 6 shows that regression analyses to the considered data showed significant relations (p-value less than 0.05) between product concentration, feed concentration, and operation mode; between yield and feed concentration, mode of operation, and temperature; and between productivity and feed concentration, temperature, and HRT.
It is observed that batch mode and high feed concentration had positive influence on product concentration. Lower feed concentration, batch operation, and lower temperature were found to be beneficial to the product yield. For productivity, shorter residence time, higher temperature, and high feed concentration had a positive effect. Interestingly, the effect of feed concentration on the yield seemed to reverse its effect on product concentration and productivity. Clearly, the regression model was a simplified representation of the complex effect of the operating variables on the performance variables. In particular, the regression model was linear, while the profiles of the performance variables as a function of the operating parameters were in general not linear (Figure 1, Figure 2 and Figure 3). However, the regression model provided some insight into the main effects of the operating parameters.
The Pearson’s r test gave similar results to the regression model. According to the Pearson’s r test, feed concentration had a significant correlation with product concentration and yield (p < 0.01). No significant correlation was found between pH and the three performance parameters, whilst temperature was correlated with the yield, with a significance level of p < 0.05. The HRT was correlated with yield and productivity, with a significance level of 0.05.

3.7. General Discussion

Our analysis of the literature shows that, in the SCOA production with anaerobic digestion, SCOA concentrations of up to 60 g l−1, yields close to 100% (COD COD−1), and productivities close to 50 g l−1 day−1 were reported. However, the challenge is to obtain high SCOA concentrations, yields, and productivities under the same experimental conditions. Section 3.7 compares the findings of this study with other literature studies (Section 3.7.1), analyses the optimum range of operating parameters (Section 3.7.2), and identifies the main knowledge gaps (Section 3.7.3).

3.7.1. Comparison with Other Literature Studies

Various literature studies have investigated the effect of operating conditions on SCOA production, usually investigating only one or two operating conditions and often obtaining different results due to the range of operating conditions and to the nature of the feedstocks used. In this regard, the value of our study is to bring together the data on process performance from different studies trying to identify general trends. Limited investigation has been carried out on the effect of feed concentration on VFA production. Bouzas et al. [70] measured the effect of feed concentration on VFA yield from municipal primary sludge by two plants, obtaining in one case no effect of feed concentration and in the other case an increase in yield for higher feed concentration. Our analysis shows that generally, for the experiments considered in this study, lower yields were obtained for higher feed concentration. Clearly, the nature of the feedstock used also had an effect on the results and may justify the different trends observed. Liu et al. [71] investigated the effect of pH on VFA production from sewage sludge, obtaining the highest yields in the pH range 7–11, and lower yields at pH 5 and 3. Eryildiz et al. [72] investigated the effect of pH on VFA production from citrus waste, obtaining high VFA yields at pH 6 but lower yields at pH 5 and 4. Begum et al. [73] investigated the effect of pH on VFA production from landfill leachate, obtaining the best results at pH 5.5 and 11. In a study on potato peel waste [74], the highest VFA yield was obtained at pH 7, with lower yield at pH 5 and almost no VFA production at pH 11. Jankowska et al. investigated the effect of pH on VFA production from primary and secondary sludge, obtaining the best VFA yield at pH 10–11, but also obtaining good yields at pH 4 [31]. These literature studies show that VFA production using anaerobic digestion is possible in a wide range of pH values, which is confirmed by our analysis, as shown in Figure 1, Figure 2 and Figure 3. As far as the effect of the temperature is concerned, Komemoto et al. [36] investigated the solubilisation of food waste in the range of 15–65 °C, observing the best results at 45 °C, but a good degree of solubilisation in all of the temperature range. In a study on food waste, Jiang et al. [34] observed the highest VFA yields at 35–45 °C, and a much lower yield at 55 °C. With municipal and industrial wastewaters, Maharaj et al. [75] observed that the best temperature for VFA production was 25 °C (the temperature range was 8–35 °C). Our combined analysis of literature data shows that generally there is some negative effect of higher temperatures on SCOA production, although the data were highly scattered and good VFA production could be obtained in a large temperature range. Only a few studies have specifically investigated the effect of residence time on SCOA production and yield. Bengtsson et al. [76] observed that VFA yield generally increased as HRT increased in chemostat studies with industrial wastewaters (the range of HRT investigated was 0–1 days and 0–4 days for paper mill and whey wastewaters, respectively). In the study mentioned above, Jankowska et al. observed an increase in VFA yield as the run length in batch experiments increased from 5 to 15 days.

3.7.2. Identification of the Optimum Range of Operating Parameters

One of the applications of the analysis of the literature carried out in this study is the identification of the range of operating parameters to be used in anaerobic digestion processes for SCOA production in order to obtain the desired performance. Clearly, the validity of the analysis depends on the quality of input data. Only reliable literature sources were used, whilst experiments that did not match were excluded (e.g., COD balance above 100%). Feed concentration should be as high as possible in order to maximise product concentration and productivity, even though high feed concentration tends to give lower product yields. Interestingly, the process can be carried out in a wide range of pH values (4–11) and temperatures (25–75 °C), with only a limited effect on the process performance (defined as the product concentration, yield, and productivity). The residence time has an important effect on process productivity, which strongly increases for lower value of the residence time.

3.7.3. Identification of Knowledge Gaps and Recommendations for Further Study

Another important application of this analysis is to identify the gaps in the operating conditions used in the literature studies, suggesting areas for further research improvements. Although both the theory and the experimental evidence indicate higher product concentration and productivity with higher feed concentration, most literature studies have been carried out with relatively diluted feed. Indeed, the mean value of feed concentration is 53 gCOD l−1 and only 10% of the considered experiments were carried out with feed concentration higher than 127 gCOD l−1. Therefore, our analysis indicates the need for studies with higher feed concentration. Most studies were carried out with pH values in the neutral range (6–8, mean value 6.50) and with temperatures in the range of 35–55 °C (mean value 38 °C). However, it seems that a good process performance can also be obtained outside these ranges of pH and temperature, opening some interesting perspectives for process optimisation. For example, low pH can reduce the process costs because of the reduced requirements of chemicals for pH control, considering the acidifying effect of the products. Low and high pH can also be beneficial for SCOA production because of the reduced activity of methanogenic microorganisms outside the pH range 6–8. Similarly, lower temperature can give lower process costs due to the reduced costs for heating the digester. Our analysis indicates, therefore, the need for more experimental studies in a wider range of pH values and temperatures. As far as the range of residence time (or of run length for batch studies) is concerned, the vast majority of the literature studies were carried out with relatively low values, lower than 20–30 days. Since, according to the theory, a higher degradation of the feedstock is expected at longer residence times, more studies with long residence time are required (above 20 days). The very few studies carried out at long residence times (>70 days) did not obtain a higher yield than the other studies; however, there were too few studies to identify any significant effects. In the choice of the residence time for SCOA production, the objective should be to achieve high yield and high productivity. However, batch processes and continuous processes in CSTR with HRT = SRT have the limitation that a long residence time, which should favour high yield, can only be obtained at the expense of the productivity. Indeed, according to our analysis and to the expectations based on the theory, process productivity decreases for longer HRT values or run length in batch processes. In order to run processes with short HRT, which should correspond to high productivity (and long SRT, which should correspond to high yield), the SBR configuration is a promising alternative to the more common batch or CSTR configurations. However, only about 3% of the considered studies were carried out in SBR. The few studies in SBR obtained higher product concentration, yield, and productivity than studies in batch or CSTR, highlighting the need for more experimental studies with this configuration. Average product concentration in SBR was 3.53 times higher than CSTR and 3.06 times higher than batch, yield was 1.64 times higher than CSTR and 1.17 times higher than batch, and productivity in SBR was 4.85 times higher than CSTR and 11.65 times higher than batch experiments. Lastly, it is suggested that future improvements on the current data analysis methods will be made by analysing the effect of the substrate composition and by using non-linear regression models.

4. Conclusions

In this analysis of the literature, different approaches (visual, descriptive stats, regression model, and Pearson correlation test) were used, which gave similar general conclusions about the effect of process parameters on product concentration, yield, and productivity. Overall, high substrate concentration in the feed contributed to the maximisation of product concentration and productivity. Generally, temperature and pH had relatively little effect on the performance variables, although temperature had a modest significant effect on yield and productivity. pH was not correlated significantly with any of the performance variables, but higher product concentrations and productivities were reached with values close to neutrality. Longer HRT negatively affected productivity. Very few experiments were conducted in SBR, which, however, seemed to indicate a better performance of this process in terms of SCOA concentration, yield, and productivity. More experimental study is required on anaerobic digestion processes for SCOA production, aimed at the simultaneous maximisation of product concentration, yield, and productivity. In particular, a more extended investigation of process parameters in processes with solid–liquid separation is needed, with longer SRT and shorter HRT. Moreover, more investigation of highly concentrated feedstocks is recommended. It is important to remember that other factors influence anaerobic digestion, such as inoculum source, pre-treatments, trace metal addition, headspace gas pressure, and composition, but few experiments were performed with the aim of assessing such variables. This literature review thus serves as an initial critical guideline for the choice of future experimental conditions regarding the production of SCOAs from anaerobic digestion.

Supplementary Materials

The following are available online at https://www.mdpi.com/2227-9717/8/12/1538/s1: Table S1: Substrate types, operational parameters and products of the analysed experiments.

Author Contributions

Conceptualisation, D.D. and S.S.; methodology, S.S. and A.S.; investigation, data curation, and writing—original draft preparation, S.S.; writing—review and editing, D.D., A.S., and C.F.M.; visualisation, supervision, and funding acquisition, D.D. and C.F.M. All authors have read and agreed to the published version of the manuscript.

Funding

This study was funded by LEVERHULME TRUST. Serena Simonetti, a Leverhulme Trust Doctoral Scholar, is part of the 15 PhD scholarships of the “Leverhulme Centre for Doctoral Training in Sustainable Production of Chemicals and Materials” at the University of Aberdeen (Scotland, United Kingdom).

Conflicts of Interest

The authors declare no conflict of interest.

References

  1. Kleerebezem, R.; Joosse, B.; Rozendal, R.; Van Loosdrecht, M.C.M. Anaerobic digestion without biogas? Rev. Environ. Sci. Bio Technol. 2015, 14, 787–801. [Google Scholar] [CrossRef] [Green Version]
  2. Dionisi, D.; Silva, I.M.O. Production of ethanol, organic acids and hydrogen: An opportunity for mixed culture biotechnology? Rev. Environ. Sci. Bio Technol. 2016, 15, 213–242. [Google Scholar] [CrossRef]
  3. Pal, P.; Nayak, J. Acetic Acid Production and Purification: Critical Review Towards Process Intensification. Sep. Purif. Rev. 2017, 46, 44–61. [Google Scholar] [CrossRef]
  4. Gonzalez-Garcia, R.A.; McCubbin, T.; Navone, L.; Stowers, C.; Nielsen, L.K.; Marcellin, E. Microbial Propionic Acid Production. Fermentation 2017, 3, 21. [Google Scholar] [CrossRef]
  5. Komesu, A.; Oliveira, J.A.R.d.; Martins, L.H.d.S.; Wolf Maciel, M.R.; Maciel Filho, R. Lactic acid production to purification: A review. BioResources 2017, 12, 4364–4383. [Google Scholar] [CrossRef]
  6. Murali, N.; Srinivas, K.; Ahring, B.K. Biochemical Production and Separation of Carboxylic Acids for Biorefinery Applications. Fermentation 2017, 3, 22. [Google Scholar] [CrossRef] [Green Version]
  7. Alibardi, L.; Cossu, R. Effects of carbohydrate, protein and lipid content of organic waste on hydrogen production and fermentation products. Waste Manag. 2016, 47, 69–77. [Google Scholar] [CrossRef]
  8. Argelier, S.; Delgenes, J.-P.; Moletta, R. Design of acidogenic reactors for the anaerobic treatment of the organic fraction of solid food waste. Bioprocess. Biosyst. Eng. 1998, 18, 309–315. [Google Scholar] [CrossRef]
  9. Arras, W.; Hussain, A.; Hausler, R.; Guiot, S.R. Mesophilic, thermophilic and hyperthermophilic acidogenic fermentation of food waste in batch: Effect of inoculum source. Waste Manag. 2019, 87, 279–287. [Google Scholar] [CrossRef]
  10. Arslan, D.; Steinbusch, K.; Diels, L.; De Wever, H.; Hamelers, H.; Buisman, C. Selective carboxylate production by controlling hydrogen, carbon dioxide and substrate concentrations in mixed culture fermentation. Bioresour. Technol. 2013, 136, 452–460. [Google Scholar] [CrossRef]
  11. Atasoy, M.; Eyice, O.; Schnürer, A.; Cetecioglu, Z. Volatile fatty acids production via mixed culture fermentation: Revealing the link between pH, inoculum type and bacterial composition. Bioresour. Technol. 2019, 292, 121889. [Google Scholar] [CrossRef] [PubMed]
  12. Lakeh, A.B.; Azizi, A.; Koupaie, E.H.; Bekmuradov, V.; Hafez, H.; Elbeshbishy, E. A comprehensive study for characteristics, acidogenic fermentation, and anaerobic digestion of source separated organics. J. Clean. Prod. 2019, 228, 73–85. [Google Scholar] [CrossRef]
  13. Bermúdez-Penabad, N.; Kennes, C.; Veiga, M.C. Anaerobic digestion of tuna waste for the production of volatile fatty acids. Waste Manag. 2017, 68, 96–102. [Google Scholar] [CrossRef] [PubMed]
  14. Bi, S.; Qiao, W.; Xiong, L.; Ricci, M.; Adani, F.; Dong, R. Effects of organic loading rate on anaerobic digestion of chicken manure under mesophilic and thermophilic conditions. Renew. Energy 2019, 139, 242–250. [Google Scholar] [CrossRef]
  15. Bolaji, I.O.; Dionisi, D. Acidogenic fermentation of vegetable and salad waste for chemicals production: Effect of pH buffer and retention time. J. Environ. Chem. Eng. 2017, 5, 5933–5943. [Google Scholar] [CrossRef] [Green Version]
  16. Calicioglu, O.; Shreve, M.J.; Richard, T.L.; Brennan, R.A. Effect of pH and temperature on microbial community structure and carboxylic acid yield during the acidogenic digestion of duckweed. Biotechnol. Biofuels 2018, 11, 1–19. [Google Scholar] [CrossRef] [Green Version]
  17. Cavinato, C.; Da Ros, C.; Pavan, P.; Bolzonella, D. Influence of temperature and hydraulic retention on the production of volatile fatty acids during anaerobic fermentation of cow manure and maize silage. Bioresour. Technol. 2017, 223, 59–64. [Google Scholar] [CrossRef]
  18. Cheah, Y.-K.; Vidal-Antich, C.; Dosta, J.; Mata-Álvarez, J. Volatile fatty acid production from mesophilic acidogenic fermentation of organic fraction of municipal solid waste and food waste under acidic and alkaline pH. Environ. Sci. Pollut. Res. 2019, 26, 35509–35522. [Google Scholar] [CrossRef] [Green Version]
  19. Chen, Y.; Jiang, X.; Xiao, K.; Shen, N.; Zeng, R.J.; Zhou, Y. Enhanced volatile fatty acids (VFAs) production in a thermophilic fermenter with stepwise pH increase e Investigation on dissolved organic matter transformation and microbial community shift. Water Res. 2017, 112, 261–268. [Google Scholar] [CrossRef]
  20. Dahiya, S.; Sarkar, O.; Swamy, Y.; Mohan, S.V. Acidogenic fermentation of food waste for volatile fatty acid production with co-generation of biohydrogen. Bioresour. Technol. 2015, 182, 103–113. [Google Scholar] [CrossRef]
  21. Darvekar, P.; Liang, C.; Karim, M.N.; Holtzapple, M. Effect of headspace gas composition on carboxylates production in open-culture fermentation of corn stover. Biomass Bioenergy 2019, 126, 57–61. [Google Scholar] [CrossRef]
  22. Demirer, G.N.; Othman, M. Two-Phase Thermophilic Acidification and Mesophilic Methanogenesis Anaerobic Digestion of Waste-Activated Sludge. Environ. Eng. Sci. 2008, 25, 1291–1300. [Google Scholar] [CrossRef]
  23. Dionisi, D.; Bolaji, I. Biorefinery with open mixed cultures for biofuels and chemicals production from organic waste: Biodegradation of unpretreated cellulose. Chem. Eng. Trans. 2016, 49, 157–162. [Google Scholar]
  24. Feng, K.; Li, H.; Zheng, C. Shifting product spectrum by pH adjustment during long-term continuous anaerobic fermentation of food waste. Bioresour. Technol. 2018, 270, 180–188. [Google Scholar] [CrossRef] [PubMed]
  25. Gameiro, T.; Lopes, M.; Marinho, R.; Vergine, P.; Nadais, H.; Capela, I. Hydrolytic-Acidogenic Fermentation of Organic Solid Waste for Volatile Fatty Acids Production at Different Solids Concentrations and Alkalinity Addition. Water Air Soil Pollut. 2016, 227, 391. [Google Scholar] [CrossRef]
  26. Garcia-Aguirre, J.; Aymerich, E.; De Goñi, J.G.-M.; Esteban-Gutiérrez, M. Selective VFA production potential from organic waste streams: Assessing temperature and pH influence. Bioresour. Technol. 2017, 244, 1081–1088. [Google Scholar] [CrossRef]
  27. González-Fernández, C.; Mendez, L.; Tomás-Pejó, E.; Ballesteros, M. Biogas and Volatile Fatty Acids Production: Temperature as a Determining Factor in the Anaerobic Digestion of Spirulina platensis. Waste Biomass Valori. 2018, 10, 2507–2515. [Google Scholar] [CrossRef]
  28. Han, G.; Shin, S.G.; Lee, J.; Lee, C.; Jo, M.; Hwang, S. Mesophilic Acidogenesis of Food Waste-Recycling Wastewater: Effects of Hydraulic Retention Time, pH, and Temperature. Appl. Biochem. Biotechnol. 2016, 180, 980–999. [Google Scholar] [CrossRef]
  29. Herrero Garcia, N.; Strazzera, G.; Frison, N.; Bolzonella, D. Volatile fatty acids production from household food waste. Chem. Eng. Trans. 2018, 64, 103–108. [Google Scholar]
  30. Iglesias-Iglesias, R.; Campanaro, S.; Treu, L.; Kennes, C.; Veiga, M.C. Valorization of sewage sludge for volatile fatty acids production and role of microbiome on acidogenic fermentation. Bioresour. Technol. 2019, 291, 121817. [Google Scholar] [CrossRef]
  31. Jankowska, E.; Chwiałkowska, J.; Stodolny, M.; Oleskowicz-Popiel, P. Effect of pH and retention time on volatile fatty acids production during mixed culture fermentation. Bioresour. Technol. 2015, 190, 274–280. [Google Scholar] [CrossRef] [PubMed]
  32. Jankowska, E.; Chwiałkowska, J.; Stodolny, M.; Oleskowicz-Popiel, P. Volatile fatty acids production during mixed culture fermentation—The impact of substrate complexity and pH. Chem. Eng. J. 2017, 326, 901–910. [Google Scholar] [CrossRef]
  33. Jankowska, E.; Duber, A.; Chwiałkowska, J.; Stodolny, M.; Oleskowicz-Popiel, P. Conversion of organic waste into volatile fatty acids—The influence of process operating parameters. Chem. Eng. J. 2018, 345, 395–403. [Google Scholar] [CrossRef]
  34. Jiang, J.; Zhang, Y.; Li, K.; Wang, Q.; Gong, C.; Li, M. Volatile fatty acids production from food waste: Effects of pH, temperature, and organic loading rate. Bioresour. Technol. 2013, 143, 525–530. [Google Scholar] [CrossRef] [PubMed]
  35. Karthikeyan, O.P.; Selvam, A.; Wong, J.W. Hydrolysis–acidogenesis of food waste in solid–liquid-separating continuous stirred tank reactor (SLS-CSTR) for volatile organic acid production. Bioresour. Technol. 2016, 200, 366–373. [Google Scholar] [CrossRef] [PubMed]
  36. Komemoto, K.; Lim, Y.; Nagao, N.; Onoue, Y.; Niwa, C.; Toda, T. Effect of temperature on VFA’s and biogas production in anaerobic solubilization of food waste. Waste Manag. 2009, 29, 2950–2955. [Google Scholar] [CrossRef] [PubMed]
  37. Kumar, A.; Mohan, S.V. Acidogenic valorization of vegetable waste for short chain carboxylic acids and biohydrogen production: Influence of pretreatment and pH. J. Clean. Prod. 2018, 203, 1055–1066. [Google Scholar] [CrossRef]
  38. Lee, M.; Hidaka, T.; Tsuno, H. Effect of temperature on performance and microbial diversity in hyperthermophilic digester system fed with kitchen garbage. Bioresour. Technol. 2008, 99, 6852–6860. [Google Scholar] [CrossRef]
  39. Li, Q.; Li, H.; Wang, G.; Wang, X.C. Effects of loading rate and temperature on anaerobic co-digestion of food waste and waste activated sludge in a high frequency feeding system, looking in particular at stability and efficiency. Bioresour. Technol. 2017, 237, 231–239. [Google Scholar] [CrossRef]
  40. Li, Y.; Su, D.; Feng, H.; Yan, F.; Liu, H.; Feng, L.; Liu, G. Anaerobic acidogenic fermentation of food waste for mixed-acid production. Energy Sources Part A Recover. Util. Environ. Eff. 2017, 39, 631–635. [Google Scholar] [CrossRef]
  41. Li, Y.; Zhang, X.; Xu, H.; Mu, H.; Hua, D.; Jin, F.; Meng, G. Acidogenic properties of carbohydrate-rich wasted potato and microbial community analysis: Effect of pH. J. Biosci. Bioeng. 2019, 128, 50–55. [Google Scholar] [CrossRef]
  42. Li, L.; Wang, Y.; Li, Y. Effects of substrate concentration, hydraulic retention time and headspace pressure on acid production of protein by anaerobic fermentation. Bioresour. Technol. 2019, 283, 106–111. [Google Scholar] [CrossRef]
  43. Lim, S.-J.; Kim, B.J.; Jeong, C.-M.; Choi, J.-D.-R.; Ahn, Y.H.; Chang, H.N. Anaerobic organic acid production of food waste in once-a-day feeding and drawing-off bioreactor. Bioresour. Technol. 2008, 99, 7866–7874. [Google Scholar] [CrossRef]
  44. Ma, H.; Chen, X.; Liu, H.; Liu, H.; Fu, B. Improved volatile fatty acids anaerobic production from waste activated sludge by pH regulation: Alkaline or neutral pH? Waste Manag. 2016, 48, 397–403. [Google Scholar] [CrossRef]
  45. Ma, H.; Liu, H.; Zhang, L.; Yang, M.; Fu, B.; Liu, H. Novel insight into the relationship between organic substrate composition and volatile fatty acids distribution in acidogenic co-fermentation. Biotechnol. Biofuels 2017, 10, 137. [Google Scholar] [CrossRef] [Green Version]
  46. Ma, J.; Xie, S.; Yu, L.; Zhen, Y.; Zhao, Q.; Frear, C.; Chen, S.; Wang, Z.-W.; Shi, Z. pH shaped kinetic characteristics and microbial community of food waste hydrolysis and acidification. Biochem. Eng. J. 2019, 146, 52–59. [Google Scholar] [CrossRef]
  47. Moretto, G.; Valentino, F.; Pavan, P.; Majone, M.; Bolzonella, D. Optimization of urban waste fermentation for volatile fatty acids production. Waste Manag. 2019, 92, 21–29. [Google Scholar] [CrossRef]
  48. Park, Y.-J.; Tsuno, H.; Hidaka, T.; Cheon, J.-H. Evaluation of operational parameters in thermophilic acid fermentation of kitchen waste. J. Mater. Cycles Waste Manag. 2008, 10, 46–52. [Google Scholar] [CrossRef]
  49. Reddy, M.V.; Hayashi, S.; Choi, D.; Cho, H.; Chang, Y.-C. Short chain and medium chain fatty acids production using food waste under non-augmented and bio-augmented conditions. J. Clean. Prod. 2018, 176, 645–653. [Google Scholar] [CrossRef]
  50. Shahriari, H.; Warith, M.; Hamoda, M.; Kennedy, K. Evaluation of single vs. staged mesophilic anaerobic digestion of kitchen waste with and without microwave pretreatment. J. Environ. Manag. 2013, 125, 74–84. [Google Scholar] [CrossRef]
  51. Silva, I.M.O.; Dionisi, D. Anaerobic digestion of wheat grass under mesophilic and thermophilic conditions and different inoculum sources. Chem. Eng. Trans. 2016, 50, 19–24. [Google Scholar]
  52. Tang, J.; Wang, X.C.; Hu, Y.; Zhang, Y.; Li, Y. Lactic acid fermentation from food waste with indigenous microbiota: Effects of pH, temperature and high OLR. Waste Manag. 2016, 52, 278–285. [Google Scholar] [CrossRef]
  53. Tang, J.; Wang, X.C.; Hu, Y.; Zhang, Y.; Li, Y. Effect of pH on lactic acid production from acidogenic fermentation of food waste with different types of inocula. Bioresour. Technol. 2017, 224, 544–552. [Google Scholar] [CrossRef]
  54. Wang, K.; Yin, J.; Shen, D.; Li, N. Anaerobic digestion of food waste for volatile fatty acids (VFAs) production with different types of inoculum: Effect of pH. Bioresour. Technol. 2014, 161, 395–401. [Google Scholar] [CrossRef]
  55. Wu, Y.; Ma, H.; Zheng, M.; Wang, K. Lactic acid production from acidogenic fermentation of fruit and vegetable wastes. Bioresour. Technol. 2015, 191, 53–58. [Google Scholar] [CrossRef]
  56. Wu, Y.; Wang, C.; Zheng, M.; Zuo, J.; Wu, J.; Wang, K.; Yang, B. Effect of pH on ethanol-type acidogenic fermentation of fruit and vegetable waste. Waste Manag. 2017, 60, 158–163. [Google Scholar] [CrossRef]
  57. Yin, J.; Wang, K.; Yang, Y.; Shen, D.; Wang, M.; Mo, H. Improving production of volatile fatty acids from food waste fermentation by hydrothermal pretreatment. Bioresour. Technol. 2014, 171, 323–329. [Google Scholar] [CrossRef]
  58. Yin, J.; Yu, X.; Zhang, Y.; Shen, D.; Wang, M.; Long, Y.; Chen, T. Enhancement of acidogenic fermentation for volatile fatty acid production from food waste: Effect of redox potential and inoculum. Bioresour. Technol. 2016, 216, 996–1003. [Google Scholar] [CrossRef]
  59. Yin, J.; Yu, X.; Wang, K.; Shen, D. Acidogenic fermentation of the main substrates of food waste to produce volatile fatty acids. Int. J. Hydrog. Energy 2016, 41, 21713–21720. [Google Scholar] [CrossRef]
  60. Yu, X.; Yin, J.; Wang, K.; Shen, D.; Long, Y.; Chen, T. Enhancing Food Waste Hydrolysis and the Production Rate of Volatile Fatty Acids by Prefermentation and Hydrothermal Pretreatments. Energy Fuels 2016, 30, 4002–4008. [Google Scholar] [CrossRef]
  61. Yu, X.; Yin, J.; Shen, D.; Shentu, J.; Long, Y.; Chen, T. Improvement of acidogenic fermentation for volatile fatty acid production from protein-rich substrate in food waste. Waste Manag. 2018, 74, 177–184. [Google Scholar] [CrossRef]
  62. Zhang, B.; Zhang, L.-L.; Zhang, S.-C.; Shi, H.-Z.; Cai, W.-M. The Influence of pH on Hydrolysis and Acidogenesis of Kitchen Wastes in Two-phase Anaerobic Digestion. Environ. Technol. 2005, 26, 329–340. [Google Scholar] [CrossRef]
  63. Zheng, M.; Zheng, M.; Wu, Y.; Ma, H.; Wang, K. Effect of pH on types of acidogenic fermentation of fruit and vegetable wastes. Biotechnol. Bioprocess. Eng. 2015, 20, 298–303. [Google Scholar] [CrossRef]
  64. Strazzera, G.; Battista, F.; Garcia, N.H.; Frison, N.; Bolzonella, D. Volatile fatty acids production from food wastes for biorefinery platforms: A review. J. Environ. Manag. 2018, 226, 278–288. [Google Scholar] [CrossRef]
  65. Zhou, M.; Yan, B.; Wong, J.W.; Zhang, Y. Enhanced volatile fatty acids production from anaerobic fermentation of food waste: A mini-review focusing on acidogenic metabolic pathways. Bioresour. Technol. 2018, 248, 68–78. [Google Scholar] [CrossRef]
  66. Battista, F.; Frison, N.; Pavan, P.; Cavinato, C.; Gottardo, M.; Fatone, F.; Eusebi, A.L.; Majone, M.; Zeppilli, M.; Valentino, F.; et al. Food wastes and sewage sludge as feedstock for an urban biorefinery producing biofuels and added-value bioproducts. J. Chem. Technol. Biotechnol. 2020, 95, 328–338. [Google Scholar] [CrossRef]
  67. Dionisi, D.; Bolaji, I.; Nabbanda, D.; Silva, I.M. Calculation of the potential production of methane and chemicals using anaerobic digestion. Biofuels Bioprod. Biorefining 2018, 12, 788–801. [Google Scholar] [CrossRef]
  68. WRAP. Summary Report—Material Bulk Densities, Report Prepared by Resource Futures; 2009; Available online: http://www.wrap.org.uk/sites/files/wrap/Bulk%20Density%20Summary%20Report%20-%20Jan2010.pdf (accessed on 15 January 2020).
  69. Komilis, D.; Barrena, R.; Grando, R.L.; Vogiatzi, V.; Sánchez, A.; Font, X. A state of the art literature review on anaerobic digestion of food waste: Influential operating parameters on methane yield. Rev. Environ. Sci. Bio/Technol. 2017, 59, 347–360. [Google Scholar] [CrossRef] [Green Version]
  70. Bouzas, A.; Gabaldón, C.; Marzal, P.; Penya-Roja, J.; Seco, A. Fermentation of Municipal Primary Sludge: Effect of Srt and Solids Concentration on Volatile Fatty Acid Production. Environ. Technol. 2002, 23, 863–875. [Google Scholar] [CrossRef]
  71. Liu, H.; Wang, J.; Liu, X.; Fu, B.; Chen, J.; Yu, H.-Q. Acidogenic fermentation of proteinaceous sewage sludge: Effect of pH. Water Res. 2012, 46, 799–807. [Google Scholar] [CrossRef]
  72. Eryildiz, B.; Lukitawesa; Taherzadeh, M.J. Effect of pH, substrate loading, oxygen, and methanogens inhibitors on volatile fatty acid (VFA) production from citrus waste by anaerobic digestion. Bioresour. Technol. 2020, 302, 122800. [Google Scholar] [CrossRef]
  73. Begum, S.; Rao, A.G.; Sridhar, S.; Bhargava, S.K.; Jegatheesan, V.; Eshtiaghi, N. Evaluation of single and two stage anaerobic digestion of landfill leachate: Effect of pH and initial organic loading rate on volatile fatty acid (VFA) and biogas production. Bioresour. Technol. 2018, 251, 364–373. [Google Scholar] [CrossRef]
  74. Lu, Y.; Zhang, Q.; Wang, X.; Zhou, X.; Zhu, J. Effect of pH on volatile fatty acid production from anaerobic digestion of potato peel waste. Bioresour. Technol. 2020, 316, 123851. [Google Scholar] [CrossRef]
  75. Maharaj, I.; Elefsiniotis, P. The role of HRT and low temperature on the acid-phase anaerobic digestion of municipal and industrial wastewaters. Bioresour. Technol. 2001, 76, 191–197. [Google Scholar] [CrossRef]
  76. Bengtsson, S.; Hallquist, J.; Werker, A.; Welander, T. Acidogenic fermentation of industrial wastewaters: Effects of chemostat retention time and pH on volatile fatty acids production. Biochem. Eng. J. 2008, 40, 492–499. [Google Scholar] [CrossRef]
Figure 1. Relationships between product concentration and operating parameters. (a,c,e, g) All the considered experiments. (b,d, f,h) Average values of experiments in each narrow range (width maximum 20%) of the operating parameters (error bars indicate the standard error) with second grade polynomial curve. The polynomial curve is only used to visualise the general trend, without any statistical significance.
Processes 08 01538 g001aProcesses 08 01538 g001b
Figure 2. Relationships between product yield and operating parameters. (a,c,e,g) All the considered experiments. (b,d,f,h) Average values of experiments in each narrow range (width maximum 20%) of the operating parameters (error bars indicate the standard error) with second grade polynomial curve. The polynomial curve is only used to visualise the general trend, without any statistical significance.
Processes 08 01538 g002aProcesses 08 01538 g002b
Figure 3. Relationships between productivity and operating parameters. (a,c,e,g) All the considered experiments. (b,d,f,h) Average values of experiments in each narrow range (width maximum 20%) of the operating parameters (error bars indicate the standard error) with second grade polynomial curve. The polynomial curve is only used to visualise the general trend, without any statistical significance.
Processes 08 01538 g003aProcesses 08 01538 g003b
Table 1. Conversion factors used in this study.
Conversion UnitConversion FactorReference
VS TS (total solids)−1 food waste0.90[64,65,66]
VS t (total) COD−1 food waste0.85[64]
TS tCOD−1 food waste0.90[64]
gCOD gVS−1 carbohydrates1.13[67]
gCOD gVS−1 proteins1.12[67]
gCOD gVS−1 lipids2.90[67]
Food waste bulk density kg m−3500.00[68]
tCOD VSS (volatile suspended solids)−1 vegetable waste2.49[15]
% COD TS−1 food waste14.01[64]
VSS tCOD−1 food waste0.39[64]
Table 2. Frequency (number of experiments) and percentage of substrate types, grouped by category.
Substrate CategoryFrequencyPercentage %
Food waste (organic fraction of municipal solid waste, food waste, food waste recycling wastewater, artificial kitchen garbage, microalgae biomass, kitchen waste)25145.6
Carbohydrate-rich substrate (potato processing waste stream, vegetable and salad waste, duckweed, crystalline cellulose, paper mill wastewater, winery wastewater, maize silage, vegetable waste, potato waste, wheatgrass powder, fruit and vegetable waste, potato peel waste, simulated vegetable food waste)6612.0
Protein-rich substrate (tuna waste, slaughterhouse wastewater, meat and bone meal, Spirulina platensis, cheese whey, whey protein, egg white)8615.6
Sludge (primary sludge, secondary sludge, waste-activated sludge, sewage sludge)7012.7
Pure substrate (glucose, crude glycerol, peptone)6311.5
Manure (chicken manure, cow manure)142.5
Table 3. Minimum value, maximum value, mean with standard error (in bracket), 90th percentile of the considered operating parameters, and process performance variables in the literature experiments.
ParameterMin.Max.Mean90th Percentile
Operating parameters
Feed concentration (gCOD l−1)320453.08 (2.02)127.70
Run length (day)112016.16 (0.94)30.00
HRT (d)1306.33 (0.45)20.00
SRT (d)1506.89 (0.54)20.00
T (°C)158037.81 (0.39)55.00
pH3126.50 (0.08)10.00
Process performance variables
Product concentration (g l−1)0.0157.139.55 (10.92)23.14
Yield (% COD COD−1)0.0198.4332.06 (23.17)63.98
Productivity (g l−1 day−1)0.0055.481.87 (4.04)5.05
Table 4. Mean value and standard error (in brackets) of operational and performance parameters grouped by operational mode.
Operational ModeBatchCSTR SBR
Frequency of experiments (%)63343
Operating parameters
Feed concentration (gCOD l−1)48.48 (2.65)58.74 (3.06)86.22 (13.04)
Run length (day)16.16 (0.94)
HRT (d) 6.42 (0.47)5.25 (1.16)
SRT (d) 6.42 (0.47)12.44 (3.96)
T (°C)37.14 (0.49)38.36 (0.59)46 (3.07)
pH6.77 (0.11)6.00 (0.11)6.31 (0.31)
Process performance variables
Product concentration (g l−1)9.42 (0.59)8.16 (0.60)28.79 (5.01)
Product yield (% COD COD−1)35.41 (1.28)25.23 (1.58)41.35 (3.55)
Productivity (g l−1 day−1)1.04 (0.11)2.50 (0.20)12.12 (4.07)
Table 5. Mean value and standard error (in brackets) of operating parameters for process performance parameters above the 90th percentile.
Operating ParameterHighest Product ConcentrationsHighest Product YieldsHighest Productivities
Feed concentration (gCOD l−1)108.73 (5.43)19.28 (2.42)85.92 (7.46)
Run length (day)14.58 (1.78)14.68 (1.48)4.62 (0.53)
HRT (d)5.66 (0.93)6.15 (1.54)2.46 (0.23)
SRT (d)6.56 (0.92)10.27 (3.86)3.02 (0.41)
T (°C)39.75 (1.37)36.31 (0.78)40.04 (1.13)
pH6.48 (0.18)7.11 (0.34)5.64 (0.14)
Table 6. Regression coefficients and their associated p-values. Values in bold indicate a significant effect (p-value < 0.05).
Product Concentration (g l−1)Product Yield% (COD COD−1)Productivity (g l−1 d−1)
Coefficientp-ValueCoefficientp-ValueCoefficientp-Value
Intercept3.3850.118852.7681.14 × 10−220.3210.71996
Feed concentration (gCOD l−1)0.1363 × 10−47−0.1551.11 × 10−130.0241.46 × 10−11
Mode (Batch: 0; CTSR: 1)−2.6000.0032−8.8992.35 × 10−50.6680.066237
Temperature (°C)−0.0040.9314−0.2590.0118620.0420.018678
pH0.0610.76790.3010.539704−0.1290.131204
HRT (day)−0.0390.1497−0.1070.100317−0.0601.27 × 10−7
Publisher’s Note: MDPI stays neutral with regard to jurisdictional claims in published maps and institutional affiliations.

