Improvement of Small Wind Turbine Control in the Transition Region


1
Department of Mechanical Engineering, University of Cordoba, Campus de Rabanales, 14071 Cordoba, Spain
2
Department of Computer Science and Numerical Analysis, University of Cordoba, Campus de Rabanales, 14071 Cordoba, Spain
*
Author to whom correspondence should be addressed.
Processes 2020, 8(2), 244; https://doi.org/10.3390/pr8020244
Submission received: 31 January 2020
/
Revised: 15 February 2020
/
Accepted: 18 February 2020
/
Published: 21 February 2020
(This article belongs to the Special Issue Synergies in Combined Development of Processes and Models)
Abstract
:Wind energy conversion systems are very challenging from the control system viewpoint. The control difficulties are even more challenging when wind turbines are able to operate at variable speed and variable pitch. The contribution of this work is focused on designing a combined controller that significantly alleviates the wind transient loads in the power tracking and power regulation modes as well as in the transition zone. In a previous work, the authors studied the applicability of different multivariable decoupling methodologies. The methodologies were tested in simulation and verified experimentally in a lab-scale wind turbine. It was demonstrated that multivariable control strategies achieve a good closed-loop response within the transition region, where the interaction level is greater. Nevertheless, although such controllers showed an acceptable performance in the power tracking (region II) and power regulation (region IV) zones, appreciable improvement was possible. To this end, the new proposed methodology employs a multivariable gain-scheduling controller with a static decoupling network for the transition region and monovariable controllers for the power tracking and power regulation regions. To make the transition between regions smoother, a gain scheduling block is incorporated into the multivariable controller. The proposed controller is experimentally compared with a standard switched controller in the lab-scale wind turbine. The experiments carried out suggest that the combination of the proposed multivariable strategy for the transition region to mitigate wind transient loads combined with two monovariable controllers, one dedicated to region II and other to region IV, provide better results than traditional switched control strategies.
1. Introduction
During the last decades, the increasing concern about the environment and global warming have reinforced the interest in wind energy exploitation [1]. In numbers, wind power capacity worldwide has reached 597 GW, with a robust growth observed in countries such as China, USA, India, Brazil, and also some African countries [2]. System control and optimization play a very important role in wind energy conversion systems. Control of the power quality and integration into the network, alleviation of mechanical loads, and maximization of energy capture are essential factors that have a direct impact on the cost and competitiveness of wind technology [3].
The ideal power curve of a wind turbine exhibits mainly three operational modes or regions depending on the wind speed: at low wind speeds (power tracking mode or region II), where the available power is below the nominal power, the main control objective is to maximize the power conversion efficiency. On the other hand, there is the high speed region or full load (power regulation mode or region IV), where the main control goal is to limit the generated power at the wind turbine nominal value. Due to the different operating conditions, region IV cannot be achieved directly from region II, and a zone called the transition region exists between the power tracking and power regulation modes. The main objective in the transition region is to ensure a smooth switch between regions II and IV. Finally, the range of operational wind speeds is delimited by the cut-in and cut-out wind speeds. Outside this range, the wind turbine remains stopped (regions I and V). The mentioned wind turbine operation regions, as well as the ideal power curve, are shown in Figure 1 [4].
The main aim of this work is to provide a reliable controller with good performance properties in the different operating points of a wind turbine. In a previous work [5], the authors compared different multivariable control methodologies to improve the energy capture, power quality, and wind transient alleviation for variable-speed variable-pitch (VS-VP) wind turbines. These techniques showed a proper closed-loop response, specifically at the transition region, which presents more interaction. Nevertheless, although such controllers showed an acceptable performance in the power tracking (region II) and power regulation (region IV) zones, wind disturbance rejection presented appreciable improvement. In this work, a combined controller is proposed that takes advantage of the multivariable control at the transition region and also benefits from monovariable controllers for the power tracking and power regulation regions. Due to its simplicity, the multivariable controller structure is based on a static decoupling network. In addition, to make the transition between regions smoother, a gain scheduling block is incorporated into the multivariable controller.
In VS-VP turbines, generator torque and pitch angle are usually available as control inputs. Basic power control schemes use blade pitch angle as the control input to maintain a constant torque at its nominal value [6,7]. Operating below rated wind speed, the generator torque is usually controlled to maximize energy efficiency. Conversely, above rated wind speed, the pitch angle is controlled. It is important to note that the control scheme can differ from one region to another. Due to the interaction between variables, wind turbines show complications in the controller design. When the interaction is moderate, these difficulties are addressed using single-loop proportional-integral-derivative (PID) controllers [8]. Nevertheless, the system performance can be significantly deteriorated if interactions between variables are important. This situation particularly occurs in region III (transition zone), between tracking and power regulation modes.
The dependence of the wind turbine dynamic response with the operating point has motivated the research of different control techniques, from standard PID controllers to more complex strategies, such as neural network-based controls [9], model predictive controls [10,11], robust H∞ controls [12], optimal linear quadratic Gaussian (LQG) controls [13], linear parameter varying (LPV) controls [14,15], and nonlinear controls [16,17]. In addition, recent works use a fuzzy approach to this problem. In [18], a fuzzy logic (Takagi-Sugeno) blade pitch angle controller is proposed to accommodate the wind turbine nonlinearities. In [19], the fuzzy approach is used for the modeling of the wind turbine that can be used in a fuzzy model predictive control. These proposals obtain better results than gain scheduled controllers to accommodate the wind turbine nonlinearities; however, they are more difficult to be developed and implemented.
Figure 2 shows the general scheme of the system, where the wind turbine is considered a two-input two-output (TITO) multivariable process. The two controlled variables are the generated electric power Pg and the rotational speed ωr. On the other hand, the manipulated variables are the blade pitch angle β and the duty cycle α. As explained in Section 2, the duty cycle α represents a variable associated with the electrical torque. The wind speed v is regarded as an input for the process.
The proposed controller is experimentally compared with a standard switched controller in the lab-scale wind turbine. Experimental results suggest that the combination of the proposed multivariable strategy for the transition region to mitigate wind transient loads combined with two monovariable controllers, one dedicated to region II and other to region IV, provides better results than traditional switched control strategies. The paper is structured as follows: in Section 2, the lab-scale wind turbine used for the experiments is described. Section 3 explains the combined control methodology for the wind turbine under study. The experimental results are presented in Section 4, and the proposed controller is compared with a standard switched control strategy. Lastly, conclusions and future lines of research are summarized in Section 5.
2. Lab-Scale Wind Turbine Test-Bench and Model Description
A lab-scale VS-VP wind turbine is used as the experimental system for testing the proposed control strategy. As shown in Figure 3, the rotor has two blades and is directly coupled to a permanent magnet generator (there is no gearbox). Thus, this experimental setup emulates the dynamic response of a wind turbine with a simplified electrical subsystem. The rotor and generator are located in a small wind tunnel where the wind flow can be generated towards the blades. A controlled fan generates the wind speed profile, which reaches the blades with laminar airflow. The main parameters of the system are summarized in Table 1. The proposed control strategy is implemented in a computer using Matlab/Simulink and the Real-Time Windows Target toolbox. This setup has also been used for educational purposes [20].
In general, the literature dedicated to wind turbines can be split into two parts: the mechanics and aerodynamics of the turbine (mechanical subsystem), and the electrical generator and power converter (electrical subsystem). The mechanical part basically comprehends the turbine rotor and the aerodynamic components, a gearbox (if any), and the low-speed and high-speed axes. Although several models are proposed in the literature, a two-mass or one-equivalent model is commonly used as a good compromise between efficiency and simplicity [16]. The electrical subsystem comprises a generator unit, which is essentially an electrical generator and a power converter connected to a load or grid [16,21]. The mechanical and electrical subsystems are explained in the following subsections.
2.1. Mechanical Subsystem
Assuming a perfect rigid low speed shaft and direct coupling between the electric generator and the rotor, the mechanical equation of a one-mass wind turbine model [22] is given by:
where ωr is the rotor speed, τem the electromagnetic torque, and the term models the friction effects. The variable τa is the aerodynamic torque, and Jt is the total inertia moment. The aerodynamic torque depends on the turbine dynamic characteristics [23]. The torque τa is given by the following nonlinear function:
where R is the rotor radius, the wind speed, and λ is the tip-speed ratio (TIP), which is defined as follows:
The power coefficient Cp(λ, β) characterizes the ability of a specific wind turbine to capture wind energy, and its value depends on the tip-speed ratio and the blade pitch angle. Cp(λ, β) is of special interest for control purposes, specifically in region II, where the main objective is to extract all the available power. In this region, the optimal energy extraction is usually achieved by manipulating the generator torque that acts as a manipulated variable of the system, whereas the pitch angle is held constant, typically to a value near zero. Conversely, in the power regulation mode (region IV), the turbine speed is regulated by controlling the pitch angle, and the generator torque is held constant. The power coefficient is usually provided by manufacturers as a function of λ and β. In this work, is has been obtained from experimental tests. By means of a second order polynomial fitting and holding the blade pitch angle constant, Cp(λ, β) was obtained as a function of λ. This is illustrated in Figure 4 for the cases of β = 1°, β = 5°, β = 10°, and β = 15°. Figure 5 shows the corresponding surface for Cp(λ, β) as a function of λ and β. As can be observed from Figure 4 and Figure 5, the optimum point is achieved at a tip-speed ratio of 6.8 and a pitch angle of 1°.
2.2. Electrical Subsystem
Equations (4) and (5) model the lab-scale wind turbine electrical subsystem. As previously mentioned, a permanent-magnet direct current electric generator with a constant field flux is used. The armature current ig controls the electromagnetic torque according to Equation (5), a change in the generated torque modifies the generated power . The constants η and kt represent the efficiency and the torque constant of the generator, respectively.
The electromagnetic torque and, therefore, can be modified by changing . To do that, a variable load is implemented in the lab-scale plant, which is emulated by means of a variable resistance using a pulse-width-modulation (PWM) circuit. This modification provides a variable load at the generator output [24]. A microcontroller was programmed to generate a 2 kHz PWM signal, which connects and disconnects the resistor that acts as the load. The duty cycle is defined by a new variable α. By means of this variable, the possible load values are within the nominal resistance (100% duty cycle) and open-circuit (0% the duty cycle). Since α modifies , it also changes according to Equation (4); the greater the duty cycle value, the larger the current .
2.3. Wind Speed Model
The wind speed profile generated in the experimental tests is modeled as a stationary stochastic process. The reader is referred to [5,25] and the references therein for more detailed information about the employed wind speed model. The generated wind speed is based on the four components described by the following equation:
where is the average wind speed, is used to include discrete wind gusts in the model, and represents the wind ramp component that is used for the simulation of wind speed changes of which behavior can be linearly approximated. Finally, the turbulent component , based on the Van der Hoven model [25], is described by Equations (7)–(9):
Ai represents the wind speed fluctuation for a given discrete frequency ωi (i = [1,n]). The specific values of each Ai are based on the spectral Van der Hoven model, where σ represents the standard deviation of the wind speed, L is the length scale of the turbulence, N is the number of samples, and φi the random phase angle with a uniform distribution in the range [−π,π].
2.4. Model Identification
The proposed control strategy is based on a set of linear models identified at different operating points. These linear models are based on the TITO system defined by Equation (10):
where G(s) represents the process transfer matrix, and GD(s) is the disturbance matrix associated with the wind speed. The process inputs of this multivariable model are the duty cycle α (range 0%–100%) and the blade pitch angle β with a range from 0° to 25°. The model has two outputs, the rotor speed ωr and the generated electric power Pg. The wind speed is regarded as a disturbance or non-controlled input. Several models were identified at different operational points as a function of the wind speed and validated through a set of experiments. The resultant transfer matrices are listed in Table 2, with two models identified at the power tracking region (with wind speeds of 6 and 7 m/s), one at the transition load (8 m/s), and two at the power regulation region (wind speeds of 9 and 10 m/s).
Figure 6 shows the open-loop step responses of and in the transition zone (experimental data and identified model). Note that the variables shown are relative to the initial conditions of the experiments. As will be explained later, this operating point will be the most important given the higher interaction obtained in the transition zone in comparison with other regions. The matrix elements g11(s) and g21(s) were generated using a ±8° step in the blade pitch angle. On the other hand, g12(s) and g22(s) were obtained applying a ±10% step in the duty cycle. Finally, gD1(s) and gD2(s) of GD(s) were obtained using a ±1 m/s step in the wind speed profile.
2.5. Interaction Analysis
The best use of VS-VP wind turbines can only be achieved by means of multivariable controllers [21]. A widely used classical method to determine the best input–output pairings is the relative gain array (RGA) [26]. This approach uses the steady-state information of the process. Values of the element λ11 of the RGA far from the unity indicate pronounced interaction effects among control loops. These values are shown in Table 3 for the identified models collected in Table 2. As shown in the table, the lab-scale wind turbine has the strongest interaction level at the transition region (with a wind speed of 8 m/s), as mentioned previously. From the interaction point of view, this is the most problematic operating point and where the proposed multivariable strategy will be applied.
3. Multivariable Adaptive Gain-Scheduling Controller Design
As mentioned before, in a previous work the authors showed the applicability of different decoupling methodologies using the transition region as the nominal point [5]. The developed controllers showed an acceptable performance outside the transition region, although appreciable improvement in wind disturbance rejection was observed. This section provides the design of a combined controller that deals with this problem. The approach proposed here uses a multivariable controller with a gain-scheduling block as the top control layer. The general scheme is shown in Figure 7, where the gain-scheduling block adjusts the controller parameters based on the wind speed. The multivariable approach employed in this work uses a diagonal controller C(s) combined with a block compensator D(s). In this way, the controller sees a new apparent process Q(s) = G(s)∙D(s) that is diagonal or diagonally dominant. Thus, by means of the block compensator, the process interactions are reduced, providing in this way an independent control of the loops [26,27].
In this case, the static simplified decoupling technique was used due to its simplicity, since, as will be explained later, the top control layer only has to modify two elements of the decoupling network in addition to the controller parameters. Given an n × n process, the decoupling network is designed from Equation (11), generally specifying n elements of D(s) or the n desired transfer functions of the apparent process Q(s).
For the static decoupling strategy, the decoupling network can be determined with only information from the steady-state gain of the process according to Equation (12), and the corresponding apparent process shown in Equation (13). Note that the off-diagonal elements of Q(s) are non-zero and, therefore, perfect decoupling is not achieved at all frequencies. However, the apparent process turns diagonally dominant and has less interaction.
Once the decoupling network is designed, two controllers of the decentralized control C(s) must be tuned for the apparent processes of Q(s). These controllers have been tuned based on the iterative procedure explained in [28]. In addition, the controllers of C(s) have been tuned to achieve almost the same closed-loop settling time, around 200 s, in both loops. The design frequency range was constrained between 10−5 rad/s and 1 rad/s.
Regarding the automatic gain adjustment of PID controllers, there are many techniques proposed in the literature [29,30,31,32,33]. In this work, gain-scheduling adaptive control is used; this technique has been implemented on many occasions in the field of energy conversion systems using different control methodologies [14,15,34,35]. As shown in Figure 7, the controller parameters are modified by the gain-scheduling block based on a set of different operating points of the wind turbine. For a given wind speed input, the gain scheduling block selects the appropriate controller parameters according to the operating points identified in Table 2. The specific parameter values are shown in Table 4. With the aim of improving the transition between the identified operational points, a set of continuous functions that describe the change of the process variables and control parameters were identified. This approach avoids discontinuities between changes from one operational point to another.
Based on the values shown in Table 4 and applying least-squares, the following third-order polynomials were obtained for the gain scheduling block:
The experimental and polynomial values of each variable for each operational point are shown in Figure 8.
The multivariable controller structure is shown in Figure 9. Note that the gain-scheduling block has one input and eight outputs. The input is the wind speed, and the output variables are shown in Table 4, i.e., the optimal references for the rotor speed and the electric power, the PI controller parameters, and the gains of the static decoupling network.
4. Experimental Results of the Proposed Controller
In this section, the proposed multivariable gain-scheduling controller is implemented in the lab-scale wind turbine. Specifically, it is shown that the better performance of this controller compared to a standard switched control strategy in the transition region. As will be demonstrated by means of the experiments described in this section, the multivariable control structure is not justified in the whole operating range of the wind turbine. It is important to note that although the emulated wind profile does not correspond to realistic features, it is useful for the evaluation of the control strategy in adverse conditions.
The first experiment is shown in Figure 10, where an ascending wind profile is applied. In addition, a first order filter is employed to avoid aggressive changes in the wind speed so that the transition between stationary zones is smooth. The wind profile starts with an average wind speed of 9.5 m/s. A turbulent component is also added with a standard deviation of 0.2 m/s. Up to t = 1000 s since the beginning of the test, a positive step change of 1 m/s is applied every 300 s. At t = 1000 s, the step change is 0.5 m/s. Within the range of 6–7.5 m/s of wind speed, the control system is based on a monovariable strategy and a Maximum Power Point Tracking Tip Speed Ratio (MPPT-TSR) algorithm, which establishes the optimal rotor speed based on the Cp and optimal coefficients. In this region, only the rotor speed control is enabled by means of the modulation index α, whereas the blade pith angle is fixed to a value of 1° to achieve maximum efficiency as obtained in the identification process of the lab-scale wind turbine [5]. The optimal setpoint for the rotor speed is established through a superior control layer that implements the MPPT-TSR algorithm with and a blade radius of 0.2975 m. This setpoint is the input of a PI controller previously tuned with and for the operating points 6 m/s and 7 m/s.
When the average wind speed reaches 7.5 m/s, this point is considered the beginning of the transition zone to the nominal region, i.e., the power regulation zone. A controller switch is produced, and the system starts to be regulated by the multivariable controller shown in Figure 9. The interpolating functions minimize the underlaying undesired transients of control switching strategies, also called ‘bumps’. The power regulation region starts for a wind speed of 8.07 m/s. Figure 10 shows that the rotor speed tracking is good, maintaining the power coefficient at its optimum value of 0.2, as shown in Figure 11. In addition, an increase in the wind speed causes an increase in the speed rotor speed setpoint. In this case, the monovariable controller initially operates by decreasing the modulation index to cause an acceleration of the rotational speed providing a fast response to reach the stationary state. The internal control loop of the blade pitch angle is kept to 1°, which is the optimal value identified for the maximization of the power coefficient Cp(λ, β).
At this point, about 7.5 m/s, the control structure shown in Figure 9 comes into play. The rotor speed is controlled through the blade pitch angle β and the electric power is matched with the modulation index. In addition, the gain-scheduling layer modifies the tuning parameters of the PI controllers and the values of the elements of the static decoupling network according to the Expressions (14–21). At this point, there is a compromise situation in which the system is moved to a suboptimal point, as shown in Figure 11, but the transition between regions is improved. The rotor speed setpoint established from the gain-scheduling block is above the current value, and the blade pitch angle controller attempts to reduce this error by decreasing the angle to its saturation value of 0°. The electric power controller reaches the setpoint at the expense of an increase in the modulation index.
At t = 700 s, a new positive step change is produced in the wind speed from 8 to 9 m/s. Again, the gain-scheduling block outputs are updated. The blade pitch angle is no longer saturated to slow down the rotor speed. At t = 772 s the nominal value for the rotor speed is reached (1810 rpm). A small transient is observed, but the controller exhibits good speed tracking, and the reference is reached in less than 100 s. Finally, at t = 1000 s, a new step of 0.5 m/s in the wind speed is produced. In this case, the system is operating in the nominal region, and the multivariable control tries to reject this perturbation in the two loops by increasing the signal control values. The system takes approximately 200 s to reject the disturbance and get the rotor speed back to its nominal value. As will be observed in the next described experiments, a monovariable controller improves the closed-loop time response in the power regulation zone.
4.1. Comparison with Standard Switched Control Strategy
The multivariable controller shows a good performance in the transition region, with a small transient due to the imposed wind speed disturbance and the effect of the decoupling network. In this second test, the decentralized multivariable control with static decoupling network and programmed gain scheduling is compared with a standard switched controller strategy. Two independent PI controllers have been implemented, each one for the power tracking and power regulation regions, respectively. The PI controller tuned for the power tracking region is the same described in the previous test, where the rotor speed is controlled by means of the regulation index, which tracks the optimal reference given by the MPPT TSR algorithm. The second PI controller is tuned seeking a suitable compromise between power regulation and smooth control signal. Its parameters are and , and the manipulated variable is the blade pitch angle (β), i.e., power regulation is attempted using only pitch angle control.
Figure 12 shows the result of this second test, and the same wind profile is used. From the beginning of the experiment up to approximately t = 772 s, the monovariable MPPT TSR controller is enabled, and the blade pitch angle is set to 1°. The system closed-loop response is very similar to the previous experiment; the modulation index value is decreased when the wind speed is increased to subsequently increase again and slow down the upward progression of rotor speed. At t = 772 s, the optimal speed reference reaches the nominal value (1810 rpm) and the control switch is produced. The blade angle is increased to produce a braking effect and thus to reach again the nominal speed. This transition is slower than the produced in the first experiment, where a greater overshoot occurs, and inevitably leads to a settling time close to 200 s in reaching the power regulation region coming from the power tracking zone. This is approximately twice the time in comparison with the first experiment.
The PI controllers are provided with anti-windup and bumpless transfer mechanisms. The use of the optimal controller for a longer time allows to obtain an optimum power coefficient in a greater operating section. Figure 13 shows the power coefficient and the speed coefficient for this second experiment. Nevertheless, as can be seen from the figure, the perturbation introduced when increasing the wind speed from 9.0 to 9.5 m/s at t = 1000 s is better rejected. The monovariable controller is probably better suited for the power regulation region, since the multivariable controller must deal with the wind perturbation in the two control loops, and this effect is propagated to the decoupling network, which tries to counteract the coupling that is taking place between the two loops. This combined effect makes the disturbance rejection slower. As observed in Figure 13, the Cp coefficient calculation is set to zero in the power regulation mode. This is due to the fact that the main objective in region IV is to limit the generated power since the available power exceeds the rated power once the nominal wind speed is reached. Thus, the turbine operates with a non-optimal power coefficient.
4.2. Proposed Combined Strategy
From the two previous experiments, the proposed multivariable strategy showed an improvement with respect to monovariable strategies in the transition between the power tracking and power regulation regions. On the other side, the monovariable controller showed a faster wind disturbance rejection in the power regulation mode. In this third experiment, shown in Figure 14, we propose a combination of the previously described control strategies to make the best use of them depending on the operational mode, providing an efficient control strategy considering a tradeoff between energy capture maximization and transient loads alleviation.
As in the previous experiments, the same monovariable optimal control is established for the power tracking region. The controller receives the optimal rotor speed setpoint from the MPPT-TSR algorithm and acts over the manipulated variable α. At the wind speed of 7.5 m/s, the control is switched to the decentralized multivariable gain-scheduled with the static decoupling network controller. At the nominal region with a wind speed of approximately 9 m/s, a new switch to the monovariable controller is produced. As in the previous experiment, the monovariable controller acts over the blade angle pitch in order to maintain the rotor speed in its nominal value. The proposed combined control aims to take advantage of the optimal tracking for low wind speeds, the wind transient load alleviation provided by the multivariable control in the transition region, and finally, the disturbance rejection performance provided by the monovariable controller in the nominal region.
The wind ascending wind speed profile starting from low-mid wind speeds to high ones produces a transition from region II to IV. Nevertheless, it is also interesting to impose a wind speed profile that causes the transition between regions in the two directions. Therefore, a fourth experiment has been carried out to observe whether the system dynamics are the same regarding the direction of the transition. In addition, this test is very useful to compare the performance response of the proposed combined strategy and the standard switched control.
Figure 15 and Figure 16 show the results with the proposed combined controller and the standard switched control, respectively. Up to t = 911 s of the experiment, the wind profile is similar to the previous tests. At this point, the wind profile is reversed, and the same steps are carried out with a negative sign until reaching the initial speed of 6 m/s. The main conclusion from these last two experiments is that the advantage provided by the multivariable control with programmed gain scheduling and static decoupling network in the ascending wind profile is not reflected in the same way in the downward direction. In both methodologies, a worse disturbance rejection is observed, caused by the decreasing wind speed disturbance in the nominal region. Regarding the standard switched control strategy, when the disturbance occurs, the rotor speed reaches a peak of 75 rpm with respect to the reference, whereas in the case of the multivariable control is 90 rpm. This overshoot and the switching to the multivariable control strategy in the vicinity of the transition region means that the optimal power coefficient in region II is reached slightly later compared with the standard switched control strategy, as shown in Figure 17 and Figure 18.
Table 5 shows a global comparison of the two last experimental tests, considering the integral-absolute-error (IAE) index and the standard deviation. These indices indicate that the combined strategy provides a lower IAE index, as well as a lower standard deviation with respect to the tracking rotor speed reference. Thus, the proposed control strategy presents a better performance with respect to the classical switching control approach.
5. Conclusions
As demonstrated in the literature, VS-VP wind turbines are multivariable processes, and the transition region presents a high interactivity level. In a previous work, the authors simulated and experimentally verified that multivariable control strategies achieve a good closed-loop response within the transition region. However, although such controllers showed an acceptable performance in the power tracking and power regulation regions, disturbance rejection can appreciably be improved. The contribution of this work is focused on designing a combined controller that significantly alleviates the transients loads in the power tracking and power regulation modes as well as the transition zone. To this end, the proposed methodology employs a multivariable gain-scheduling controller with a static decoupling network for the transition region. This controller is justified given the high interactivity in this region and that the planning of the transition between maximum power tracking and power regulation has a direct impact on the wind transient loads. Conversely, the experimental tests have demonstrated that monovariable controllers provide better disturbance rejection performance in the low and high wind speed regions. As a general conclusion, the experiments carried out suggest that the combination of the proposed multivariable strategy for the transition region to mitigate transient loads combined with two monovariable controllers, one dedicated to region II and other to region IV, provides better results than traditional switched control strategies. Future directions of research will be focused on extrapolating the proposed methodology to industrial wind turbines.
Author Contributions
Funding acquisition, Francisco Vazquez; investigation, M.L.R., J.G. and S.F.; methodology, J.G. and S.F.; resources, F.V.; software, M.L. and S.F.; supervision, F.V.; validation, S.F.; writing—original draft, M.L.R.; writing—review and editing, M.L.R. and J.G. All authors have read and agreed to the published version of the manuscript.
Funding
This work was supported by the Autonomous Government of Andalusia (Spain), under the Excellence Project P10-TEP-6056. This support is gratefully acknowledged.
Conflicts of Interest
The authors declare no conflict of interest. The founding sponsors had no role in the design of the study; in the collection, analyses, or interpretation of data; in the writing of the manuscript, and in the decision to publish the results.
References
- Walsh, C.; Pineda, I. Wind Energy in Europe in 2018; Wind Europe: Brussels, Belgium, 2019; p. 32. [Google Scholar]
- WWEA. World Wind Energy Association. Available online: https://wwindea.org/ (accessed on 29 July 2019).
- Barambones, O.; Cortajarena, J.A.; Calvo, I.; Gonzalez de Durana, J.M.; Alkorta, P.; Karami-Mollaee, A. Variable speed wind turbine control scheme using a robust wind torque estimation. Renew. Energy 2019, 133, 354–366. [Google Scholar] [CrossRef]
- Simani, S. Overview of Modelling and Advanced Control Strategies for Wind Turbine Systems. Energies 2015, 8, 13395–13418. [Google Scholar] [CrossRef] [Green Version]
- Fragoso, S.; Garrido, J.; Vázquez, F.; Morilla, F. Comparative Analysis of Decoupling Control Methodologies and H∞ Multivariable Robust Control for Variable-Speed, Variable-Pitch Wind Turbines: Application to a Lab-Scale Wind Turbine. Sustainability 2017, 9, 713. [Google Scholar] [CrossRef] [Green Version]
- Bossanyi, E.A. The Design of closed loop controllers for wind turbines. Wind Energy 2000, 3, 149–163. [Google Scholar] [CrossRef]
- Van der Hooft, E.L.; van Engelen, T.G. Estimated Wind Speed Feed Forward Control for Wind Turbine Operation Optimisation. In Proceedings of the European Wind Energy Conference, London, UK, 22–25 November 2004. [Google Scholar]
- Pao, L.Y.; Johnson, K.E. A tutorial on the dynamics and control of wind turbines and wind farms. Proc. Am. Control Conf. 2009, 2076–2089. [Google Scholar] [CrossRef] [Green Version]
- Muhando, E.B.; Senjyu, T.; Omine, E.; Kinjo, H.; Funabashi, T. Model development for nonlinear dynamic energy conversion system: An advanced intelligent control paradigm for optimality and reliability. IEEJ Trans. Electr. Electron. Eng. 2008, 3, 482–491. [Google Scholar] [CrossRef]
- Evans, M.A.; Cannon, M.; Kouvaritakis, B. Robust MPC tower damping for variable speed wind turbines. IEEE Trans. Control Syst. Technol. 2015, 23, 290–296. [Google Scholar] [CrossRef]
- Yang, X.; Xu, L.; Liu, Y.; Xu, D. Multivariable Predictive Functional Control for Doubly Fed Induction Generator. In Proceedings of the 2007 IEEE International Conference on Control and Automation, Guangzhou, China, 30 May–1 June 2007; pp. 80–83. [Google Scholar] [CrossRef]
- Rocha, R.; Filho, L.S.M. A multivariable H∞ control for wind energy conversion system. In Proceedings of the 2003 IEEE Conference on Control Applications, Istanbul, Turkey, 25–25 June 2003; pp. 206–211. [Google Scholar]
- Selvam, K.; Kanev, S.; Van Wingerden, J.W.; Van Engelen, T.; Verhaegen, M. Feedback-feedforward individual pitch control for wind turbine load reduction. Int. J. Robust Nonlinear Control 2009, 19, 72–91. [Google Scholar] [CrossRef] [Green Version]
- Bianchi, F.D.; Mantz, R.J.; Christiansen, C.F. Gain scheduling control of variable-speed wind energy conversion systems using quasi-LPV models. Control Eng. Pract. 2005, 13, 247–255. [Google Scholar] [CrossRef]
- Bianchi, F.D.; Mantz, R.J.; Christiansen, C.F. Control of variable-speed wind turbines by LPV gain scheduling. Wind Energy 2004, 7, 1–8. [Google Scholar] [CrossRef]
- Bektache, A.; Boukhezzar, B. Nonlinear predictive control of a DFIG-based wind turbine for power capture optimization. Int. J. Electr. Power Energy Syst. 2018, 101, 92–102. [Google Scholar] [CrossRef]
- Boukhezzar, B.; Siguerdidjane, H.; Hand, M.M. Nonlinear Control of Variable-Speed Wind Turbines for Generator Torque Limiting and Power Optimization. J. Sol. Energy Eng. 2006, 128, 516. [Google Scholar] [CrossRef]
- Civelek, Z. Optimization of fuzzy logic (Takagi-Sugeno) blade pitch angle controller in wind turbines by genetic algorithm. Eng. Sci. Technol. Int. J. 2019. [Google Scholar] [CrossRef]
- Abdelbaky, M.A.; Liu, X.; Jiang, D. Design and implementation of partial offline fuzzy model-predictive pitch controller for large-scale wind-turbines. Renew. Energy 2020, 145, 981–996. [Google Scholar] [CrossRef]
- Fragoso, S.; Ruz, M.L.; Garrido, J.; Vázquez, F.; Morilla, F. Educational software tool for decoupling control in wind turbines applied to a lab-scale system. Comput. Appl. Eng. Educ. 2016, 24, 400–411. [Google Scholar] [CrossRef] [Green Version]
- Bianchi, F.; De Battista, H.; Mantz, R. Wind Turbines Control Systems; Springer: London, UK, 2007; ISBN 978-1-84628-493-9. [Google Scholar]
- Boukhezzar, B.; Lupu, L.; Siguerdidjane, H.; Hand, M. Multivariable control strategy for variable speed, variable pitch wind turbines. Renew. Energy 2007, 32, 1273–1287. [Google Scholar] [CrossRef]
- García-Sanz, M.; Torres, E. Control y Experimentación del Aerogenerador Síncrono Multipolar de Velocidad Variable TWT1650. Rev. Iberoam. Automática Informática Ind. 2010, 1, 53–62. [Google Scholar]
- Novaes Menezes, E.J.; Araújo, A.M.; Bouchonneau da Silva, N.S. A review on wind turbine control and its associated methods. J. Clean. Prod. 2018, 174, 945–953. [Google Scholar] [CrossRef]
- Van der Hoven, I. Power Spectrum of Horizontal Wind Speed in the Frequency Range from 0.0007 to 900 Cycles per Hour. J. Meteorol. 1957, 14, 160–164. [Google Scholar] [CrossRef] [Green Version]
- Garrido, J.; Vázquez, F.; Morilla, F. An extended approach of inverted decoupling. J. Process Control 2011, 21, 55–68. [Google Scholar] [CrossRef] [Green Version]
- Garrido, J.; Vázquez, F.; Morilla, F.; Hägglund, T. Practical advantages of inverted decoupling. P. I. Mech. Eng. I J. Sys. 2011, 225, 977–992. [Google Scholar] [CrossRef]
- Vázquez, F.; Morilla, F. An iterative method for tuning decentralized PID controllers. IFAC Proc. Vol. 1999, 32, 1501–1506. [Google Scholar] [CrossRef]
- Apkarian, P.; Adams, R.J. Advanced gain-scheduling techniques for uncertain systems. IEEE Trans. Control Syst. Technol. 1998, 6, 21–32. [Google Scholar] [CrossRef] [Green Version]
- Åström, K.J.; Karl, J.; Wittenmark, B. Adaptive Control; Addison-Wesley: Boston, MA, USA, 1995; ISBN 0201558661. [Google Scholar]
- Feng, G.; Lozano, R. Adaptive Control Systems, 1st ed.; Newnes: Oxford, UK, 1999; ISBN 9780080498607. [Google Scholar]
- Åström, K.J.; Hägglund, T.; Hang, C.C.; Ho, W.K. Automatic tuning and adaptation for PID controllers—A survey. Control Eng. Pract. 1993, 1, 699–714. [Google Scholar] [CrossRef]
- Rugh, W.J.; Shamma, J.S. Research on gain scheduling. Automatica 2000, 36, 1401–1425. [Google Scholar] [CrossRef]
- Billy Muhando, E.; Senjyu, T.; Urasaki, N.; Yona, A.; Kinjo, H.; Funabashi, T. Gain scheduling control of variable speed WTG under widely varying turbulence loading. Renew. Energy 2007, 32, 2407–2423. [Google Scholar] [CrossRef]
- Østergaard, K.Z.; Stoustrup, J.; Brath, P. Linear parameter varying control of wind turbines covering both partial load and full load conditions. Int. J. Robust Nonlinear Control 2009, 19, 92–116. [Google Scholar] [CrossRef] [Green Version]
Figure 1.
Wind turbine operation modes.
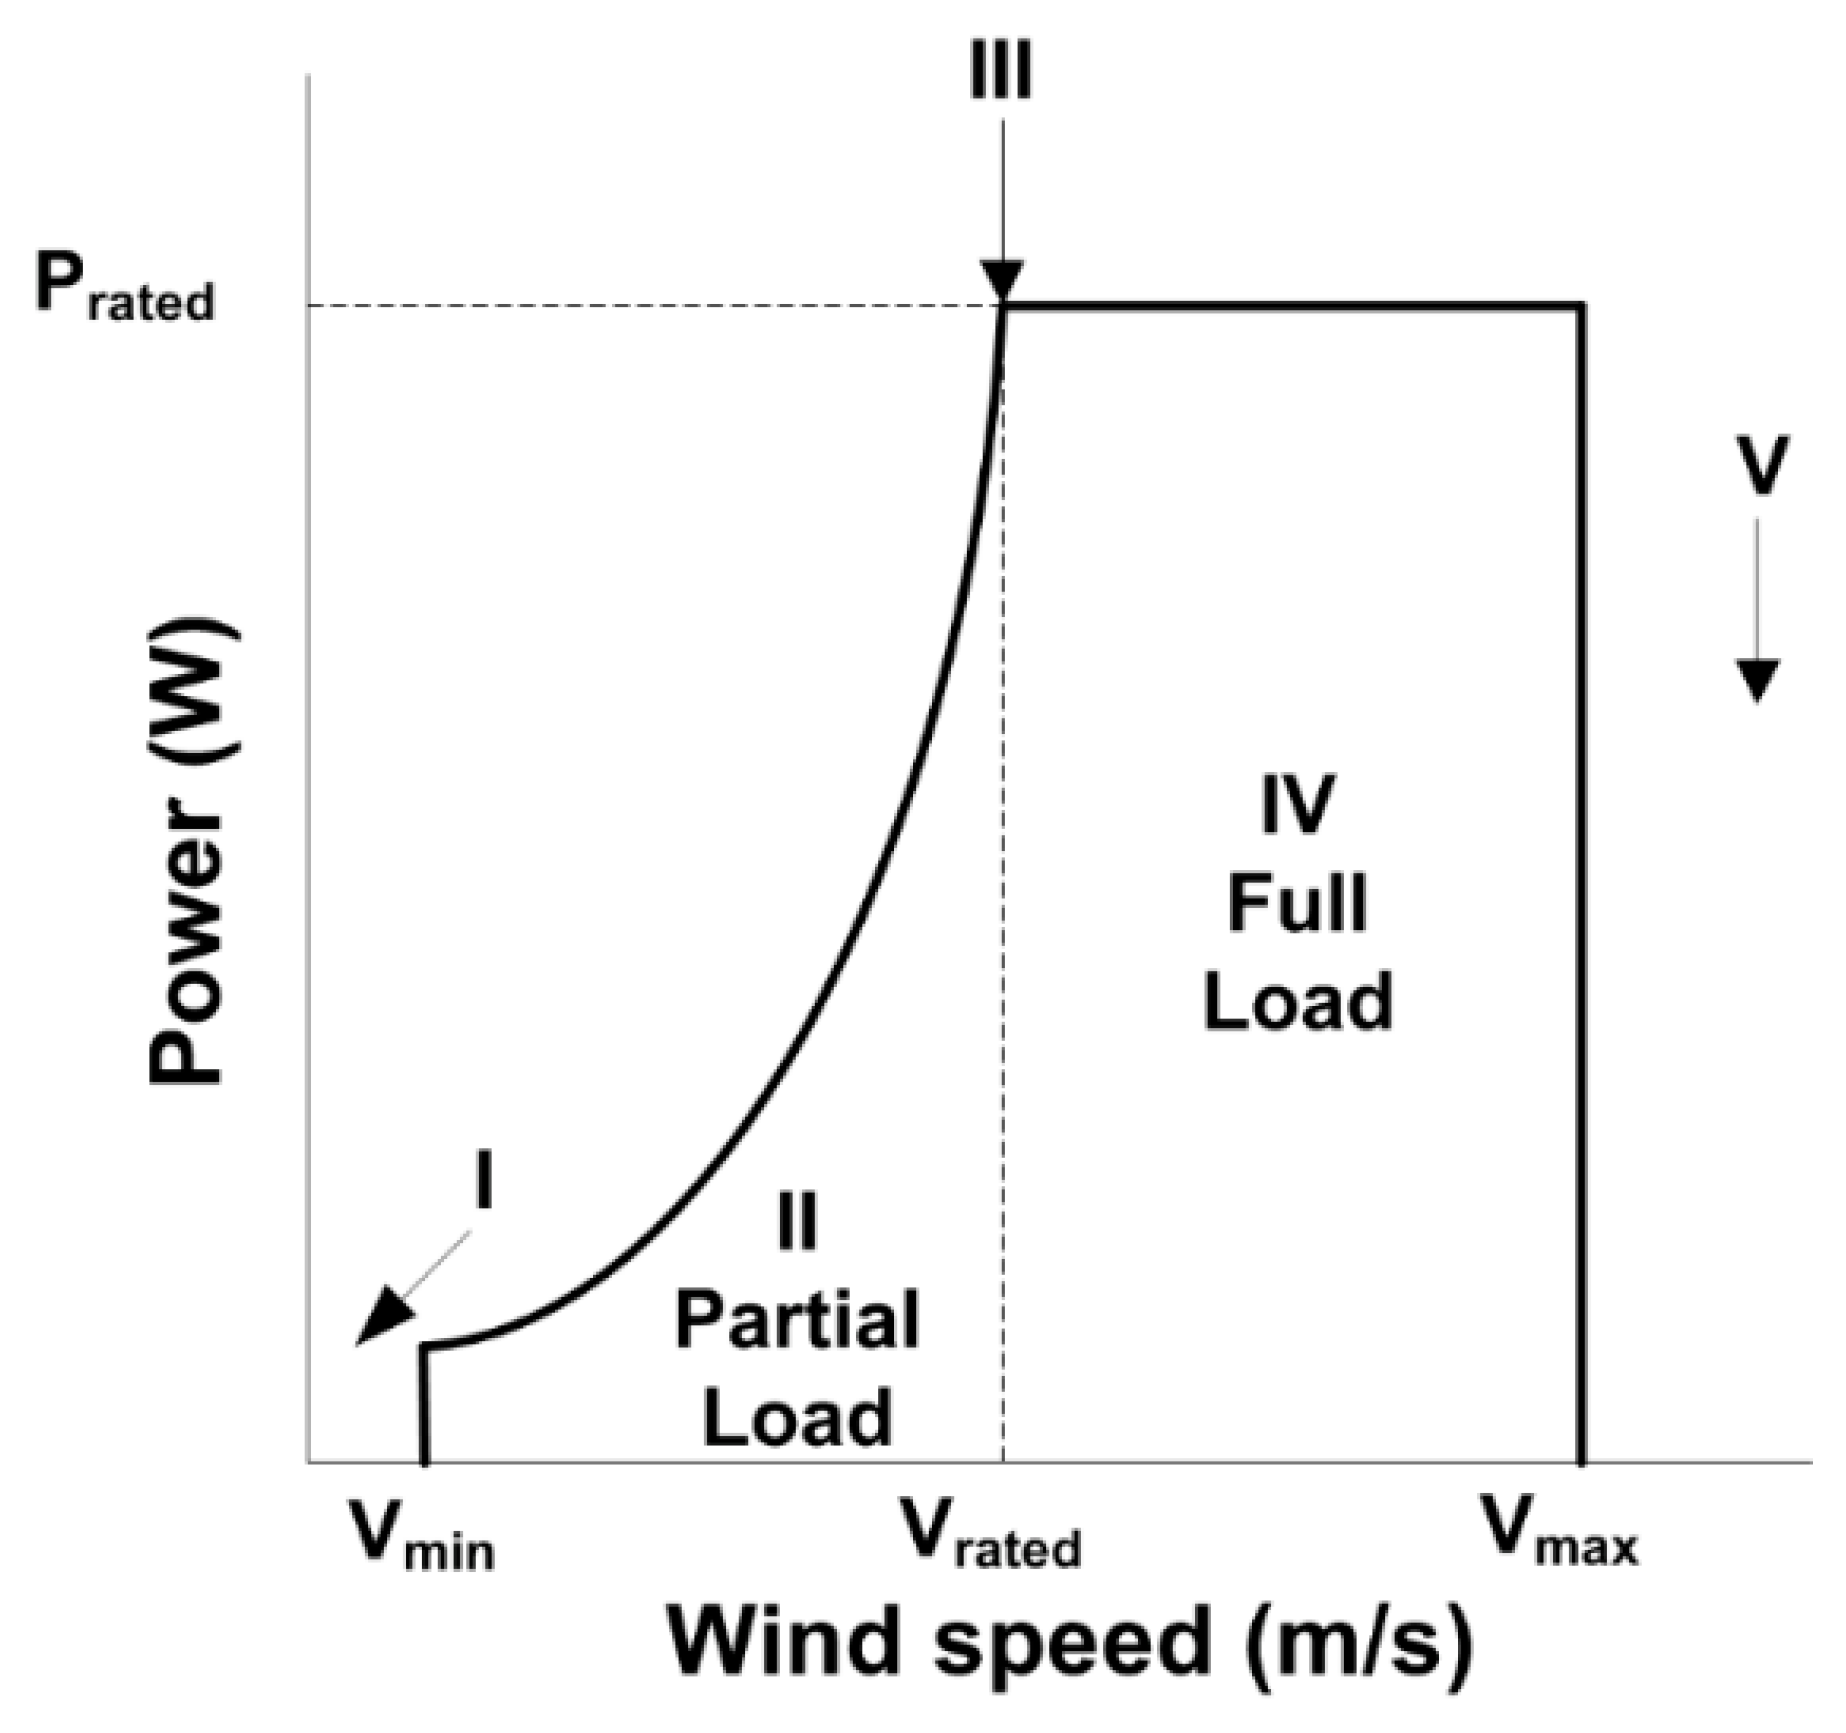
Figure 2.
Multivariable control scheme.

Figure 3.
Lab-scale small wind turbine.

Figure 4.
Polynomial fitting of the power coefficient in four cases of constant pitch angle.

Figure 5.
Experimental power coefficient surface.

Figure 6.
Open-loop step responses of the experimental data (solid line) and the identified model (dashed-dotted line) in the transition zone (wind speed of 8 m/s).
Figure 6.
Open-loop step responses of the experimental data (solid line) and the identified model (dashed-dotted line) in the transition zone (wind speed of 8 m/s).

Figure 7.
General structure of a gain-scheduling controller.

Figure 8.
Variables values for each operational point (blue) and the corresponding polynomial regression (red).
Figure 8.
Variables values for each operational point (blue) and the corresponding polynomial regression (red).

Figure 9.
Decentralized multivariable controller with static simplified decoupling network and gain scheduling.
Figure 9.
Decentralized multivariable controller with static simplified decoupling network and gain scheduling.

Figure 10.
Experiment 1: ascending wind profile and control switch.

Figure 11.
Evolution of the tip speed ratio and in experiment 1.

Figure 12.
Experimental test 2: ascending wind profile and classic switched control.

Figure 13.
Tip speed ratio and power coefficient for test 2.

Figure 14.
Test 3: ascending wind profile and combined control.

Figure 15.
Experiment 4: proposed combined control strategy.

Figure 16.
Experiment 5: standard switched control test.

Figure 17.
Tip speed ratio and power coefficient for experiment 4: proposed combined strategy.

Figure 18.
Tip speed ratio and power coefficient for experiment 5: standard switched strategy.


Table 1.
Technical parameters of the small experimental wind turbine.
| Parameter | Value |
|---|---|
| Rotor radius | 297.5 mm |
| Rated power | 80 W |
| Rated speed | 1810 rpm (189.5 rad/s) |
| Rated wind speed (a | 8.88 m/s |
| Rated voltage | 24 V |
| Rated current | 2.94 A |
| Rotor inertia | 11,000 gcm2 |
| Generator inertia | 1340 gcm2 |
| Armature resistance | 1.44 Ω |
| Armature inductance | 0.56 mH |
| Speed constant | 95.3 rpm/V |
| Torque constant | 100 mNm/A |
| Efficiency | 77% |
| Load resistance | 22 Ω (100 W) |
a was estimated by experimental tests.
Table 2.
Resulting linear models at different operating points.
| Wind Speed | ||
|---|---|---|
| 6 m/s | ||
| 7 m/s | ||
| 8 m/s | ||
| 9 m/s | ||
| 10 m/s |
Table 3.
Relative gain array (RGA) of the models.
| Wind Speed | |
|---|---|
| 6 m/s | |
| 7 m/s | |
| 8 m/s | |
| 9 m/s | |
| 10 m/s |
Table 4.
Control parameters for each operational point.
| Wind (m/s) | ||||||||
|---|---|---|---|---|---|---|---|---|
| 6 | 1310 | 0.74 | –0.024 | 16.12 | 0.079 | 1.78 | –50.3009 | 0.0018 |
| 7 | 1527 | 2.95 | –0.017 | 18.29 | 0.051 | 1.61 | –49.3924 | 0.0069 |
| 8 | 1746 | 6.6 | –0.017 | 17.2 | 0.04 | 1.51 | –58.5341 | 0.009 |
| 9 | 1810 | 6.9 | –0.0041 | 18.62 | 0.032 | 1.35 | –8.1059 | 0.0388 |
| 10 | 1810 | 7 | –0.0034 | 19.1 | 0.036 | 1.66 | –5.088 | 0.04565 |
Table 5.
Performance indices of experimental tests 4 and 5.
| Methodology | IAE | Std |
|---|---|---|
| Proposed control methodology | 33,901 | 177.064 |
| Standard switched control | 47,987 | 195.683 |
© 2020 by the authors. Licensee MDPI, Basel, Switzerland. This article is an open access article distributed under the terms and conditions of the Creative Commons Attribution (CC BY) license (http://creativecommons.org/licenses/by/4.0/).
Share and Cite
MDPI and ACS Style
Ruz, M.L.; Garrido, J.; Fragoso, S.; Vazquez, F. Improvement of Small Wind Turbine Control in the Transition Region. Processes 2020, 8, 244. https://doi.org/10.3390/pr8020244
AMA Style
Ruz ML, Garrido J, Fragoso S, Vazquez F. Improvement of Small Wind Turbine Control in the Transition Region. Processes. 2020; 8(2):244. https://doi.org/10.3390/pr8020244
Chicago/Turabian StyleRuz, Mario L., Juan Garrido, Sergio Fragoso, and Francisco Vazquez. 2020. "Improvement of Small Wind Turbine Control in the Transition Region" Processes 8, no. 2: 244. https://doi.org/10.3390/pr8020244
Note that from the first issue of 2016, this journal uses article numbers instead of page numbers. See further details here.