Water Sources Diagram and Its Applications
by
 , and
, and
Ewerton Emmanuel da Silva Calixto
1,2,* ,
,
Fernando Luiz Pellegrini Pessoa
1,2,
Reinaldo Coelho Mirre
1,
Flávio da Silva Francisco
2 and
Eduardo Mach Queiroz
2 1
Computational Modeling Department, University Center SENAI CIMATEC, Salvador 41650-010, Brazil
2
School of Chemistry, Federal University of Rio de Janeiro, Rio de Janeiro 21941-909, Brazil
*
Author to whom correspondence should be addressed.
Processes 2020, 8(3), 313; https://doi.org/10.3390/pr8030313
Submission received: 31 January 2020
/
Revised: 3 March 2020
/
Accepted: 5 March 2020
/
Published: 8 March 2020
(This article belongs to the Special Issue Process System Engineering-Brazil (PSE-BR))
Abstract
:Water Sources Diagram (WSD) has proved to be one of the most efficient methods to reduce industrial freshwater consumption and to provide a minimum amount of wastewater to be treated. Different types of industry have been benefited from the use of this technique, which resulted in great savings in the design of the effluent treatment systems. Among the successful case studies, we mention herein applications in systems with wastewater treatment, thermal and water plants’ integration, oil refineries, petrochemicals, batch processes, pulp and paper plants, and textile plants. The degree of WSD maturity motivated researchers to not only improve WSD algorithms, but also extend the concept of the Sources Diagram to Source/Sink types of process. This paper presents a background of WSD progress as well as insights into future perspectives using the Sources Diagrams’ concept.
1. Introduction
Many efforts are made to maximize water reuse in industry. Traditionally, basic techniques were used in the pulp and paper and textile industries in cooling towers [1]. With the increase in water demand and the advent of new methodologies (e.g., Water Pinch) to maximize water reuse, the range of applications of such methods also increased.
However, the complexity of many processes with respect to the presence of multiple contaminants in the equipment streams has led to the development of complex models and methods, many of them based on mathematical programming [2]. Rigorous models require a deep knowledge of the process, which is different for each type of industry. From the point of view of a process engineer, a full understanding of the procedure to be used in a water/wastewater allocation problem (WAP) is essential for their engagement in the results and for operational viability. In such processes, mathematical programming has been employed with relative success, and almost always found the global optimum. In the meantime, it doesn’t provide good engineering insights, and it is normally difficult to formulate an accurate superstructure and to solve the set models [3].
Contrary to the methods based on mathematical approaches are the algorithm-heuristics ones. Those methods are better in the sense that they can find a solution that is close to the global one and the engineer needs little prior knowledge to understand how the units of the system are built (“black box”). The Water Sources Diagram (WSD) is a method which can provide engineering insights through a diagram analysis and, at the same time, generate the water network flowsheet [4]. Since the original idea proposed by Wang and Smith [5] of having a pinch point determined for water systems, graphical and other algorithm-heuristic methods have emerged, but none of them provide good results when dealing with problems with many contaminants. WSD not only can deal with that type of problem, but also generates the diagram and final network simultaneously, which means that it predicts a minimum external water consumption and obtains the corresponding network at the same time.
Improvements have been made in the WSD algorithm to deal with more complex problems. Some of them are: a better procedure to determine the reference contaminant and reference operation [6], a decomposition method to generate viable scenarios without violating the contaminant–mass balance in the final network [7]; the extension of the method to deal with fixed flowrate and fixed load processes [8]; a procedure to remove violations in the final network [9]; and combining both mathematical programming and WSD methods [10]. Improvements are being made in the algorithm in order to propose a sustainable wastewater treatment facility in conjunction with WSD (reuse and regeneration case).
Those improvements were also motivated by the feedback given by several kinds of companies where WSD was employed. WSD presented good results in regeneration processes [11,12], integrating water-thermal networks [13], in regeneration equipment [14] in oil refineries [4,7,15], in batch processes [16], pulp and paper facilities [8,17,18], in textile industry [19] and in a thermoelectric plant [20].
The idea of producing a diagram for different kind of sources has been extended, for example, to reduce carbon emissions [21]. The Carbon Sources Diagram (CSD) allows the proper management of greenhouse gases (GHGs) emissions through the creation of an energy planning, proposing an optimal fuel mix. It also identifies a minimum amount of zero- and low-carbon energy sources needed to attend the energy demand of several regions, satisfying GHG’s emission constraints and establishing a sustainable development scenario. Good results were obtained when CSD was used to elaborate a plan for the Brazilian electricity sector in 2020.
Other example is the Hydrogen Sources Diagram (HSD) [22], which aims to minimize the consumption of hydrogen in petroleum refineries. The algorithmic method not only targets calculations, but also simultaneously synthesizes the hydrogen network flowsheet.
In addition to the extension of the Source Diagram idea to carbon and hydrogen management, research is in progress to implement this idea in different source scenarios: minimizing energy, wastewater discharge, cooling water reuse and supply chain.
This paper addresses the major results obtained by applying a WSD methodology in different kinds of processes for a period of years and shows the importance of the technique for the industry. Furthermore, the idea of sources diagrams is presented for several types of application and demonstrates the flexibility of the core methodology.
2. WSD Methodology
The Water Sources Diagram was originally developed to deal with processes with one contaminant or at least one reference contaminant, in which the mass transfer of all other contaminants is based on [23]. However, due to the necessity of expanding the methods to more complex industrial applications and the lack of good results when using methods like Water Pinch [5], WSD was extended to deal with multiple contaminants in WAPs.
The application of the WSD method requires the mapping of water processes through the chemical characterization of components and parameters, as well as the flowrate of water streams in each piece of process equipment. The problem is solved by creating a diagram of increasing concentration ranges, considering the lower and upper concentration limits of the representative contaminant present in operations and water sources. In each operation, the water distribution in the diagram intervals is determined, considering the need to assimilate a mass transfer load of contaminants from the process streams (rich in contaminating species) to the water streams (poor in these species). The mass load is given by the product of the required water flowrate and the difference between the process stream and the water stream concentrations (Equation (1))
where is a quantity of contaminant to be transferred in operation k, without interval i; is the water flowrate through operation k; is a final concentration in interval i; is an initial concentration in the interval i; ; and ( is the number of operation, and is the number of concentration intervals).
Each operation can assume a value considered the maximum (limit), above which the adequate performance of these operations will be compromised. The water reuse between operations is limited by this maximum concentration value. WSD’s premise for maximum reuse considers the maximum concentrations of input and output in the operation. For a fixed mass load, the maximum output concentration reduces the flowrate of water in the process; however, when the inlet concentration value is also at maximum, there is the possibility of a desirable reuse with lower quality water, with the flowrate corresponding to a less noble water quality. Thus, the need for freshwater consumption for industrial activity is reduced.
As an application example, Table 1 presents the limits for characterizing the operations of an industrial process including one contaminant [5], where and are the maximum values of input and output for a given contaminant.
Step 1
Establish the concentration intervals in the diagram, which are limited by the concentration of the external water source and inlet () and outlet () concentrations of the respective operations.
Step 2
Represent the operations in the diagram by means of an arrow that begins at the inlet concentration and ends at the outlet concentration of the contaminant. The concentrations of water sources (internal and external) and the respective flowrates in operations are represented.
Step 3
Calculate the amount of contaminant transferred in each operation and in each interval i , using Equation (1). These values are placed in parentheses over each corresponding arrow segment. Steps 1, 2 and 3 are shown in Figure 1.
Figure 1 indicates the initial stage of the WSD structure, with the problem divided into four concentration intervals (i = 1,..., 4) (Step 1). In this diagram, four operations are represented, which contain their respective limits of initial (inlet) and final (outlet) concentrations. They also constitute the internal water sources, in addition to the external water source available at 0 ppm. In the column positioned to the left of the diagram, the flowrate values for each operation are aligned (Step 2). The values in brackets, positioned above each arrow in the intervals, correspond to the mass load that must be assimilated (Step 3). This value is then used as a basis to determine the water flowrate to be allocated for each operation present in the concentration intervals under analysis (Step 4).
Step 4
The determination of water source flowrate consumption according to Equation (1), and the water flowrate allocation criteria in operations.
Rules for the allocation of water sources:
- Priority of use of flowrate from an internal source for the next interval of the same operation, so as not to divide the operation;
- Aiming at the maximum use of internal sources, the use of external sources should only be practiced when there is no internal source available;
- The priority for the use of internal sources is always from the source with the highest concentration to the one with the lowest concentration.
The required water flowrate in each operation k for each concentration interval i can be calculated according to the type of source p, internal or external, according to Equations (2) and (3), respectively.
For external water sources
where is the concentration at which the internal source j is used in the interval i, is the concentration of the external source p, is the final concentration of the interval i, is the final (higher) concentration of interval j and is the number of internal sources available in the interval i. If an internal source is used in the interval, the values of the respective are calculated before the .
For internal water sources
The minimum water flowrate from the external source p in each interval can be calculated according to Equation (4).
Figure 2 shows a final diagram with the allocation of water sources.
In each interval, starting from i = 1, the water sources that are available to be allocated for each operation must be identified, evaluating, in this case, whether the flowrate to be allocated corresponds to the assimilation of mass load (value within the brackets) for the operation in a given interval.
Thus, in the first interval, only water at 0 ppm (quality of the external source) can be used in operation 1, requiring a flowrate of 20 t/h. Likewise, the external source is used in operations 2 and 3, which are present in interval 2: 50 and 20 t/h, respectively.
The value of 20 t/h of operation 1 in i = 1 is transferred, as a priority, for the same operation to interval 2, and can completely assimilate the mass load of 1 kg/h.
In interval 3, operations 1 and 2 are already completed, with their respective effluents at a concentration of 100 ppm, which means that they now represent internal sources of 100 ppm that can be made available for reuse in the operations of subsequent intervals (i = 3 and i = 4).
In this case, it is possible to verify that, in addition to the 20 t/h from operation 3 in the interval i = 2, 20 t/h used from the reuse source at 100 ppm is still necessary in order to completely assimilate the contaminant mass load in the interval i = 2 of operation 3.
At i = 4, in addition to 40 t/h from the previous interval of operation 3, there is a need to allocate 5.7 t/h from the internal reuse source (at 100 ppm) to assimilate the mass load of 4 kg/h from operation 4.
The geometric figures indicate the points of reuse: in this case, 20 t/h from operation 1 for operation 3, and 5.7 t/h from operation 2 in operation 4.
The choice of the reuse source is irrelevant in this case, once it can be used for both operation 1 or 2, because both have their effluents at the same concentration of 100 ppm. In practice, however, priority can be given to the source of reuse that comes from the operation that is physically located closest to the operation that will receive the effluent, due to the lower cost.
The values in bold at the end of each interval correspond to the sum of the flowrates. It is observed that between intervals 2 and 3, there is a reduction in the total water flowrate from 90 to 45.7 t/h in the concentration of 100 ppm; this point is called water pinch.
Step 5
Synthesize the water network from the generated WSD.
Figure 3 represents the water network defined from the WSD generated in Figure 2. It is possible to notice the direct distribution of 90 t/h from the external source at 0 ppm for operations 1 (20 t/h) and 2 (50 t/h), in addition to 20 t/h at 0 ppm combined with 20 t/h of effluent from operation 1 (water reuse) in operation 3. Furthermore, from a total of 50 t/h of effluent from operation 2, only 5.7 t/h are reused in operation 4. The final effluents from the water network are sent later for possible treatment and disposal.
In this example, the application of WSD reduced the freshwater flowrate (at 0 ppm) from 130.5 t/h, from the original process, to 90 t/h (31% reduction), a result that improves efficiency in the optimization of water use.
For water streams with multiple contaminants, criteria are adopted for the selection of a reference contaminant [4,6,8]. Thus, the transfer of all contaminants in each operation follows a constant relationship, in order to analyze the possibility of adjustment in the concentration of the reference contaminant.
3. WSD Applications
The fields of application of WSD are wide and diverse and include many industry sectors such as oil and gas, chemicals, steel, textile, mining, energy, electrical, and food.
Oil and gas fields can be benefited by the application of WSD to reduce the amount of freshwater consumed and the total cost of treating wastewater [15,24]. One example is shown in the work of Mirre et al. [25], that aimed to apply WSD in a wastewater treatment unit from an oil refinery. The method was used to generate scenarios of reuse, regeneration and recycling of the unit streams. The results show reductions of up to approximately 20% in costs and approximately 5% in freshwater consumption.
The application of WSD in the pulp and paper industry has been successfully done, as is shown in the previous work of [17]. Reductions of up to approximately 40% in freshwater consumption and up to approximately 70% in the discharged wastewater have been achieved.
In the textile industry, for example, reductions of up to 60% were achieved applying WSD [19]. WSD was also used to minimize not only freshwater but also energy, at the same time [13]. Reductions of 1.52% were achieved, a value greater than those obtained by other authors using mathematical programming.
A thermoelectric industry in Brazil faced considerable reductions of up to approximately 16% in freshwater consumptions after applying stream realignment proposed by WSD.
WSD was applied to other kinds of industries and interesting results were obtained. These results are summarized in Table 2.
Many other sectors can be benefited using WSD, such as beverage, food and even automotive industries.
4. Future Perspectives
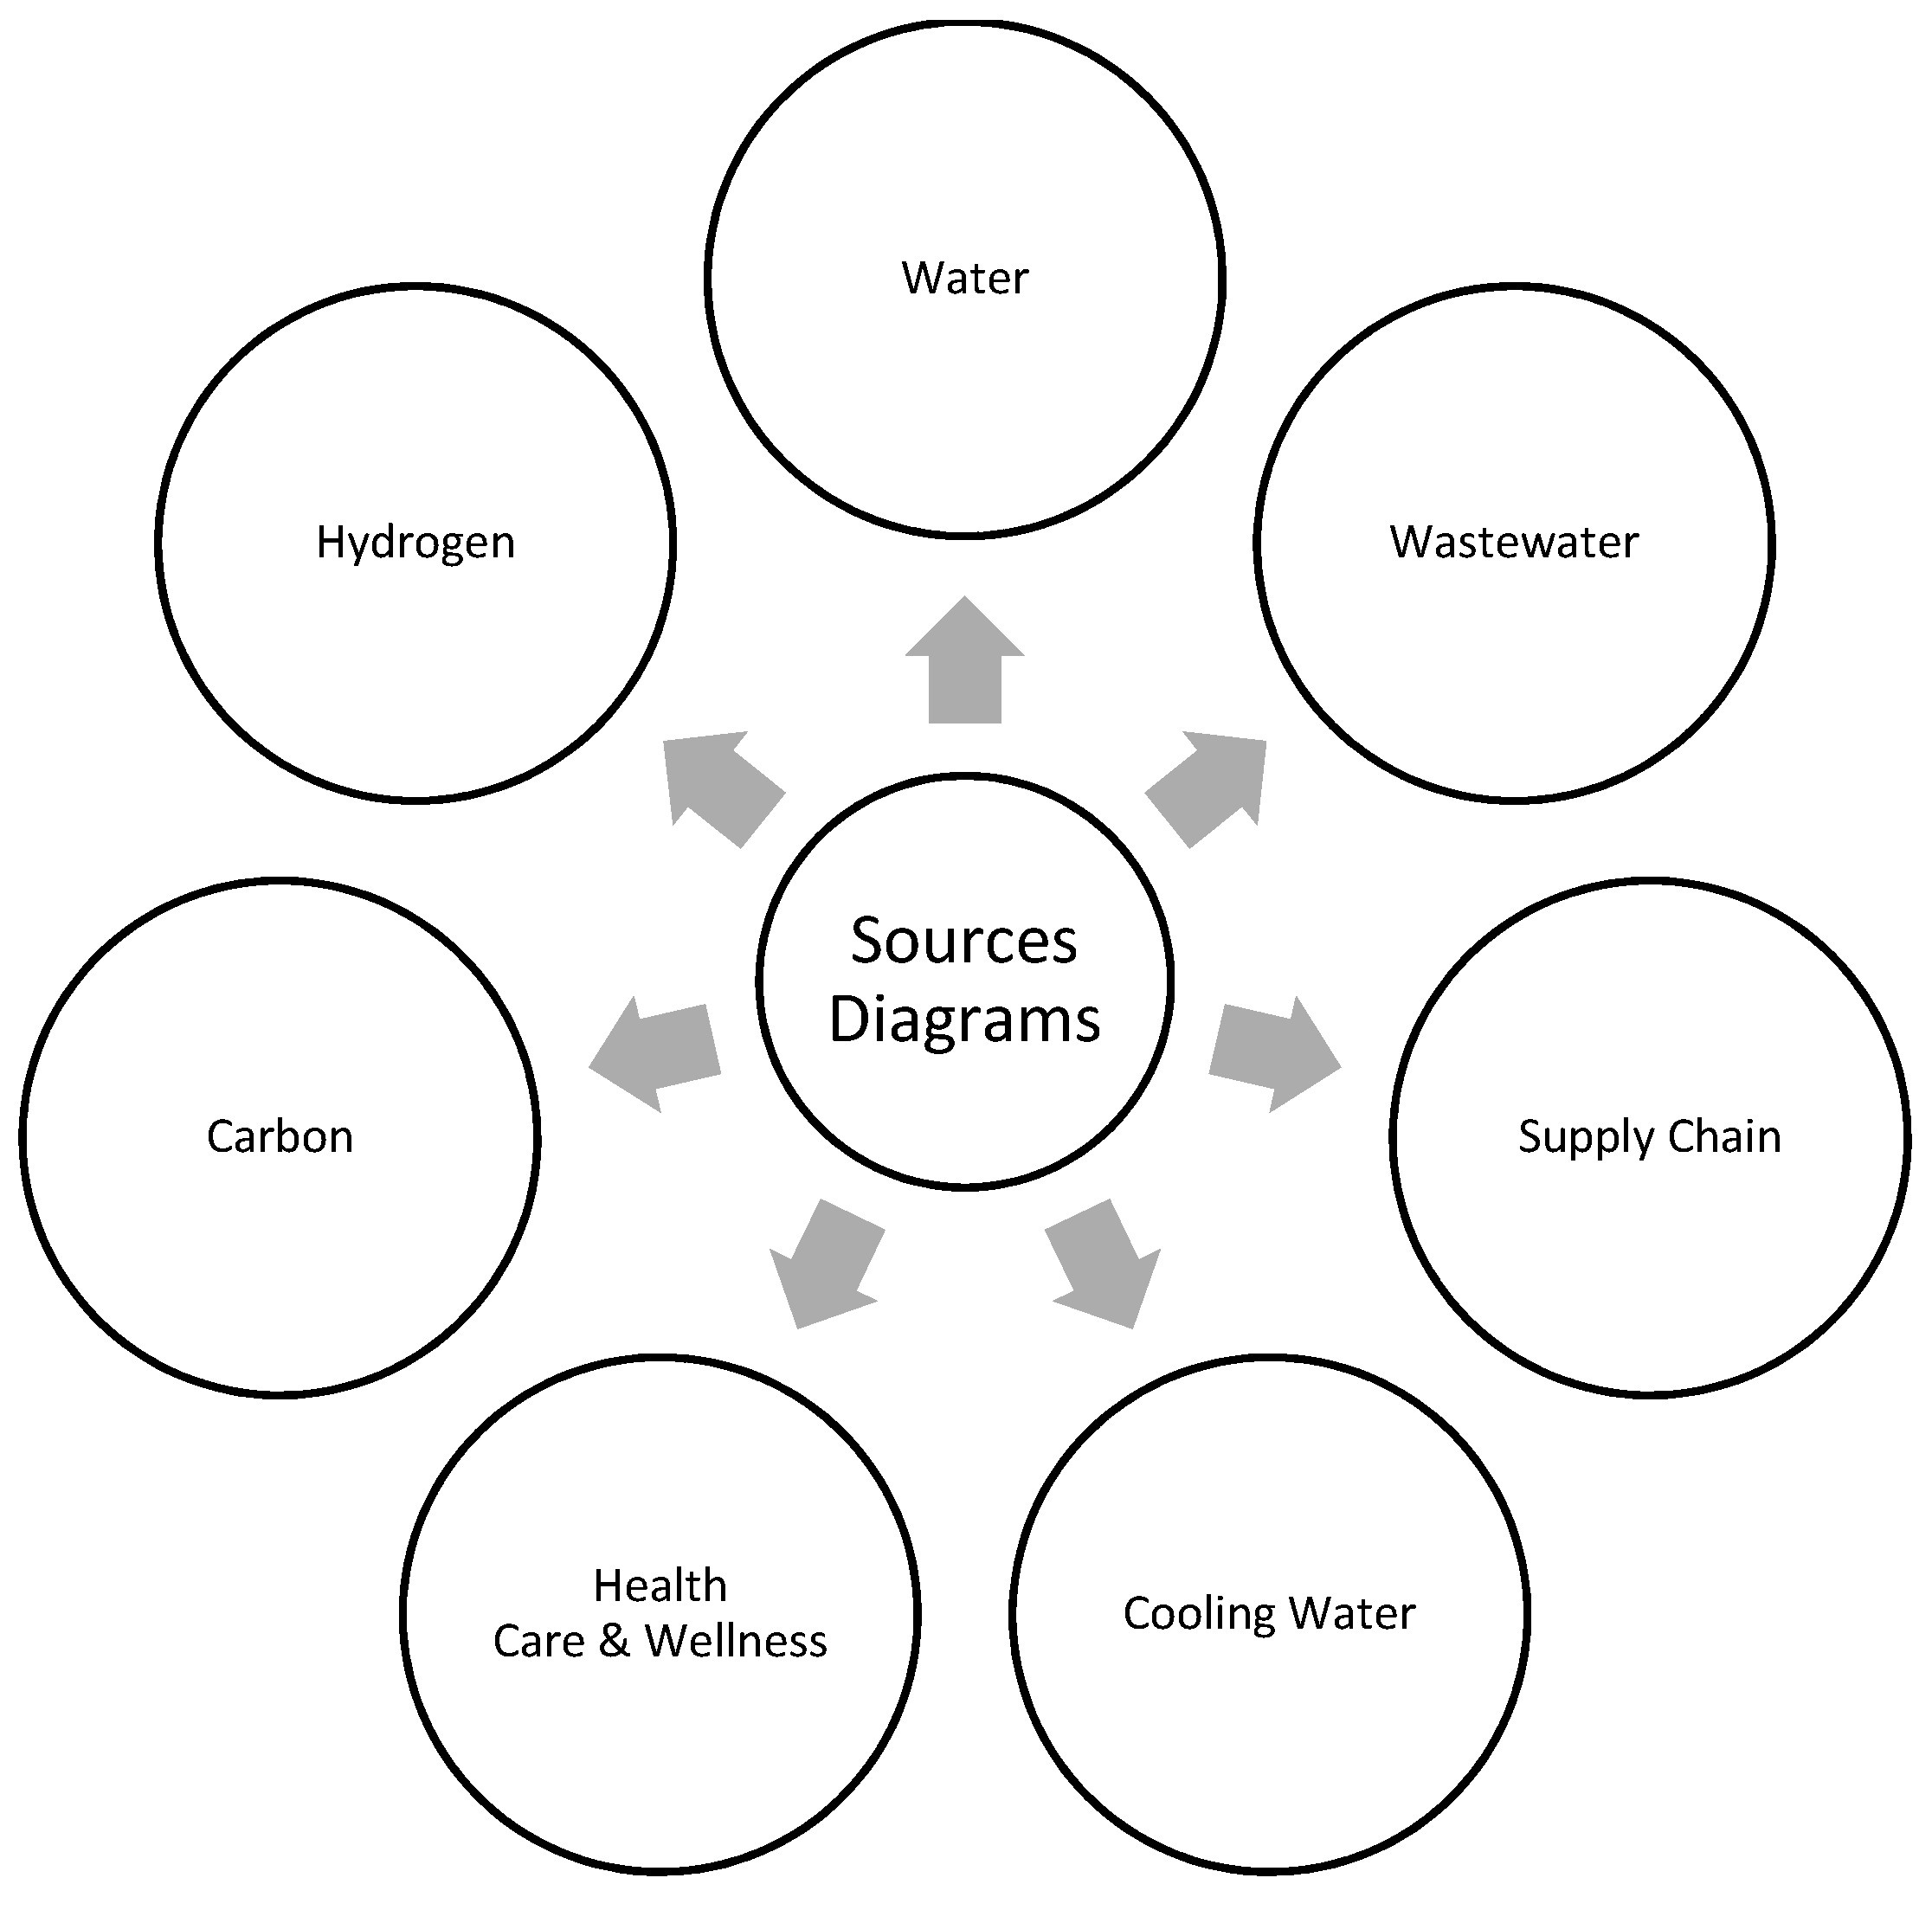
Diagrams similar to WSD can be exploited for other kinds of sources. Figure 4 shows all the already developed areas of research and those still under development using the Sources Diagram idea.
- Water Sources Diagram (WSD): Minimization of freshwater consumption in a process system;
- Wastewater Sources Diagram (WWSD): Minimization of wastewater generation;
- Hydrogen Sources Diagram (HSD): Minimization of hydrogen consumption in a process system;
- Health Care and Wellness Sources Diagram (HCSD): Generation of scenarios to establish targets for systems of healthcare and wellness sources diagram;
- Cooling Water Sources Diagram (CWSD): Minimization of the use of water in cooling water systems;
- Carbon Sources Diagram (CSD): Minimization of GHGs by the better allocation of carbon energy sources;
- Supply Chain Sources Diagram (SCSD): Optimal material distribution allocation.
5. Conclusions
This paper presented a brief summary of WSD applications for different kinds of industry and the future perspectives of Sources Diagram idea in the area of process systems engineering. We believe WSD is a viable choice when a reduction in freshwater consumption is necessary, which contributes to cost reductions in many kinds of industry. Furthermore, the Sources Diagram idea is easily extended to other kind of applications aiming to use different scenarios (bio)chemical processes to satisfy a sustainable design. Two Sources-Diagram-based methods are already established: (1) Hydrogen Sources Diagram [22], which has been applied in refineries, providing good results and (2) Carbon Sources Diagram [21], which presented interesting results when applied to the Brazilian electricity planning and management of GHGs emissions.
Author Contributions
E.E.d.S.C., R.C.M., writing—original draft preparation; F.d.S.F., F.L.P.P., E.M.Q., writing—review and editing. All authors have read and agreed to the published version of the manuscript.
Funding
This research was funded by University Center SENAI CIMATEC and by National Council for Scientific and Technological Development (CNPq).
Acknowledgments
The authors gratefully acknowledge the University Center SENAI CIMATEC and CNPq for the financial support and Federal University of Rio de Janeiro for the infrastructure.
Conflicts of Interest
The authors declare no conflict of interest.
References
- Irfan, Z. Urban Water Reuse Handbook; Eslamian, S., Ed.; CRC Press: Boca Raton, FL, USA, 2016; ISBN 9780429171802. [Google Scholar]
- Archibald, T.W.; Marshall, S.E. Review of Mathematical Programming Applications in Water Resource Management Under Uncertainty. Environ. Model. Assess. 2018, 23, 753–777. [Google Scholar] [CrossRef] [Green Version]
- Gopalakrishnan, M.; Ponce-Ortega, J.M.; El-Halwagi, M.M. A Systems Approach for Process Simplification through Process Integration. Chem. Eng. Technol. 2012, 35, 1262–1272. [Google Scholar] [CrossRef]
- Gomes, J.F.S.; Mirre, R.C.; Delgado, B.E.P.C.; Queiroz, E.M.; Pessoa, F.L.P. Water Sources Diagram in Multiple Contaminant Processes: Maximum Reuse. Ind. Eng. Chem. Res. 2013, 52, 1667–1677. [Google Scholar] [CrossRef]
- Wang, Y.P.; Smith, R. Wastewater minimisation. Chem. Eng. Sci. 1994, 49, 3533. [Google Scholar] [CrossRef]
- Calixto, E.E.S.; Francisco, F.S.; Pessoa, F.L.P.; Queiroz, E.M. A Novel Approach to Predict Violations and to Define the Reference Contaminant and Operation in Water Using Networks. In Computer Aided Chemical Engineering; Gernaey, K.V., Huusom, J.K., Gani, R., Eds.; Elsevier B.V.: Copenhagen, Danish, 2015; Volume 37, pp. 1901–1906. ISBN 978-0-444-63429-0. [Google Scholar]
- Calixto, E.E.S.; Quaresma, A.C.L.; Queiroz, E.M.; Pessoa, F.L.P. Water Sources Diagram in Multiple Contaminant Industrial Case Studies: Adoption of a Decomposition Approach. Ind. Eng. Chem. Res. 2015, 54, 10040–10053. [Google Scholar] [CrossRef]
- Francisco, F.S.; Mirre, R.C.; Calixto, E.E.S.; Pessoa, F.L.P.; Queiroz, E.M. Water sources diagram method in systems with multiple contaminants in fixed flowrate and fixed load processes. J. Clean. Prod. 2018, 172, 3186–3200. [Google Scholar] [CrossRef]
- Francisco, F.S.; Calixto, E.E.S.; Pessoa, F.L.P.; Queiroz, E.M. Systematic Procedure for the Removal of Violations in Water Sources Diagrams; Elsevier Masson SAS: San Diego, CA, USA, 2018; Volume 44, ISBN 9780444642417. [Google Scholar]
- Calixto, E.; Pessoa, F. Hybrid Approach in Total Site Water Networks. In Proceedings of the Encontro Nacional de Modelagem Computacional, Búzios, Brazil, 8–11 October 2018; p. 10. [Google Scholar]
- Karthick, R.; Kumaraprasad, G.; Sruti, B. Hybrid optimization approach for water allocation and mass exchange network. Resour. Conserv. Recycl. 2010, 54, 783–792. [Google Scholar] [CrossRef]
- Kumaraprasad, G.; Muthukumar, K. Design of Mass Exchange Network and Effluent Distribution System for effective water management. J. Clean. Prod. 2009, 17, 1580–1593. [Google Scholar] [CrossRef]
- Moreira e Silva, F.W. Minimização do consumo de água em plantas de processo com integração energética. 206 f. Master’s Thesis, Universidade Federal do Rio de Janeiro, Rio de Janeiro, Brasil, 2012. (In Portuguese). Available online: http://objdig.ufrj.br/61/dissert/778010.pdf (accessed on 10 January 2020).
- Moreira, L.P.; Delgado, B.E.P.C.; Queiroz, E.M.; Pessoa, F.L.P. WWSD for Distributed Treatment of Effluents; Elsevier: Amsterdam, The Netherlands, 2015; Volume 37. [Google Scholar]
- de Faria, D.C.; Ulson de Souza, A.A.; Guelli Ulson de Souza, S.M.D.A. Optimization of water networks in industrial processes. J. Clean. Prod. 2009, 17, 857–862. [Google Scholar] [CrossRef]
- Immich, A.P.S.; Gusatti, M.; Mello, J.M.M.D.; Guelli, U.; Souza, S.M.A.; Pessoa, F.L.P.; Ulson De Souza, A.A.; Paula, A.; Immich, S.; Gusatti, M.; et al. Application of the water source diagram (WSD) procedure to water use minimization in a batch process. In Proceedings of the European Congress of Chemical Engineering, Copenhagen, Denmark, 16–20 September 2007; Volume 1, pp. 16–20. [Google Scholar]
- Francisco, F.D.S.; Mirre, R.C.; Calixto, E.E.; Pessoa, E.M.Q.; Queiroz, E.M. Management of Water Consumption in Pulp and Paper Industry—A Case Study using Water Sources Diagram. Chem. Eng. Trans. 2014, 39, 1255–1260. [Google Scholar]
- Marques, S.V.; Delgado, B.E.P.C.; Pessoa, F.L.P.; Queiroz, E.M.; Athos, U.A.; Ramos, S. Reuse Of Water In The Pulp And Paper Industry Using The Water Source Diagram As Tool. Chem. Eng. Trans. 2008, 13, 1–8. [Google Scholar]
- de Souza, A.A.U.; Melo, A.R.; Pessoa, F.L.P.; Ulson, S.M.D.A.G. The modified water source diagram method applied to reuse of textile industry continuous washing water. Resour. Conserv. Recycl. 2010, 54, 1405–1411. [Google Scholar] [CrossRef]
- dos Santos, N.O.; da Silva Calixto, E.E.; Mirre, R.C.; Yokoyama, L. A New Approach for Evaluation of Water Reuse Opportunities in a Brazilian Thermoelectric Power Plant using the Water Sources Diagram Method. Am. J. Eng. Res. 2020. [Google Scholar]
- de Lira Quaresma, A.C.; Francisco, F.S.; Pessoa, F.L.P.; Queiroz, E.M. Carbon emission reduction in the Brazilian electricity sector using Carbon Sources Diagram. Energy 2018, 159, 134–150. [Google Scholar] [CrossRef]
- Borges, J.L.; Pessoa, F.L.P.; Queiroz, E.M. Hydrogen source diagram: A procedure for minimization of hydrogen demand in petroleum refineries. Ind. Eng. Chem. Res. 2012, 51, 12877–12885. [Google Scholar] [CrossRef]
- Gomes, J.F.S.; Queiroz, E.M.; Pessoa, F.L.P. Design procedure for water/wastewater minimization: Single contaminant. J. Clean. Prod. 2007, 15, 474–485. [Google Scholar] [CrossRef]
- Mirre, R.; Francisco, F.; Calixto, E.; Queiroz, F.P.E. MINEA, Software para a Minimização do Consumo de Água em Processos Químicos com Base no Diagrama de Fontes de Água (DFA). In Proceedings of the 11° Congreso Interamericano de Computación Aplicada a la Industria de Procesos, CAIP’2013, Pontificia Universidad Católica del Perú, Lima, Peru, 21–24 Octomber 2013; Volume 1. [Google Scholar]
- Mirre, R.C.; Yokoyama, L.; Pessoa, F.L.P. Industrial wastewater reuse in petroleum refinery using the WSD for regeneration systems (Portuguese). Ambiente Agua-An Interdiscip. J. Appl. Sci. 2011, 6, 127–151. [Google Scholar] [CrossRef]
- Ulson de Souza, A.A.; Forgiarini, E.; Brandão, H.L.; Xavier, M.F.; Pessoa, F.L.P.; Guelli, U.; Souza, S.M.A. Application of Water Source Diagram (WSD) method for the reduction of water consumption in petroleum refineries. Resour. Conserv. Recycl. 2009, 53, 149–154. [Google Scholar] [CrossRef]
- Marques, S.V. Minimização do Consumo de Água e da Geração de Efluentes Aquosos—Estudos de Casos. 212 f. Master’s Thesis, Universidade Federal do Rio de Janeiro, Rio de Janeiro, Brasil, 2008. (In Portuguese). Available online: http://objdig.ufrj.br/61/dissert/700473.pdf (accessed on 10 January 2020).
- Scarlati, P.R.D.S. Redução do Consumo de Água na Indústria Petroquímica. 207 f. Master’s Thesis, Universidade Federal do Rio de Janeiro, Rio de Janeiro, Brasil, 2013. (In Portuguese). Available online: http://objdig.ufrj.br/61/dissert/793386.pdf (accessed on 10 January 2020).
- França, A.L.F. Minimização do Consumo de Água e da Geração de Efluentes Líquidos em Siderurgia. 173 f. Master’s Thesis, Universidade Federal do Rio de Janeiro, Rio de Janeiro, Brasil, 2012. (In Portuguese). Available online: http://objdig.ufrj.br/61/dissert/782472.pdf (accessed on 10 January 2020).
- Moreira, R.C. Minimização de Efluentes em Uma Unidade de Tratamento de Água Industrial. 115 f. Master’s Thesis; Universidade Federal da Bahia: Salvador, Brasil, 2009. (In Portuguese). Available online: https://1drv.ms/b/s!AoAmVBoizC5_o5svhB3fAl9V-pXP1w?e=Vub7rQ (accessed on 10 January 2020).
Figure 1.
Initial Water Sources Diagram (WSD) representation—example problem.

Figure 2.
Final WSD representation.

Figure 3.
Final WSD representation.

Figure 4.
Possible applications of the Sources Diagram idea.


Table 1.
Data limits of the example problem.
| Operation | Mass Load (kg/h) | Flowrate (t/h) | ||
|---|---|---|---|---|
| 1 | 2 | 0 | 100 | 20 |
| 2 | 5 | 50 | 100 | 100 |
| 3 | 30 | 50 | 800 | 40 |
| 4 | 4 | 400 | 800 | 10 |
Table 2.
Examples of potential for reduction of captured water and costs, obtained through the application of the WSD method to different industrial sectors.
Table 2.
Examples of potential for reduction of captured water and costs, obtained through the application of the WSD method to different industrial sectors.
| Sector | Water Reduction (%) | Cost Reduction | References |
|---|---|---|---|
| Oil refinery | 5% (725 t/h) | 20% (1,156,945 $/year) | [25] |
| 17% (119 t/h) | (OPEX/CAPEX) 17% (2,004,777) | [26] | |
| Petrochemical | 22% (2,636 t/d) 33% (2,044 t/d) | 14% ($196,555) (OPEX) 24% (609,196 $/year) | [27] [28] |
| Citrus juices | 24% (181 t/h) | 14% (379,615 $/year) (OPEX/CAPEX) | [27] |
| Textile | 18% (36 t/h) 64% | 18% (63,674 $/year) (OPEX) | [27] [19] |
| - | |||
| Pulp and paper | 89% (142 t/h) 41% (212 t/h) | 80% (481,934 $/year) (OPEX/CAPEX) - | [18] [17] |
| Steel industry | 96% (6,135 t/h) | 77% (42,101,332 R$/year) (operational) | [29] |
| Industrial wastewater treatment unit | 12% (989 m3/month) | Reduction in variable production costs: 144,000 R$/year | [30] |
| Thermoelectric | 16% (181 m3/month) | 769,280 $/year | [20] |
© 2020 by the authors. Licensee MDPI, Basel, Switzerland. This article is an open access article distributed under the terms and conditions of the Creative Commons Attribution (CC BY) license (http://creativecommons.org/licenses/by/4.0/).
Share and Cite
MDPI and ACS Style
Calixto, E.E.d.S.; Pessoa, F.L.P.; Mirre, R.C.; Francisco, F.d.S.; Queiroz, E.M. Water Sources Diagram and Its Applications. Processes 2020, 8, 313. https://doi.org/10.3390/pr8030313
AMA Style
Calixto EEdS, Pessoa FLP, Mirre RC, Francisco FdS, Queiroz EM. Water Sources Diagram and Its Applications. Processes. 2020; 8(3):313. https://doi.org/10.3390/pr8030313
Chicago/Turabian StyleCalixto, Ewerton Emmanuel da Silva, Fernando Luiz Pellegrini Pessoa, Reinaldo Coelho Mirre, Flávio da Silva Francisco, and Eduardo Mach Queiroz. 2020. "Water Sources Diagram and Its Applications" Processes 8, no. 3: 313. https://doi.org/10.3390/pr8030313
Note that from the first issue of 2016, this journal uses article numbers instead of page numbers. See further details here.