Article

The Effect of Geometrical, Operational, Mixing Methods, and Rheological Parameters on Discharge Coefficients of Internal-Mixing Twin-Fluid Atomizers

1
State Key Laboratory of Engines, Tianjin University, Tianjin 300072, China
2
Mechanical Power Engineering Department, Faculty of Engineering, Tanta University, Tanta 31521, Egypt
3
Faculty of Mechanical Engineering, Brno University of Technology, Technicka 2896/2, 616 69 Brno, Czech Republic
*
Authors to whom correspondence should be addressed.
Processes 2020, 8(5), 563; https://doi.org/10.3390/pr8050563
Submission received: 2 April 2020 / Revised: 4 May 2020 / Accepted: 5 May 2020 / Published: 11 May 2020
(This article belongs to the Special Issue Advancement in Computational Fluid Mechanics and Optimization Methods)

Abstract

:
Accurate prediction of the discharge coefficient (CD) for internal-mixing twin-fluid (IMTF) atomizers is challenging, the effect of control factors remains inadequately understood, and comparative data on the CD of IMTF atomizers are unavailable. This work presents an experimental study on CD for different IMTF atomizers with a wide range of factors, including the gas-to-liquid ratio (GLR), the inlet-overpressure ratio (∆pmix/pamb), the orifice length-to-diameter ratio (Lo/do), and the liquid viscosity (µL). Five atomizers with different internal-mixing principles were probed on a cold test rig, including the frequently studied outside-in-gas (OIG) and inside-out-gas (IOG) effervescent types, the recently-introduced outside-in-liquid (OIL) and air-core-liquid-ring (ACLR) atomizers, and our new design named the swirling-air-core-liquid-ring (SACLR) atomizer. The results demonstrate that CD is governed mainly by GLR, and reduces if GLR, Lo/do, or µL is increased. An increase in ∆pmix/pamb causes a CD reduction up to ∆pmix/pamb = 0.98, and CD increases for a higher ∆pmix/pamb. Surprisingly, differences in CD amid examined atomizers were found negligible, although the flow visualization inside the orifice showed a significantly different flow character for each one of the atomizers. Finally, a general CD correlation fitting with an R2 ≥0.99 for all the tested nozzles was proposed. The results amend the present knowledge, allow design optimization, and provide flow rate prediction for a variety of IMTF atomizers.

1. Introduction

Twin-fluid (TF) atomizers were found to be more advantageous over other liquid atomization devices in numerous applications including gas turbines [1,2,3], scramjet [4], internal combustion engines [5,6], furnaces, and boilers [7,8,9]. They have been used for spray drying in the food industry [10,11,12,13,14,15], humidification, dust control, gas cooling, spray coating [16], pharmaceutical or consumer products [17], and water mist fire suppression systems [18].
TF atomizers use different approaches to produce two-phase mixtures for the intensification of liquid break-up. The TF atomizers in the present study significantly differ, for example, from the flash-boiling atomizers, even though both these categories work with a two-phase flow at the exit orifice. Flash-boiling atomizers use a single supply line with the bulk liquid phase only, and the two-phase flow inside the atomizer is a product of a phase-change process (i.e., an intense gas phase nucleation or flashing boiling process). This effect can be achieved by exposing the bulk liquid to a sudden and sharp pressure drop (during an isothermal expansion process) or by isobaric heating. As a result, the liquid changes from a sub-cooled state to vapor or a superheated liquid state [19]. The typical flashing boiling atomizer contains two sharp-edged orifices (0.1 and 5 mm in diameter, respectively) with an expansion chamber that separates them. The flashing of the bulk liquid, which is usually pre-heated, takes place through the first small orifice. Due to the specific design, liquid physical properties, and the working conditions, a small portion from the liquid vaporizes to create a two-phase flow inside this atomizer. On the other hand, it is difficult for the phase change phenomena inside the internal-mixing twin-fluid (IMTF) atomizers to occur for reasons that are discussed in Section 2.2. In the TF atomizers used here, both the gas and liquid phases are separately introduced into the atomizer and are mixed into a two-phase fluid. The gas–liquid mixing can be carried out internally or externally. Internal-mixing twin-fluid (IMTF) nozzles feature lower atomizing gas consumption and higher energy transfer compared to their external-mixing twin-fluid (EMTF) counterparts (e.g., airblast atomizers [20]) [5,21,22,23], which reduce operating costs.
The gas and liquid enter the IMTF nozzle through separate ports and interact inside a mixing chamber forming a two-phase mixture with a character varying depending on the mixing conditions (mixing chamber geometry, fluid pressures, and rheological properties). The mixture discharges from the exit orifice forming a spray. The discharge coefficient (CD) measures the extent to which the liquid flow uses the available exit orifice area [22].
The purpose of an atomizer is to deliver a specified amount of a liquid into a target place (defined with spray cone angle, droplet concentration, and liquid mass flux) and disperse it with the required quality (the spray characteristics such as droplet size and velocity, and droplet size distribution, are considered here). The amount of liquid discharged per time is represented with the flow rate or more conveniently with the CD of the atomizer. The importance of each factor category depends on the application. Precise liquid dosing and metering in a whole range of operating conditions are crucial in power generation units, such as combustion engines, turbines, burners, and furnaces; the throughput of the liquid governs mixing ratios of fuel with air in reacting sprays and directly affects combustion efficiency as well as pollutant formation. The amount of discharged liquid plays an essential role in process engineering and medical applications, particularly in mixing and dosing devices, chemical reactors, or columns for pollutant removal and capture. It is also considered in agriculture, food industry, or spray coating devices.
The atomized liquid is delivered to the target application in a specified amount within a range of operating conditions. Therefore, the discharge coefficient (CD) knowledge allows for predicting the actual liquid flow rate for given operating conditions; thus, playing an important role in the nozzle design process [22,24,25,26]. It is advantageous to have a prediction tool for discharge characteristics of the atomizer before its realization. Iterative or trial–error techniques of fabrication and testing of flow characteristics in the whole range of operating conditions are costly and time-consuming. Such a calculation procedure giving correct data simplifies the atomizer design, and the final experimental verification at only several operation points is required. The discharge coefficient is also a suitable parameter for the validation of numerical simulations [27] that are challenging due to the two-phase flow nature as pointed out below. The CD is defined as a ratio of the actual liquid mass flow rate to the theoretical flow rate as can be described by Equation (1) [28,29]:
C D = m L · A o 2 ρ L Δ p mix
where m L . ,   A o , ρ L ,   and   Δ p mix are the actual liquid mass flow rate, the exit orifice area, the liquid density, and the inlet-overpressure, respectively.
The CD determination of the IMTF nozzles is not such an easy task because both phases flow through the same exit orifice area [26]. Additionally, the gas–liquid flow is complex, random, and challenging in the study since this two-phase flow combines the characteristics of a deformable interface and the compressibility of one of the phases. A notable effort was paid to study the factors that mark the CD of the IMTF nozzles in order to obtain the CD predictive correlations found in the literature. Previous works are summarized in Table 1. All previous investigations are consistent in the effect of gas-to-liquid ratio (GLR) on CD (i.e., an increase in GLR leads to a non-linear decrease in the CD, while the decrement rate is rapid at low GLRs). However, there is some contradiction about the effect of liquid properties, the inlet-overpressure ratio, and the exit orifice structure on the CD. As a result, a comparison between the previously proposed models with the same conditions and geometries showed a notable difference in predictions of about 25%. Ochowiak [24] concluded that the full model for the CD calculation is unavailable yet, since there are complex relations between dependent and independent factors that affect the nozzle discharge.
Applications of IMTF nozzles cover a wide range of operating conditions and liquid rheological properties. The literature review (i.e., Table 1) suggests that the investigated factor ranges are in many cases very limited and narrow. Some factors were not included in the investigations at all, and a general and precise CD model has not yet been presented. Each of the studies was carried out on a single IMTF nozzle type, and only two old types (outside-in-gas (OIG) and inside-out-gas (IOG)) were examined. Therefore, each of the presented correlations is valid only for the type used, and no discharge characteristics are available for the newly introduced and promising IMTF nozzles. Additionally, the different IMTF nozzles possess a different way and intensity of mixing. This results in forming different internal flow regimes and characteristics [30,31]. Models based on the physical analysis of the two-phase discharge (i.e., [28]) suggest that, at the same operating conditions, the internal flow form affects the discharge characteristics; homogeneous gas-liquid flow (e.g., the homogenous bubbly flow) results in a CD decrease, and it is vice versa for separated flow (e.g., slug flow). Therefore, the internal-mixing method is expected to affect CD values, and the literature shows that this factor has not yet been investigated.
Consequently, in the present work, we tried to address these gaps by conducting a detailed experimental study on the discharge characteristics (i.e., CD) of different types of IMTF nozzles. Several factors were considered, including operation conditions, liquid types, and exit orifice geometry. The covered ranges of these factors were widened in comparison with the available literature. To study the effect of the internal-mixing method factor, for the first attempt, five types of IMTF nozzles with widely different internal-mixing methods were tested under the same conditions, liquid types, and orifice geometry. Two of the selected nozzles (outside-in-gas (OIG (and inside-out-gas (IOG)) are well-known and frequently used [1,5,10,13,24,28,30,31,32,33,34,35,36]. The following two designs (outside-in-liquid (OIL) and air-core-liquid-ring (ACLR)) were introduced recently; they are promising due to a better atomization performance [10,30,31,34], [37,38]. The last (swirling-air-core-liquid-ring (SACLR)) nozzle represents our new design, inspired by the nozzles described by García et al. [7] Stähle and colleagues [34]. Finally, we proposed a precise model for CD prediction as a function of all the investigated factors.

2. Materials and Methods

Experiments for measurement of CD and other relevant data were conducted by a cold atmospheric test rig at room temperature of 20 °C. A schematic drawing for the test rig is shown in Figure 1. The air was used as the gas phase, while water and aqueous glycerol solutions simulated the liquid phase. A wide range of operation factors was covered during the nozzle testing (i.e., GLR ranged between 1% and 65% and ∆pmix/pamb varied between 0.29 and 5.9).
An illustration of the operating conditions used for all the nozzles testing such as mass flow rate of the gas and the liquid, and the corresponding GLRs with their uncertainty values are documented in Table S1. Note that the ∆pmix/pamb was kept constant, while the GLR varied. Increasing the liquid flow rate resulted in a gradual decrease in the gas flow rate. The µL ranged between 0.001 and 0.2132 Pa∙s (see Table 2), and the Lo/do ratio of the exit orifice varied between 0.5 and 4.2, while the convergence angle upstream the orifice (2β) was kept constant at 90° (see Table 3). The rheological properties of the liquids were found as follows. The density was calculated by dividing the known liquid volume by its weight, while the viscosity was measured by a controlled stress-rotary rheometer (DHR-2, TA Instruments, New Castle, DE, USA). Viscosity measurements were conducted at a constant shear rate of 10 s−1.

2.1. Fluid Supply System
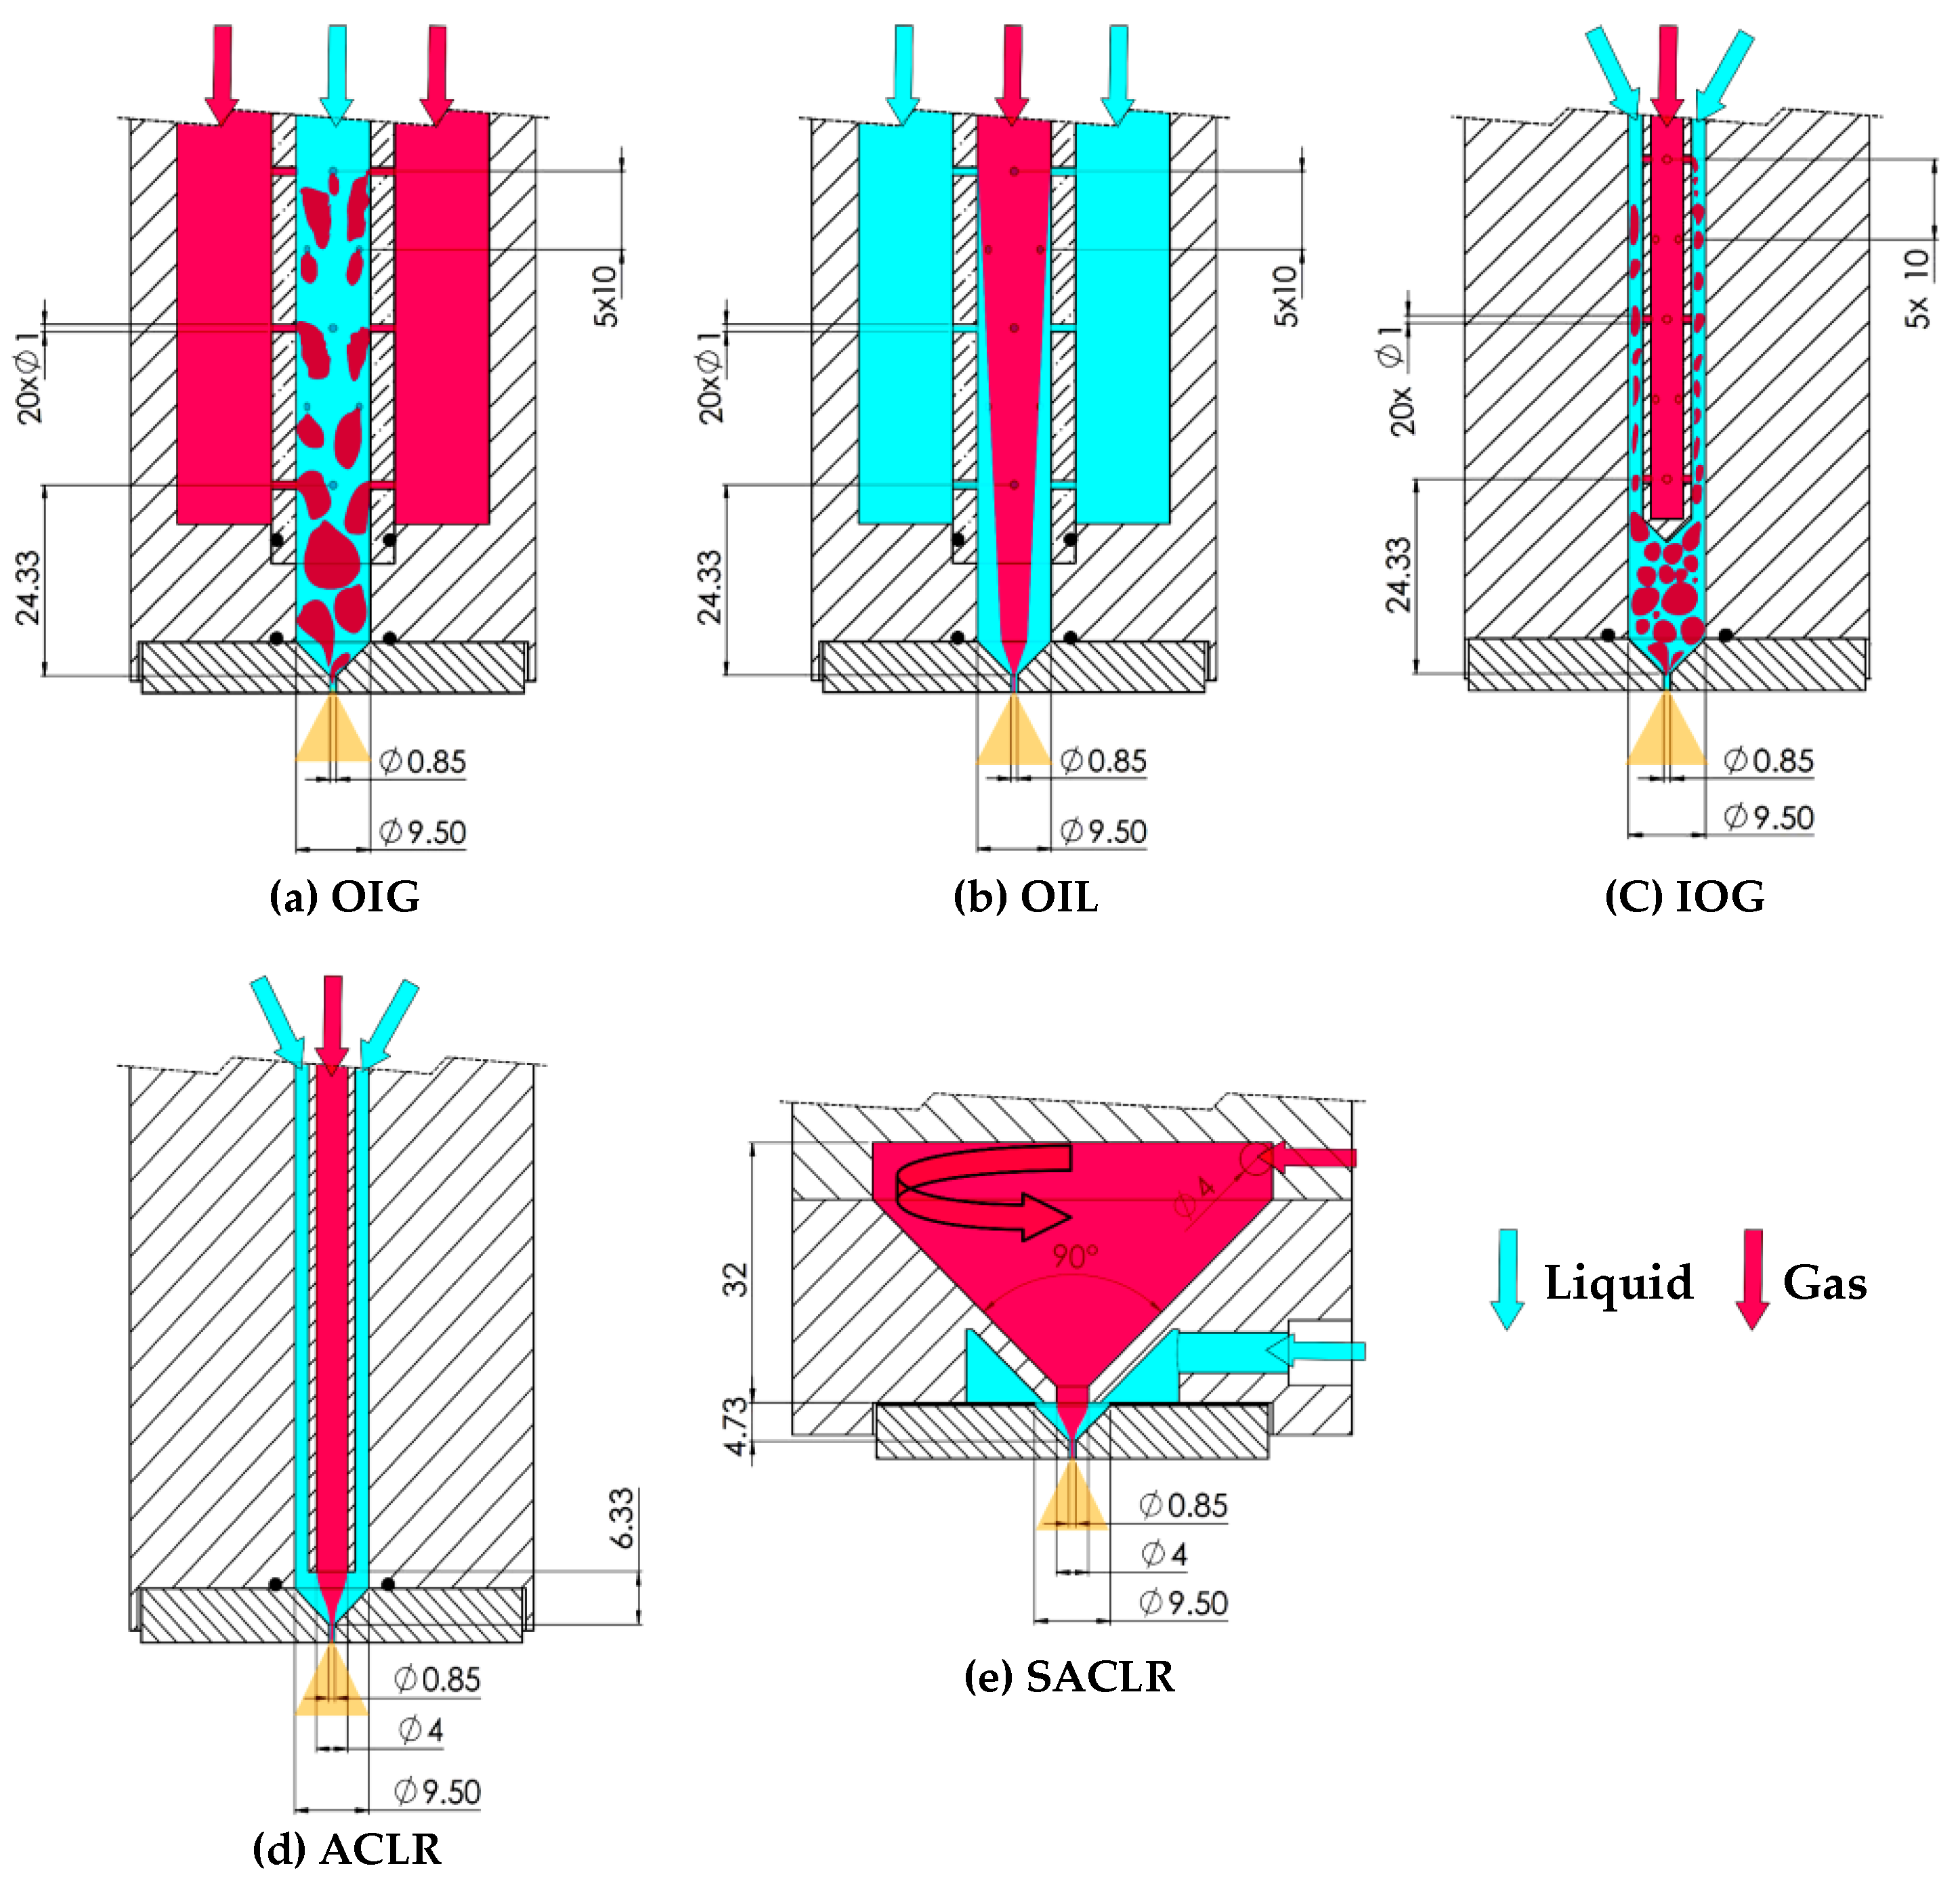
The liquid was driven by a commercial plunger pump (AR-RC 14.16 N, Modena, Italy) through a cylindrical accumulator used for damping the flow fluctuations. Sets of devices such as a needle valve for volume flow adjustment and a rotameter (DK800, KROHNE, Duisburg, Germany) were used. Rotameters with measuring ranges of 0.25–2.5 L/h, 1.2–12 L/h, 4–40 L/h, and 16–160 L/h were used for measuring the liquid volumetric flow rate with an accuracy of ±2.5% of the measuring value. The pressure gauge was fixed to measure the liquid pressure, as shown in Figure 1. The flow directed to the nozzle was controlled by a bypass valve. The pressurized air was delivered from a high-pressure air cylinder, passed through a gate valve, a pressure regulator used to control the ∆pmix/pamb. A Bourdon pressure gauge (ZYIA, Zhejiang, China, accuracy ±1.6% of the full scale) was fixed very close to the nozzle in order to measure the gas pressure. A non-return valve was used for the prevention of the water backflow to the gas line. A thermal mass flow controller (YJ-700CF—Air—10–500 SCCM, and YJ-700CV—Air—0.5–25 SLPM, Nanning, KONXIN, China, accuracy ±1% of FS) measured the gas mass flow rate. The funnel collected the sprayed liquid. Two K-type temperature sensors were located after the pressure gauges and used for measuring the gas and liquid temperatures.
When conducting the experiments of high viscosity mixtures, the plunger pump was replaced with a gear one. Additionally, before these experiments, the liquid flow meters were calibrated for metering the mixtures with different viscosities. The uncertainties for liquid density, liquid flow rate, and gas flow rate were used in the error analysis calculations for both the GLR and CD according to Holman [44]. The application of the mass flow controller for gas precluded the issue of gas density change when varying the pressure that would affect the true flow rate value. It also allowed us to achieve a large number of flow rate measurements (see Table S1) required for accurate and precise regression analysis.
The inlet conditions such as the flow fluctuations of the supplied fluids, eventual presence of dissolved gas in the liquid or inlet turbulence intensity can affect the performance of the atomizers and harm their comparison. The inlet fluid fluctuations were prevented using several precautions. The liquid supply line was equipped with a cylindrical accumulator, which provided a damping of liquid fluctuations eventually caused by the plunger pump. Additionally, to avoid the pulsations in the gas supply line, a high-pressure air cylinder was used instead of a reciprocating compressor to supply the pressurized air to the atomizer. Moreover, to avoid the effect of the possible presence of dissolved gas in the liquid, a treated water was used instead of the tap water. The treated water also prevents the metal components of the test rig to get oxidized and rusted.

2.2. Tested Nozzles

All tested IMTF nozzles were designed to work nearly under the same operation conditions; they feature comparable dimensions, as displayed in Figure 2, but their internal-mixing method for the two phases differs.
The OIG nozzle (Figure 2a) was investigated many times [1,5,10,13,28,30,31,32,33,34,36]. The mixing method is usually as follows: The liquid flows inside the main perforated chamber (aerator), while the gas is injected into the flowing liquid stream from outside through the aerator holes, perpendicularly to the main axis, resulting in a formation of a two-phase flow inside the mixing chamber that is located in the space between the last row of injection holes and the top of the exit orifice. The aerator contains 20 injection holes, each 1 mm in diameter, arranged in five rows. These rows are separated by 10 mm and turned by 45° to the neighboring one. The internal flow pattern is mainly influenced by the GLR and varies among bubbly, slug, intermittent, and annular flow [13,36].
The OIL nozzle (Figure 2b) was first introduced by Mlkvik et al. [30] in 2015 and studied later [31,42]. Its design is similar to the OIG nozzle, but the mixing method is totally different; the gas flows through the main perforated chamber, while the liquid enters into the flowing gas stream from outside through the holes at the chamber wall. This mixing method is most similar to the Y-Jet nozzle mixing. The internal flow pattern for the OIL nozzle was theoretically predicted to be annular at any GLR [30,31,42], but this hypothesis has not yet been experimentally proven.
The IOG nozzle (Figure 2c) has been frequently investigated as well [5,24,28,35,45,46]. In this configuration, the liquid flows inside the main chamber, while the gas enters into the aerator tube and bubbles outward to mix with the liquid. The aerator, as in the previous designs, contains 20 injection holes, each 1 mm in diameter, arranged in five rows. These rows are separated by 10 mm and turned by 45° to the neighboring one. The aerator internal diameter is 4 mm, and its wall is 1 mm thick. The internal flow pattern is heavily influenced by the GLR and thus similar to the OIG configuration.
Correspondingly, the ACLR nozzle (Figure 2d) was designed and introduced by Stähle et al. [34] and studied later by other researchers [10,11,12]. In contrast to the OIG and IOG nozzles, the air in the ACLR nozzle is not injected into the liquid through multiple holes perpendicularly to the main axis, but through a single capillary positioned coaxially to the main axis and it exits very close to the discharge orifice. This arrangement produces a high-velocity air core surrounded by a liquid annulus in the mixing position, which provides an annular flow pattern inside the orifice at any GLR [34].
Finally, the new SACLR nozzle was designed to introduce an additional type of internal mixing which involves a swirling motion. Figure 2e shows that, in this case, the air enters through a tangential inlet at the top and swirls inside the conical conduct towards the exit hole at the base. This hole is coaxial to the main atomizer axis and ends very close to the top of the discharge orifice. The air exits this hole to enter into the mixing chamber in the form of a swirling air core, while the liquid is introduced parallel to this core, which forms a liquid ring around the swirling core directly upstream the exit orifice.
Considering the phase change phenomena, it is difficult for the liquid inside the IMTF atomizers to be exposed to an intense nucleation at any region. Neither the internal design nor the operating conditions help to initiate such a process. As shown in the literature review, and in the present study, these atomizers usually work under very low inlet-overpressure (∆pmix/pamb <6) and the mixing of the two phases carries out at a constant pressure. This means that the liquid pressure outside the main perforated chamber (i.e., in the OIL design case) is slightly higher than that inside the chamber. In addition, the number and the diameter of the holes in the chamber are large (i.e., 1 mm, see Figure 2) in comparison with the first, small orifice of the flash-boiling atomizer (i.e., 0.1 mm in diameter). In addition, the liquid temperature is low and is usually equal to the room temperature. Consequently, the liquid flows through these holes with a negligible pressure drop, and therefore without any phase transition. After the mixing process, the two-phase (water–air) mixture flows through the convergent/exit orifice region (the convergence angle upstream the orifice is 90°). During this, the average mixture pressure gradually drops down until it equalizes with the atmospheric pressure. Furthermore, it was observed in other studies [47,48,49] that the nucleation phenomena considerably reduces and delays if a small amount of dissolved gas is present in the pure liquid. In other words, the gas bubble presence in the liquid inhibits the phase change process if compared to the pure liquid case. Therefore, the cold water–air mixture flowing through the convergent/exit orifice region in the IMTF atomizer is not likely to be exposed to the phase change process. It is expected that this phenomenon does not affect the discharge characteristics of the IMTF atomizers.

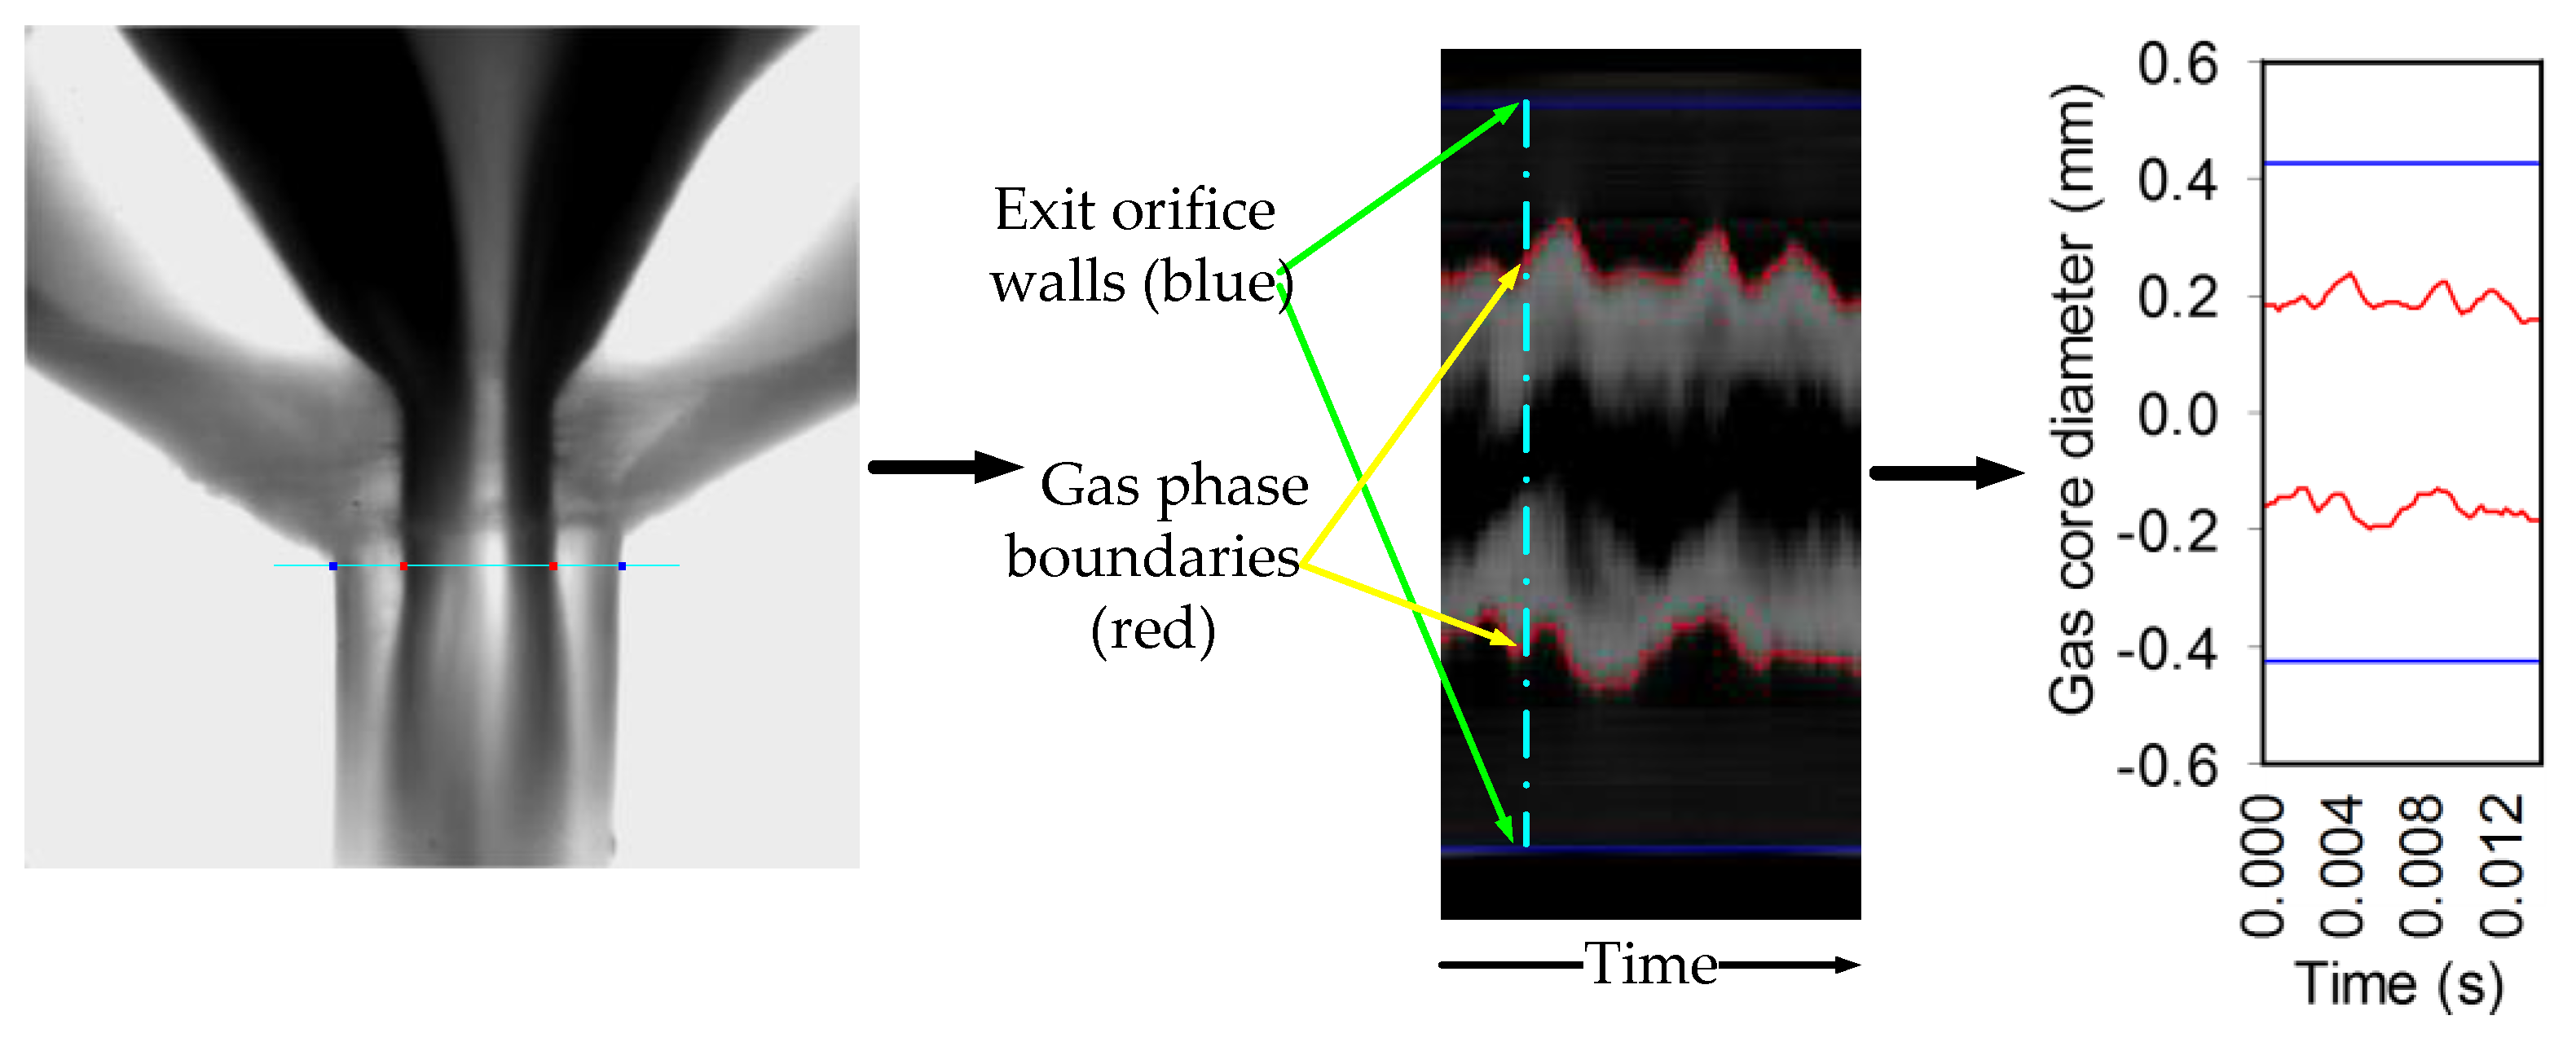
2.3. Internal Flow Visualization

For the flow visualization inside the exit orifice, the segment containing the contraction zone and exit orifice was machined (with do = 0.85 mm, and Lo/do 1.1) in a square cross-section acrylic (Plexiglas) block to reduce the optical distortion caused by the curved shapes. This part was backlit illuminated by a diffused 500 W light. A high-speed camera (Fastcam SA 1.1, Photron, Tokyo, Japan) with a long distance microscope (Questar-QM1) was used to capture the flow images with 2000 frames/s rate and 1024 × 1024 pixel image resolution.

2.4. Methodology of Data Analysis

The literature review revealed that CD is affected by working conditions [26], the exit office size and geometry [28,35], and the physical properties of the phases [24,28]. Here a general function applies:
f ( C D , Q G · , Q L · , Δ p mix , p amb , L o , d o , μ L , μ G , ρ L , ρ G ) = 0
After performing the dimensional analysis, CD can be expressed by Equation (3):
C D = f ( GLR , L o d o , Δ p mix p amb , μ L μ G )
The form of CD correlation can be obtained by applying a non-linear regression analysis with the least-squares method to the experimental data. Note that the gas-to-liquid mass flow ratio is defined as shown by Equation (4):
GLR = m G · m L ·
The effect of the investigated factors on CD was evaluated via an analysis of variance (ANOVA) test. ANOVA is a form of statistics hypothesis testing that determines the effect of one or more factors on an outcome variable by comparing the means of different groups. ANOVA is widely used in the analysis of experimental data [50]. The test result, which is usually presented by the probability (p-value) that is calculated from the null hypothesis and the experimental data sample, is considered statistically significant when the p-value is less than a pre-specified threshold. A predictor that keeps a low p-value has a significant effect on the model accuracy as changing that predictor value causes a considerable change in the model response. On the other hand, high p-value predictors do not have a significant effect on the model response. For the identification of significant differences, the alpha value was set equal to 0.05.
α i = A G A o
C V α i = σ α α avg
σ α = 1 N 1 N ( α i α avg ) 2
S = U G ( 1 α avg ) U L α avg
For each case, 250 flow visualization images were captured and processed, and this number was found sufficient for the minimization of bias errors in the measurement. Thereafter, MATLAB software was used for determining the gas phase boundaries at the entrance of the exit orifice and subsequently determining the diameter of the gas core (see Figure 3). The gas core diameter was used to measure the time variation of the gas phase inside the exit orifice, which corresponds with the internal flow regime [51,52]. Additionally, this diameter can be used to indicate some parameters for the gas–liquid flow (i.e., the gas void fraction and the corresponding slip ratio), as represented by Equations (5)–(8).
αi is the time-varying void fraction, AG is the cross-sectional area occupied by the gas phase, Ao is the orifice cross-sectional area, CVαi is the coefficient of variation of αi, which reflects its fluctuation, σα is the standard deviation of αi, αavg is the time-averaged void fraction, and N is the image number. The CVαi increase indicates a wide distribution range of αi and its high fluctuations. S is the slip ratio (also called the velocity ratio), which represents the actual velocities ratio of both gas and liquid phases, respectively. UG and UL are phase superficial velocities of the gas and liquid, respectively.

2.5. Analysis of the Experimental Errors

The uncertainties in the experimental results are caused by the errors in the primary measurements. Experimental error analysis was provided according to Holman [44]. Let R be a function given as
R = f (X1, X2, X3… Xn), where X1, X2, X3 ,..., Xn are independent variables with uncertainties of WX1, WX2, WX3 ,..., WXn, respectively. Therefore, the uncertainty in the R value (WR) can be calculated as follows:
W R = ± ( R X 1 × W X 1 ) 2 + ( R X 2 × W X 2 ) 2 + ..... ( R X n × W X n ) 2
and the relative error is
E R = W R R × 100 %
The relative error of the dependent variables is determined as follows:
Density:
W ρ = ± ( 1 v × W m ) 2 + ( m v 2 × W v ) 2
Mass flow rate of liquid and gas:
W m . = ± ( ρ × W Q . ) 2 + ( Q . × W ρ ) 2
Gas-to-liquid ratio:
W GLR = ± ( 1 m l . × W m g . ) 2 + ( m g . m l . 2 × W m l . ) 2
Discharge coefficient:
W C D = ± ( 1 A o 2 ρ l   Δ p × W m l . ) 2 + ( m l . A o 2 2 ρ l   Δ p × W A o ) 2 + ( m l . 2 A o   ρ l ( 3 / 2 ) 2   Δ p × W ρ l ) 2 + ( m l . 2 A o   Δ p ( 3 / 2 ) 2   ρ l × W Δ p ) 2
The relative errors for the CD are displayed as error bars at each measuring point in the following result graphs. For instance, the uncertainties for mass flow and GLR are documented in Table S1.

3. Results and Discussion

In this section, the results of the OIL nozzle are presented, while the results of the other nozzles are presented in Figures S1–S4. The comparisons between the obtained results of the tested nozzles will be illustrated in Section 3.4.

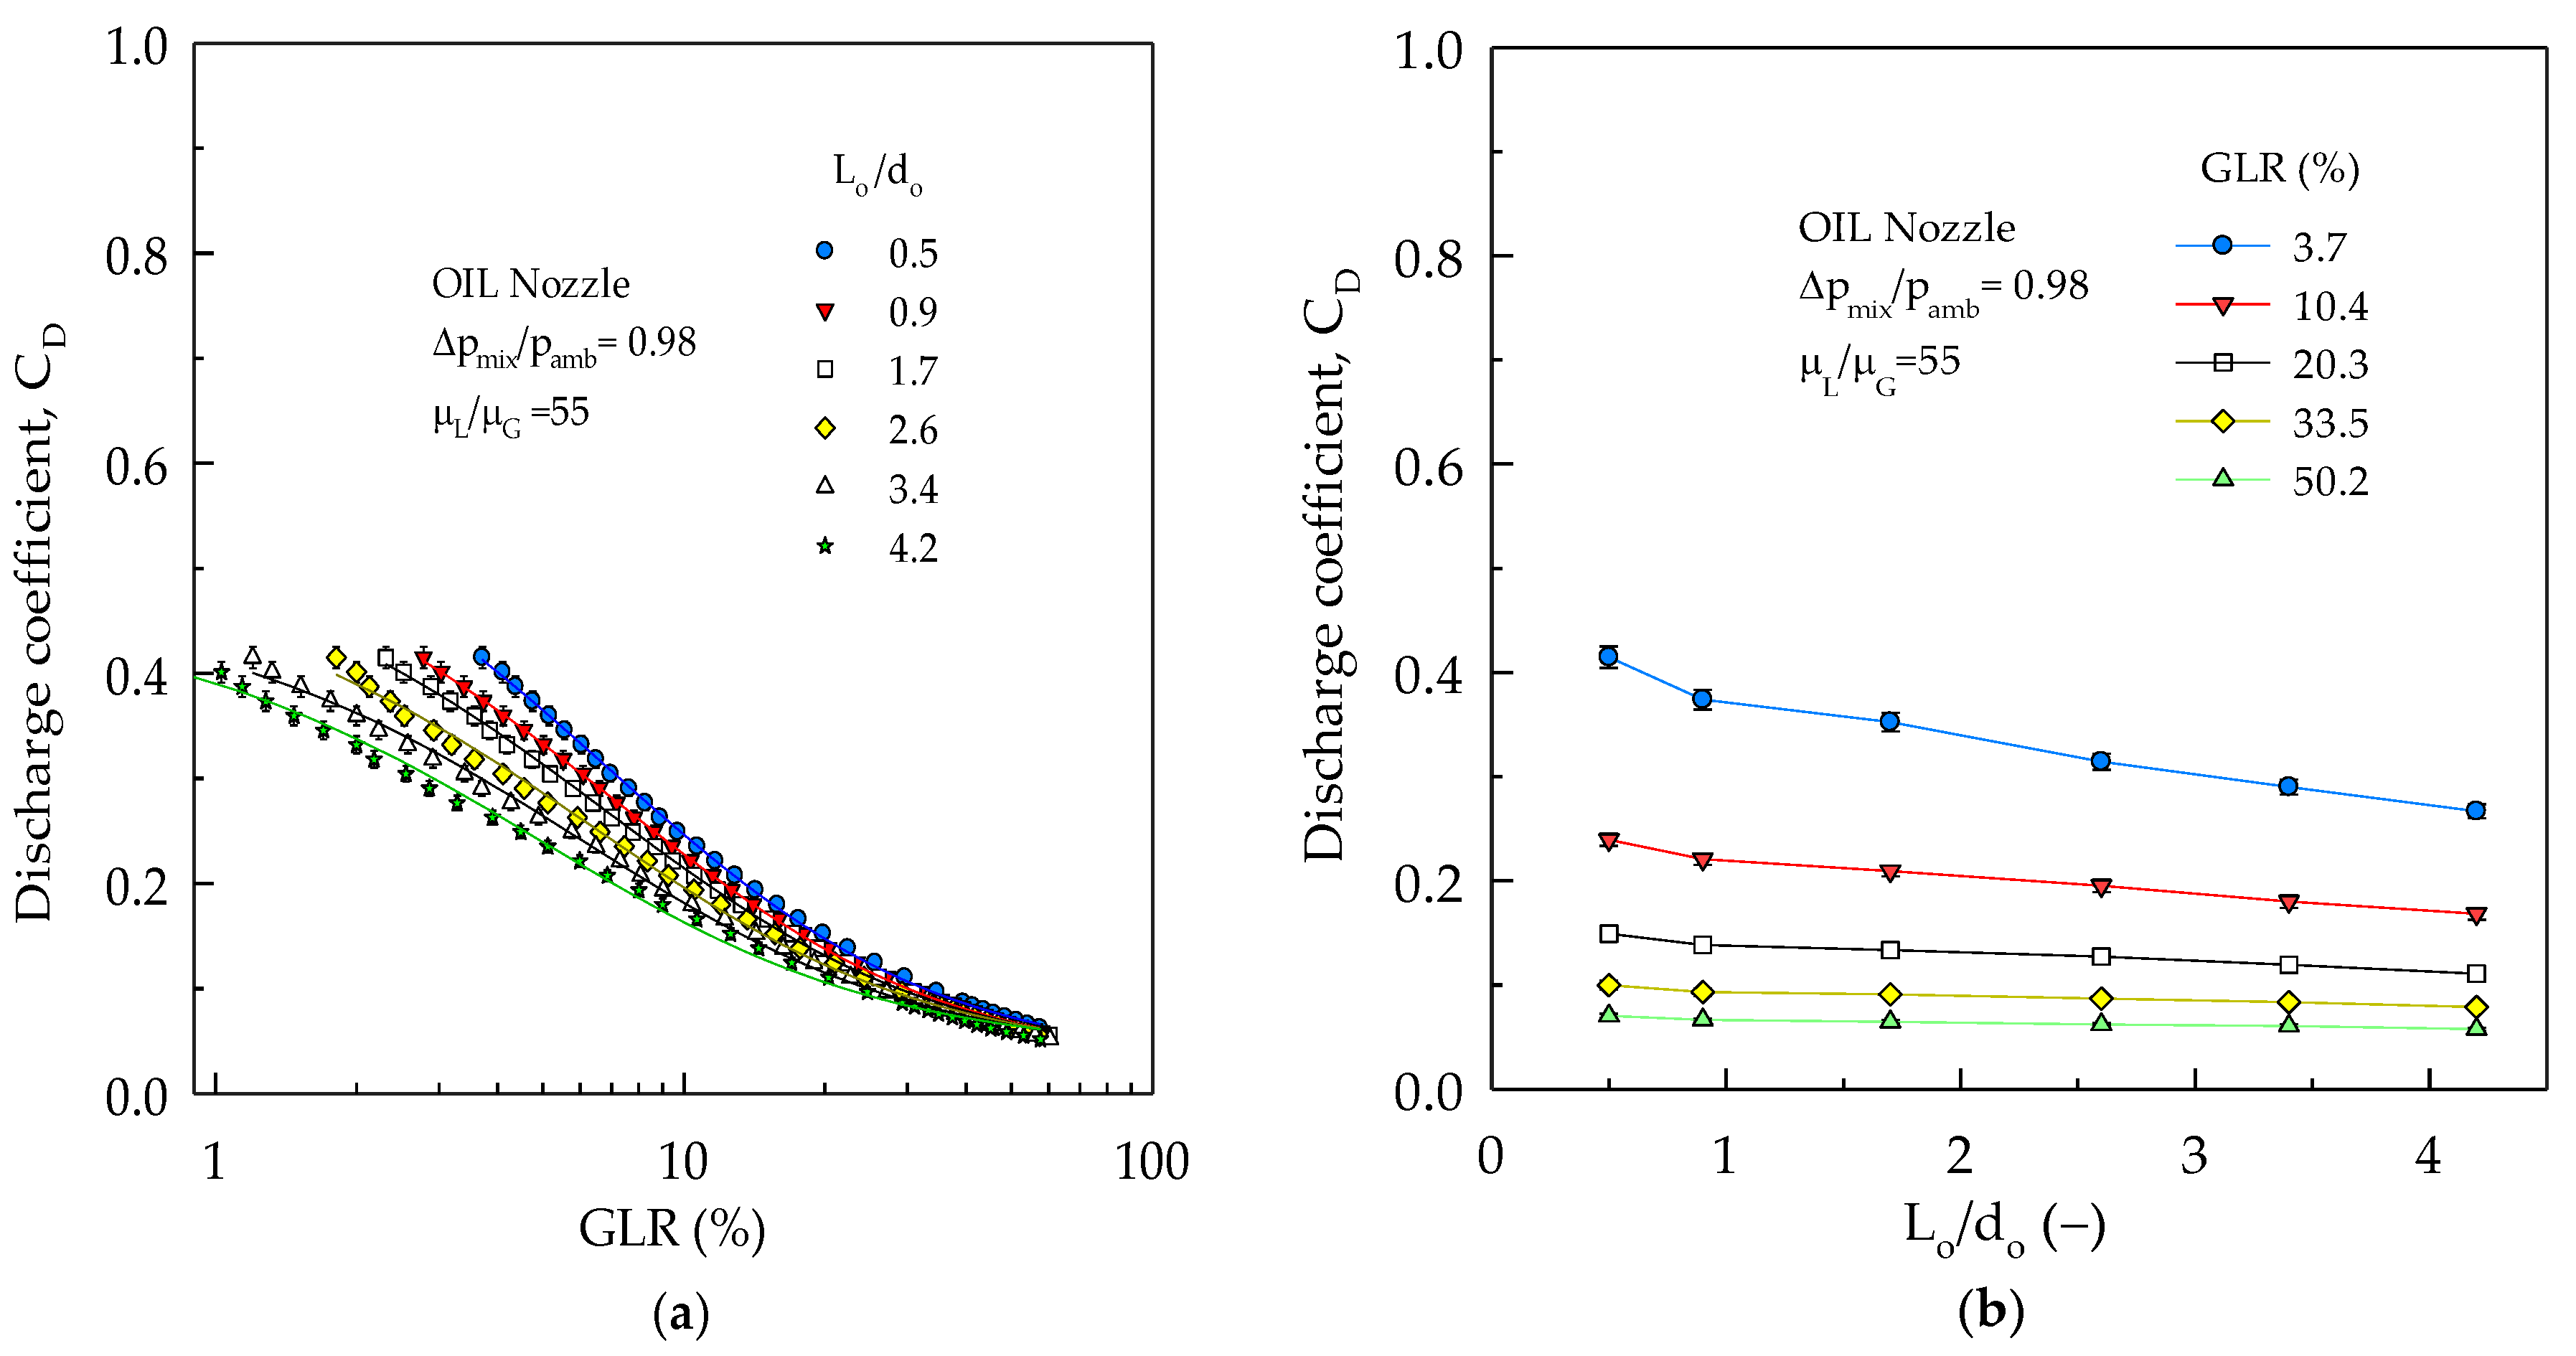
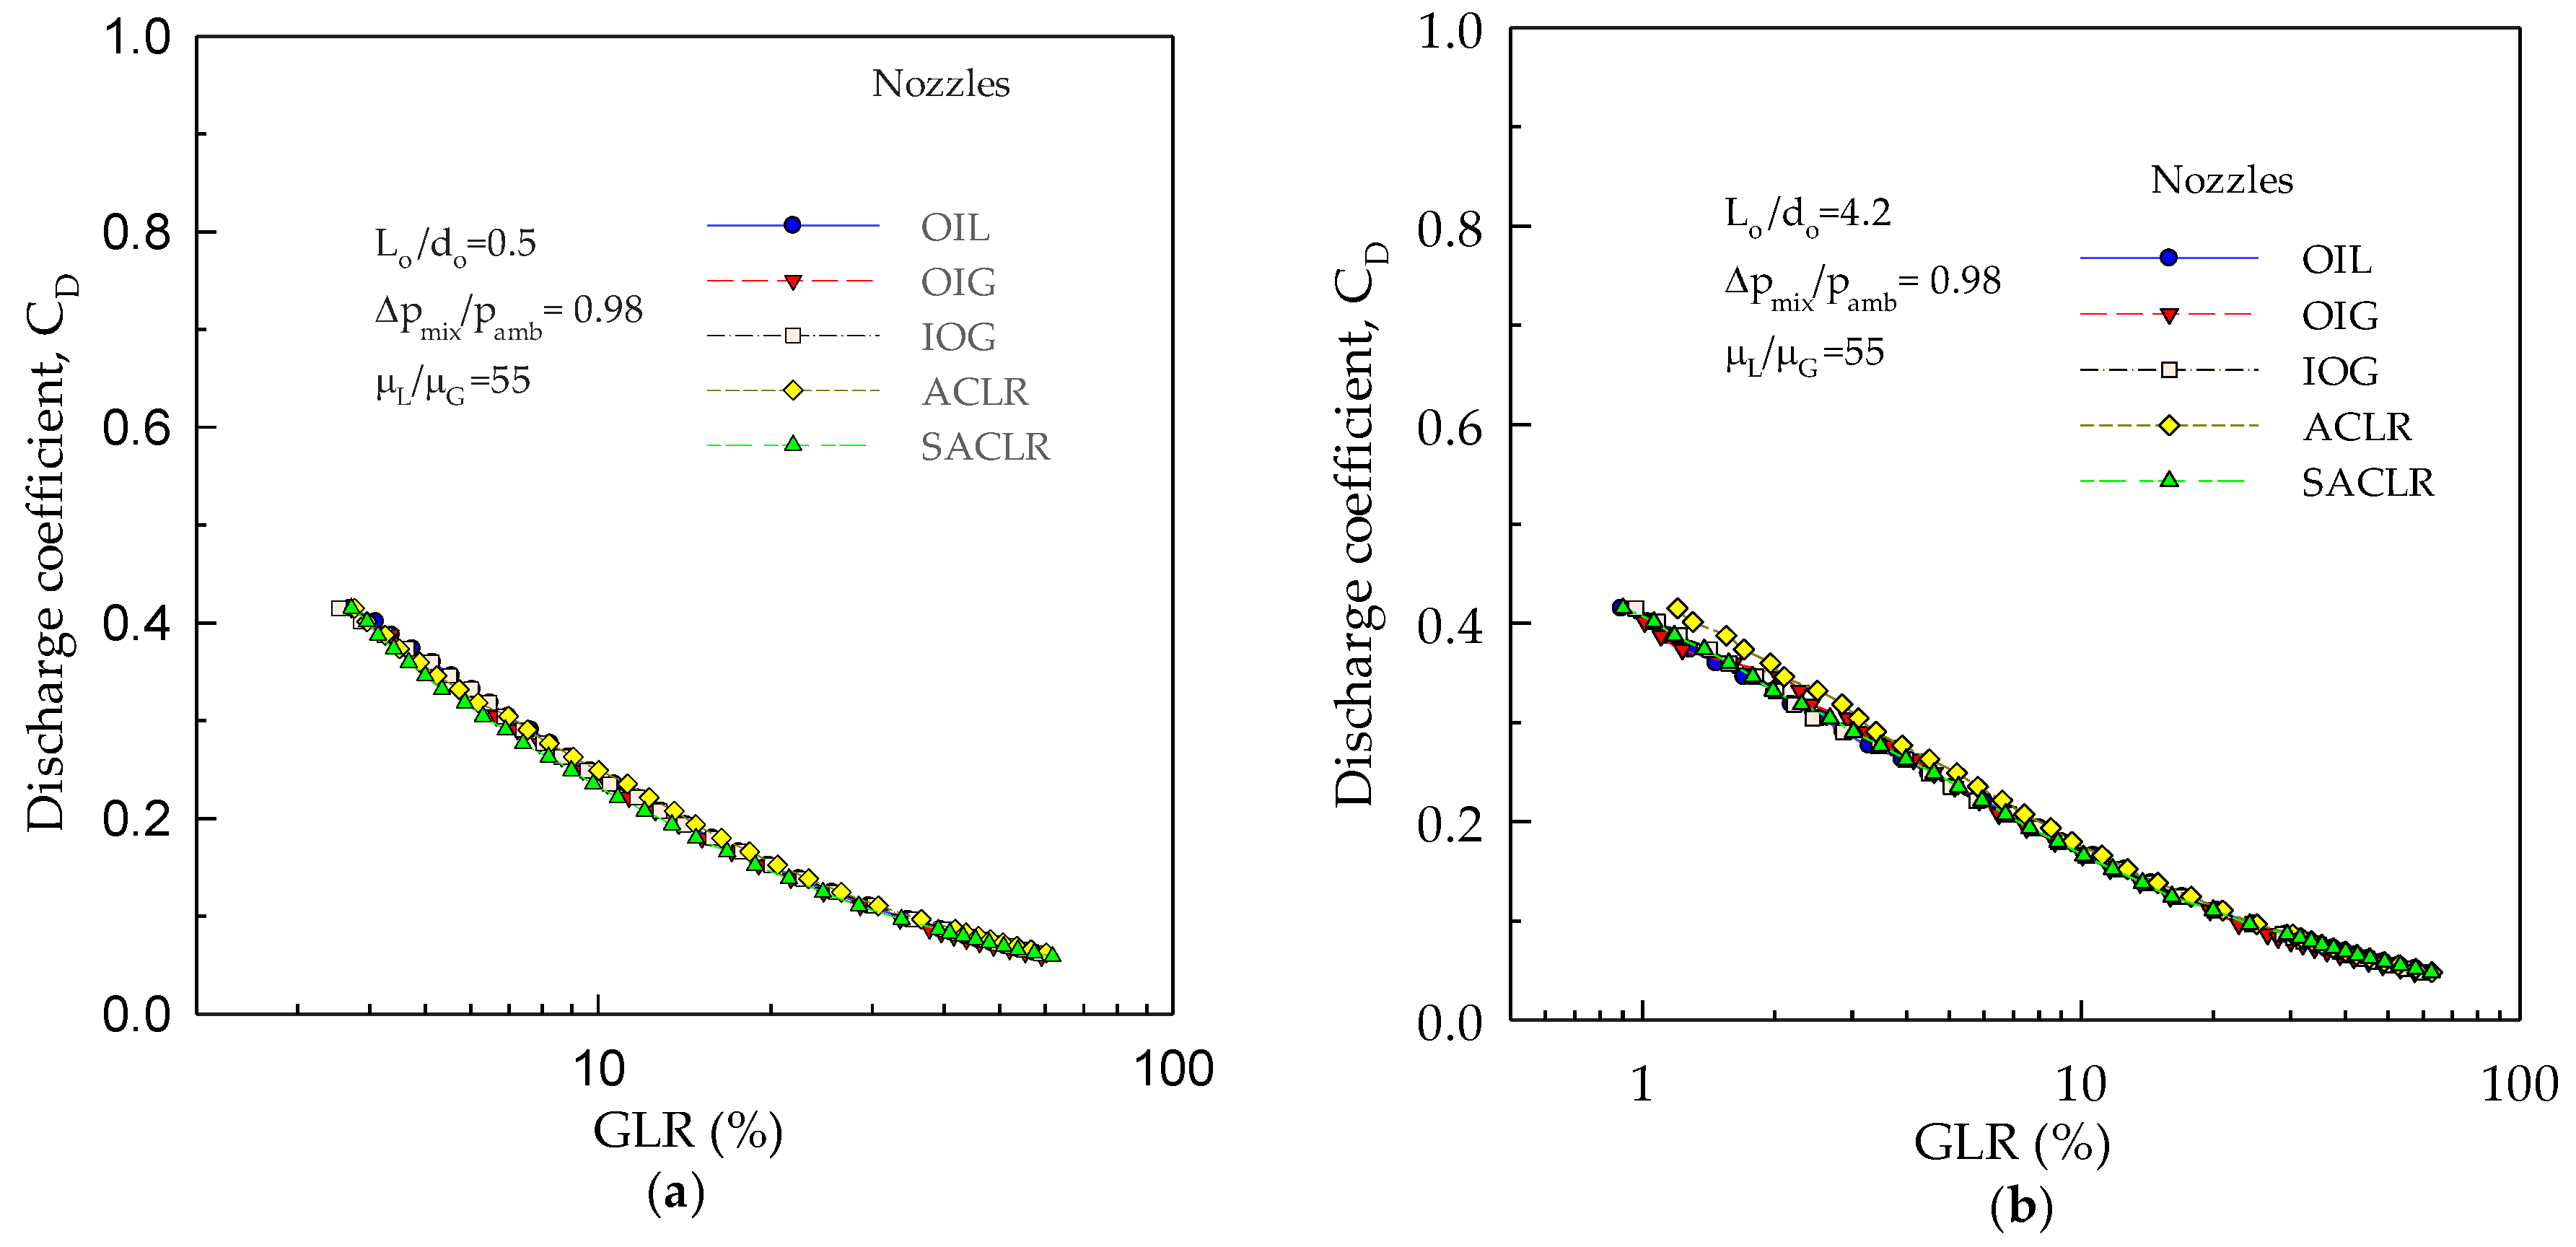
3.1. The Effect of GLR and Orifice Structure on CD

The effect of both GLR and Lo/do on the CD of the OIL nozzle is shown in Figure 4. It is clear that CD features a sharp decrease when increasing the GLR to ≈30%, while a further GLR increase has little effect on CD (see Figure 4a where the absolute values for the CD are documented). This behavior results from the link between the GLR and the flow area occupied by the liquid inside the exit orifice [26]. The actual area available for the liquid flow decreases with any increase in the gas flow rate (i.e., with increasing GLR). It is apparent that the discharge coefficients of the twin-fluid atomizers are, due to the gas blockage, lower than that reported for plain-orifice atomizers and single-fluid nozzles [53], simplex [54], and even spill-return pressure-swirl atomizers [55]. It moreover drops down below 0.1 for GLRs increasing above 10%. Figure 4b documents that, with a constant GLR, CD decreases with an increasing Lo/do ratio. Here the friction force on the liquid flow plays a role, as it is proportional to the exit orifice length.
Additionally, the sensitivity of CD to the Lo/do variation is high at low GLRs, while it gradually decreases with the GLR increase. The obtained results show that, when Lo/do increases from 0.5 to 4.2, there is a pronounced drop of CD by 35.6% and 18% at GLRs of 3.7% and 50.2%, respectively. The reason is that, at low GLRs, the liquid occupies the largest portion of the exit orifice and is exposed to the largest friction force. Therefore, a small increase in the exit orifice length results in significant resistance to the liquid flow, and a notable CD reduction. At high GLRs, the amount of liquid passing through the orifice is very small relative to the gas amount, and the friction force acting on this liquid is also small.
It was found that an exponential decay function CD = A × EXP (B/ (GLR + C)) fits the experimental data accurately as can be seen in Figure 4. The results of other nozzles (OIG, IOG, ACLR, and SACLR) show similar trends as the OIL nozzle (see Figure S1). Regarding the results of the IOG nozzle, it is consistent with Jedelsky and colleauges [28] and Chin and Lefebvre [29] and inconsistent with Ochowiak [45]. CD was found to increase to a maximum value as Lo/do increases to 2.04 and then to decrease with a further increase in Lo/do. Finally, results from the ANOVA show a statistically significant difference in CD with varying GLRs and Lo/do (i.e., a p-value equal to 6.94 × 10⁻²⁷ and 5.49 × 10⁻²⁰, respectively), so the effect of both GLRs and Lo/do factors on CD cannot be neglected.

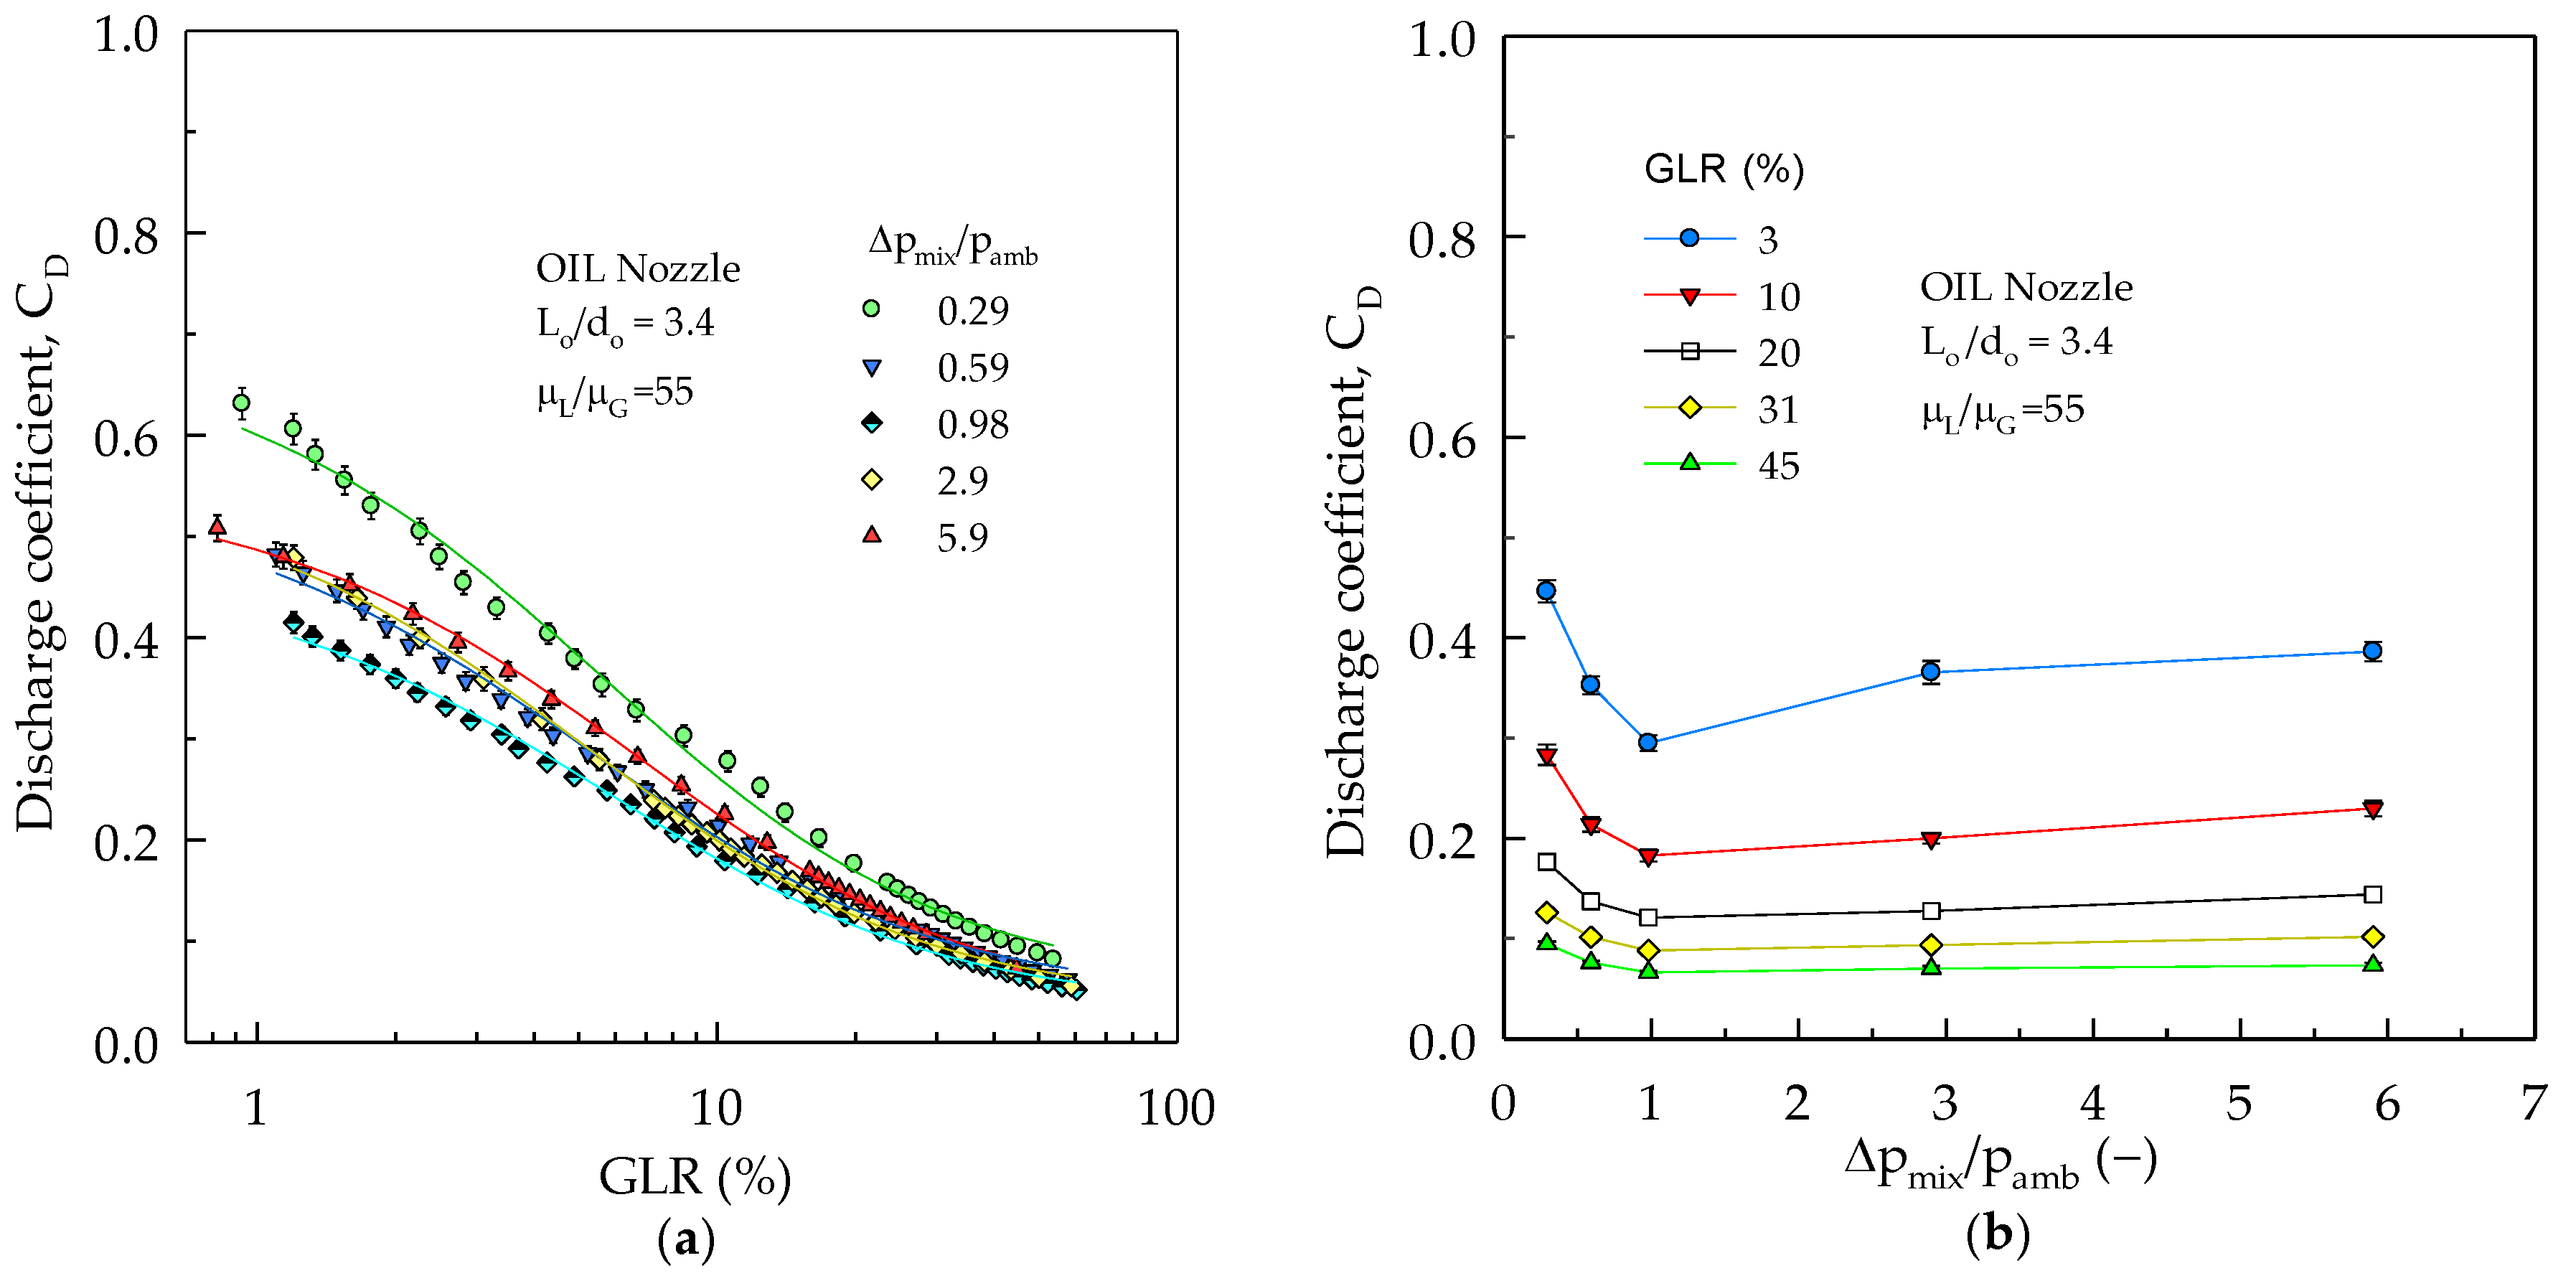
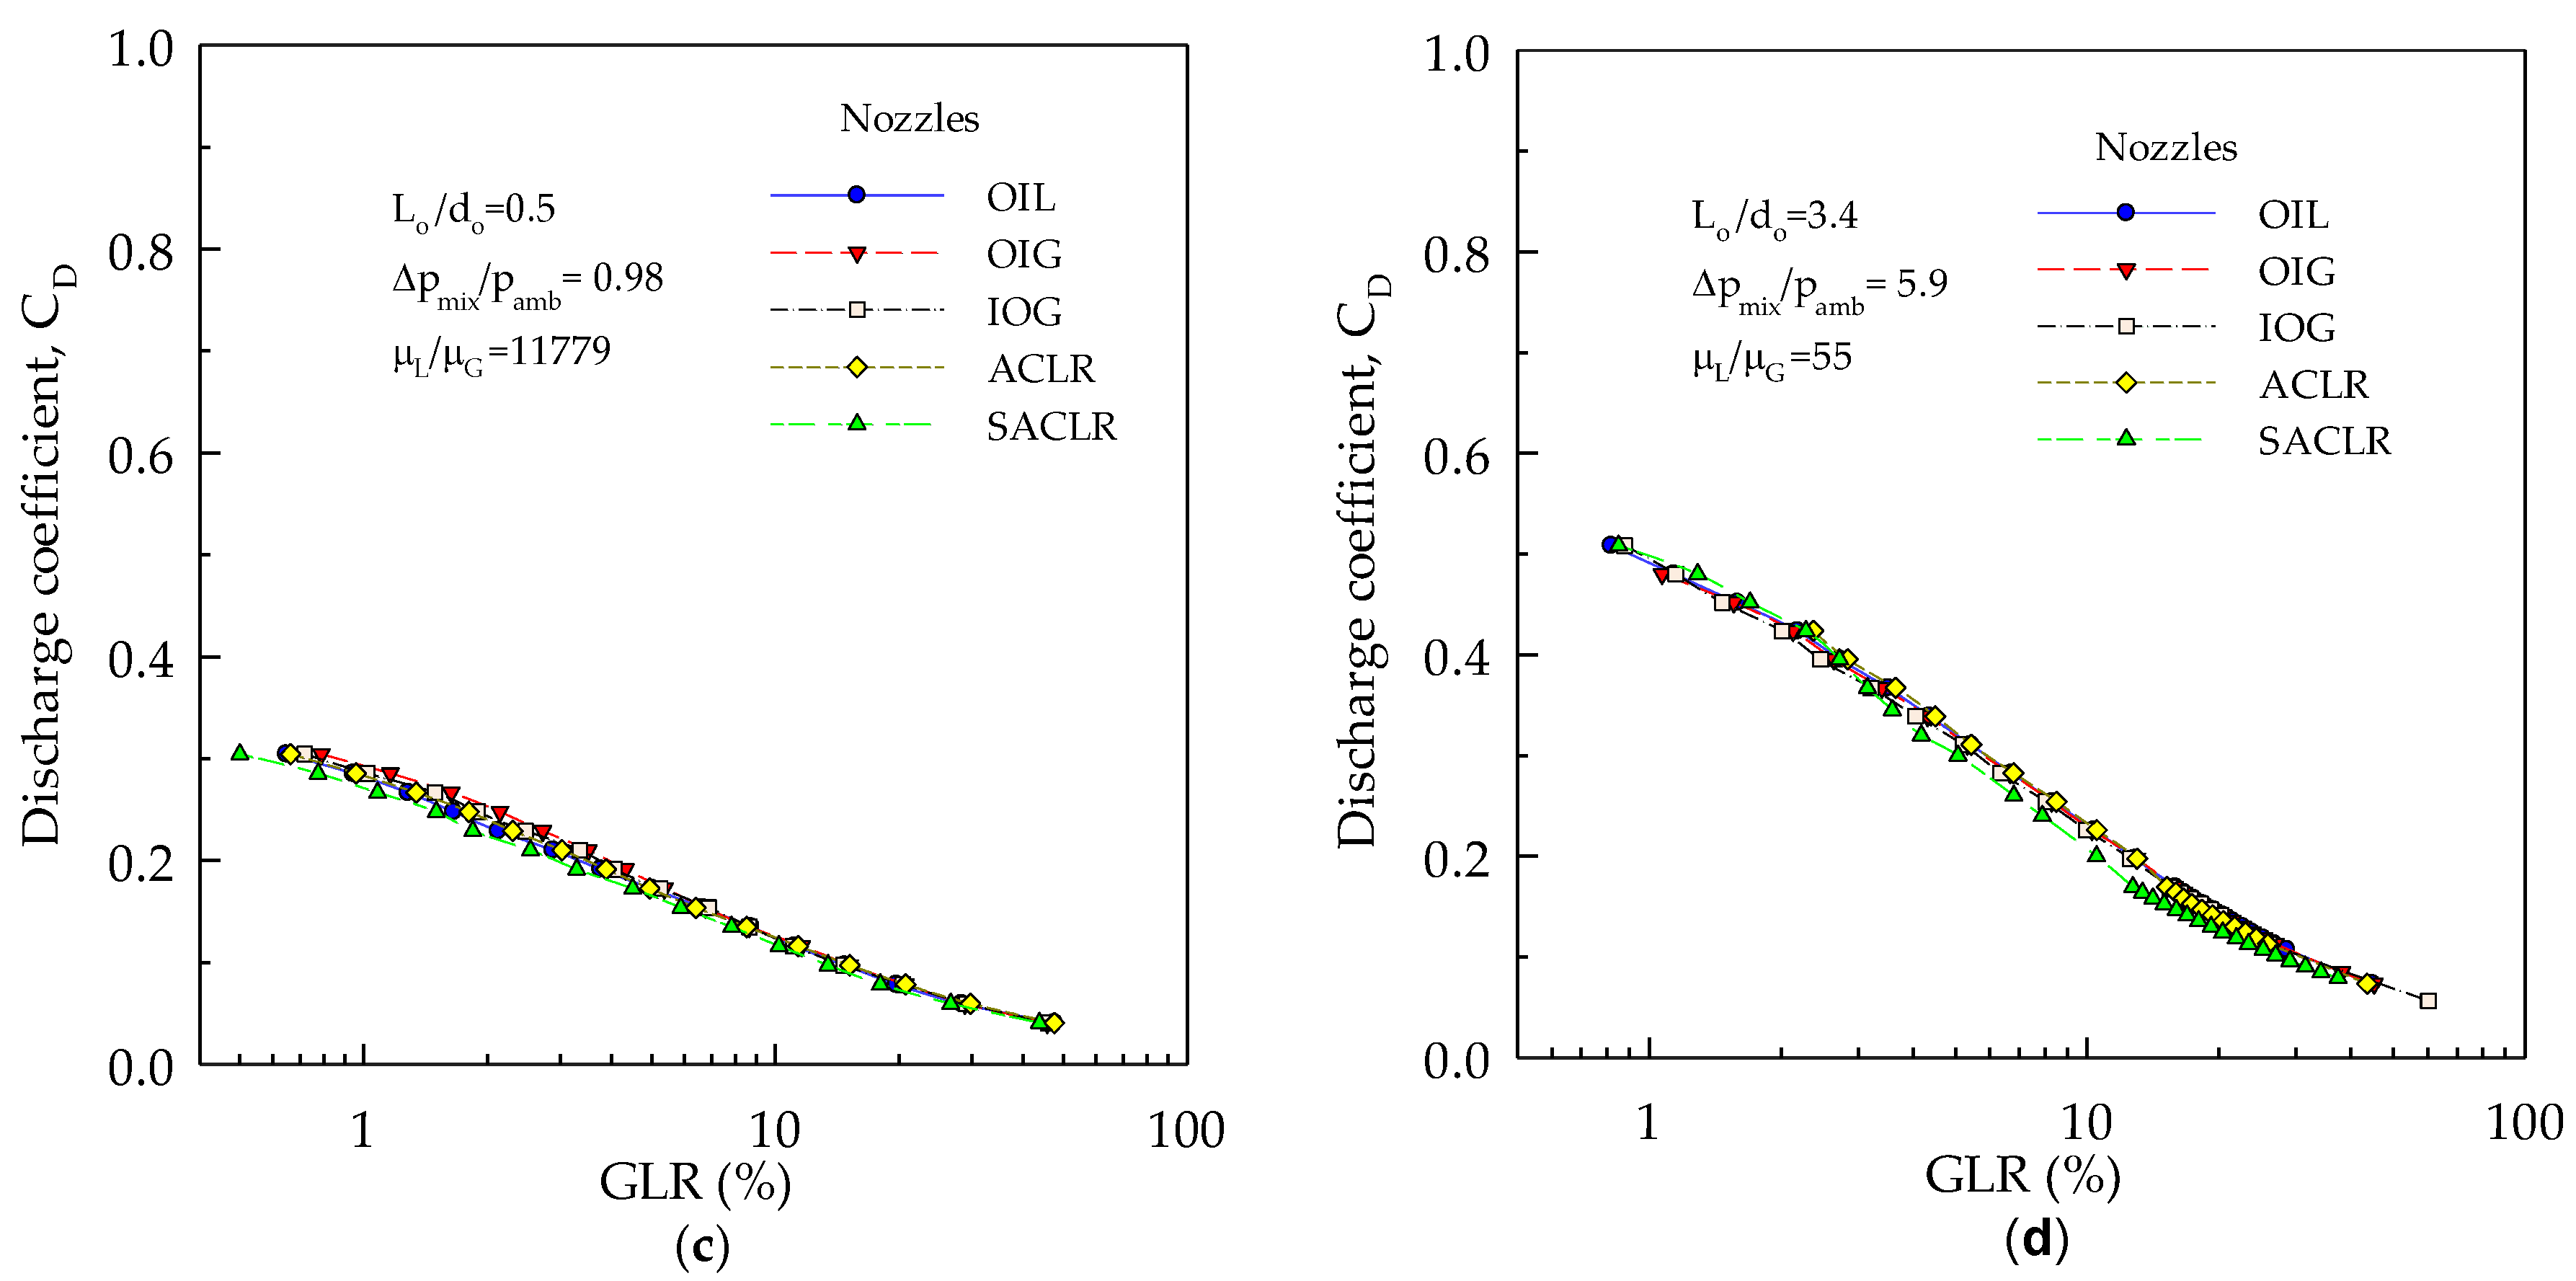
3.2. The Effect of the Inlet-Overpressure Ratio on CD

The effect of ∆pmix/pamb (pamb was constant in all the experiments, i.e., atmospheric pressure) on the CD of the OIL nozzle is shown in Figure 5. Figure 5a documents the notable effect of GLRs on CD at different ∆pmix/pamb, while the effect of the ∆pmix/pamb is shown in Figure 5b. Figure 5b shows that an increase in ∆pmix/pamb at constant GLRs results in the CD reduction to its minimum value, which occurred at ∆pmix/pamb = 0.98. Then CD increased for higher ∆pmix/pamb (i.e., > 0.98). Figure 6 illustrates the reasons for this non-monotonic phenomenon. Increasing the ∆pmix at a constant GLR causes a decrease in the gas volume flux at the exit orifice due to the high gas compressibility compared to liquids. As a result, the liquid mass flux (G) increases. G features a significant change at ∆pmix ≥ 0.1 MPa in comparison with its change at lower ∆pmix. According to the known relation CD ~ G/(∆pmix)0.5 [39], at ∆pmix < 0.1 MPa, the effect of the pressure increase is predominant and overcomes the effect of the G increase, so CD decreases; it is vice versa for ∆pmix > 0.1 MPa (see Figure 5b and Figure 6). Additionally, as aforementioned, Figure 5b shows that the increase in GLR suppresses the effect of ∆pmix/pamb on CD because of a decrease in the liquid amount. This phenomenon is of significant importance for IMTF atomizers; firstly, it is related to CD, which is important and an influential factor for atomizers. Secondly, this phenomenon occurs at regimes of low pressures and low GLRs (see Figure 5b), where the nozzles feature the highest atomization efficiency [56].
Additionally, we found that the other IMTF nozzles (OIG, IOG, ACLR, and SACLR) perform similarly with respect to the OIL nozzle (see Figure S2). It is worth mentioning that we observed this non-monotonic phenomenon in a wider range for the ∆pmix/pamb in this study than those in the literature (see Table 1). This finally explains and unifies the previous contradicting results by Chen and Lefebvre [26] and Ramamurthi et al. [39], who found that CD monotonically increased and decreased with the ∆pmix/pamb in narrower operation ranges, respectively. Lastly, results from ANOVA show that the influence of ∆pmix/pamb on CD is statistically significant and cannot be neglected (i.e., a p-value is equal to 1.88 × 10⁻¹⁰).

3.3. The Effect of Liquid Viscosity on CD

The effect of viscosity on the CD of the OIL nozzle is shown in Figure 7. CD decreases as the µLG increases at constant GLRs, as shown in the figures. This effect can be interpreted via the relation between CD and the Reynolds number for the liquid flow (ReL) (Equation (15)):
R e L = ρ L U L d o μ L
where UL is the cross-sectional average velocity of the liquid phase. CD depends on ReL in a linear manner [24,35,57], as confirmed in Figure 8a. The value of ReL drops with rising liquid viscosity at constant GLRs (Figure 8b). By increasing the liquid viscosity, the internal friction of the liquid increases, which leads to a decrease in the discharge velocity of the liquid as well as the suppression of the flow turbulence [58,59], and CD consequently decreases. The same effect on ReL was found with the increase in GLR (Figure 8b). The sensitivity of CD to the variation in µLG is high at low GLRs and it gradually decreases with increasing GLR; the increase of µLG from 55 to 11,779 results in a reduction in CD by 53.7% at GLR = 3.7%, while it is 44% at GLR = 45.8%.
The results of other IMTF nozzles show similar tendencies as the OIL nozzle (see Figure S3). Our findings on the viscosity effect are in good agreement with the results reported by Ochowiak [24] for the IOG nozzles, while they are inconsistent with those reported by Chen and Lefebvre [26] for the OIG type. Once more, ANOVA results show that the p-value of the effect of µLG on the CD is equal to 4.60 × 10⁻¹³, so this effect cannot be neglected.

3.4. The Effect of the Mixing Method on CD

As mentioned, the nozzle type outlines the mixing process. The influence of the mixing on CD is shown in Figure 9 at different conditions. It is clear in Figure 9a–d that the differences in the CD values are very small and may even approach zero. This finding was confirmed by ANOVA results that showed insignificant differences in CD values among different nozzles (i.e., p-value is greater than 0.15). Overall, the effect of the mixing method factor is negligible.
It is interesting that every nozzle type possesses its own internal flow pattern and characteristics, because the mixture formation and its character are strongly influenced by the mixing process [30,31], especially at low GLRs. The literature sources (see Table 4) show that the internal flow regime varies from one nozzle to another between bubbly, slug, intermittent, and annular. Shepard [60] found that the flow patterns can change during the residence time of the mixture inside the atomizer, so the regimes at the exit orifice can differ from those at the gas injection area. Our visualization results for the actual flow inside the exit orifice for the tested nozzles showed significant differences in the flow nature between nozzles.
Figure 10 shows the character of αi at the entrance of the exit orifice for the tested nozzles at the given condition (i.e., GLR = 1.2%, ∆pmix/pamb = 0.98, and µLG = 55). The variation in the character of αi between the tested atomizers is certainly related to the nature of the internal flow regime inside the mixing chamber. It is clear in Figure 10a–e that αi is not stable and features a different character for each nozzle, which means the internal flow regime inside each nozzle is quite different from the others. This also indicates that the internal flow of these nozzles is inherently unsteady, but with varying levels. Only the exit orifice for the OIL nozzle continuously possesses an annular flow, while the other nozzles possess different flow regimes.
The corresponding CVαi values for αi in Figure 10, while CD values and slip ratios for each nozzle are shown in Figure 11. Figure 11a shows that the CVαi features substantial differences between nozzles. In contrast, the differences in CD between nozzles were not significant (i.e., p-value is equal to 0.24). These results reveal that the CD of the IMTF nozzles is independent of the form of the internal flow regime.
It is worth mentioning that the CD prediction model based on the analytical physical models of two-phase discharge (i.e., homogeneous flow model (HFM) and separated flow model (SFM), which correspond to the two-phase flow discharge without slip between phases and the discharge with maximum slip, respectively) predict that the CD for the SFM should be higher than that for the HFM by three times [62]. The present experimental data show that there is no difference ( 0) in CD values for the nozzles that feature the highest and lowest slip ratio (i.e., SACLR and OIL, respectively) (see Figure 11a,b). Therefore, CD prediction models should not rely solely on the analytical models of two-phase discharge.
Additionally, a comparison between the inlet turbulence intensity (Tu1) values of the continuous single-phase flow entering the mixing chamber of all the atomizers is displayed in Figure 12. The gas represents continuous single phase for the OIL atomizer, while it is the liquid in the other configurations (OIG, IOG, ACLR, and SACLR), as shown in Figure 2. Tu1 can be calculated as follows [63,64]:
Tu = 0.16 ( R e ) ( 1 / 8 )
Figure 12 compares the differences in Tu1 among the tested nozzles. It suggests that the mixing process of the two phases, and consequently the nature of the produced two-phase mixture were possibly affected by the inlet conditions. The maximum difference in the Tu1 is about 7.4% and applies between the OIL atomizer (i.e., the highest Tu1) and the SACLR atomizer (i.e., the lowest Tu1). While the difference in the CD between the same atomizers (under the same operating condition) is only about 0.4%. It is implied that the CD values were negligibly affected by the differences in Tu1.
Finally, Table 4 indicates that the internal flow inside the ACLR was annular flow, while our visualization showed a different flow character. This may be due to the change in the ratio between exit orifice diameter and gas capillary diameter; it was about 0.2 and 1 in the present and previous study, respectively. We set these dimensions so as to test all the nozzles under the same operating conditions and exit orifice geometry. Additionally, it is interesting that the flow nature inside the exit orifice of the OIL nozzle was more stable than the other nozzles. This behavior gives an advantage to this type, given that this stability will be reflected in the quality of the spray. Thus, the OIL nozzle can be useful in applications that require a more stable spray with high quality (combustion, surface coating, and powder generation).

3.5. The Proposed CD Model and a Comparison with Published Models

Since the effect of the mixing method is negligible, a general CD prediction model can be developed for different IMTF nozzles. The non-linear least-squares regression technique was applied to the experimental data of CD for each nozzle, and it was found that the CD can be correlated as follows:
C D = 814 e ( 0.086 L o d o ) [ e ( 2.89 Δ p mix p amb ) + 0.496 ( Δ p mix p amb ) 0.161 ] ( μ L μ G + 11505 ) 1 e ( 0.51 GLR + 0.179 )
This general equation is valid for all the IMTF nozzles (i.e., internal-mixing types). Table 5 summarizes the values of the coefficient of determination (R2) and the sum of the squared residuals (SS). A comparison of the experimentally found CD with the CD predicted by Equation (17) for the OIL nozzle is shown in Figure 13, and the others (OIG, IOG, ACLR, and SACLR) are documented in Figure S4. The figures and the table confirm that the proposed CD model fits the experimental data for each mixing type very closely with R2 ≥ 0.99.
A comparison between the present model with the other models published for the OIG and IOG nozzles in Figure 14 shows that the CD predicted by the published models for both nozzles features a significant dispersion along the expected trend. This could be because of the neglection of some important factors in these equations, or because the ranges of the investigated factors are too narrow and inconsistent with present experiments (see Table 1), and/or because the effect of some factors is inconsistent with the findings of the present work. Note that the SFM (a = 0, b = 1) with polytropic expansion was selected during the calculations of Jedelsky’s model in Figure 14a.

4. Conclusions

In this paper, a detailed experimental study was carried out to investigate and analyze the effect of many factors upon the discharge coefficient of different types of internal-mixing twin-fluid atomizers. These factors mainly are the gas-to-liquid mass flow ratio, the inlet-overpressure ratio, the orifice length-to-diameter ratio, the internal mixing method of the two phases, and the liquid viscosity. Five different types of IMTF nozzles—OIL, OIG, IOG, ACLR, and SACLR—were tested under the same working conditions, liquid types, and exit orifice geometry. Additionally, the internal flow at the entrance of the exit orifice was visualized using a high-speed camera at a certain operating condition for each nozzle. Based on the results, the main conclusions are as follows:
  • The GLR, Lo/do, µLG, and ∆pmix/pamb have a significant effect on the CD of IMTF nozzles, while the effect of the mixing-method factor is negligible.
  • CD decreases with the increase of GLR, Lo/do, or µLG, and the same trend was observed with the increase of ∆pmix/pamb up to a value of 0.98, but CD increases with any further increase in ∆pmix/pamb.
  • The sensitivity of CD to changes in Lo/do, ∆pmix/pamb, or µLG is high at a low GLR but declines at a high GLR.
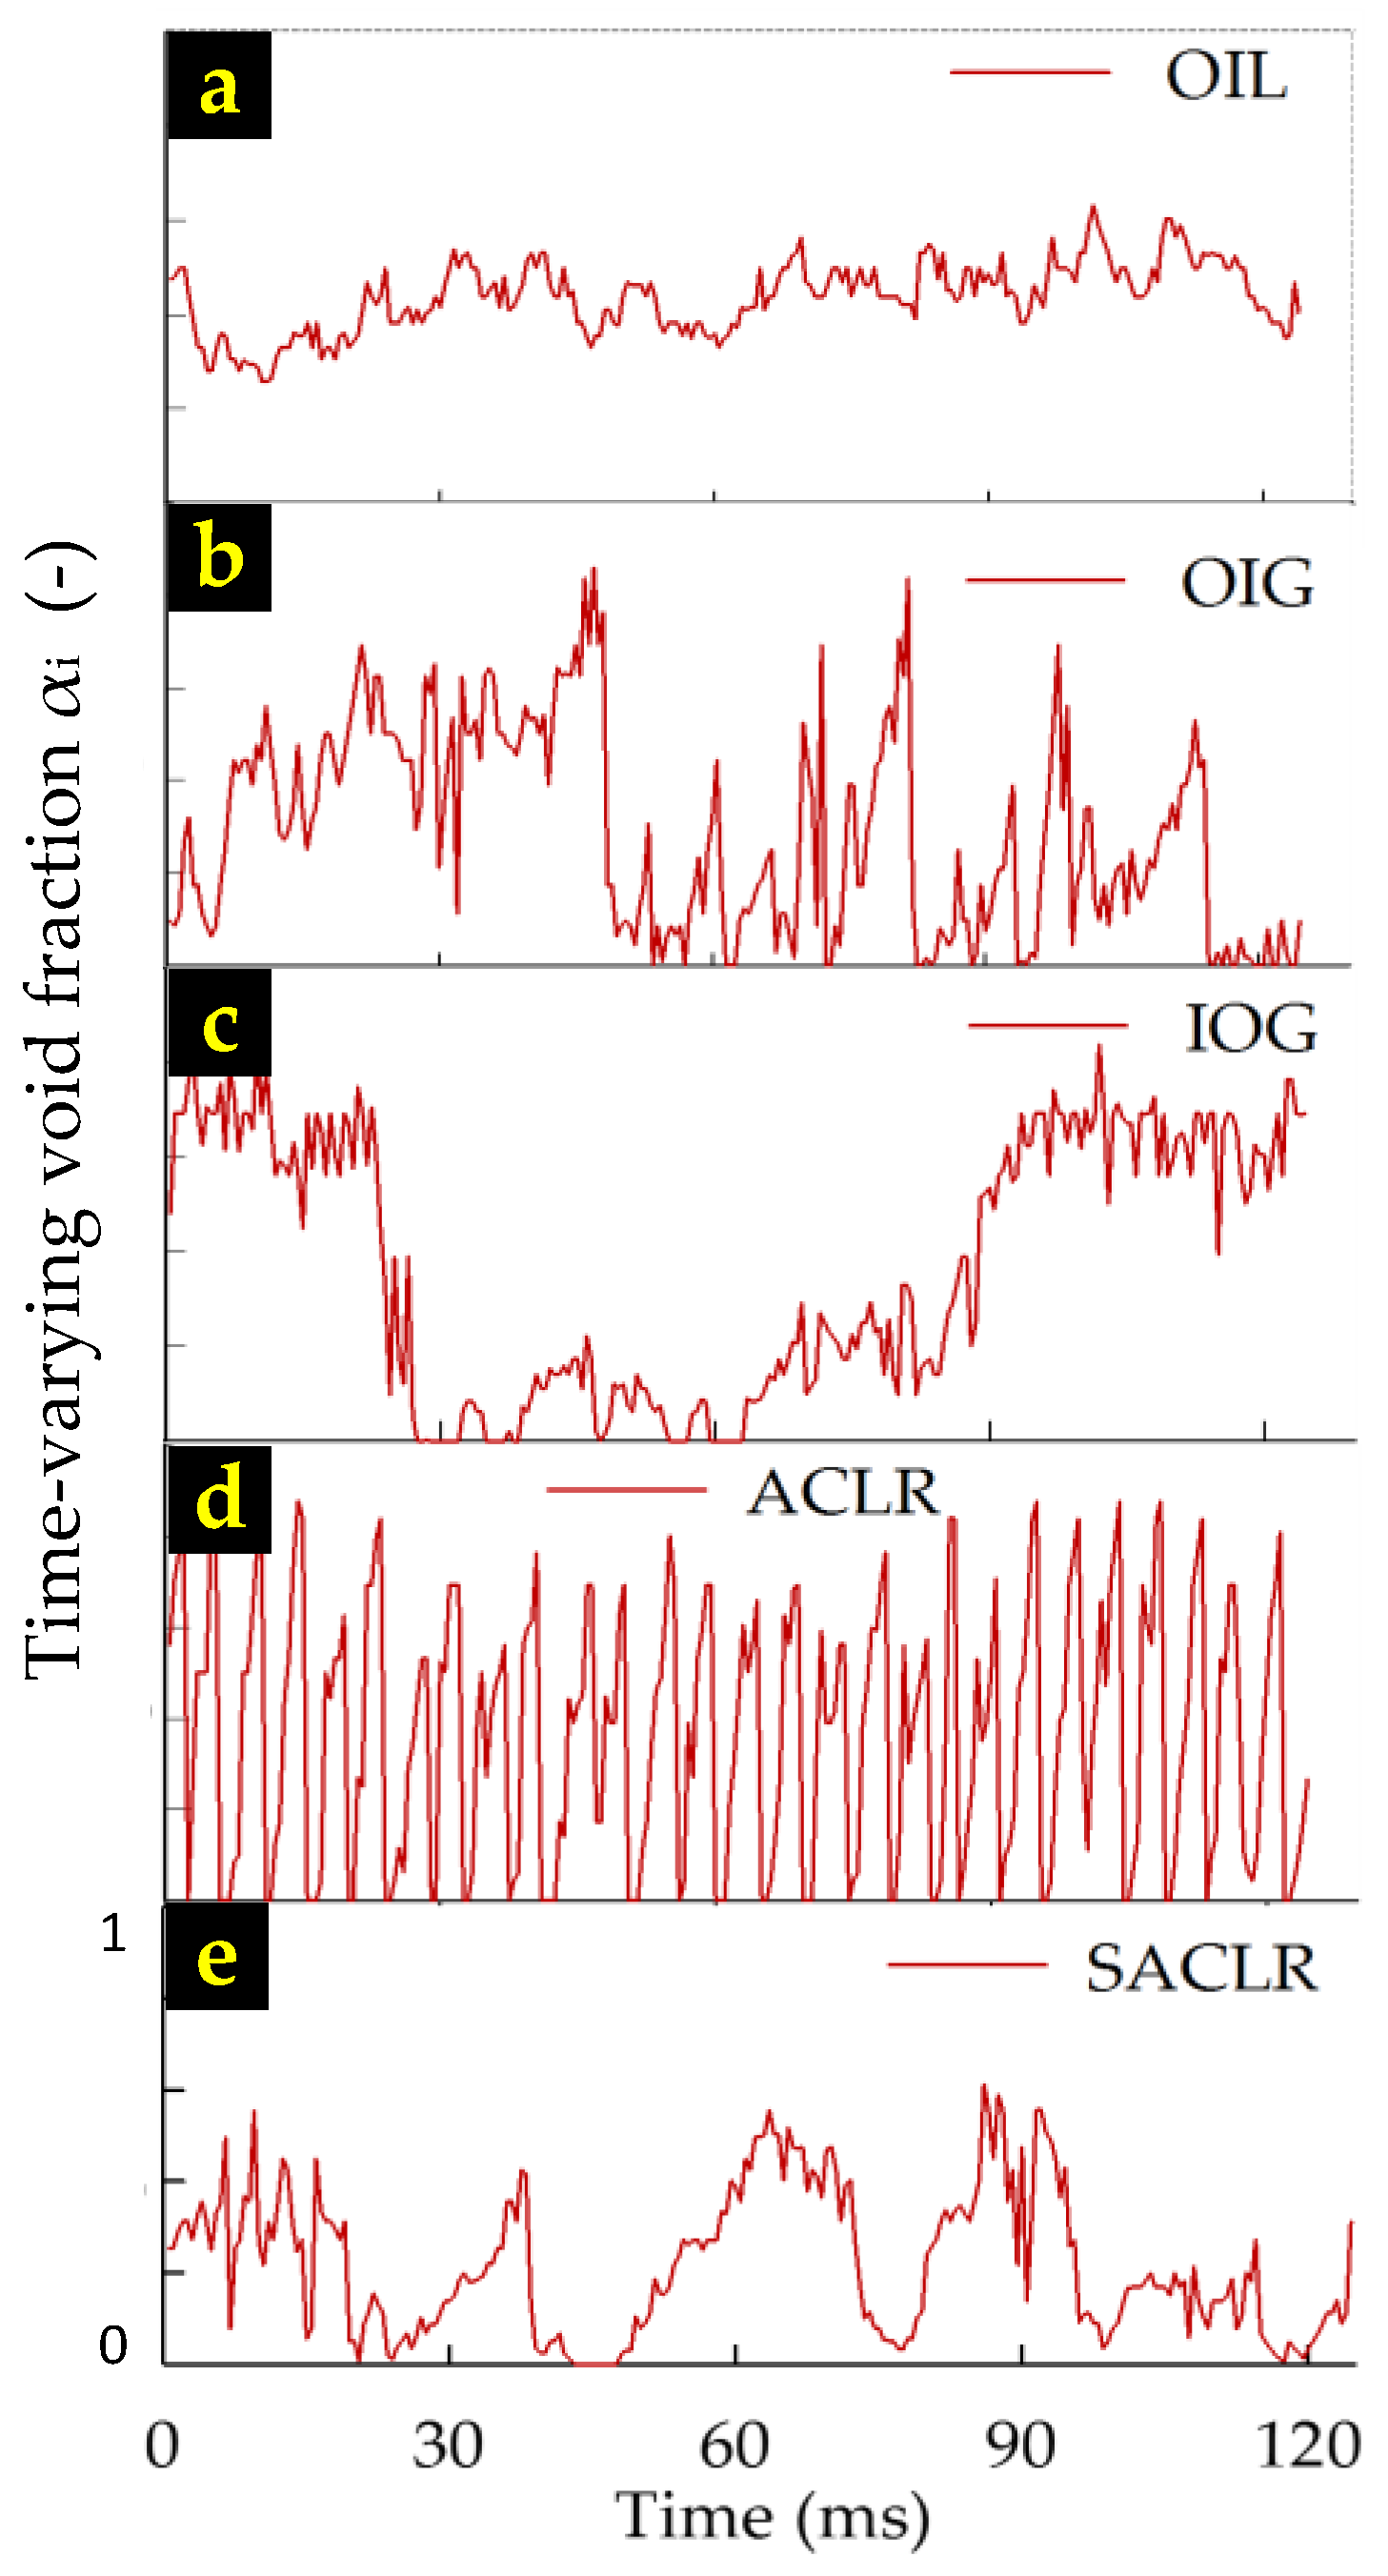
  • Flow visualization inside the exit orifice showed a diverse internal flow nature for each nozzle, which indicates that the CD of the IMTF nozzles is independent of the form of the internal flow regime at any given condition.
  • The internal flow inside the exit orifice of the tested IMTF nozzles is inherently unsteady, but with varying levels; the OIL nozzle features a more stable internal flow behavior than the other nozzles.
  • Finally, a general well-fitting CD prediction model (Equation (17)) with an R2 ≥ 0.99 was proposed, which is valid for any type of IMTF nozzle and with wider validity ranges for the included factors.

Supplementary Materials

The following are available online at https://www.mdpi.com/2227-9717/8/5/563/s1, Figure S1: Effect of GLR on CD at different Lo/do for different nozzles: (a) OIG; (b) IOG; (c) ACLR; and (d) SACLR, Figure S2: Effect of GLR on CD at different ∆pmix/pamb for different nozzles: (a) OIG; (b) IOG; (c) ACLR; and (d) SACLR, Figure S3: Effect of GLR on CD at varying µLG for different nozzles: (a) OIG; (b) IOG; (c) ACLR; and (d) SACLR, Figure S4: Comparison of the experimental and predicted CD from the present model Eq. (17) for different nozzles: (a) OIG, (b) IOG, (c) ACLR, and (d) SACLR, Table S1: A sample of operational conditions.

Author Contributions

Conceptualization, F.A.H., J.J., and T.W.; methodology, F.A.H., J.J., and K.S.; validation, F.A.H., K.S., J.J., and T.W.; investigation, F.A.H. and K.S.; writing—original draft preparation, F.A.H.; writing—review and editing, K.S., J.J., and T.W.; visualization, F.A.H.; supervision, T.W. All authors have read and agreed to the published version of the manuscript.

Funding

This research was supported by the National Natural Science Funds for Distinguished Young Scholar (No. 51525603), the National Natural Science Foundation of China (No. 51606134), and the project LTAIN19044 funded from the program INTER-EXCELLENCE by the Ministry of Education, Youth and Sports of the Czech Republic.

Conflicts of Interest

The authors declare no conflicts of interest.

References

  1. Lefebvre, A.H. A novel method of atomization with potential gas turbine applications. Def. Sci. J. 1988, 38, 353–361. [Google Scholar] [CrossRef]
  2. Wang, X.F.; Chin, J.S.; Lefebvre, A.H. Influence of gas-injector geometry on atomization performance of aerated-liquid nozzles. Int. J. Turbo Jet Engines 1989, 6, 271–280. [Google Scholar] [CrossRef]
  3. Roesler, T.C.; Lefebvre, A.H. Studies on aerated-liquid atomization. Int. J. Turbo Jet Engines 1989, 6, 221–230. [Google Scholar] [CrossRef]
  4. Gadgil, H.P.; Raghunandan, B.N. Some features of spray breakup in effervescent atomizers. Exp. Fluids 2011, 50, 329–338. [Google Scholar] [CrossRef]
  5. Sovani, S.D.; Sojka, P.E.; Lefebvre, A.H. Effervescent atomization. Prog. Energy Combust. Sci. 2001, 27, 483–521. [Google Scholar] [CrossRef]
  6. Sovani, S.D.; Crofts, J.D.; Sojka, P.E.; Gore, J.P.; Eckerle, W.A. Structure and steady-state spray performance of an effervescent diesel injector. Fuel 2005, 84, 1503–1514. [Google Scholar] [CrossRef]
  7. García, J.A.; Lozano, A.; Alconchel, J.; Calvo, E.; Barreras, F.; Santolaya, J.L. Atomization of glycerin with a twin-fluid swirl nozzle. Int. J. Multiph. Flow 2017, 92, 150–160. [Google Scholar] [CrossRef]
  8. Hájek, J.; Dohnal, M.; Vondál, J.; Broukal, J. Analysis of effervescent spray quality for oil-fired furnace application. Clean Technol. Environ. Policy 2015, 17, 1195–1205. [Google Scholar] [CrossRef]
  9. Zhou, Y.; Zhang, M.; Yu, J.; Zhu, X.; Peng, J. Experimental investigation and model improvement on the atomization performance of single-hole Y-jet nozzle with high liquid flow rate. Powder Technol. 2010, 199, 248–255. [Google Scholar] [CrossRef]
  10. Wittner, M.O.; Karbstein, H.P.; Gaukel, V. Spray performance and steadiness of an effervescent atomizer and an air-core-liquid-ring atomizer for application in spray drying processes of highly concentrated feeds. Chem. Eng. Process. Process. Intensif. 2018, 128, 96–102. [Google Scholar] [CrossRef]
  11. Kleinhans, A.; Georgieva, K.; Wagner, M.; Gaukel, V.; Schuchmann, H.P. On the characterization of spray unsteadiness and its influence on oil drop breakup during effervescent atomization. Chem. Eng. Process. Process. Intensif. 2016, 104, 212–218. [Google Scholar] [CrossRef]
  12. Stähle, P.; Schuchmann, H.P.; Gaukel, V. Performance and Efficiency of Pressure-Swirl and Twin-Fluid Nozzles Spraying Food Liquids with Varying Viscosity. J. Food Process. Eng. 2015, 40, 1–12. [Google Scholar] [CrossRef]
  13. Stähle, P.; Gaukel, V.; Schuchmann, H.P. Investigation on the Applicability of the Effervescent Atomizer in Spray Drying of Foods: Influence of Liquid Viscosity on Nozzle Internal Two-Phase Flow and Spray Characteristics. J. Food Process. Eng. 2014, 38, 474–487. [Google Scholar] [CrossRef]
  14. Schröder, J.; Günther, A.; Wirth, K.E.; Schuchmann, H.P.; Gaukel, V. Effervescent Atomization of Polyvinylpyrrolidone Solutions: Influence of Liquid Properties and Atomizer Geometry on Liquid Breakup and Spray Characteristics. At. Sprays 2013, 23, 1–23. [Google Scholar] [CrossRef]
  15. Schröder, J.; Kraus, S.; Rocha, B.B.; Gaukel, V.; Schuchmann, H.P. Characterization of gelatinized corn starch suspensions and resulting drop size distributions after effervescent atomization. J. Food Eng. 2011, 105, 656–662. [Google Scholar] [CrossRef]
  16. Ashgriz, N. Handbook of Atomization and Sprays: Theory and Applications; Springer: Berlin/Heidelberg, Germany, 2011; ISBN 9781441972637. [Google Scholar]
  17. Broniarz-Press, L.; Ochowiak, M.; Woziwodzki, S. Atomization of PEO aqueous solutions in effervescent atomizers. Int. J. Heat Fluid Flow 2010, 31, 651–658. [Google Scholar] [CrossRef]
  18. Li, S.; Li, W.; Liu, Y.; Ji, C.; Zhang, J. Experimental investigation of the performance and spray characteristics of a supersonic two-phase flow ejector with different structures. Energies 2020, 13, 1166. [Google Scholar] [CrossRef] [Green Version]
  19. Bar-kohany, T.; Rashkovan, A. Flash-boiling atomization. Prog. Energy Combust. Sci. 2008, 34, 417–439. [Google Scholar] [CrossRef]
  20. Holz, S.; Braun, S.; Chaussonnet, G.; Koch, R.; Bauer, H.J. Close nozzle spray characteristics of a prefilming airblast atomizer. Energies 2019, 12, 2835. [Google Scholar] [CrossRef] [Green Version]
  21. Hede, P.D.; Bach, P.; Jensen, A.D. Two-fluid spray atomisation and pneumatic nozzles for fluid bed coating/agglomeration purposes: A review. Chem. Eng. Sci. 2008, 63, 3821–3842. [Google Scholar] [CrossRef]
  22. Lefebvre, A.H.; McDonell, V.G. Atomization and Sprays; CRC Press, Taylor & Francis Group: Boca Raton, FL, USA, 2017; Volume 2, ISBN 0891166033. [Google Scholar]
  23. Mujumdar, A.S. Handbook of Industrial Drying; CRC Press: Boca Raton, FL, USA, 2006; ISBN 1574446681. [Google Scholar]
  24. Ochowiak, M. The experimental study on the viscosity effect on the discharge coefficient for effervescent atomizers. Exp. Therm. Fluid Sci. 2013, 50, 187–192. [Google Scholar] [CrossRef]
  25. Gong, J.S.; Fu, W.B. The experimental study on the flow characteristics for a swirling gas-liquid spray atomizer. Appl. Therm. Eng. 2007, 27, 2886–2892. [Google Scholar] [CrossRef]
  26. Chen, S.K.; Lefebvre, A.H. Discharge coefficients for plain-orifice effervescent atomizers. At. Sprays 1994, 4, 275–290. [Google Scholar]
  27. Maly, M.; Jedelsky, J.; Slama, J.; Janackova, L.; Sapik, M.; Wigley, G. Internal flow and air core dynamics in Simplex and Spill-return pressure-swirl atomizers. Int. J. Heat Mass Transf. 2018, 123, 805–814. [Google Scholar] [CrossRef] [Green Version]
  28. Jedelsky, J.; Jicha, M.; Slama, J.; Otahal, J. Development of an effervescent atomizer for industrial burners. Energy Fuels 2009, 23, 6121–6130. [Google Scholar] [CrossRef]
  29. Chin, J.S.; Lefebvre, A.H. A Design Procedure for Effervescent Atomizers. ASME J. Eng. Gas. Turbines Power 1995, 117, 226–271. [Google Scholar] [CrossRef]
  30. Mlkvik, M.; Stähle, P.; Schuchmann, H.P.; Gaukel, V.; Jedelsky, J.; Jicha, M. Twin-fluid atomization of viscous liquids: The effect of atomizer construction on breakup process, spray stability and droplet size. Int. J. Multiph. Flow 2015, 77, 19–31. [Google Scholar] [CrossRef] [Green Version]
  31. Zaremba, M.; Weiß, L.; Malý, M.; Wensing, M.; Jedelský, J.; Jícha, M. Low-pressure twin-fluid atomization: Effect of mixing process on spray formation. Int. J. Multiph. Flow 2017, 89, 277–289. [Google Scholar] [CrossRef] [Green Version]
  32. Liu, M.; Duan, Y.; Zhang, T. Evaluation of effervescent atomizer internal design on the spray unsteadiness using a phase/Doppler particle analyzer. Exp. Therm. Fluid Sci. 2010, 34, 657–665. [Google Scholar] [CrossRef]
  33. Liu, M.; Duan, Y.; Zhang, T.; Xu, Y. Evaluation of unsteadiness in effervescent sprays by analysis of droplet arrival statistics - The influence of fluids properties and atomizer internal design. Exp. Therm. Fluid Sci. 2011, 35, 190–198. [Google Scholar] [CrossRef]
  34. Stähle, P.; Gaukel, V.; Schuchmann, H.P. Comparison of an Effervescent Nozzle and a Proposed Air-Core-Liquid-Ring (ACLR) Nozzle for Atomization of Viscous Food Liquids at Low Air Consumption. J. Food Process. Eng. 2015, 40, e12268. [Google Scholar] [CrossRef] [Green Version]
  35. Ochowiak, M.; Broniarz-Press, L.; Rozanski, J. The discharge coefficient of effervescent atomizers. Exp. Therm. Fluid Sci. 2010, 34, 1316–1323. [Google Scholar] [CrossRef]
  36. Huang, X.; Wang, X.; Liao, G. Visualization of two phase flow inside an effervescent atomizer. J. Vis. 2008, 11, 299–308. [Google Scholar] [CrossRef]
  37. Wittner, M.O.; Ballesteros, M.A.; Link, F.J.; Karbstein, H.P.; Gaukel, V. Air-core-liquid-ring (ACLR) atomization part II: Influence of process parameters on the stability of internal liquid film thickness and resulting spray droplet sizes. Processes 2019, 7, 616. [Google Scholar] [CrossRef] [Green Version]
  38. Wittner, M.O.; Karbstein, H.P.; Gaukel, V. Air-core-liquid-ring (ACLR) atomization: Influences of gas pressure and atomizer scale up on atomization efficiency. Processes 2019, 7, 139. [Google Scholar] [CrossRef] [Green Version]
  39. Ramamurthi, K.; Sarkar, U.K.; Raghunandan, B.N. Performance characteristics of effervescent atomizer in different flow regimes. At. Sprays 2009, 19, 41–56. [Google Scholar] [CrossRef]
  40. Jedelsky, J.; Michalica, K. Calculation of Gas–Liquid Two-Phase Flow Discharge from Orificess. Available online: http://www.energetickeforum.cz/ext/2pf/discharge/ (accessed on 9 July 2015).
  41. Forsythe, W.E. Smithsonian Physical Tables, 9th ed.; Smithsonian Institution: Washington, DC, USA, 1956. [Google Scholar]
  42. Zaremba, M.; Kozák, J.; Malý, M.; Weiß, L.; Rudolf, P.; Jedelský, J.; Jícha, M. An experimental analysis of the spraying processes in improved design of effervescent atomizer. Int. J. Multiph. Flow 2018, 103, 1–15. [Google Scholar] [CrossRef] [Green Version]
  43. Takamura, K.; Fischer, H.; Morrow, N.R. Physical properties of aqueous glycerol solutions. J. Pet. Sci. Eng. 2012, 98–99, 50–60. [Google Scholar] [CrossRef]
  44. Holman, J.P. Experimental Methods for Engineers, 8th ed.; McGraw-Hill: New York, NY, USA, 2012. [Google Scholar]
  45. Ochowiak, M. Discharge coefficient of effervescent atomizers with the swirl motion phenomenon. Exp. Therm. Fluid Sci. 2016, 79, 44–51. [Google Scholar] [CrossRef]
  46. Konstantinov, D.; Marsh, R.; Bowen, P.J.; Crayford, A. Effervescent Atomization for Industrial Energy-Technology Review. At. Sprays 2010, 20, 525–552. [Google Scholar] [CrossRef]
  47. Mori, Y.; Hijikata, K.; Nagatani, T. Effect of dissolved gas on bubble nucleation. Int. J. Heat Mass Transf. 1976, 19, 1153–1159. [Google Scholar] [CrossRef]
  48. Forest, T.W.; Ward, C.A. Effect of a dissolved gas on the homogeneous nucleation pressure of a liquid. J. Chem. Phys. 1977, 66, 2322–2330. [Google Scholar] [CrossRef]
  49. Forest, T.W.; Ward, C.A. Homogeneous nucleation of bubbles in solutions at pressures above the vapor pressure of the pure liquid. J. Chem. Phys. 1978, 69, 2221–2230. [Google Scholar] [CrossRef]
  50. Montgomery, D.C. Design and Analysis of Experiments, 8th ed.; Wiley: New York, NY, USA, 2013; ISBN 978-1118-14692-7. [Google Scholar]
  51. Sun, C.; Ning, Z.; Qiao, X.; Lv, M.; Li, Y.; Zhao, J.; Wang, X. Study on effervescent spray morphology based on internal gas-liquid two-phase flow patterns. Eur. J. Mech. B/Fluids 2019, 74, 123–138. [Google Scholar] [CrossRef]
  52. Stähle, P.; Gaukel, V.; Schuchmann, H.P. Influence of feed viscosity on the two-phase flow inside the exit orifice of an effervescent atomizer and on resulting spray characteristics. Food Res. Int. 2015, 77, 55–62. [Google Scholar] [CrossRef]
  53. Hong, M.; Jeon, J.; Lee, S.Y. Discharge Coefficient of Pressure-Swirl Atomizers with Low Nozzle Opening Coefficients. J. Propuls. Power 2012, 28, 1–5. [Google Scholar] [CrossRef]
  54. Ohrn, T.R.; Senser, D.W.; Lefebvre, A.H. Geometrical Effects on Discharge Coefficients for Plain-Orifice Atomizers. At. Sprays 1991, 1, 137–153. [Google Scholar] [CrossRef]
  55. Maly, M.; Sapik, M.; Cejpek, O.; Wigley, G.; Katolicky, J.; Jedelsky, J. Effect of spill orifice geometry on spray and control characteristics of spill-return pressure-swirl atomizers. Exp. Therm. Fluid Sci. 2019, 106, 159–170. [Google Scholar] [CrossRef]
  56. Jedelsky, J.; Jicha, M. Energy conversion during effervescent atomization. Fuel 2013, 111, 836–844. [Google Scholar] [CrossRef] [Green Version]
  57. Catlin, C.A.; Swithenbank, J. Physical processes influencing effervescent atomizer performance in the slug and annular flow regimes. At. Sprays 2001, 11, 575–595. [Google Scholar]
  58. Essien, S.; Archibong-Eso, A.; Lao, L. Discharge coefficient of high viscosity liquids through nozzles. Exp. Therm. Fluid Sci. 2019, 103, 1–8. [Google Scholar] [CrossRef]
  59. Woziwodzki, S.; Broniarz-Press, L.; Ochowiak, M. Transitional Mixing of Shear-Thinning Fluids in Vessels with Multiple Impellers. Chem. Eng. Technol. 2010, 33, 1099–1106. [Google Scholar] [CrossRef]
  60. Shepard, T.G. Bubble Size Effect on Effervescent Atomization. Ph.D. Thesis. 2011. Available online: https://conservancy.umn.edu/handle/11299/113573 (accessed on 9 May 2020).
  61. Jobehdar, M.H.; Siddiqui, K.; Gadallah, A.H.; Chishty, W.A. Effect of single-and multi-hole bubble breakers on the effervescent atomization process. At. Sprays 2016, 26, 135–162. [Google Scholar] [CrossRef]
  62. Jedelsky, J.; Jicha, M. Prediction of Discharge Coefficient of Internally-Mixed Twin-Fluid Atomizers. In Proceedings of the 24th European Conference on Liquid Atomization and Spray Systems ILASS-Europe, Lisbon/Estoril, Portugal, 5 September 2011; pp. 1–4. [Google Scholar]
  63. Rouina, S.; Ravelli, S.; Barigozzi, G. Combined experimental and CFD investigation of flat plate film cooling through fan shaped holes. Int. J. Turbomach. Propuls. Power 2019, 4, 7. [Google Scholar] [CrossRef] [Green Version]
  64. Barigozzi, G.; Mosconi, S.; Perdichizzi, A.; Ravelli, S. The effect of hot streaks on a high pressure turbine vane cascade with showerhead film cooling. Int. J. Turbomach. Propuls. Power 2017, 2, 15. [Google Scholar] [CrossRef] [Green Version]
Figure 1. Schematic diagram of the fluid supply setup.
Processes 08 00563 g001
Figure 2. The geometry of the tested internal-mixing twin-fluid (IMTF) nozzles with their main dimensions in mm: (a) outside-in-gas (OIG); (b) outside-in-liquid (OIL); (c) inside-out-gas (IOG); (d) air-core-liquid-ring (ACLR); (e) swirling-air-core-liquid-ring (SACLR).
Processes 08 00563 g002
Figure 3. Processing procedure for determining the gas core diameter at the entrance of the exit orifice.
Processes 08 00563 g003
Figure 4. The effect of (a) GLR on CD at different orifice configurations and of (b) Lo/do on CD at different GLRs.
Processes 08 00563 g004
Figure 5. The effect of (a) GLR on CD at different ∆pmix/pamb values and of (b) ∆pmix/pamb on CD at different GLRs.
Processes 08 00563 g005
Figure 6. The effect of ∆pmix on the mass and volume fluxes at a constant GLR for the OIG nozzle.
Processes 08 00563 g006
Figure 7. The effect of (a) GLR on CD at different µLG and of (b) µLG on CD at different GLRs.
Processes 08 00563 g007
Figure 8. (a) The relation between ReL and CD; (b) the relation between µLG and ReL at different GLRs.
Processes 08 00563 g008
Figure 9. The effect of the mixing method on CD at different conditions: (a) low values of all parameters; (b) high Lo/do value; (c) high µLG value; (d) high values of ∆pmix/pamb and Lo/do.
Processes 08 00563 g009aProcesses 08 00563 g009b
Figure 10. Effect of the nozzle type (i.e. (a) OIL; (b) OIG; (c) IOG; (d) ACLR; and (e) SACLR) on the time-varying void fraction (αi) inside the exit orifice of each nozzle under the operating condition of GLR = 1.2%, ∆pmix/pamb = 0.98, and µLG = 55.
Processes 08 00563 g010
Figure 11. (a) Variation coefficient of gas void fraction and CD; (b) slip ratio of the flow inside the exit orifice for the tested nozzles: at GLR = 1.2%, ∆pmix/pamb = 0.98, µLG = 55.
Processes 08 00563 g011
Figure 12. The inlet turbulence intensity (Tu1) for the continuous single phase entering the mixing chamber for the tested atomizers at the condition of GLR = 1.2%, ∆pmix/pamb = 0.98, and µLG = 55.
Processes 08 00563 g012
Figure 13. Comparison of the experimental and predicted CD from the present model in Equation (17) for the OIL nozzle.
Processes 08 00563 g013
Figure 14. Comparison of the experiments and published models for (a) the OIG nozzle and (b) the IOG nozzle.
Processes 08 00563 g014
Table 1. Summary of the published discharge coefficient (CD) equations.
Ref.Varied Factors
Nozzle GeometryWorking ConditionsPhysical Properties
Typedo (mm)do/Dmix(–)Lo/do (–)GLR (%)∆pmix/pamb(–)µL (kg/m∙s)
[26]OIG1.2–20.19–0.30.51–121.36–2.040.001–0.1
[39]OIG2.5–40.31–0.50.50.5–201.48–2.960.001
[28]OIG2.50.45–0.180.282–100.99–4.90.0185
[35]IOG1.7–4.90.09–0.250.3–0.882–46N/C 10.001
[24]IOG2.70.14N/M 21.4–57N/M0.001–0.182
Conclusions
Ref.Proposed ModelNotes
[26] C D = c ( 1 Q G · Q G · + Q L · ) 0.3 ( 1 + 1 GLR ) 0.15 - c is a constant, depends on the liquid properties, and is equal to 0.385 for water. CD decreases with increasing gas-to-liquid ratio (GLR), while its value increases when the inlet-overpressure increases. The effect of viscosity is negligible.
[39] C D = 0.3 0.0002 [ GLR × R e 0.5 ] - For horizontal flow. This model is valid for 2000 < Re < 20,000, with a coefficient of determination (R2) of 0.982. The inlet-overpressure has a small effect on CD; increasing the gas pressure leads to decrease the CD.
[28] C D = 0.62 ( μ L μ w ) 0.04 ( σ L σ w ) 0.02 × ( L o d o × sin ( 2 β ) 0.5 ) 0.11 × G ( 2 ρ L Δ p ) ( 1 1 + GLR ) - The terms that reflect the effect of physical properties were adopted from Chin and Lefebvre [29]. G can be obtained by combining two models (the homogeneous flow model (HFM) and the separated flow model (SFM)) of two-phase discharge, which can be obtained via the online multiphase flow calculator [40]. CD increases when liquid viscosity, surface tension, or GLR increases, while it is vice versa for the orifice length-to-diameter ratio.
[35] C D = 0.0088 ( GLR × d o D mix ) 0.75 ± 14 % - The atomizer construction shows a strong effect on CD, in which CD increases when the orifice diameter do decreases.
[24] C D = 0.0361 ( μ L μ w ) 0.0475 × GLR 0.8 - CD decreases with increasing liquid viscosity or GLR. In addition, CD is affected by the flow character and the atomization mechanism.
1 N/C: not constant; the mixing chamber pressure changes with gas–liquid ratio. 2 N/M: not mentioned. Abbreviations: OIG: outside-in-gas; IOG: inside-out-gas.
Table 2. Rheological properties: density (ρ), viscosity (µ), surface tension (σ), and the corresponding uncertainty values ur (γ) of the tested aqueous glycerol solutions at 20 °C.
MixtureGlycerol (wt%)ρ (kg/m3)ur (ρ) (%)µ (Pa∙s)ur (µ) (%)σ (kg/s2)ur (σ) (%)
M10998.2-a0.001-a0.0731-a
M270119010.02414.680.0679-a
M380121610.06978.910.0672-a
M490124110.21327.730.0665-a
Properties of the air at 20 °C.
Air 1.231.81 ×10−5
-a: values were taken from the literature [7,41,42,43].
Table 3. The tested exit orifices geometry: exit orifice diameter (do) and length (Lo).
No.do
(mm)
Lo
(mm)
β
(°)
Lo/do
(–)
10.850.4245 0.5
20.850.77450.9
30.851.4645 1.7
40.852.245 2.6
50.852.89453.4
60.853.57454.2
Table 4. Summary of the internal flow pattern of the tested IMTF nozzles from the literature.
Author/sNozzle TypeInvestigationResults of Internal Flow Pattern
TypeRegion
Stähle et al.
[13]
OIGVisualizationMixing chamberBubbly flow (GLR <2%)
Intermittent (2% < GLR < 10%)
Annular flow (GLR ≥10%)
Zaremba et al.
[31]
OILTheoreticallyMixing chamberAnnular flow at any operation condition
Jobehdar et al.
[61]
IOGVisualizationMixing chamberBubbly flow (GLR ≤0.1%)
Slug flow (GLR = 0.7%)
Annular (GLR >2.2%)
Stähle et al.
[34]
ACLRVisualizationContraction zone and exit orifice.Annular flow at any operation condition
Table 5. Values of R2 and sum of the squared residuals (SS) for the tested IMTF nozzles in Equation (17).
NozzleR2 (–)SS (–)
OIL0.9920.064
OIG0.9940.049
IOG0.9900.069
ACLR0.9910.090
SACLR0.9910.070

