Understanding the Effect of Granulation and Milling Process Parameters on the Quality Attributes of Milled Granules


Department of Chemical and Biochemical Engineering, Rutgers, The State University of New Jersey, Piscataway, NJ 08854, USA
*
Author to whom correspondence should be addressed.
Processes 2020, 8(6), 683; https://doi.org/10.3390/pr8060683
Submission received: 30 April 2020
/
Revised: 27 May 2020
/
Accepted: 5 June 2020
/
Published: 10 June 2020
(This article belongs to the Section Chemical Processes and Systems)
Abstract
:Milling is an essential unit operation used for particle size reduction in solid oral dosage manufacturing. The breakage of particles in a comil is due to the intense shear applied on the particles between impeller and the screen. Breakage also occurs due to the impact from a rotating impeller. Particles exit the mill based on their size relative to the aperture size of the screen bores. This study was set up to understand the working of the comil better. A new CPP (Critical Process Parameter), in the form of batch loading was identified. It was found that there are two different regimes (quasi static regime and impact regime) in which a comil generally operates, and the effect of the CPP’s (batch loading and impeller speed) on these regimes was studied. Knowledge of the effect of upstream operations on a particular unit operation is of significant importance, especially for pharmaceutical industry. For this reason, the effect of granulation variables such as liquid-to-solid ratio, granulator impeller speed and the amount of binder in the formulation were analyzed. Milled particle size distribution and other critical quality attributes such as bulk density, friability, and porosity were studied. Batch loading and the interaction effect of batch loading with impeller speed are significant parameters that affect the quality attributes of the mill. Predictive regression models were developed for throughput of the mill, milled product bulk density and milled product tapped density (with an R2 of 0.987, 0.953, 0.995 respectively) to enable their use in downstream process modeling.
1. Introduction
Milling is an important unit operation common to many industries such as mining, food processing and pharmaceuticals. Within the pharmaceutical industry, milling is used to delump cohesive materials prior to the blending/mixing of these raw materials and is also used as a post-granulation particle design process to ensure that oversized granules are broken into smaller sized granules that conform to product size specifications. This study will focus on post-granulation milling, whereby particles/granules are broken down into smaller sized fragments via breakage mechanisms. Breakage in mills occurs primarily due to collisions between particle and particle, and collisions between particle and equipment. Breakage can also occur due to shear imparted by the equipment on particles [1].
Granulation is an important process that is required in drug product manufacturing in order to alleviate issues related to powder handling and flow. Granulation allows improvement in flowability of the material and minimizes segregation. However, granulation may produce particles with undesirable size distributions (i.e., oversized or undersized). This may negate the positive effect of minimizing segregation and affect subsequent downstream processing such tablet compaction and important tablet properties (e.g., content uniformity, bulk density). An excess amount of fines can lead to poor granule flow and weight variability, while excessive large particles may lead to tablets with pitted surfaces and tablets with poor strength [2]. In addition, the particle size distribution also impacts drug bioavailability [3]. Hence, an understanding of the effect of milling design and operation is critical. High shear wet granulation, one of the most common batch wet granulation techniques, has been used in this study to produce granules. It has been reported in many studies that liquid-to-solid ratio, wet-massing time and impeller speed are the main parameters which affect the particle size distribution of the granules [4,5].
In this study, we consider a conical mill (Comil), which is a common type of mill that can be used for both de-lumping and size reduction. In this work, we mainly focus on size reduction. Size reduction in a Comil is due to the shear action between the impeller, screen and impact energy imparted by the impeller. The Comil can be run in batch as well as in continuous mode [6].
The size of the mill screen (a conical shaped vessel with holes drilled into the mill) was reported to be the most important parameter affecting the particle size of the milled granules [7]. Others have reported that mill variables (impeller speed and screen size) have to be studied and varied together as there is a statistical interdependence between its parameters [8]. It was investigated that the type of the screen plays an important role in the amounts of fines generated. It has also been reported that the usage of grater screen leads to a lower residence time compared to round holed screens, thereby lowering the amounts of fines generated [9]. Similarly, it has also been reported [4] that a careful combination of grater screen and impeller type has to be employed for the minimization of fines. A study on the effect of material properties and mill settings on PSD (Particle Size Distribution) in a conical screen mill concluded that the screen size was the main parameter affecting the particle size [10]. A smaller hole size leads to increased residence time thereby resulting in finer particle sizes. To investigate the effect of material properties, different amounts of Hydroxypropyl Cellulose (HPC) and different grades of Lactose were used. Post impact behavior of the particles was explained by the theory of crack branching [11]. This theory primarily divides the breakage pattern of agglomerates via single impact into two main types: (1) localized damage only, with shattering of particles into fine debris at the impact zone; (2) both localized damage and fragmentation, i.e., local disintegration resulting in large fragments, due to crack propagation from the impact region.
Motivation and Objectives
The mill process has been studied over the past few years, but one of the aspects that was only partially understood was the effect of batch loading on the particle size and other quality attributes of milled granules. The present work aims to gain insight on the effect of batch loading and the effect of impeller speed of the mill on the particle size of milled granules. The effect of screen type has also been investigated in this work. Apart from the mill processing parameters, other parameters that can affect the output of a mill are the input material properties. Material properties such as particle size of input batch, hardness, etc., can play a significant role in critical quality attributes of the output granules. This work aims to characterize the effect of granulation parameters on milling by analyzing the effect of granulation impeller speed and L/S ratio on the milled granules. Apart from these parameters, one more important aspect that alters the properties of granules is its formulation. Hence, the effect of binder addition on CQA’s (Critical Quality Attributes) of milled granules was studied using Polyvinylpyrrolidone (PVP, K-30 grade) as the binder. Most of the research on milling focuses on PSD of milled granules as the quantification metric to assert the performance of the mill. In this study, the effect of milling on bulk density, tapped density, friability and porosity of granules has been quantified using analysis of variance (ANOVA).
2. Materials and Methods
2.1. Materials
The formulation used in this study consisted of anhydrous caffeine as model drug (8%, CSPC Innovation Pharmaceutical Co. Ltd., Hebei, China), microcrystalline cellulose (46%, MCC, Avicel® PH101, FMC Biopolymer, Philadelphia, PA, USA) and α-lactose Monohydrate (46%, 310 NF, Foremost Farms USA, Baraboo, WI, USA). For the study of the effect of binder addition, polyvinylpyrrolidone (PVP K30, Fisher Scientific, Pittsburgh, PA, USA) was added to the formulation by replacing Avicel PH 101 and Lactose Monohydrate in equal parts (percentage wise). Distilled water was used as the binder liquid (for granulation) and was dripped into the granulator.
2.2. Methods
The above-mentioned formulation (Avicel PH 101-3 kgs, Lactose Monohydrate-3 kgs, Caffeine-521.7 g) was blended in a tote blender (Glatt tumble tote blender) for 30 min. Then these pre-blended powders were granulated in a 2.4 L batch granulator (Key-International table-top high shear granulator) at pre-determined granulator settings with a batch size of 300 g. These granules were then air dried for 48 h prior to milling in a conical screen mill (Quadro 197-R) at predetermined conditions.
For the first part of the study, the batch loading of the mill and the impeller speed of the mill were varied at three levels and a full factorial study was performed. The operational range of impeller speed for the Comil (Quadro 197-R) varied from 1300–4300 rpm. The three levels of rpm were chosen based on the operating range of the Comil. Additionally, at higher impeller speeds, there is a lot of dust generated, because of which 3000 rpm was chosen as the highest level. Batch loading fed to the mill can also be viewed as the fill level of the mill (which can be translated as a steady state holdup in continuous operation). To study this effect, we chose a batch size at three different levels, 1000 g corresponds to complete choking of the mill, 300 g corresponds to a level lower than the 50% full and 600 g corresponds to approximately 70–75% fill level. For this part of the study, the granulation parameters were kept constant. For each run, samples were collected and analyzed at 30 s, 60 s, 90 s and at the end of mill cycle (5 min). Details of these experiments are described in Table 1.
Impeller speed of the granulator, liquid-to-solid ratio and percentage binder in the formulation were varied at three levels in the second part of this study, to understand the effect of granulation parameters on milling performance and milled granule properties. For this set of experiments the mill operating parameters (mill impeller speed, batch loading, mill run time and mill screen size) were kept constant. The mill impeller speed was set at 3000 rpm, the batch loading was kept constant at 550 g and the mill-run time was fixed at 30 s. For all the above-mentioned experiments the mill screen size was kept constant at 991 μm, and a square type impeller blade was used for all the experiments. Similarly, for all the experiments, the chopper speed and wet massing time in the granulator were kept constant at 6000 rpm and 3 min, respectively. It was found that very high impeller speeds increased agglomeration, leading to the formation of very large granules [12]. Therefore, in this study, low to medium impeller speeds of 150 to 190 rpm were chosen. The details for this part of the study are shown in Table 2.
2.3. Particle Size Distribution
For the purpose of this study, sieve analysis as size classification was chosen, as the granules formed were large and out of the measuring range of image-based methods such as Laser Diffraction. The sieve analysis was conducted using Endecotts Octagon 2000 Sieve shaker. For the analysis of the granulated product, the sieves were divided into sets of coarse and fine, depending on the aperture size of the screen. Each analysis was performed for 15 min at an amplitude of 7 (2.38 mm). The coarse analysis consists of sieve screen sizes ranging from 4000 μm (#5), 2800 μm (#7), 2000 μm (#10), 1400 μm (#14), 1000 μm (#18) and 850 μm (#20), pan1 (<850 μm). The fine analysis consisted of sieve screen sizes ranging from 710 μm (#25), 500 μm (#35), 355 μm (#45), 250 μm (#60), 150 μm (#100), 90 μm (#170), 63 μm (#230), pan2 (<63 μm). For the milled product, only one analysis was carried out using the sieve screen sizes starting from 850 μm (#20). This analysis was carried out for 20 min using an amplitude of 8 (2.72 mm). The granule mass collected on each mesh was recorded and used to develop a granule size distribution based on mass. This weighted distribution was used to identify d50, d90, d10, span and %fines of the powders. For the purpose of this study d10, d50 and d90 are calculated based on their weight.
2.4. Bulk and Tapped Density
The bulk density of a powder was determined by measuring the volume of a known weight of powder sample in a graduated cylinder [13]. The tapped density was measured using a Quantachrome tapped density analyzer. After observing the initial powder volume and weight for the bulk density measurement, the measuring cylinder was mechanically tapped to 10, 500 and 1250 taps; volume readings corresponding to each of these tapped volumes, V10, V500, V1250, were noted down. The tapping was stopped if the difference between V500 and V1250 was less than or equal to 2 mL. If the difference was greater than 2 mL the tapping was continued in increments of 1250 taps until the difference between two successive volumes was less than or equal 2 mL [13].
2.5. Friability
Granule Friability was measured using a Pharma Test Auto-Friability Tester-PTF E/ER. A special drum was used to load the sample for testing the friability of granules. In this method, prior to experimentation, approximately 10 g (Iwt) of sample is conditioned to remove the fines. For friability purposes, fines are defined as particles that have particle size lower than 150 μm screen size. The conditioned sample was then subjected to mechanical stress using a friabilator at 25 rpm for 10 min along with 200 glass beads (mean diameter 4 mm). Mechanical stress on the powder particles/granules is due to both the collisions with glass beads and collisions with the equipment (similar to a ball mill operation). After the glass beads were removed, the weight retained on the 150 μm screen was determined (Fwt) [14]. Then, the friability of the sample was calculated as shown in Equation (1).
Friability = ((Iwt − Fwt) ÷ Iwt) × 100%
2.6. Porosity
Porosity was measured using Accupyc II 1340 and Geopyc 1360 (Micromeritics). True Density (ρt) was measured using Accupyc II 1340 in a helium gas media using 10 cm3 chamber. Envelope Density was measured using Geopyc 1360 using a 12.7 mm chamber-piston set. A dry solid medium (DryFlow®) consisting of small and rigid spheres with high flowability displaces the void space and closely envelops the particle surface, thereby giving the envelope density (ρe) [15]. The porosity is calculated using the formula shown in Equation (2).
Porosity = (1 − (ρe/ρt)) × 100%
3. Results and Discussion
3.1. Effect of Impeller Speed and Batch Loading on Mass Throughput of the Mill
As mentioned earlier, the novelty of this study is advancing the scientific understanding of the effect of batch loading on the milled product properties. An important point is that the batch loading has an interaction effect with impeller speed, which adds a new perspective to the effect of impeller speed. In this study, the mass throughput of the mill, at any given time, is the mass of granules that have exited the mill till that point of time. In a continuous operation, at steady state, the rate at which input granules are fed to the mill is equal to the rate at which granules leave the mill. In a batch operation, the number of granules in the mill continually decreases, thereby leading to a decrease in the rate of mass throughput of the mill. This trend of mass throughput for a batch operation resembles a first order kinetic graph as shown in Figure 1.
The data in Figure 1 can be represented using first order kinetics model:
where K is the first-order rate constant and mfinal is the mass of the granules collected at the end of the milling cycle. Integrating Equation (3) with the initial condition of mass throughput of the mill at t = 0 is equal to 0 gives Equation (4)
where t corresponds to milling time elapsed, m is the mass throughput of the mill, mfinal is throughput of the mill at t = 300 s, which was the run time for these experiments. τ = 1/K, which is the time required to collect 63% mass of mfinal. For the purposes of the equation all the masses were represented as a fraction of the batch loading.
dm/dt = K(mfinal − m)
m = mfinal (1 − e−t/τ)
Equation (4) represents the general profile of the mass throughput of a Comil as a function of time elapsed. All the experiments conducted were represented with this equation and the terms mfinal and τ obtained for each of these experiments is shown in Table 3. The curve fit for each of these experiments showed good predictability.
In the above table t50 is the time taken to mill 50% of the batch loading. On regressing mfinal and τ we get the following equations:
with an R2 of 0.987, adjusted R2 of 0.95 and significance F of 0.0383.
with an R2 of 0.9, adjusted R2 of 0.922 and significance F of 0.2.
mfinal = 3.351159 m + 0.145144 v − 1.43681 m2 − 0.01826 mv2 − 0.19605 m2v + 0.021326 m2v2 − 1.15712
τ = 223.6696 m + 17.4493 v − 29.9949 m2 − 0.1502 v2 − 1.95513 mv2 + 3.047324 m2v2 − 34.3714 m2v − 98.2929
The equation of mass of milled granules as function of batch loading to the mill and impeller speed, can be obtained from Equation (4) by replacing mfinal and τ obtained from Equation (5) and Equation (6), respectively, into Equation (4).
t50 from Table 3 was regressed to get an equation in terms of batch loading fed and impeller speed.
with an R2 of 0.935 and adjusted R2 of 0.75 and significance F of 0.183.
t50 = -556.582 m − 33.2253 v − 5.71665 m2v2 + 5.892524 mv2 + 92.89835 m2v −60.3054 mv + 596.8258
Equation (7) was plotted with mass on the x axis, velocity on the z axis and time on the y axis (Figure 2).
Upon observation of the above t50 profiles, a minimum can be seen. This minimum falls between 0.8 and 0.9 kg of batch loading and between 10 to 11 m/s impeller speed. This corresponds to 1837 rpm to 2021 rpm. This minimum corresponds to the lowest time required to complete 50% of the mill cycle, and it also informs the conditions that should be employed to achieve that minimum time for 50% completion of mill cycle (i.e., the fastest rate at which this can be achieved).
From the above equations and study, it is clear that the throughput of a milling cycle is affected by both the impeller speed and the batch loading.
3.2. Effect of Impeller Speed and Batch Loading on PSD of the Milled Granule
3.2.1. Fines
To simplify subsequent downstream processing, granules that are neither too large nor too small are required [16]. Milling is followed by tablet compaction and large amount of fines produced during milling might lead to segregation or flow issues during the compaction process. Hence it is important to study the %fines generated during milling. For the present study, particles below the size of 90 µm are considered to be fines. %fines were calculated as shown in Equation (8).
%fines = ((mass of particles below 90 µm)/(total mass collected at the end of milling)) × 100
It can be observed that neither impeller speed nor batch loading have the same trend on %fines of the milled granules at each level (Figure 3a). Graphs of %fines of milled granules vs. Impeller speed, for each level of batch loading are also shown (Figure 3b,c,d). From Figure 3b,c,d it can be seen that the amount of fines and the final mass of granules collected (mill throughput after 300 s) are directly correlated, i.e., as the mass throughput of the mill increases, the percentage of fines generated also increases (for the same batch loading). For a batch loading of 300 g, a quadratic relation between fines and impeller speed can be observed, as mentioned in Schenck and Plank et al. [9]. This can be attributed to the fact that for 300 g batch loading, there is more space for the particles present in the mill to move around. Because of this space, the possibility of high-velocity collisions between particle and particle, particle and screen, and particle and impeller, increases. Therefore, for 300 g batch loading the effect of impact force imparted by the impeller is much higher compared to the other batch loadings. The large increase in %fines for 3000 rpm was probably because of the large impact force imparted by the impeller. For 600 g batch loading, too, a quadratic relation between %fines and impeller speed can be seen, but the concavity is different.
3.2.2. D50
To estimate the effect of milling, quantification of size reduction needs to be done. For that reason, a single parameter must be studied rather than the whole particle size distribution. d50 is the most commonly used single parameter estimate for particle size. d50 has been used as an estimate for size reduction in a mill in previous studies, as well [17]. d50 is defined as the particle size under which there are 50%, weight- or volume-based, of the milled granules. In the present study, d50 values are weight-based.
Similar to the case of %fines, the plot in Figure 4a also does not show a clear trend of milled product d50 for all the levels of impeller speed or batch loading. To get a clear understanding of the effect of impeller speed and batch loading on milled product d50, individual graphs of milled product d50 vs. impeller speed for each level of batch loading are also shown (Figure 4b–d).
Figure 4b–d shows that, for the same level of batch loading, the higher the total amount of material collected at end of milling cycle (throughput at 300 seconds), the lower is the milled product d50, i.e., the d50 of the milled product and the throughput of the mill are inversely correlated. Earlier it was observed that the throughput and %fines were directly correlated. Therefore, %fines and d50 of milled product are inversely correlated, i.e., the lower the d50 of the milled particles, the greater the number of fines generated during milling. This shows that a large degree of size reduction cannot be obtained without intense fines formation, and this is in agreement with the work done by Verheezen et al. [10].
Therefore, the batch loading and the impeller speed affect the throughput of the mill. This can be seen as milling being governed by two different regimes in a Comil [18].
Impact regime, in this regime mill throughput is dominated by exit of particles that are broken. Breakage occurs due to the collision between particle and impeller and particle and particle, and also because of shear between the impeller and the screen [9,10].
The other regime is called quasi static; in this regime, the mill throughput is dominated by the exit of the already existing smaller particles. This exit of smaller particles is a consequence of movement of particles within the mill [18] due to the rotation of the impeller. Among the two regimes, impact regime is more size reduction oriented. These regimes generally coexist and dominate during different times during the milling cycle.
As the impeller speed increases, the particles’ residence time in the mill increases, despite the fact that the increase in impeller speed means faster movement of particles [19,20]. This is because of the recirculation induced by high impeller speeds. However, it is known that increase in impeller speed leads to more breakage, as the particles in the mill are subjected to more collision and shear between the screen and the impeller [6,9,10]. This means that the quasi static regime, which is dominated by exit of particles out of the mill due to their movement, is prevalent at lower impeller speeds, whereas the impact regime which is related to breakage is prevalent at higher impeller speeds.
When the batch loading in the mill is large, there is a greater number of particles in the mill that are smaller than the screen size. For the same input granules to the mill, though the ratio of particles above the screen size and below the screen size is still same, a smaller batch loading will have fewer particles smaller than the screen size. Hence, a larger batch loading is favored by the quasi static regime over a smaller batch loading due to the presence of a greater number of particles smaller than the screen size.
At the same time, a smaller batch loading means that the particles in the mill have more possibility of achieving high velocities, at the same impeller speed, which would result in an increased number of high-velocity collisions. For a larger batch loading, the majority of the energy imparted by the impeller is depleted in moving the huge number of particles rather than resulting in high-speed collisions of particles (lack of space also prevents the particles from achieving high speed). Hence, a smaller batch loading is favored by impact regime over a large batch.
300 g batch loading at 3000 rpm is the batch most favored by impact regime batch because of its low batch loading and high impeller speed. Therefore, this batch results in the lowest d50 of 400 µm and the highest %fines of 14.1%. Similarly, 1000 g batch loading and 1500 rpm is the batch most favored by quasi static regime due to its large batch loading and low impeller speed and rightly the d50 of this batch is the highest at 565 µm and the %fines are lowest at 2.2%. The rest of the runs falls in between these two extremes.
Table 4 and Figure 5 represent the milling data of an experiment with batch loading of 600 g and an impeller speed of 3000 rpm. It was observed that after 30 s of milling the mass of granules collected was 251.4 g. The input batch had approximately 311 g of granules that were smaller than 1000 μm, which is approximately the size of the mill screen. In Figure 5b it can be seen that, as the time taken for milling increased, the particle size distribution shifted towards the right and the d50 of the granules increased (Table 4). This can be attributed to the fact that initially during the mill cycle, the particles which are already smaller than the screen size attempt to escape from the mill (simultaneously there is the occurrence of breakage but the majority of particles that escape are the already existing smaller particles). This also explains the huge exodus of particles initially, 251.4 g in 30 s, but by the end of 5 min cycle only 445.3 g (less than 200 g extra in an additional 270 s) was collected. This leads to the conclusion that the quasi static regime dominates the initial phase of milling and is later taken over by the impact regime.
Among the 300 g, 600 g and 1000 g batch loadings, the 300 g setting resulted in milled product with the lowest d50 (at each impeller speed setting), Figure 6. Since milling is dominated by the impact regime at low fill level, there is more breakage at the lowest fill level. It can further be observed that the d50 of the milled product is inversely proportional to batch loading We see an exception for 3000 rpm, this is probably because of the different regimes in which a 600 g batch loading and a 1000 g batch loading operate (especially at this impeller speed). High batch loading might reach the impact regime at the end of the milling cycle, leading to excess breakage of particles towards the end (due to its virtue of greater mass, leads to an exit of a huge mass initially in the quasi static regime, thereby reaching the low fill level case towards the end of milling cycle). Whereas the medium batch loading combined with recirculation at high impeller speed might always operate in the cusp regime between quasi static and impact, where the breakage is not the dominant phenomena.
This also explains the anomalous pattern observed in Figure 3c and Figure 4c, because of this abnormal shift in breakage pattern, 2250 rpm induces more breakage than 3000 rpm leading to maximum throughput at 2250 rpm (for 600 g batch loading).
An analysis of variance (ANOVA) was performed on various milled granule properties to signify the effect of milling on these properties. From these analyses, it was found that milling had a significant effect on span, friability, porosity, bulk and tapped density of granules, as shown in Table 5.
Since bulk density is an important property for further downstream processing and is necessary for the development of tablet press model, an attempt was made to develop a simple regressive predictive model for bulk density and tapped density, shown in Equations (9) and (10).
where m is batch loading (kg); d50 and d10 mentioned are that of the milled granules in mm. For the bulk density equation, R2 was found to be 0.9534, adjusted R2 was found to be equal to 0.8370, and significance, F, was equal to 0.1124. Similarly, for the tapped density equation, R2 was found to be 0.995, adjusted R2 was found to be equal to 0.983 and significance, F, was equal to 0.0119. Both these equations were validated using one of the experimental values and the error was found to be approximately 10% in both cases.
Bulk Density = 5.3298 − 0.3607 m − 20.7723 d50 + 0.2279 m2 + 24.2549 d502 − 4.7145 d102
Tapped Density = 5.387 − 0.1081 m − 20.4044 d50 + 0.0563 m2 + 23.2487 d502 − 4.0797 d102
3.3. Effect of Mill Screen Type
The screen of a Comil affects the particle size distribution of the milled granules. It is considered one of the most important parameters that affects the PSD, as it determines the upper limit of the milled particles and aids in breakage of particles in the Comil. A Comil has two types of screens, a grated/rasp-shaped screen and a normal screen (Figure 7). A grated screen has sharp-edged bores drilled towards the inside of the screen compared to the round bores of a normal screen. The screen sizes, used for this study, are 991 µm for a normal screen and a 1013 µm screen for a grated screen.
Verheezen et al. [10] states that for a grated screen the residence time of a particle in the mill is low, as it forces the in-size particles to exit the mill (Figure 8). Therefore, this results in higher size reduction in a mill with a normal screen due to increased residence time. Schenck and Plank [9] observed the same effect and stated that the grated screen generates fewer fines. However, they proposed a new theory, according to which the grated surface texture of the grated screen aids in the breakage of granules by chipping off fragments from large agglomerates. We observed that, contrary to Schenck and Plank, the grated screen has a greater number of fines for both 600 g and 1000 g batch loading at an impeller speed of 3000 rpm (Figure 9a). This shows that batch loading influences the effect of screen type. As opposed to the conclusion drawn by Verheezen et al. [10], the d50 of the milled product is higher for a normal screen for a batch loading of 600 g (Figure 9b).
Both types of screens have similar trends for %fines vs. batch loading, at 3000 rpm. It was observed that, for the same mill cycle time of 5 min, the final mill throughput was more for grated screes (for every run). This shows that the grated screen runs have shorter residence time in the mill, which is in concurrence with Verheezen et al. [10]. We know that at higher batch loadings, the quasi static regime is more dominant (for a batch loading of 600 g at 3000 rpm, it was observed earlier that cusp regime was maintained throughout the mill cycle causing very little breakage). Therefore, breakage is not the dominant phenomena at these batch loadings, hence it was found that normal screen generated fewer fines at these batch loadings. Whereas, the higher percentage of fines (at batch loading of 600 g and 1000 g) for a grated screen is because of additional breaking of the granules induced due to the rough surface texture of the grated screen. However, when impact regime is the dominant case (300 g batch loading at 3000 rpm) normal screen generated more fines than grated screen. This can be attributed to the lower residence time of granules in a grated screen.
3.4. Effect of Granulation Parameters on Milling
3.4.1. Liquid-to-Solid Ratio
As the L/S ratio increased, the d50 of the milled granules also increased (Figure 10a). It was also observed that the friability of the input granules decreased with an increase in the L/S ratio (Figure 10b). It is known that as the L/S ratio increases, the granules become denser and harder [21,22], thereby decreasing the friability of granules. As the friability of input granule decreases it becomes difficult for the mill to break it, resulting in a higher d50. It can also be seen that with the increase in the L/S ratio, the particle size of the input granules increased, which might have also been a reason for the increasing milled granule d50 trend. It can also be explained with the help of the regimes governing the milling operation. Since the mill was run only for 30 s, the majority of the cycle would have been dominated by the quasi static regime. Among the input granules, CAF-1 (0.45 L/S ratio) has the maximum amount of granules under the screen size of 991 μm, followed by CAF-2 (0.5 L/S ratio), and CAF-3 (0.55 L/S ratio) has the least amount of granules below 991 μm. The d10s, of the input batches are also in the same order 0.45 < 0.5 < 0.55. In the quasi static regime, the main reason for throughput is due to the exit of already existing granules that are smaller than the screen size of 991 μm. This effect is also reciprocated in the mass of granules collected after milling (Figure 10). Figure 10b also shows that as friability of input granule decreases, the mass of milled granules also decreases. This is attributed to the increase in strength of the granules due to decrease in friability. The trend of mass of milled granules as explained earlier could also be because of the dominance of quasi static regime during the current mill cycle.
3.4.2. Impeller Speed
From Figure 11, it can be observed that with an increase in impeller speed, there is an increase in the milled granule d50. Unlike for the L/S ratio, this increasing trend of milled granule d50 could not be explained with input granule friability or input granule d50. Figure 12 shows the distributions of the granulation batches; these aid in the understanding of this trend. From the plot, it can be observed that CAF-5 has a very narrow distribution with a peak around 500 μm. CAF-4 and CAF-3, both have a peak at similar position between 1000 and 2000 μm (around 1400 μm). However, the trend of mass of input granules below 1000 μm, shown in Table 6, is in the order of CAF-5 (190 rpm) > CAF-4 (150 rpm) > CAF-3 (170 rpm). Since the mill cycle time is 30 s, the quasi static regime is going to be the dominant one. Hence, the order of mass of milled granules collected (CAF-5 > CAF-4 > CAF-3, as seen in Figure 11b) resembles exactly the trend of mass of input granules that are smaller than 1000 μm. PSD of the input granules (Figure 12) revealed that CAF-5(190 rpm) has a large number of particles that are below 1000 μm, especially around 500 μm, which might have escaped the mill during the first 30 s of the mill cycle. Although CAF-4 (150 rpm) has the smallest peak over 500 μm, this batch of granules has many granules that are smaller than 500 μm. Hence most of the particles that exited during the milling cycle are comprised of these granules and hence would probably have the smallest d50. CAF-3 (170-rpm) has the lowest amount of granules that are below 1000 μm. From Figure 12, if we compare the particle size distribution of particles lower than 1000 μm (especially smaller than 500 μm), we see that CAF-3 (170 rpm) has a distribution between CAF-4 (150 rpm) and CAF-5 (190 rpm). This led to milled CAF-3 granules having a d50 in the middle.
3.4.3. Binder Addition
Initially, with the increase in %PVP, the d50 of the milled granules increased (Figure 13a); this is due to the increase in strength and an increase in the particle size of input granule especially the d10. Similar to the earlier studies, this study also had a mill cycle time of 30 s. Therefore, it is dominated by quasi static regime during the milling cycle. Since the d10 of CAF-6 (2% PVP) is also greater than that of CAF-4 (0% PVP), CAF-4 has lower d50 than CAF-6.
On further increasing %PVP, the d50 reduced and this is due to the fact that the strength and particle size of the input granule increased even further, so much that even the d10 is higher than the screen size (991 μm). This means that due to the lack granules under the screen size of 991 μm, this batch was dominated by the impact regime. Since the granules were too large and hard, the residence time of the granules in the mill increased drastically there by taking a greater number of hits and resulting in lower PSD. The same reasoning can be stated for the drastic decrease in the mass of granules collected at 4% PVP.
From Figure 13c,d it can be seen that the trend of d50 of milled granules and %fines of milled granules are exactly opposite, i.e., lower is the d50 more are the fines generated. In other words, it is not possible to achieve a large degree of size reduction without intensive fines formation. However, in Figure 13b shows that although 4% PVP does not have the lowest milled d50, it has the largest fines generated. This, similar to the earlier case, is due to the unusual increase in residence time of 4% PVP, which led to intense multiple impacts, thereby leading to a high level of fines formation. Therefore, the regime in which the mill operates determines the fines formation, for the same screen size.
4. Conclusions
One of the unique findings of this paper is the identification of a new CPP (batch loading) and its effect on the CQAs of the milled granules. It was found that batch loading and its interaction with impeller speed have a significant effect on the properties of milled granules. Another unique revelation of this study was the identification of the operation regimes in a Comil. It was shown that Comil primarily operates in two regimes, the quasi static regime (dominated by the exit of already existing particles that are smaller than the mill screen size) and the impact regime (dominated by the breakage of particles). It was observed that large batch loadings and low impeller speeds favor the quasi static regime, whereas small batch loadings and high impeller speeds favor the impact regime. It was also observed that as the operational time progresses, mill operation moves from quasi static regime to impact regime. Further study in this topic can be vital for development of better models. Better understanding and quantification of this shift can aid in development of more accurate breakage kernels. This knowledge of the effect of batch loading can be translated to fill level (hold up) in a continuous operation. Generally, screen size is the CPP that is majorly varied to alter the milled granule properties, but this study gives the necessary insight to vary additional properties (batch loading and impeller speed) to obtain the desired milled granule properties. Predictive regression models were developed for throughput of the mill, bulk density and tap density, this could be beneficial for understanding of further downstream processes, and aid in their model development.
Understanding the effect of upstream operations on a particular unit operation is very critical in pharmaceutical manufacturing. Therefore, for this reason the effect of CPPs (liquid-to-solid ratio and granulation impeller speed) of granulation on CQAs of milled granules was also studied. The effect of screen type and the effect of binder addition (PVP) to the formulation were also studied. Granulation impeller speed and liquid-to-solid ratio were observed to affect the milled granules. With increase in liquid-to-solid ratio the d50 of the milled granules increased and %fines of the milled granules decreased. Similar trend was observed for granulation impeller speed. With the increase in %PVP in formulation the d50 of the milled granules increased on further increasing the %PVP there was a decrease in d50.
Supplementary Materials
Supplementary File 1Author Contributions
Conceptualization, all authors; methodology, L.K.; formal analysis, L.K.; investigation, L.K.; resources, R.R.; data curation, L.K., N.M.; writing—original draft preparation, L.K.; writing—review and editing, R.R.; visualization, L.K., N.M.; supervision, R.R.; project administration, R.R.; funding acquisition, R.R. All authors have read and agreed to the published version of the manuscript.
Funding
This research received no external funding.
Conflicts of Interest
The authors acknowledge no conflict of interest.
References
- Naik, S.; Chaudhuri, B. Quantifying Dry Milling in Pharmaceutical Processing: A Review on Experimental and Modeling Approaches. J. Pharm. Sci. 2015, 104, 2401–2413. [Google Scholar] [CrossRef] [PubMed]
- Samanta, A.K.; Ng, K.Y.; Heng, P.W.S. Cone milling of compacted flakes: Process. parameter selection by adopting the minimal fines approach. Int. J. Pharm. 2012, 422, 17–23. [Google Scholar] [CrossRef] [PubMed]
- Yin, S.X.; Franchini, M.; Chen, J.; Hsieh, A.; Jen, S.; Lee, T.; Hussain, M.; Smith, R. Bioavailability enhancement of a COX-2 inhibitor, BMS-347070, from a nanocrystalline dispersion prepared by spray-drying. J. Pharm. Sci. 2005, 94, 1598–1607. [Google Scholar] [CrossRef] [PubMed]
- Oka, S.; Kašpar, O.; Tokárová, V.; Sowrirajan, K.; Wu, H.; Khan, M.; Muzzio, F.; Štěpánek, F.; Ramachandran, R. A quantitative study of the effect of process parameters on key granule characteristics in a high shear wet granulation process involving a two component pharmaceutical blend. Adv. Powder Technol. 2015, 26, 315–322. [Google Scholar] [CrossRef]
- Woyna-Orlewicz, K.; Jachowicz, R. Analysis of wet granulation process with Plackett-Burman design-case study. Acta Pol Pharm. 2011, 68, 725–733. [Google Scholar] [PubMed]
- Barrasso, D.; Oka, S.; Muliadi, A.; Litster, J.D.; Wassgren, C.; Ramachandran, R. Population Balance Model. Validation and Predictionof CQAs for Continuous Milling Processes: Toward QbDin Pharmaceutical Drug Product Manufacturing. J. Pharm. Innov. 2013, 8, 147–162. [Google Scholar] [CrossRef]
- Byers, J.E.; Peck, G.E. The effect of Mill Variables on a Granulation Milling Process. Drug Dev. Ind. Pharm. 1990, 16, 1761–1779. [Google Scholar] [CrossRef]
- Motzi, J.J.; Anderson, N.R. The quantitative evaluation of a granulation milling process II. Effect of output screen size, mill speed and impeller shape. Drug Dev. Ind. Pharm. 1984, 10, 713–728. [Google Scholar] [CrossRef]
- Schenck, L.R.; Plank, R.V. Impact milling of pharmaceutical agglomerates in the wet and dry states. Int. J. Pharm. 2008, 348, 18–26. [Google Scholar] [CrossRef] [PubMed]
- Verheezen, J.J.A.M.; Maarschalk, K.v.d.V.; Faassen, F.; Vromans, H. Milling of agglomerates in an impact mill. Int. J. Pharm. 2004, 278, 165–172. [Google Scholar] [CrossRef] [PubMed]
- Subero, J.; Ghadiri, M. Breakage patterns of agglomerates. Powder Technol. 2001, 120, 232–243. [Google Scholar] [CrossRef]
- Pandey, P.; Tao, J.; Chaudhury, A.; Ramachandran, R.; Gao, J.Z.; Bindra, D.S. A combined experimental and modeling approach to study the effects of high-shear wet granulation process parameters on granule characteristics. Pharm. Dev. Technol. 2013, 18, 210–224. [Google Scholar] [CrossRef] [PubMed]
- The United States Pharmacopeial Convention. Bulk Density and Tapped Density of Powders; U.S. Pharmacopeia, Ed.; The United States Pharmacopeial Convention: North Bethesda, MD, USA, 2015. [Google Scholar]
- Vercruysse, J.; Díaz, D.C.; Peeters, E.; Fonteyne, M.; Delaet, U.; van Assche, I.; de Beer, T.; Remon, J.P.; Vervaet, C. Continuous twin screw granulation: Influence of process variables on granule and tablet quality. Eur. J. Pharm. Biopharm. 2012, 82, 205–211. [Google Scholar] [CrossRef] [PubMed] [Green Version]
- Meng, W.; Kotamarthy, L.; Panikar, S.; Sen, M.; Pradhan, S.; Marc, M.; Litster, J.D.; Muzzio, F.J.; Ramachandran, R. Statistical analysis and comparison of a continuous high shear granulator with a twin screw granulator: Effect of process parameters on critical granule attributes and granulation mechanisms. Int. J. Pharm. 2016, 513, 357–375. [Google Scholar] [CrossRef] [PubMed]
- El Hagrasy, A.S.; Cruise, P.; Jones, I.; Litster, J.D. In-line Size Monitoring of a Twin Screw Granulation Process. Using High-Speed Imaging. J. Pharm. Innov. 2013, 8, 90–98. [Google Scholar] [CrossRef]
- Metta, N.; Ghijs, M.; Schäfer, E.; Kumar, A.; Cappuyns, P.; Van Assche, I.; Singh, R.; Ramachandran, R.; De Beer, T.; Ierapetritou, M.; et al. Dynamic Flowsheet Model. Development and Sensitivity Analysis of a Continuous Pharmaceutical Tablet Manufacturing Process. Using the Wet Granulation Route. Processes 2019, 7, 234. [Google Scholar] [CrossRef] [Green Version]
- Yu, S.; Gururajan, B.; Reynolds, G.; Roberts, R.; Adams, M.J.; Wu, C.-Y. Experimental Investigation of Milling of Roll Compacted Ribbons. In Particulate Materials: Synthesis, Characterisation, Processing and Modelling; The Royal Society of Chemistry: Cambridge, UK, 2012; pp. 158–166. [Google Scholar]
- Vanarase, A.U.; Muzzio, F.J. Effect of operating conditions and design parameters in a continuous powder mixer. Powder Technol. 2011, 208, 26–36. [Google Scholar] [CrossRef]
- Gao, Y.; Muzzio, F.J.; Ierapetritou, M.G. Optimizing continuous powder mixing processes using periodic section modeling. Chem. Eng. Sci. 2012, 80, 70–80. [Google Scholar] [CrossRef]
- El Hagrasy, A.S.; Hennenkampb, J.R.; Burkec, M.D.; Cartwrightc, J.J.; Litsterad, J.D. Twin screw wet granulation: Influence of formulation parameters on granule properties and growth behavior. Powder Technol. 2013, 238, 108–115. [Google Scholar] [CrossRef]
- Sayin, R.; El Hagrasy, A.S.; Litster, J.D. Distributive mixing elements: Towards improved granule attributes from a twin screw granulation process. Chem. Eng. Sci. 2015, 125, 165–175. [Google Scholar] [CrossRef]
Figure 1.
Typical mass throughput profile of a Comil. The graph represents a 600 g batch loading and an impeller speed of 3000 rpm.
Figure 1.
Typical mass throughput profile of a Comil. The graph represents a 600 g batch loading and an impeller speed of 3000 rpm.

Figure 2.
Side view of t50 profile (a), top view of t50 profile (b).

Figure 3.
(a) %fines obtained for each run, comparison between mill throughput and %fines at a batch loading of (b) 300 g, (c) 600 g and (d) 1000 g.
Figure 3.
(a) %fines obtained for each run, comparison between mill throughput and %fines at a batch loading of (b) 300 g, (c) 600 g and (d) 1000 g.

Figure 4.
(a) d50 obtained for each run, comparison between mill throughput and d50 at a batch loading of (b) 300 g, (c) 600 g and (d) 1000 g.
Figure 4.
(a) d50 obtained for each run, comparison between mill throughput and d50 at a batch loading of (b) 300 g, (c) 600 g and (d) 1000 g.

Figure 5.
Input batch PSD (a), output batch PSD (b).

Figure 6.
Plot showing the effect of batch loading on milled product d50 at different impeller speeds.
Figure 6.
Plot showing the effect of batch loading on milled product d50 at different impeller speeds.

Figure 7.
Normal screen (left), Grated Screen (right).

Figure 8.
Comparison of particle movement between a normal screen (round shaped screen) and grated screen.
Figure 8.
Comparison of particle movement between a normal screen (round shaped screen) and grated screen.

Figure 9.
Plot showing the effect of batch loading on %fines (a) and on d50 (b) for grated and normal screen.
Figure 9.
Plot showing the effect of batch loading on %fines (a) and on d50 (b) for grated and normal screen.

Figure 10.
Plot showing the effect of L/S ratio on d50 and friability (a), and the mass of milled granules and friability (b).
Figure 10.
Plot showing the effect of L/S ratio on d50 and friability (a), and the mass of milled granules and friability (b).
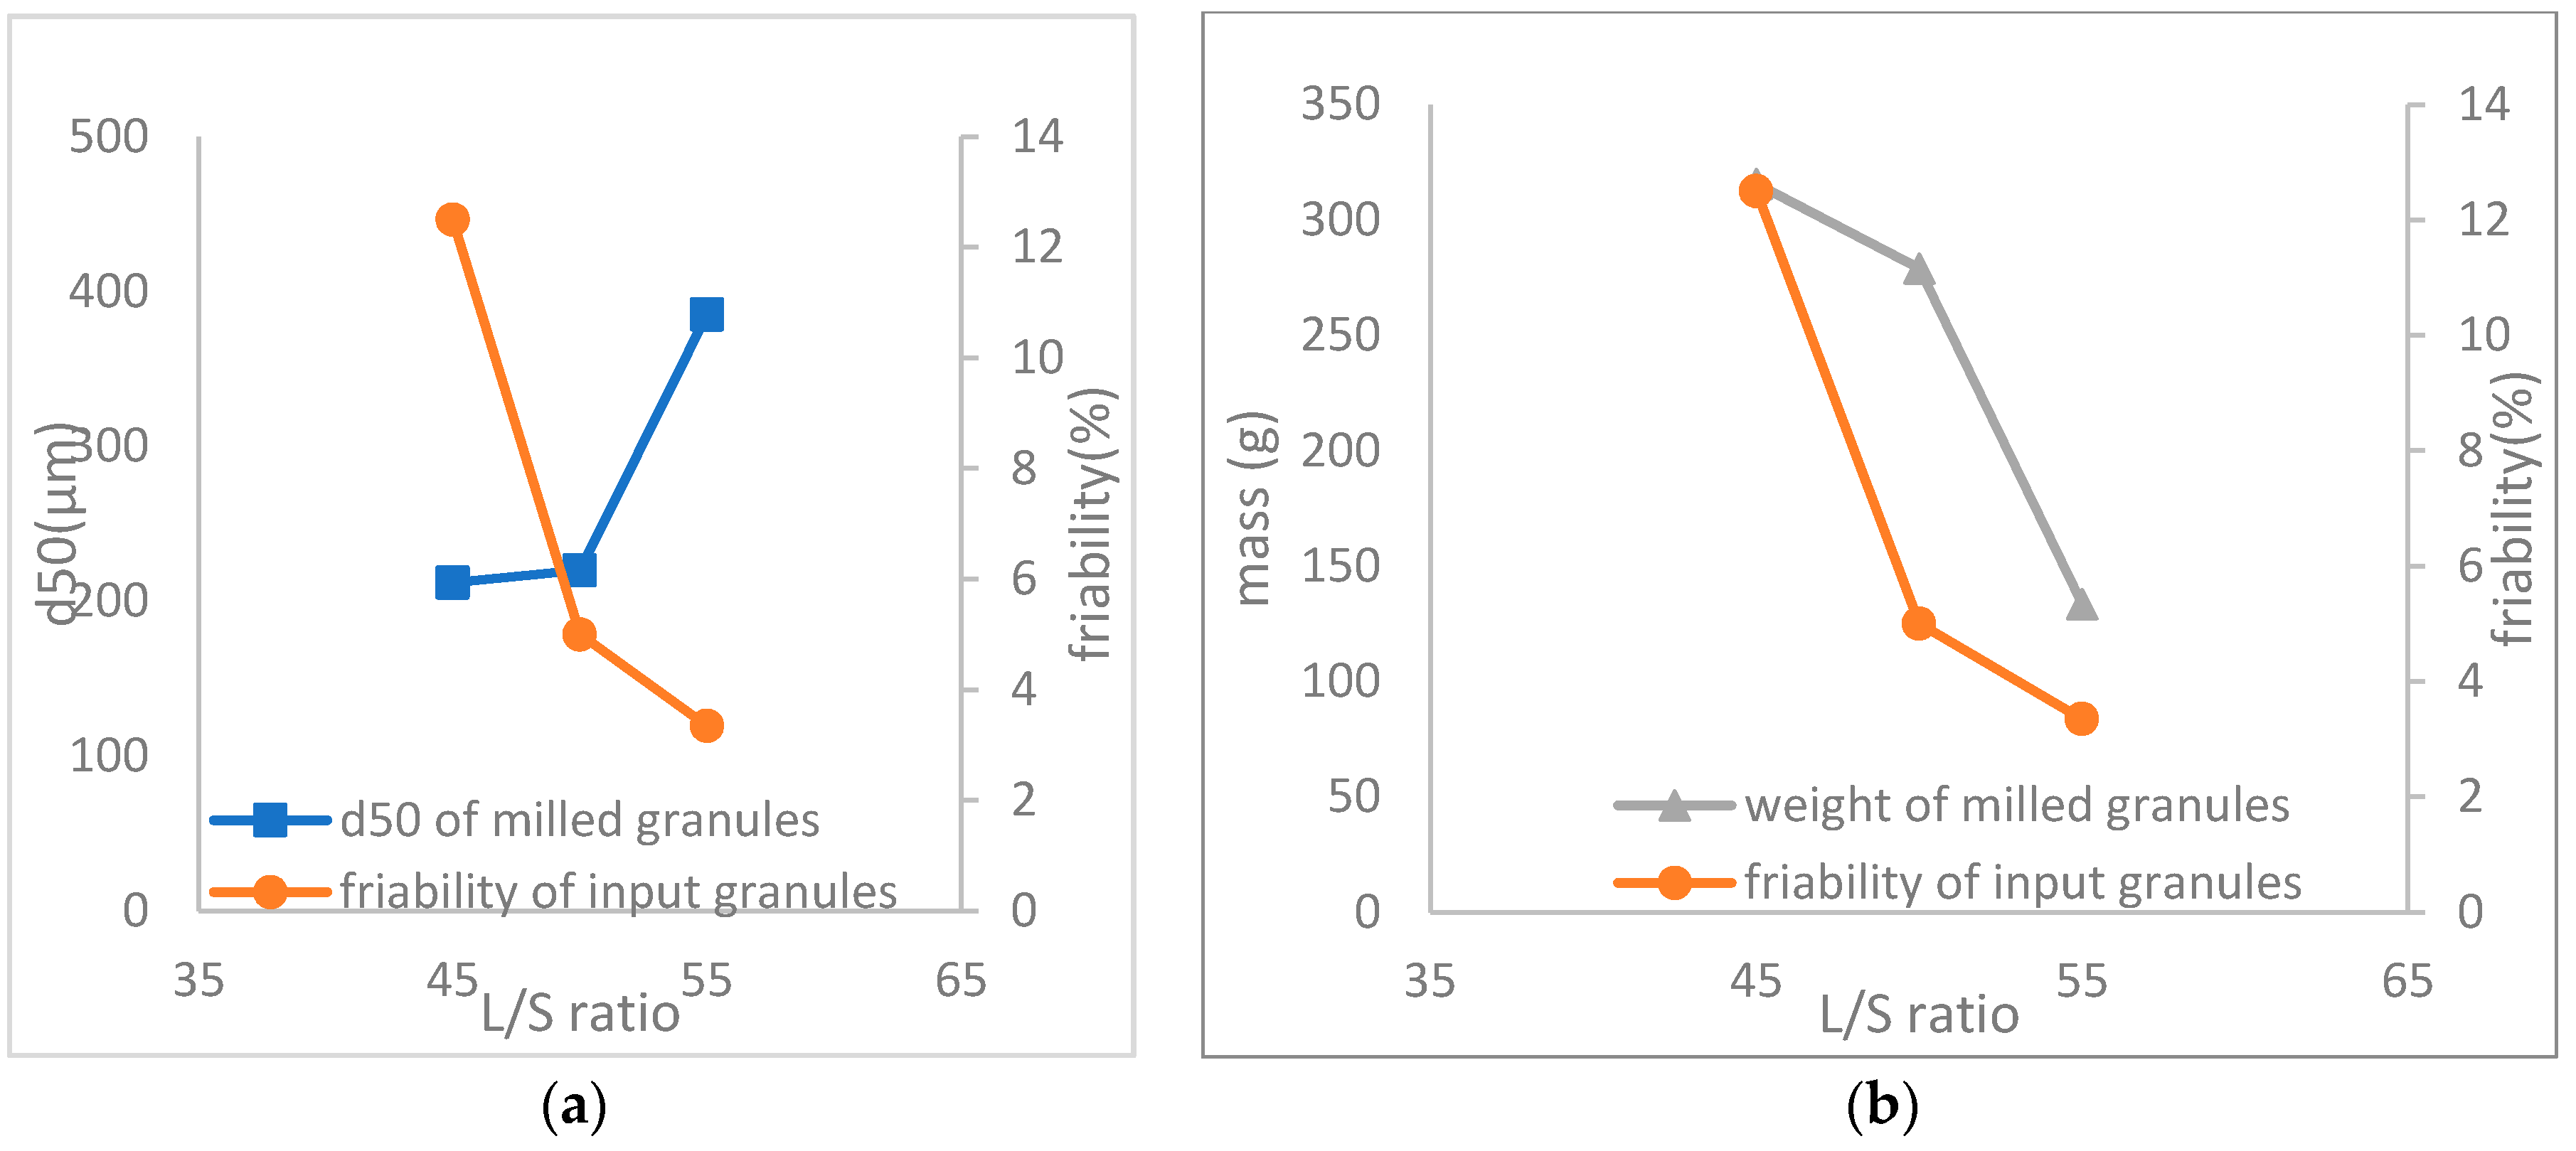
Figure 11.
Plot showing the effect of impeller speed on d50 (a) and mass of milled granules (b).
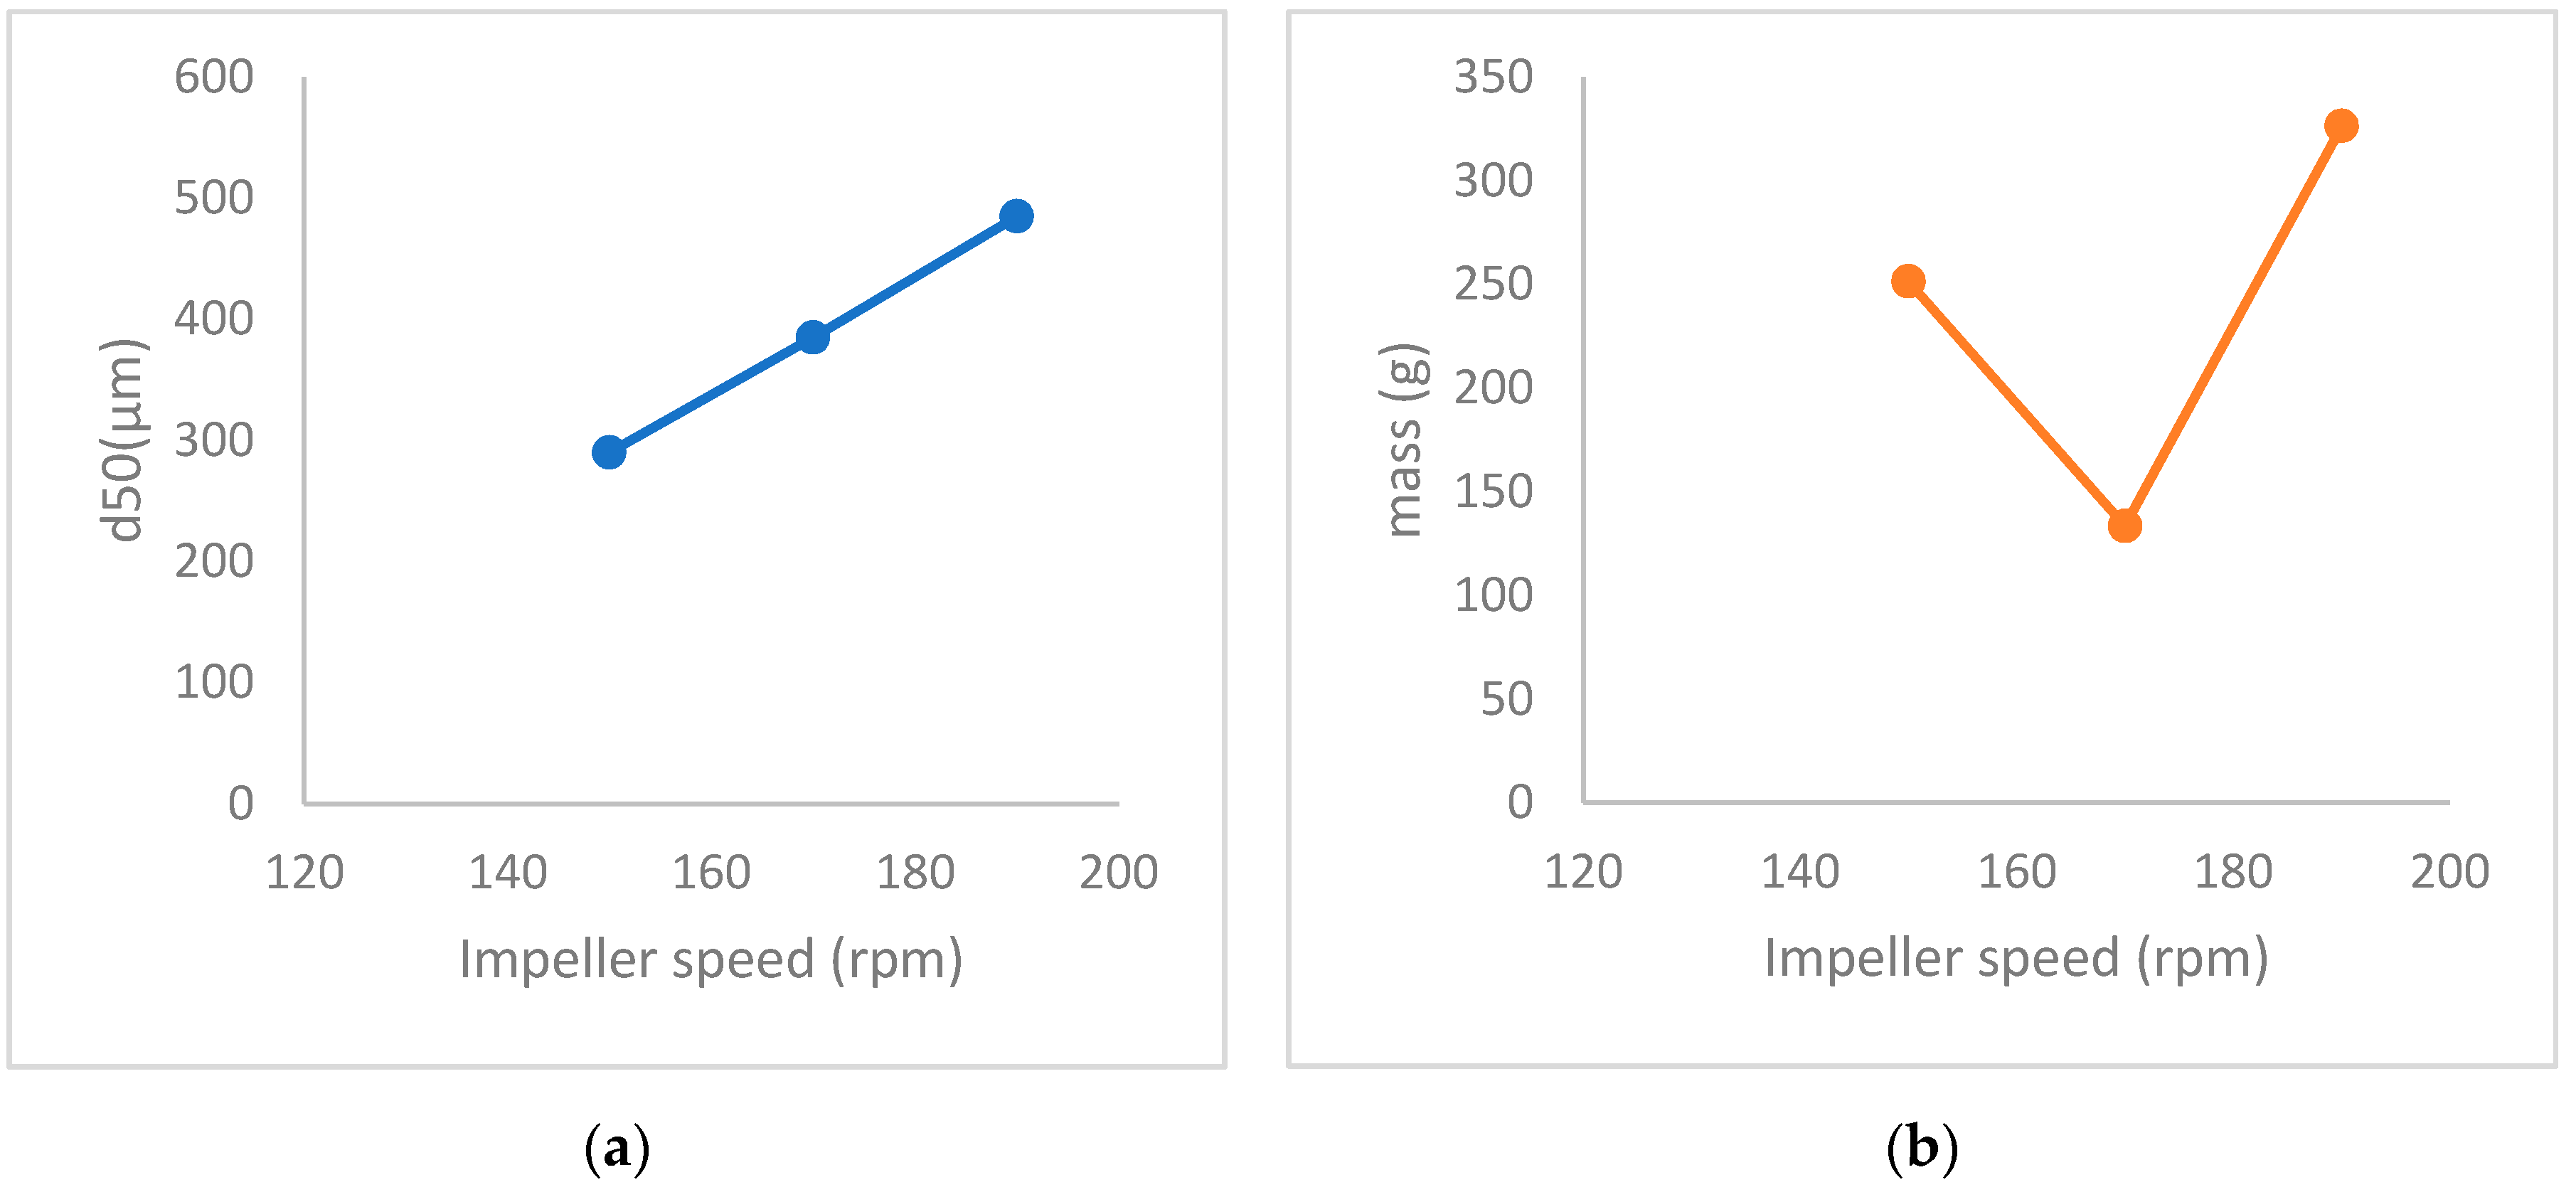
Figure 12.
Plot showing the log normal distribution of granules processed with 150 rpm, 170 rpm (CAF-3) and 190 rpm (CAF-5).
Figure 12.
Plot showing the log normal distribution of granules processed with 150 rpm, 170 rpm (CAF-3) and 190 rpm (CAF-5).

Figure 13.
(a) Plot showing the effect of %PVP on d50 & mass of milled granules, (b) effect of %PVP on d50 and %fines, (c) effect of impeller speed on d50 and %fines, (d) effect of L/S ratio on d50 and %fines.
Figure 13.
(a) Plot showing the effect of %PVP on d50 & mass of milled granules, (b) effect of %PVP on d50 and %fines, (c) effect of impeller speed on d50 and %fines, (d) effect of L/S ratio on d50 and %fines.


Table 1.
DoE for effect of mill process parameters.
| Granulation Parameters | Mill Parameters | |||
|---|---|---|---|---|
| Impeller Speed (rpm) | L/S Ratio (%) | %PVP in Formulation | Impeller Speed (rpm) | Batch Loading (g) |
| 150 | 55 | 0 | 2250 | 600 |
| 150 | 55 | 0 | 1500 | 1000 |
| 150 | 55 | 0 | 2250 | 300 |
| 150 | 55 | 0 | 3000 | 600 |
| 150 | 55 | 0 | 1500 | 300 |
| 150 | 55 | 0 | 3000 | 1000 |
| 150 | 55 | 0 | 1500 | 600 |
| 150 | 55 | 0 | 2250 | 1000 |
| 150 | 55 | 0 | 3000 | 300 |
Table 2.
DoE for effect of granulation and formulation parameters on milling.
| Impeller Speed (rpm) | L/S Ratio (%) | %PVP | d10 (μm) | d50 (μm) | d90 (μm) |
|---|---|---|---|---|---|
| 170 | 45 | 0 | 190 | 600 | 1900 |
| 170 | 50 | 0 | 280 | 1060 | 2070 |
| 170 | 55 | 0 | 470 | 1400 | 2150 |
| 150 | 55 | 0 | 215 | 840 | 1930 |
| 190 | 55 | 0 | 450 | 750 | 1700 |
| 150 | 55 | 2 | 480 | 1020 | 2010 |
| 150 | 55 | 4 | 1075 | 1900 | 3200 |
Table 3.
mfinal and τ values for all the mill runs in the first part of the study.
| m (kg) | v (m/s) | RPM | mfinal | τ | t50 |
|---|---|---|---|---|---|
| 0.6 | 12,246 | 2250 | 0.780 | 56.85 | 58,195 |
| 1 | 8164 | 1500 | 0.553 | 20.67 | 48,660 |
| 0.3 | 12,246 | 2250 | 0.758 | 70.12 | 75,664 |
| 0.6 | 16,328 | 3000 | 0.675 | 46.26 | 62,486 |
| 0.3 | 8164 | 1500 | 0.522 | 53.93 | 170,761 |
| 1 | 16,328 | 3000 | 0.745 | 70.72 | 78,633 |
| 0.6 | 8164 | 1500 | 0.708 | 49.46 | 60,602 |
| 1 | 12,246 | 2250 | 0.584 | 28.45 | 55,197 |
| 0.3 | 16,328 | 3000 | 0.841 | 78.26 | 70,620 |
Table 4.
d10, d50 and d90 values of the input batch and output batch, after 30 s and 5 min.
| d50 | d90 | d10 | |
|---|---|---|---|
| Input batch | 840 | 1930 | 215 |
| Output batch, after 30 s | 290 | 500 | 110 |
| Output batch, after 5 min | 515 | 710 | 190 |
Table 5.
p-values, describing the effect of milling on various CQA’s.
| CQA | p-Value |
|---|---|
| span | 9.11 × 10⁻⁹ |
| friability | 0.044 |
| porosity | 0.006 |
| bulk density | 0.00049 |
| tap density | 2.91 × 10⁻⁷ |
Table 6.
Table describing the mass of granules below 1000 μm for different input granulation batches.
Table 6.
Table describing the mass of granules below 1000 μm for different input granulation batches.
| Granulation Batch | Mass Below 1000 μm (g) |
|---|---|
| CAF-3 (170 rpm) | 201.18 |
| CAF-4 (150 rpm) | 311.13 |
| CAF-5 (190 rpm) | 422.14 |
© 2020 by the authors. Licensee MDPI, Basel, Switzerland. This article is an open access article distributed under the terms and conditions of the Creative Commons Attribution (CC BY) license (http://creativecommons.org/licenses/by/4.0/).
Share and Cite
MDPI and ACS Style
Kotamarthy, L.; Metta, N.; Ramachandran, R. Understanding the Effect of Granulation and Milling Process Parameters on the Quality Attributes of Milled Granules. Processes 2020, 8, 683. https://doi.org/10.3390/pr8060683
AMA Style
Kotamarthy L, Metta N, Ramachandran R. Understanding the Effect of Granulation and Milling Process Parameters on the Quality Attributes of Milled Granules. Processes. 2020; 8(6):683. https://doi.org/10.3390/pr8060683
Chicago/Turabian StyleKotamarthy, Lalith, Nirupaplava Metta, and Rohit Ramachandran. 2020. "Understanding the Effect of Granulation and Milling Process Parameters on the Quality Attributes of Milled Granules" Processes 8, no. 6: 683. https://doi.org/10.3390/pr8060683
Note that from the first issue of 2016, this journal uses article numbers instead of page numbers. See further details here.