Thermal and Fluid Dynamic Performance Comparison of Three Nanofluids in Microchannels Using Analytical and Computational Models

Department of Mechanical Engineering, University of Alaska, Fairbanks P.O. Box 755905, Fairbanks, AK 99775-5905, USA
*
Author to whom correspondence should be addressed.
Processes 2020, 8(7), 754; https://doi.org/10.3390/pr8070754
Submission received: 3 June 2020
/
Revised: 22 June 2020
/
Accepted: 27 June 2020
/
Published: 29 June 2020
(This article belongs to the Collection Modeling, Simulation and Computation on Dynamics of Complex Fluids)
Abstract
:The fluid dynamic and thermal performance of three nanofluids containing aluminum oxide, copper oxide, and silicon dioxide nanoparticles dispersed in 60:40 ethylene glycol and water base fluid as a coolant in a microchannel heatsink are compared here by two methods. The first is a simple analytical analysis, which is acceptable for very low nanoparticle volumetric concentration (1–2%). The second method is a rigorous three-dimensional finite volume conjugate heat transfer and fluid dynamic model based upon a constant heat flux boundary condition, which is applicable for cooling electronic chips. The fluids’ thermophysical properties employed in the modeling are based on empirically derived, temperature dependent correlations from the literature. The analytical and computational results for pressure drop and Nusselt number were in good agreement with the nanofluids showing a maximum difference of 4.1% and 2.9%, respectively. Computations cover the practical range of Reynolds number from 20 to 200 in the laminar regime. Based on equal Reynolds number, all of the nanofluids examined generate a higher convective heat transfer coefficient in the microchannel than the base fluid, while copper oxide provided the most significant increase by 21%. Based on the analyses performed for this study, nanofluids can enhance the cooling performance of the heatsink by requiring a lower pumping power to maintain the same maximum wall temperature. Aluminum oxide and copper oxide nanofluids of 2% concentration reduce the pumping power by 23% and 22%, respectively, while maintaining the same maximum wall temperature as the base fluid.
1. Introduction
High performance computer chips are cooled by joining them to heatsinks within which microchannels. The high heat flux produced by chips is carried away by the coolant flowing through the channels. The same concept is employed in cold plates, which are used to cool the electronic equipment in aircraft, spacecraft, or the space station, where a large amount of heat is generated in a confined space. Examples of such microchannel cooling have been described in Bergman et al. [1]. Microchannel heat exchangers (MCHX) are compact and increase the heat transfer surface area significantly compared to traditional heat exchangers. Therefore, they hold a great deal of promise in spacecraft. While working on developing innovative heat exchanger to cool chips, Tuckerman and Pease [2] introduced microchannel heatsink. They proposed that the microscale passages can be etched directly within the chip in the non-circuit areas. Microchannel heatsinks are a noteworthy improvement in heat exchanger design over the years to increase thermal performance. While the heat exchanger design has made substantial progress, the heat transfer fluid has remained unchanged.
Depending on the application, the heat transfer liquids widely used are water in warm environments or ethylene glycol and water (EG/W) or propylene glycol and water (PG/W) mixtures at sub-freezing temperatures. National Aeronautics and Space Administration (NASA) spacecrafts operating under subzero condition require glycol as the coolant. Although EG/W has superior thermal properties than PG/W, due to the toxicity of EG/W, NASA prefers the PG/W mixture. Among these three liquids, water has the highest thermal conductivity of 0.60 W/m∙K, EG/W 0.36 W/m∙K, and PG/W 0.30 W/m∙K at room temperature, 20 °C. Comparing these values to aluminum oxide (Al2O3) nanomaterials, which has a thermal conductivity of 36.0 W/m∙K. By dispersing nanometer size solid particles (≤ 100 nm) into a fluid, the thermal conductivity of the nanofluid is higher than the base fluid. Past research [3,4,5,6] has shown a low volumetric concentration of nanofluids up to 2% can enhance the convective heat transfer coefficient. It has been demonstrated by Ray et al. [7], that the increased thermal performance of nanofluids results in the reduction of the pumping power and surface area (thus size and weight) of a compact heat exchanger, such as an automotive radiator by as much as 30% or 7%, respectively.
In recent years, computational analyses of nanofluid flow in microchannels have appeared in the literature. The book edited by Minkowycz et al. [6] contains extensive research articles on a wide array of topics on nanofluids. Klienstreuer et al. [8] presented results on heat transfer and pressure drop of water based Al2O3 nanofluid in a trapezoidal microchannel using an effective viscosity model proposed by Masoumi et al. [9]. Another recent book edited by Bianco et al. [10] presented extensive results on heat transfer and fluid flow with nanofluids, including some analysis of their performance in microchannels. The treatise by Kandlikar et al. [11] is exclusively devoted to fluid dynamics and heat transfer research in minichannels and microchannels.
As microchannel heat exchangers hold a great deal of promise for the future, the objective of the present study has been to compare the thermal and fluid dynamic performance of aluminum oxide (Al2O3), copper oxide (CuO), and silicon dioxide (SiO2) dispersed 60:40 ethylene glycol and water (EG/W) by mass, circulating in a commonly accepted microchannel geometry. Two approaches have been adopted in this paper: (i) a computational fluid dynamic (CFD) modeling using the well-known software ANSYS Fluent [12] Version 18.1 and (ii) a comprehensive analytical modeling following the analytical correlations presented in the authoritative book on microchannel by Kandlikar et al. [11].
2. Materials and Methods
2.1. Properties of Materials
Four types of materials were used in the present analysis. The base fluid (60:40 EG/W), is the dispersing medium and the nanoparticles, Al2O3, CuO, and SiO2.
2.1.1. Base Fluid Properties
A 60:40 EG/W mixture by mass was adopted. This mixture provides a low freezing point of about −54 °C [13]. The lower temperature is favorable in spacecraft applications or sub-arctic climates. EG/W thermophysical properties were obtained from the American Society of Heating, Refrigerating, and Air-Conditioning Engineers (ASHRAE) Fundamentals Handbook [13]. A correlation was developed for each thermophysical property as a function of temperature, as shown in Table 1. Density, specific heat, and thermal conductivity correlations were modeled as a nondimensional form following Yaws [14] model covering the temperature range of 238 K ≤ T ≤ 398 K. The viscosity correlation follows the log-quadratic empirical fit recommend by White [15] for liquids. The viscosity correlation was improved by splitting the temperature range into two segments 238 K ≤ T ≤ 273 K and 273 K ≤ T ≤ 398 K to achieve an error of less than 0.9%. The correlation in the range of 273 K ≤ T ≤ 398 K is only presented here due to the temperature range within which computations in the present paper have been performed. The full set of correlations are available in Ray et al. [7]. All the thermophysical correlations show a coefficient of determination R2 ≈ 1. The density and specific heat correlations have an absolute error of less than 0.1%, while viscosity and thermal conductivity are 0.91% and 0.11%, respectively. Compared to other important transport properties of fluids, viscosity and thermal conductivity have a strong dependence on temperature. Therefore, they would require more complex empirical formulas to reduce the curve–fit error. However, that will compromise the simplicity of the present curve fit formulas. For practical engineering design, it is acceptable to have correlations with an error of less than 1%.
2.1.2. Nanofluid Properties
EG/W nanofluids have the most comprehensive thermophysical properties measurement. General correlations were developed by various researchers for density, specific heat, thermal conductivity, and viscosity. For the present study, EG/W nanofluids with Al2O3, CuO, and SiO2 will be examined. The thermophysical properties of the nanoparticles are summarized in Table 2.
The majority of the nanofluids studied in this paper were purchased from Alfa Aesar [16]. The thermophysical properties measurements of these EG/W based nanofluids followed the strict nanofluid preparation and characterization procedures outlined in [5,17,18].

Table 2.
Nanoparticle Properties.
| Particle | Diameter (nm) | Density (kg/m3) | Specific Heat (J/kg∙K) | Thermal Conductivity (W/m∙K) |
|---|---|---|---|---|
| Al2O3 | 45 [5] | 3600 [5] | 765 [19] | 36.0 [5] |
| CuO [20] | 29 | 6500 | 533 | 17.65 |
| SiO2 [19] | 20 | 2220 | 745 | 1.38 |
Density
Pak and Cho [4] presented a theoretical equation (Equation (1)) to predict the density of nanofluids. Vajjha et al. [21] conducted experimental measurements of density for three EG/W nanofluids (aluminum oxide, antimony-tin oxide, and zinc oxide). Their measured values were in good agreement with Equation (1).
The “nf”, “p”, and “bf” subscripts denote nanofluid, particle and base fluid, respectively.
Specific Heat
Xuan and Roetzl [22] presented theoretical Equation (2) for determining the specific heat of nanofluids. The present study uses Equation (2) to determine the specific heat of copper oxide and silicon dioxide dispersed in 60:40 ethylene glycol and water mixture.
While for aluminum oxide, it uses the correlation (Equation (3)) that was developed by Vajjha and Das [17]. The curve-fit coefficients A, B, and C for Al2O3 are summarized in Table 3.
The percentage deviation in Table 3 represents the difference between the experimental data and curve-fit Equation (2).
Thermal Conductivity
Hamilton and Crosser [23] presented a thermal conductivity model for a solid-liquid mixture. Koo and Kleinstreuer [3] expanded the thermal conductivity model by including Brownian motion for nanofluids, as shown in Equation (4). Following Koo and Kleinstreuer [3] model, Vajjha and Das [5] and Sahoo et al. [24] have a developed correlation (Equation (5)) and the β term (Table 4) for nanoparticles dispersed in 60:40 EG/W mixture. Vajjha and Das [5] and Sahoo et al. [24] utilized steady-state measuring techniques to determine the thermal conductivity of aluminum oxide, copper oxide, zinc oxide, and silicon dioxide nanoparticles dispersed in EG/W. Using Equations (4) and (5), an average deviation for Al2O3, CuO, and SiO2 EG/W nanofluids was 0.23%, 5.74%, and 1.97%, respectively.
Viscosity
Namburu et al. [25,26] and Sahoo et al. [27] measured the viscosities of aluminum oxide, copper oxide, and silicon dioxide dispersed in EG/W with a temperature ranging from 273 to 363 K. Utilizing the data from the previous researchers, Vajjha et al. [20] developed a nondimensional correlation, Equation (6) for those three nanofluids. The curve-ft coefficients A and B for three nanofluids proposed by Vajjha et al. [20] are summarized in Table 5.
The maximum deviation between the experimental data and the curve-fit Equation (6) is reported by Vajjha et al. [20] to be ±12%.
3. Microchannel Heat Exchanger
Geometries of the Heat Exchanger
The computational fluid dynamic and analytical models were conducted using the geometries of a microchannel presented by Kandlikar et al. [11]. A simple diagram of the microchannel heatsink is shown in Figure 1. The dimensions and material properties are noted in Table 6.
Additional surface information is needed before performing an analysis. The equations below show how these surface related characteristics were calculated as presented by Kandlikar et al. [11].
Surface Area:
Channel Cross sectional area:
Heat Transfer Surface Area:
Aspect ratio:
Hydraulic diameter:
Number of Channels:
where:
4. Analytical Procedure
4.1. Thermal and Fluid Dynamic Calculations
A MATLAB [28] code was developed incorporating the analytical technique outlined by Kandlikar et al. [11] to determine the thermal and fluid dynamic performance of the microchannel heat exchanger. The equations necessary for this analytical scheme are summarized below.
Energy Balance Equation:
Using Equation (14), one can determine the exit temperature of the fluid (T2) for a given inlet temperature (T1) and mass or volumetric flow rate, velocity, or Reynolds number.
Han [29] provided entrance length correlations for various aspect ratios. Unfortunately, our given aspect ratio was not available; therefore, interpolating his results was necessary. The hydrodynamic entry length Equation (15) was interpolated for our given aspect ratio of 1/7 from the data presented by Han [29].
Hydrodynamic Entrance Length:
Using Equation (15), the predicted hydrodynamic entrance length for the base fluid and nanofluids are the same for equal Reynolds number, if nanofluids are treated as a single-phase fluid. Most researchers thus far have found that dilute concentrations, 1–2 %, of nanofluids can be treated as a single-phase fluid to make computations easier and achieve results of reasonable accuracy. For a higher volumetric concentration of nanoparticles, a two-phase flow analysis will be essential.
Kandlikar et al. [11] presented a correlation for the thermal entrance length for rectangular microchannels from the data presented by Phillip [30].
Thermal Entrance Length:
Figure 2 shows the increase in thermal entry length at equal Reynolds number due to the dependence on the Prandtl number, which is dependent upon the concentration and the material of the nanoparticle.
According to Garimella and Singhal [31], it is reasonable to use fully developed hydrodynamic conditions in heat transfer analysis for microchannels. This is valid for fluids with a low Prandtl Number such as water (Pr = 7.03 @ 293K), but for EG/W (Pr = 44.37 @ 293K) and nanofluids (Al2O3 – 2% Pr = 48.30 @ 293K) the analysis would require accounting for developing fluid flow. Kandlikar et al. [11] presented Nusselt Number correlations for four-sided heating in fully developed flow as a function of aspect ratio, as presented by Equation (17). For the microchannel analyzed here with an aspect ratio (αc = 0.143), the fully developed Nusselt Number four-sided heating is 6.23.
Kandlikar et al. [11] presented correlations for the local Nusselt Number in the developing region for four-sided heating. Unfortunately, our chosen aspect ratio was not available and correlation was developed (Equation (18)) by extrapolating the data for aspect ratios of 0.25 and 1/3.
An average Nusselt Number is used to account for the developing flow effects, as shown in Equation (19).
where
After determining the Nusselt number, the average convective heat transfer coefficient can be determined using Equation (24).
Assuming constant and uniform heat transfer coefficient, we can determine the effective heat flux into the heat transfer fluid using Equation (25).
The maximum surface temperature inside the heatsink can be determined using Equation (26) which is an essential thermal performance parameter to examine.
where h2 represents the heat transfer coefficient at the outlet.
The pressure drop in the microchannel heat exchanger can be determined using Equation (27).
Shah and London [32] developed a polynomial correlation, Equation (28), for determining fRe as a function of aspect ratio.
Steinke and Kandlikar [33] developed a fifth-order polynomial curve-fit (Equation (29)) for incremental pressure drop number, K(∞), using the trapezoidal data presented by Kakac et al. [34] taking a rectangular channel as a subset of a trapezoid. The correlation has an accuracy of 0.04% compared to the data [34].
Pumping Power:
Friction power per unit surface area [35]:
An earlier investigation by Vajjha et al. [18] had shown that the dilute concentration of nanofluids of about 1–2% yielded the best benefit. The higher concentration makes the fluid more viscous, requiring more pumping power, whereas a dilute concentration does not impose a heavy pumping power penalty while giving a significant enhancement in heat transfer. Therefore, concentrations of 1 and 2% are preferred here to compare the thermal and fluid dynamic performances of different fluids.
Using Equation (31), a comparison can be made between the base fluids and three nanofluids for 1 and 2% concentration, as shown in Figure 3. From Figure 3, it is observed the nanofluids perform better than the EG/W base fluid. Aluminum and copper oxide nanofluids of 1% concentration perform better than their 2% concentration. As the concentration increases, the performance gain diminishes.
4.2. Comparison of Performances
Three analyses were conducted:
- Constant Reynolds Number: This analysis compares the thermal and fluid dynamic performance of the base fluid and nanofluids with a constant Reynolds number determines.
- Constant Maximum Surface Temperature: While maintaining a constant maximum surface temperature based on the base fluid calculations, determine the nanofluid fluid dynamic performance.
- Constant Pumping Power: While maintaining a constant pumping power based on the base fluid, compare the surface temperature as the cooling performance of nanofluids.
4.3. Operational Parameters
A MATLAB code was developed using the analysis scheme presented in Figure 4.
The analysis will be conducted using three nanofluids (Al2O3, CuO, and SiO2) of 1 and 2% concentrations and the base fluid, EG/W. The Reynolds number will be varied from 20 to 200. A uniform heat flux of 106 W/m2 is applied to the bottom of the microchannel heatsink. The fluid will have an inlet temperature of 308.15 K. All the testing parameters are summarized in Table 7.
5. Computational Fluid Dynamic Analysis
A three-dimensional conjugate heat transfer model using Fluent Release 18.1 [12] was developed to validate the analytical scheme by comparing key parameters such as pressure drop and Nusselt Number. With the assumption of uniform heat flux, fluid distribution and neglecting the effects of the outer channels, one can analyze the system by examining half of a single channel, as shown in Figure 5, by applying appropriate boundary conditions of symmetry. The cross-sectional coordinates are x and y, while the axial coordinate is z. The origin is at the bottom left corner.
The testing parameters for the numerical model are inlet velocity and fluid. The velocity is varied from 0.25 to 3.5 m/s for all three nanofluids (Al2O3, CuO, and SiO2) at 1 and 2% concentration as well as the base fluid, EG/W.
For this model, nanofluids are assumed to be a homogeneous engineered fluid with enhanced thermophysical properties. Past research has shown that the single-phase computational model is quite accurate for dilute nanoparticle concentrations of 1 to 2% but is acceptable up to 4%. Using a single-phase fluid model, the nanofluids are assumed to have thermophysical properties determined by correlations described in Section 2.1.2.
5.1. Governing Equations
The governing Equations (32)–(34) are for steady-state, incompressible, and laminar fluid flow in the microchannel while neglecting the gravitational force, natural convection, and the heat dissipation caused by viscosity. Equation (35) accounts for the heat conduction through the solid walls.
5.2. Numerical Methods
The system of governing Equations (32)–(35) were solved by the control volume approach using ANSYS Fluent [12]. For the solver setting, the standard pressure-based and steady-state were chosen. Using the laminar and energy model, the solution method utilized the Semi-Implicit Method for Pressure Linked Equations (SIMPLE) scheme with spatial discretization for gradient, pressure, and momentum being least squares cell based, second order, and second order upwind, respectively.
The models were initialized using the hybrid method, after which the residuals for continuity and velocities were closely monitored. Convergence was achieved for the simulation when the residuals were less than 10−6.
5.3. Boundary Conditions
The model has a uniform axial velocity and temperature applied at the inlet (z = 0 µm). At the base of the microchannel heatsink (y = 0 µm), a uniform heat flux is applied. The no-slip condition (V = 0 m/s) is applied to the channel wall surfaces. Symmetry boundary conditions were applied at y = 0 µm and y = sc/2 + ac.
5.4. Mesh Independence Study
A mesh independence study was conducted to achieve the least number of elements that can yield accurate computational results. Six different mesh sizes were chosen for discretizing the computational domain of the microchannel heatsink. They are Mesh-I, Mesh-II, Mesh-III, Mesh-IV, Mesh-V, and Mesh-VI. In each case, a converged solution of outlet velocity, outlet temperature, pressure drop, and average wall temperature was obtained. In Table 8, the difference between these parameters for each and the previous mesh are summarized. Mesh-I is the baseline with the least number of elements. For all six meshes, velocity, fluid temperature, and average wall temperature were in good agreement with each other. Pressure drop was the only parameter that slightly varied between each mesh with a maximum difference of 0.44%, which is quite low. Therefore, mesh independence was achieved for Mesh-I and the denser meshes. However, when the shear stress and the heat transfer coefficient in the rapidly diminishing entrance region were examined, they were not captured well by Mesh-I through Mesh-III due to the smaller number of elements, in comparison to the results from the refined Mesh-IV through Mesh-VI. From this mesh independence study, Mesh-IV was selected because of low computation time and used in all subsequent computational runs.
6. Results
6.1. Analytical Results and Computational Model Validation
The computational results were validated for all fluids by comparing the pressure drop and Nusselt Number. For brevity, here we presented the comparison of parameters for EG/W and summarized the results for the nanofluids in Table 9. Figure 6 shows the pressure drop in the MCHX for EG/W. The numerical results from Fluent and the results from Equation (27) are in good agreement within a maximum difference of 4.4%.
In Figure 7, a comparison between the numerical results and developing and fully developed Nusselt number for EG/W is shown. The developing flow average Nusselt Number for four-sided heating (Nuavg4, Equation (19)) matches well with the numerical results with a maximum difference of 3%.
The nanofluids had a similar agreement with the correlations with a maximum difference of 4.1% and 2.9% for pressure drop and Nusselt number, respectively, as shown in Table 9. This validates the ability of the analytical and computational scheme to predict the correct results for the thermal and fluid dynamic performance of the microchannel heatsink.
6.2. Constant Reynolds Number
Figure 8 shows that higher particle concentration and Reynolds number increases the convective heat transfer coefficient. The convective heat transfer coefficient was increased by 18% and 21% for Al2O3 - 2% and CuO - 2% nanofluids, respectively, over the base fluid EG/W. The SiO2 - 2% nanofluid due to relatively lower thermal conductivity increased the heat transfer coefficient by 8% only.
From Figure 9, we can see how nanofluids can reduce the maximum surface temperature of the heatsink when compared to the base fluid. Nanofluids show the greatest improvement at the lower Reynolds number with CuO - 2% dropping the maximum surface temperature approximately by 13.5 K. Al2O3 - 2% also showed similar performance by lowering the maximum surface temperature by 10.4 K.
From Figure 8 and Figure 9, the nanofluids showed great thermal performance when compared to their base fluid (EG/W). This increase in thermal performance will come at the cost of increased pumping power, as shown in Figure 10. CuO - 2% increased the pumping power requirements by as much as 180% (+1–16 W) for Re > 55 and for a Reynolds number of 20 the increase was 300% (+0.08 W).
6.3. Constant Maximum Surface Temperature
While maintaining a constant maximum surface temperature based on the base fluid calculations, determine the nanofluid fluid dynamic performance. With this analysis, we can determine how much pumping power is required for nanofluids while maintaining the same conditions of the base fluid.
In Figure 11, we can see that the nanofluids can meet the same constraints as the base fluid but with less pumping power requirements. The figure shows that nanofluids with concentrations of 1% and 2% can perform better (reduce pumping power) than the base fluid. The best performing nanofluids are Al2O3 - 1% and CuO - 1% that reduced the pumping power by approximately 23.0 and 22.2%, respectively, while maintaining the maximum surface temperature at 315 K. This occurred with a Reynolds number of 153 and 144 for Al2O3 and CuO, respectively. Here nanofluids exhibited better performance at the higher Reynolds number (≥100) versus the lower Reynolds number (≤ 100). In further analysis, nanofluids exhibited a continued decrease in pumping power to a Reynolds number of 300, beyond which the pumping power gradually increases slightly.
With a reduction in pumping power, the nanofluids would also reduce entropy generation, as shown in Figure 12. Using Equation (36), entropy generation per unit length [36] can be calculated.
The minimization of entropy generation is essential to enhance the thermal performance of heat exchangers. The lower is the entropy generation; the better is the heat exchanger. Entropy generation is proportional to the irreversibility in a thermodynamic process. By reducing entropy generation, we lower irreversibility and produce a better thermodynamic efficiency for the heat exchanger based on the second law of thermodynamics. Figure 12 shows 1% concentration nanofluids generated a less entropy than compared to the base fluid. Particularly, Al2O3 - 1% and CuO - 1% nanofluids decreased entropy generation by 24% than the base fluid, while performing the same cooling. Thus, some nanofluids of low concentration can yield superior performance in heat exchangers.
6.4. Constant Pumping Power
In this analysis, the pumping power is held constant for all fluids. With this constraint, we can determine various thermal performance, such as maximum and entropy generation for the microchannel heatsink with nanofluids.
In Figure 13, it is observed that the nanofluids cannot reduce the maximum surface temperature while maintaining the equal pumping power requirements of the base fluid.
7. Conclusions
From analytical and CFD modeling of nanofluids flow in a microchannel based on a detailed examination of the results, the following conclusions are drawn.
Considering the condition of equal friction power per unit surface area, nanofluids generated higher heat transfer coefficients than the base fluid, as shown in Figure 3.
The pressure drop and Nusselt number results for a range of Reynolds numbers agree quite well within 4.5% between the analytical model of Kandlikar et al. and our ANSYS model for dilute concentration of nanofluids.
From Figure 8, the CuO - 2% exhibits the biggest improvement in the heat transfer coefficient compared to the EG/W base fluid over the range 20 ≤ Re ≤ 200. The inside heat transfer coefficient for the CuO - 2% 60/40 EG/W nanofluid exceeds that of the base fluid by 21% at Re = 200. The highest value is offered by CuO, followed by Al2O3 and then SiO2 nanofluid. An increase in nanofluid concentration increases the heat transfer coefficient.
From Figure 9, observe that considering equal inlet Reynolds number, all the nanofluids examined lowered the maximum temperature of the wall temperature of the heatsink. The wall temperature can be lowered from 349 K using the base fluid to 335 K at a Reynolds number of 20. In electronic cooling applications where microchannel heat exchangers are used, nanofluids hold promise for lowering operating temperatures of critical components and contribute to increased life and system reliability.
The higher heat transfer coefficient comes at a pumping power penalty. From Figure 10, one observes that the CuO - 2% nanofluid requires the highest pumping power among all nanofluids analyzed here considering equal Reynolds number.
While maintaining equivalent thermal performance to the base fluid, nanofluids reduce the pump power requirements. From Figure 11, Al2O3 - 1% and CuO - 1% reduced the pumping power by approximately 23.0 and 22.2%, respectively, while maintaining the maximum heatsink surface temperature at 315 K.
Entropy generation is proportional to the irreversibility in a thermodynamic process. By reducing entropy generation, the irreversibility is lowered and produces a better thermodynamic efficiency for the heat exchanger based on the second law of thermodynamics. Two of the nanofluids examined generated lower entropy compared to the base fluid, as shown in Figure 12. Al2O3 - 1% and CuO - 1% nanofluids both decreased entropy generation by 24% when compared to the base fluid with maintaining the same maximum heatsink surface temperature as the base fluid.
The improvement in heat transfer performance in microchannels with nanofluids comes at the cost of higher pumping power. While maintaining an equal thermal performance to the base fluid, nanofluids can reduce the pumping power requirements and contribute to a more thermodynamically efficient heat exchange process.
Author Contributions
Conceptualization, D.R.R., R.S. and D.K.D.; Methodology, D.R.R.; Software, D.R.R.; Validation, D.R.R. and R.S.; Resources, D.K.D.; Data Curation, D.R.R.; Writing-Original Draft Preparation, D.R.R.; Writing-Review & Editing, D.R.R., R.S., and D.K.D.; Visualization, D.R.R.; Supervision, D.K.D.; Project Administration, D.K.D.; Funding Acquisition, D.R.R. All authors have read and agreed to the published version of the manuscript.
Funding
This research received no external funding.
Acknowledgments
Financial support from the Mechanical Engineering Department of the University of Alaska Fairbanks is gratefully acknowledged.
Conflicts of Interest
The authors declare no conflict of interest.
References
- Bergman, T.L.; Lavine, A.S.; Incropera, F.P.; DeWitt, D.P. Fundamentals of Heat and Mass Transfer; Wiley: Hoboken, NJ, USA, 2011. [Google Scholar]
- Tuckerman, D.B.; Pease, R.F.W. High-performance heat sinking for VLSI. IEEE Electron. Device Lett. 1981, 2, 126–129. [Google Scholar] [CrossRef]
- Koo, J.; Kleinstreuer, C. A new thermal conductivity model for nanofluids. J. Nanoparticle Res. 2005, 7, 324. [Google Scholar] [CrossRef]
- Pak, B.C.; Cho, Y.I. Hydrodynamic and heat transfer study of dispersed fluids with submicron metallic oxide particles. Exp. Heat Transfer. 1998, 11, 151–170. [Google Scholar] [CrossRef]
- Vajjha, R.S.; Das, D.K. Experimental determination of thermal conductivity of three nanofluids and development of new correlations. Int. J. Heat Mass Transf. 2009, 52, 4675–4682. [Google Scholar] [CrossRef]
- Minkowycz, W.J.; Sparrow, E.M.; Abraham, J.P. Nanoparticle Heat Transfer and Fluid Flow; CRC Press/Taylor & Francis Group: Boca Raton, FL, USA, 2013. [Google Scholar]
- Ray, D.R.; Das, D.K. Superior Performance of Nanofluids in an Automotive Radiator. J. Therm. Sci. Eng. Appl. 2014, 6, 041002. [Google Scholar] [CrossRef]
- Kleinstreuer, C.; Li, J.; Feng, Y. Computational Analysis of Enhanced Cooling Performance and Pressure Drop for Nanofluid Flow in Microchannel. In Nanoparticle Heat Transfer and Fluid Flow; Minkowycz, W.J., Ed.; CRC Press/Taylor & Francis Group: Boca Raton, FL, USA, 2013; pp. 249–276. [Google Scholar]
- Masoumi, N.; Sohrabi, N.; Behzadmehr, A. A new model for calculating the effective viscosity of nanofluids. J. Phys. D 2009, 42, 055501. [Google Scholar] [CrossRef] [Green Version]
- Bianco, V.; Manca, O.; Nardini, S.; Vafai, K. Heat Transfer Enhancement with Nanofluids; CRC Press/Taylor & Francis Group: Boca Raton, FL, USA, 2015. [Google Scholar]
- Kandlikar, S.G.; Garimella, S.; Li, D.; Colin, S.; King, M. Heat Transfer and Fluid Flow in Minichannels and Microchannels; Elsevier Science & Technology: Kidlington, Oxford, UK, 2006. [Google Scholar]
- Fluent Academic Research, Release 18.1; ANSYS, Inc.: Canonsburg, PA, USA, 2017.
- American Society of Heating, Refrigerating and Air-Conditioning Engineers. ASHRAE Handbook: Fundamentals; American Society of Heating, Refrigeration and Air-Conditioning Engineers: Atlanta, GA, USA, 2005. [Google Scholar]
- Yaws, C.L. Physical Properties: A Guide to the Physical, Thermodynamic, and Transport Property Data of Industrially Important Chemical Compounds; McGraw-Hill: New York, NY, USA, 1977. [Google Scholar]
- White, F.M. Fluid Mechanics; McGraw-Hill: New York, NY, USA, 2003. [Google Scholar]
- Alfa Aesar, Nanoparticle and Dispersions. Available online: https://www.alfa.com/media/docs/Nanoparticles.pdf (accessed on 20 May 2020).
- Vajjha, R.S.; Das, D.K. Specific heat measurement of three nanofluids and development of new correlations. J. Heat Transfer. 2009, 131, 1–10. [Google Scholar] [CrossRef]
- Vajjha, R.S.; Das, D.K. A review and analysis on influence of temperature and concentration of nanofluids on thermophysical properties, heat transfer and pumping power. Int. J. Heat Mass Transf. 2012, 55, 4063–4078. [Google Scholar] [CrossRef]
- Çengel, Y.A. Heat and Mass Transfer: A Practical Approach; McGraw-Hill: New York, NY, USA, 2007. [Google Scholar]
- Vajjha, R.S.; Das, D.K.; Kulkarni, D.P. Development of new correlations for convective heat transfer and friction factor in turbulent regime for nanofluids. Int. J. Heat Mass Transf. 2010, 53, 4607–4618. [Google Scholar] [CrossRef]
- Vajjha, R.S.; Das, D.K.; Mahagaonkar, B.M. Density measurement of different nanofluids and their comparison with theory. Pet. Sci. Technol. 2009, 27, 612–624. [Google Scholar] [CrossRef]
- Xuan, Y.; Roetzel, W. Conceptions for heat transfer correlation of nanofluids. Int. J. Heat Mass Transf. 2000, 43, 3701–3707. [Google Scholar] [CrossRef]
- Hamilton, R.L.; Crosser, O.K. Thermal Conductivity of Heterogeneous Two-Component Systems. Ind. Eng. Chem. Fundam. 1962, 1, 187–191. [Google Scholar] [CrossRef]
- Sahoo, B.C.; Das, D.K.; Vajjha, R.S.; Satti, J.R. Measurement of the Thermal Conductivity of Silicon Dioxide Nanofluid and Development of Correlations. J. Nanosci. Nanotechnol. 2013, 3, 041006. [Google Scholar] [CrossRef]
- Namburu, P.K.; Kulkarni, D.P.; Dandekar, A.; Das, D.K. Experimental investigation of viscosity and specific heat of silicon dioxide nanofluids. Micro Nano Lett. 2007, 2, 67–71. [Google Scholar] [CrossRef]
- Namburu, P.K.; Kulkarni, D.P.; Misra, D.; Das, D.K. Viscosity of copper oxide nanoparticles dispersed in ethylene glycol and water mixture. Exp. Therm. Fluid Sci. 2007, 32, 397–402. [Google Scholar] [CrossRef]
- Sahoo, B.C.; Vajjha, R.S.; Ganguli, R.; Chukwu, G.A.; Das, D.K. Determination of rheological behavior of aluminum oxide nanofluid and development of new viscosity correlations. Pet. Sci. Technol. 2009, 27, 1757–1770. [Google Scholar] [CrossRef]
- Matlab 2018a; The MathWorks, Inc.: Natick, MA, USA, 2018.
- Han, L.S. Hydrodynamic Entrance Lengths for Incompressible Laminar Flow in Rectangular Ducts. J. Appl. Mech. 1960, 27, 403–409. [Google Scholar] [CrossRef]
- Phillips, R.J. Forced Convection, Liquid Cooled, Microchannel Heat Sinks. Master’s Thesis, Massachusetts Institute of Technology, Cambridge, MA, USA, January 1987. [Google Scholar]
- Garimella, S.V.; Singhal, V. Single-Phase Flow and Heat Transport and Pumping Considerations in Microchannel Heat Sinks. Heat Transf. Eng. 2004, 25, 15–25. [Google Scholar] [CrossRef] [Green Version]
- Shah, R.K.; London, A.L. Laminar Flow Forced Convection in Ducts: A Source Book for Compact Heat Exchanger Analytical Data; Academic Press: New York, NY, USA, 1978. [Google Scholar]
- Steinke, M.E.; Kandlikar, S.G. Single-phase liquid friction factors in microchannels. Int. J. Therm. Sci. 2006, 45, 1073–1083. [Google Scholar] [CrossRef]
- Kakaç, S.; Shah, R.K.; Aung, W. Handbook of Single-Phase Convective Heat Transfer; Wiley: New York, NY, USA, 1987. [Google Scholar]
- Kays, W.M.; London, A.L. Compact Heat Exchangers; Krieger Publishing Company: Malabar, FL, USA, 1984. [Google Scholar]
- Bejan, A. Entropy Generation through Heat and Fluid Flow; Wiley: New York, NY, USA, 1982. [Google Scholar]
Figure 1.
A typical configuration of a microchannel heatsink.

Figure 2.
Thermal entry length for various fluids and Reynolds Number.

Figure 3.
A comparison of the heat transfer coefficient and friction power per unit surface area with three nanofluids of 1 and 2% concentration and base fluid, EG/W.
Figure 3.
A comparison of the heat transfer coefficient and friction power per unit surface area with three nanofluids of 1 and 2% concentration and base fluid, EG/W.

Figure 4.
Heat Exchanger Analysis Scheme.

Figure 5.
Computational model.

Figure 6.
Comparison of pressure drop between numerical results and Equation (27) for EG/W.

Figure 7.
Comparison of Nusselt number between numerical results and correlations for EG/W.

Figure 8.
The effects of Reynolds number on the heat transfer coefficient.
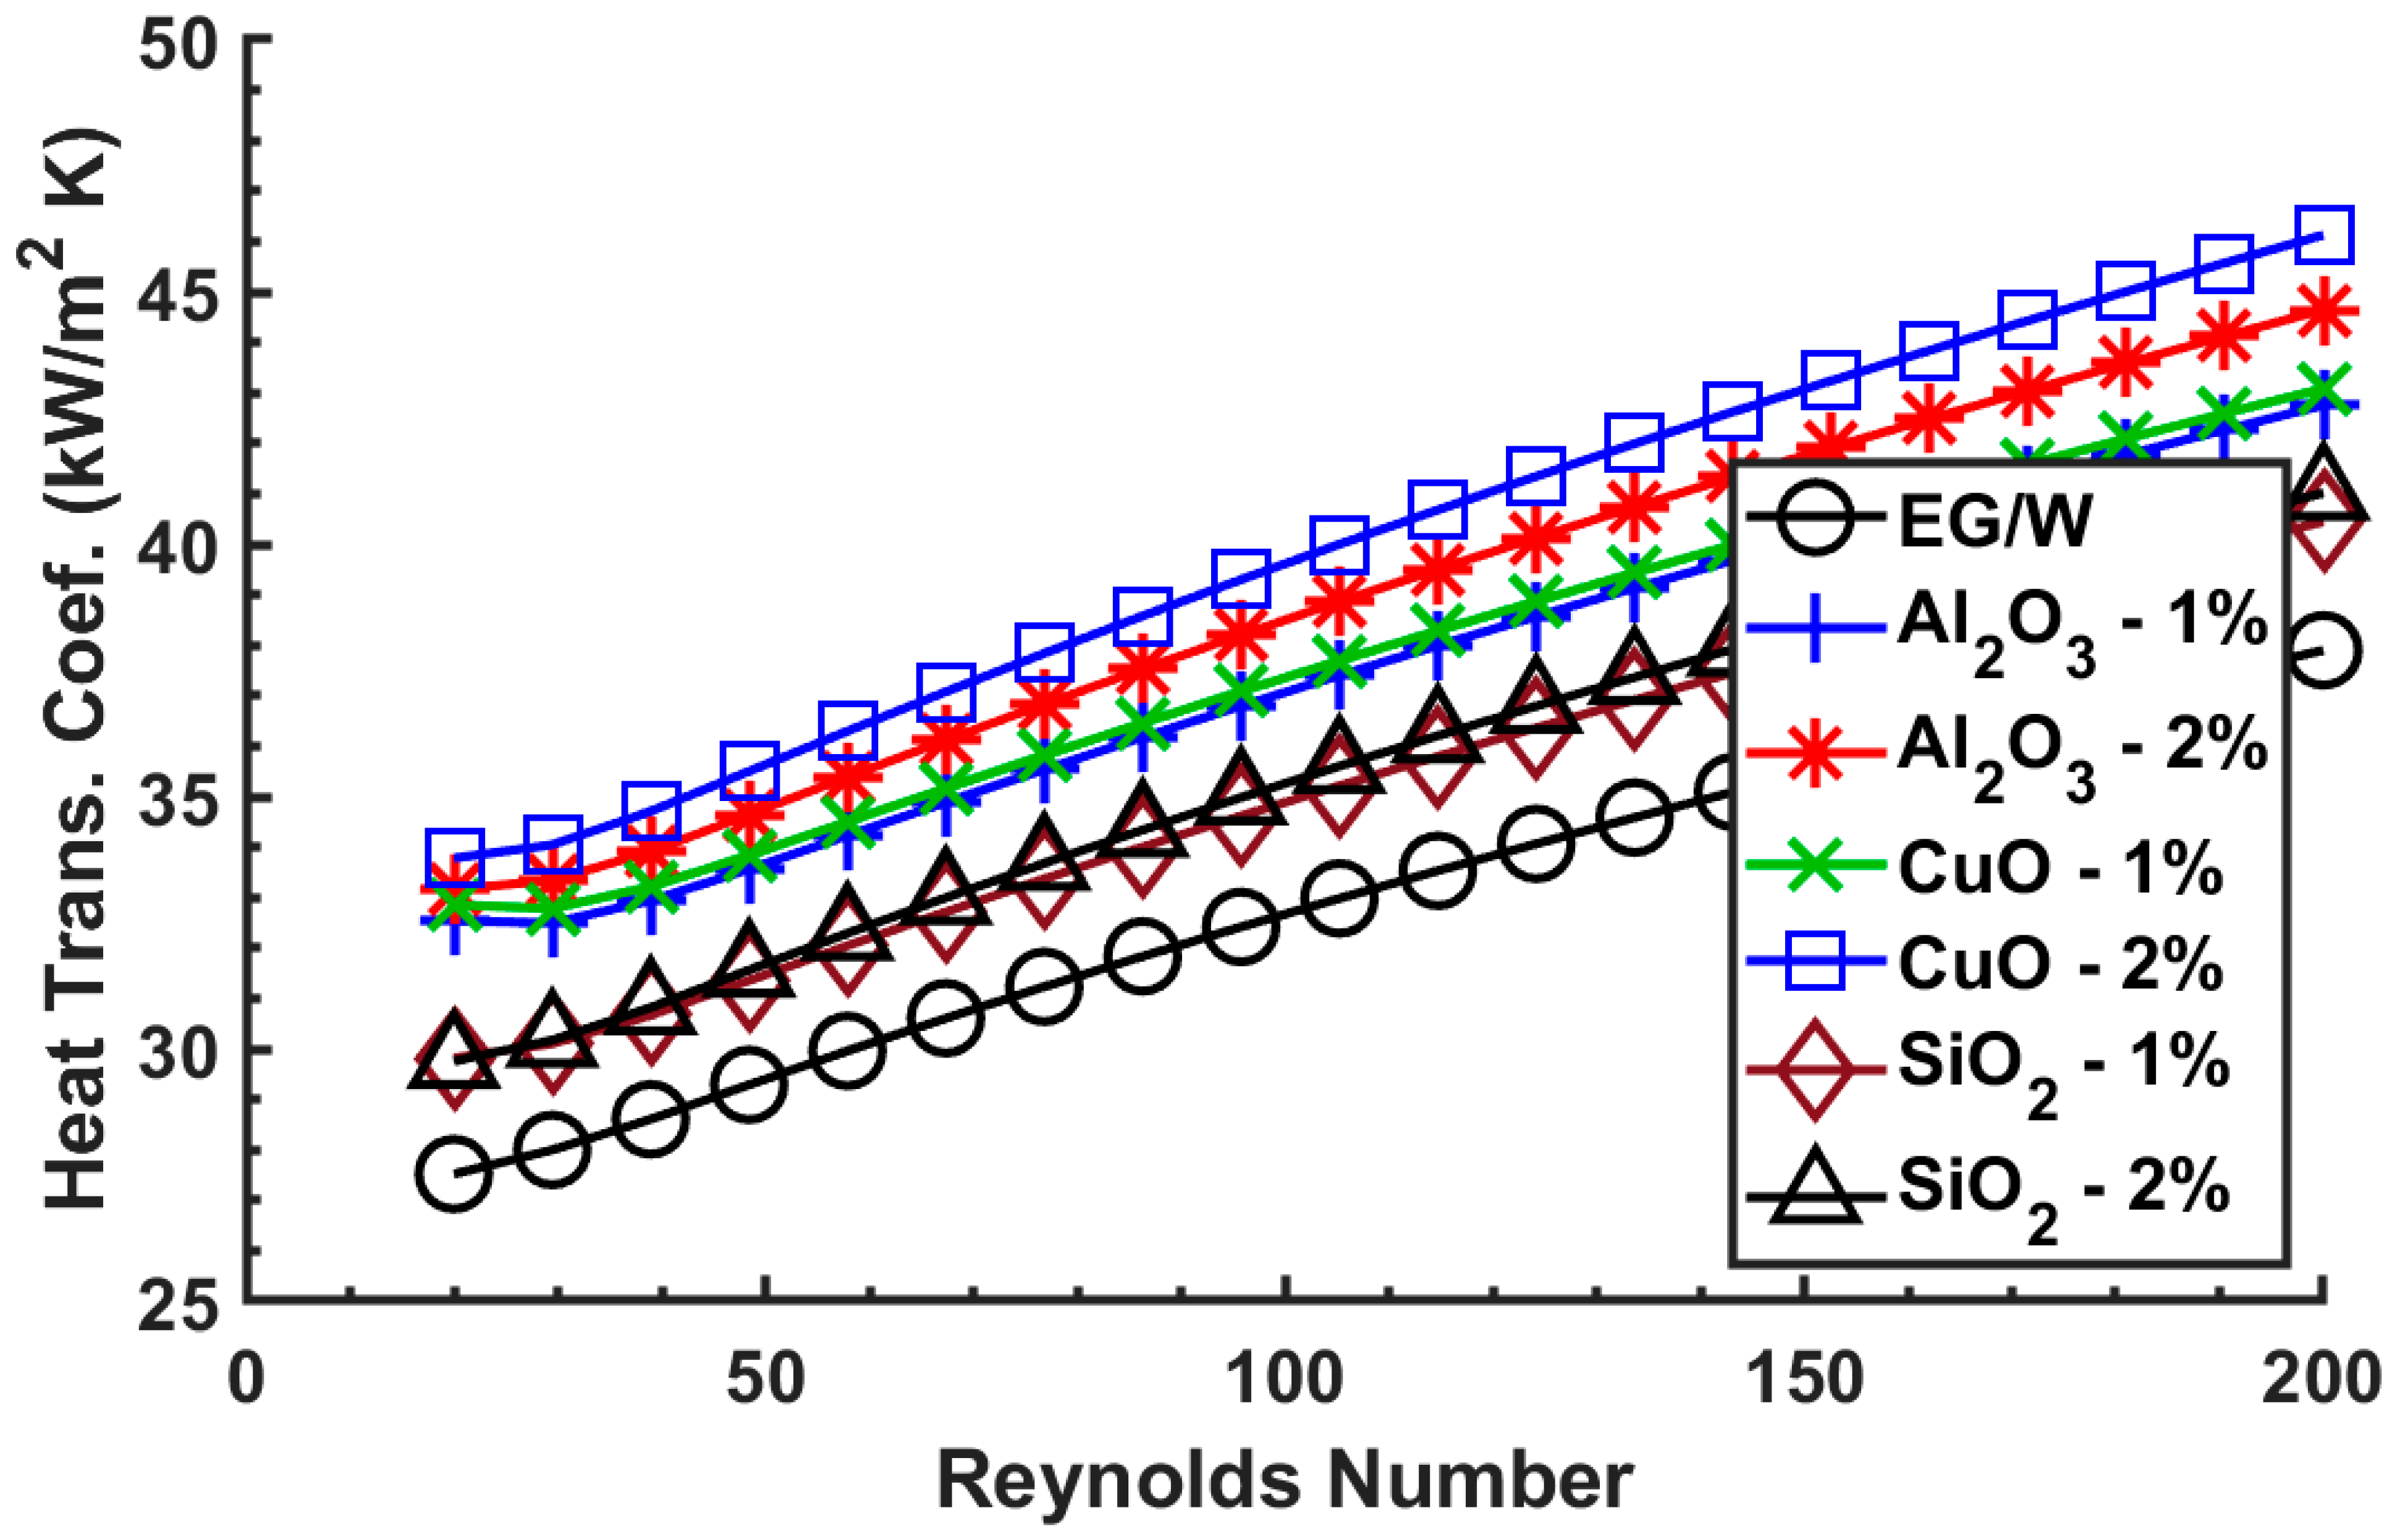
Figure 9.
Effects of Reynolds number on maximum surface temperature.

Figure 10.
The effects of Reynolds number on pumping power.

Figure 11.
Pumping power reduction for equal maximum surface temperature.

Figure 12.
Entropy generation reduction while maintaining thermal performance.
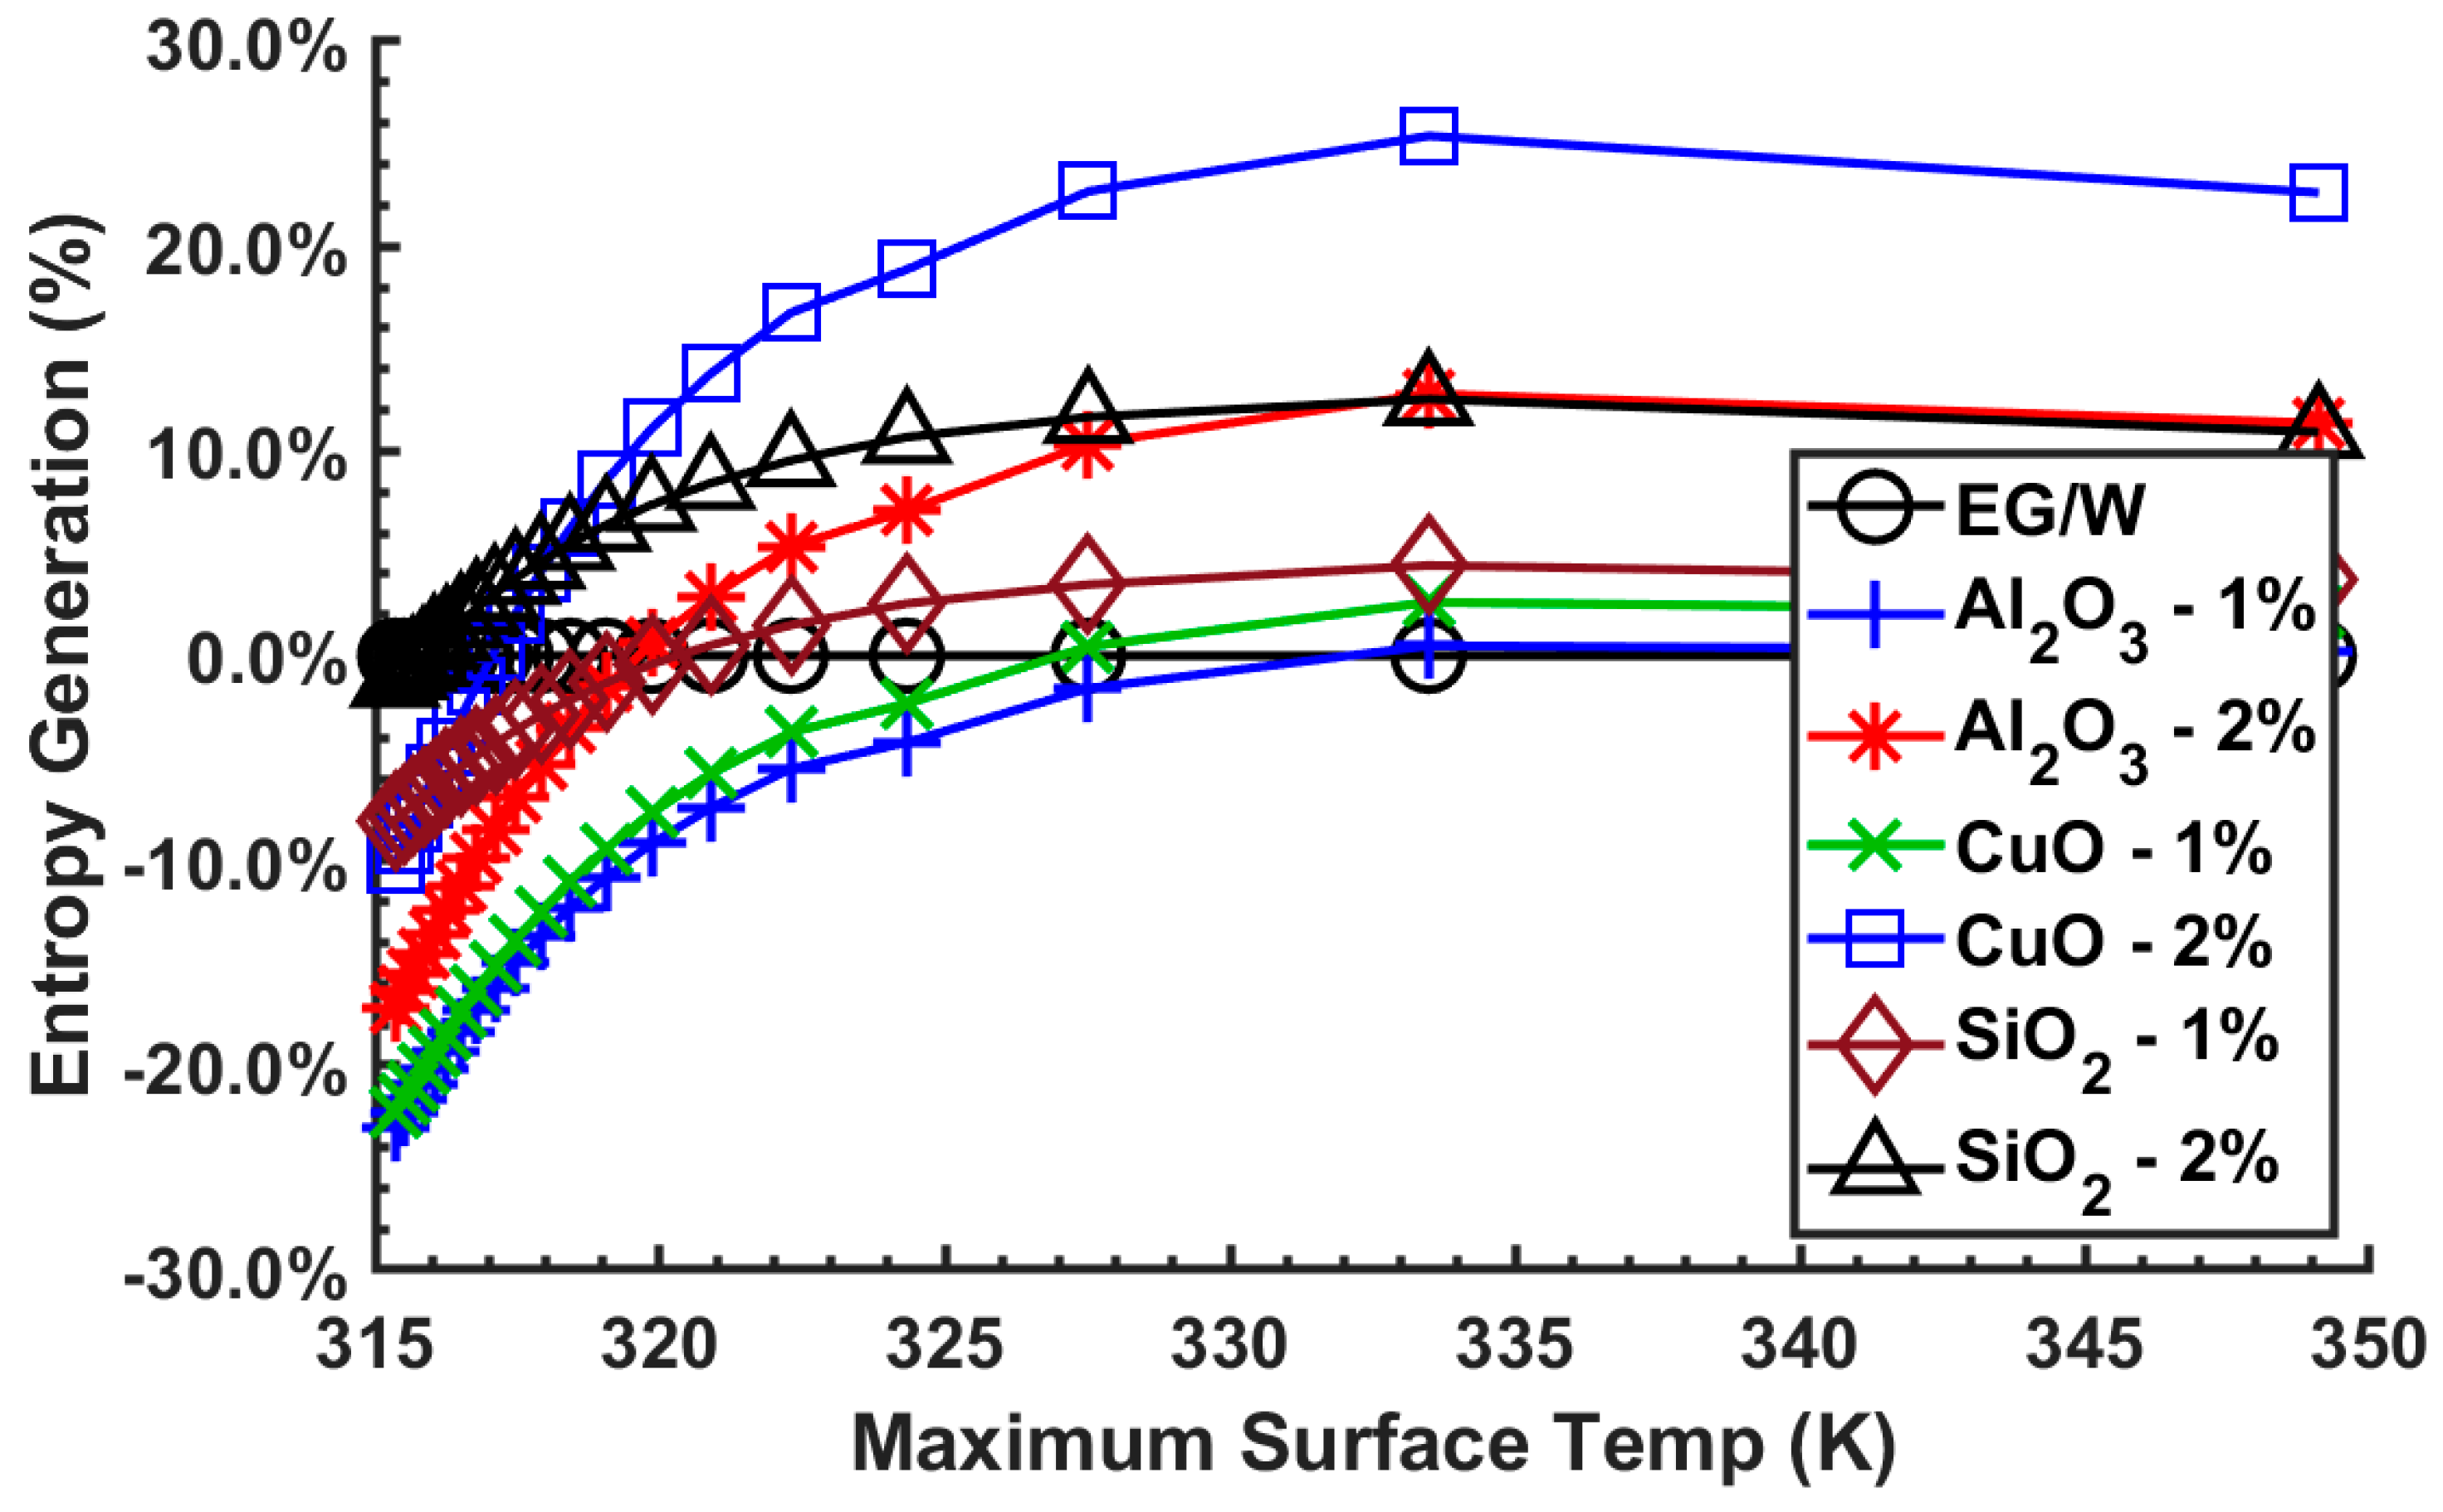
Figure 13.
Maximum average surface temperature with equal pumping power.

Table 1.
The 60:40 ethylene glycol and water (EG/W) thermophysical properties correlations.
| Property | Correlation | R2 | Error |
|---|---|---|---|
| Density | 238 K ≤ T ≤ 398 K | ||
| 1.00 | 0.01% | ||
| Viscosity | 273 K ≤ T ≤ 398 K | ||
| 1.00 | 0.91% | ||
| Specific Heat | 238 K ≤ T ≤ 398 K | ||
| 1.00 | 0.01% | ||
| Thermal Conductivity | 238 K ≤ T ≤ 398 K | ||
| 0.99 | 0.11% |
The subscript “0” refers to the fluid property at the standard reference temperature of 273.15 K (T0).
Table 3.
Curve-fit coefficients for the specific heat of Al2O3 nanofluid.
| Nanofluid | A | B | C | Max. Deviation (%) | Avg. Absolute Deviation (%) |
|---|---|---|---|---|---|
| Al2O3 | 0.2432703 | 0.5179 | 0.4250 | 5 | 2.28 |
Table 4.
Curve-fit relations for different nanofluids valid in the temperature range of 298 K ≤ T ≤ 363 K and specified concentration ranges.
Table 4.
Curve-fit relations for different nanofluids valid in the temperature range of 298 K ≤ T ≤ 363 K and specified concentration ranges.
| Type of Particle | β | Concentration |
|---|---|---|
| Al2O3 | ||
| CuO | ||
| SiO2 |
Table 5.
Curve-fit coefficient for different nanofluids valid in the temperature range of 273 K ≤ T ≤ 363 K and specified concentration ranges.
Table 5.
Curve-fit coefficient for different nanofluids valid in the temperature range of 273 K ≤ T ≤ 363 K and specified concentration ranges.
| Nanoparticle | A | B | Concentration |
|---|---|---|---|
| Al2O3 | 0.983 | 12.959 | |
| CuO | 0.9197 | 22.8539 | |
| SiO2 | 1.0249 | 6.5972 |
Table 6.
Microchannel dimensions and material properties.
| Parameter | Symbol | Value |
|---|---|---|
| Channel height (µm) | 350 | |
| Thickness of bottom/top (µm) | 180 | |
| Channel Spacing (µm) | 40 | |
| Channel width (µm) | 50 | |
| Width (mm) | 10 | |
| Length (mm) | 10 | |
| Height (µm) | 530 | |
| Heat Exchanger Material | Silicon | |
| Density (kg/m3) | 1333 | |
| Specific Heat (J/kg∙K) | 700 | |
| Thermal Conductivity (W/m∙K) | 180 | |
Table 7.
Testing Parameters.
| Parameters | Symbol | Values |
|---|---|---|
| Fluid | -- | EG/W, Al2O3, CuO, SiO2 |
| Practical range of Reynolds number | Re | 20 – 200 |
| Nanoparticle Concentration | ϕ | 1 & 2% |
| Heat flux (W/m2) | q” | 106 |
| Initial temperature (K) | T0 | 308.15 |
Table 8.
Mesh Independent Study.
| Name | # of Elements | Computation Time | Velocity | Outlet Temp. | Pressure Drop | Average Wall Temp. |
|---|---|---|---|---|---|---|
| Mesh-I | 600,000 | - | - | - | - | - |
| Mesh-II | 756,000 | 141% | 0.00% | 0.00% | 0.44% | 0.00% |
| Mesh-III | 944,000 | 141% | 0.00% | 0.00% | 0.33% | 0.00% |
| Mesh-IV | 1,152,000 | 137% | 0.00% | 0.00% | 0.21% | 0.00% |
| Mesh-V | 1,480,000 | 151% | 0.00% | 0.00% | 0.23% | 0.00% |
| Mesh-VI | 2,016,000 | 169% | 0.00% | 0.00% | 0.21% | 0.00% |
Table 9.
Nanofluids results from a comparison between analytical and CFD schemes.
| Parameter | Al2O3 - 1% | Al2O3 - 2% | CuO - 1% | CuO - 2% | SiO2 - 1% | SiO2 - 2% |
|---|---|---|---|---|---|---|
| Pressure Drop (%) | 3.9 | 3.8 | 3.8 | 3.7 | 4.1 | 4.1 |
| Nusselt Number (%) | 2.7 | 2.7 | 2.6 | 2.7 | 2.8 | 2.9 |
© 2020 by the authors. Licensee MDPI, Basel, Switzerland. This article is an open access article distributed under the terms and conditions of the Creative Commons Attribution (CC BY) license (http://creativecommons.org/licenses/by/4.0/).
Share and Cite
MDPI and ACS Style
Ray, D.R.; Strandberg, R.; Das, D.K. Thermal and Fluid Dynamic Performance Comparison of Three Nanofluids in Microchannels Using Analytical and Computational Models. Processes 2020, 8, 754. https://doi.org/10.3390/pr8070754
AMA Style
Ray DR, Strandberg R, Das DK. Thermal and Fluid Dynamic Performance Comparison of Three Nanofluids in Microchannels Using Analytical and Computational Models. Processes. 2020; 8(7):754. https://doi.org/10.3390/pr8070754
Chicago/Turabian StyleRay, Dustin R., Roy Strandberg, and Debendra K. Das. 2020. "Thermal and Fluid Dynamic Performance Comparison of Three Nanofluids in Microchannels Using Analytical and Computational Models" Processes 8, no. 7: 754. https://doi.org/10.3390/pr8070754
Note that from the first issue of 2016, this journal uses article numbers instead of page numbers. See further details here.