Surface Functionalization of Biochar from Oil Palm Empty Fruit Bunch through Hydrothermal Process


1
Department of Biological Functions Engineering, Graduate School of Life Science and Systems Engineering, Kyushu Institute of Technology, 2-4 Hibikino, Wakamatsu, Kitakyushu, Fukuoka 808-0196, Japan
2
Department of Applied Chemistry, Faculty of Engineering, Kyushu Institute of Technology, 1-1 Sensuicho, Tobata, Kitakyushu, Fukuoka 804-8550, Japan
3
Department of Bioprocess Technology, Faculty of Biotechnology and Biomolecular Sciences, Universiti Putra Malaysia, UPM Serdang, Selangor 43400, Malaysia
4
Collaborative Research Centre for Green Materials on Environmental Technology, Kyushu Institute of Technology, 2-4 Hibikino, Wakamatsu, Kitakyushu, Fukuoka 808-0196, Japan
*
Author to whom correspondence should be addressed.
Processes 2021, 9(1), 149; https://doi.org/10.3390/pr9010149
Submission received: 29 December 2020
/
Revised: 11 January 2021
/
Accepted: 11 January 2021
/
Published: 13 January 2021
(This article belongs to the Special Issue Wastewater Treatment Processes)
Abstract
:The use of biochar as an adsorbent for wastewater treatment purposes has been hindered due to its lower surface area compared to activated carbon. Current research on increasing surface functional groups on biochar surfaces to improve its adsorption performance suggests using high chemical concentration and long period of modification. This study solves these problems by focusing on improving surface functionalities of biochar via the hydrothermal functionalization process. Oil palm empty fruit bunch biochar was functionalized using autoclave with nitric acid as the functionalization agent. Functionalized biochar properties such as Brunauer–Emmett–Teller (BET) surface area and surface functional groups were analyzed and compared with untreated biochar. Fourier Transform Infrared (FTIR) spectroscopic analysis shows a significant increase in absorption by oxygen functional groups and is corroborated with energy dispersive X-ray (EDX) analysis. The process does not result in any major change in surface morphology and reduction in surface area value. Methylene blue (MB) adsorption test shows 7 times increase in adsorption performance. These results show that the simple hydrothermal functionalization process successfully functionalizes the biochar surface and improves its performance without affecting its surface area at lower concentration, and shorter time compared to previous studies. This result, with future large-scale experimentation using real-life equipment in palm oil mills, would provide a better technology that can be implemented in the industry.
1. Introduction
Production of carbon material (biochar) from biomass for different purposes has gained interest in the sustainable technology development scene due to its simple and low-cost process. A large amount of biomass can be processed in one or two steps with a relatively high yield of 20–40% [1] and only be limited with the size of the reactor used. Reports have shown that a large variety of biomass from different sources such as soft/hardwoods [2], fibers [3], shells [4], and even byproducts of fermentation [5] and wastewater treatment processes [6] can be used as feedstock for biochar production. Biochar can be used in a variety of situations mainly in wastewater treatment [7] and soil conditioning [8] due to its inherent adsorptive capabilities. Biochar also indirectly reduces carbon emission through sequestering carbon from the environment and reducing greenhouse gas emission, by converting active carbon that can be used in nature or through human activities into a stable form of carbon (biochar) [9].
Due to its advantages, the carbonization of oil palm biomass has attracted more research and development in recent years as a more environmental-friendly method of disposing of an abundant amount of biomass produced by the palm oil industry in Malaysia. In 2019 alone, 151.2 million metric ton (MMT) fresh fruit bunches were processed [10,11], producing solid and liquid biomass, with oil palm empty fruit bunch (OPEFB) as the largest fraction of solid biomass at about 33.3 MMT [12]. The current practice of reusing OPEFB as mulching and crude compost in the plantation can lead to leaching of nutrients into the ground soil and proliferation of pests such as rodents and rhinoceros beetle [13,14]. With carbonization, a large amount of OPEFB can be processed at once as reported by Idris et al., with a successful self-sustaining carbonization process, which can be upscaled to 3 tons per run [15,16]. These show the feasibility of OPEFB as biochar feedstock and with an increase in production scale, the cost can be driven down due to the economy of scale effect. While OPEFB biochar itself has a high gross calorific value (GCV) and can be used as fuel, the value of OPEFB biochar can be improved if it can be used as an adsorbent in wastewater treatment application.
The major problem in utilizing OPEFB biochar as an adsorbent is the relatively low surface area of the biochar without any activation step. It is widely known that the adsorption performance and capacity of carbon material can be improved through the activation process [17,18]. Subjecting biochar to the activation step, either using gaseous agents such as CO2 or H2O [19,20] or using chemical agents such as phosphoric acid, zinc chloride and potassium hydroxide [21] will increase the surface area significantly, hence improving its adsorption capability. However, the activation process usually requires high-temperature treatment, high concentration chemicals, and specialized equipment that increases energy, waste, and capital cost, respectively. It is imperative that a method to improve the adsorption performance of biochar using available technology with lower energy requirements and low waste generation needs to be studied.
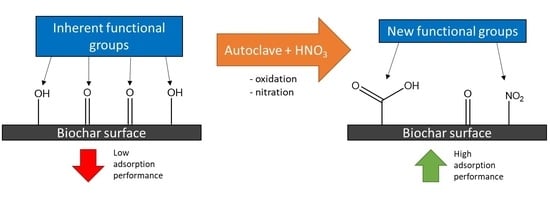
Surface functionalization has been suggested as another way to improve biochar adsorption performance via the introduction of surface functional groups to the carbon surface of the biochar. While biochar inherently possesses some functional groups such as hydroxyl and carbonyl groups, the amount is small compared to the bulk surface of the biochar [22]. Abundant studies and multiple reviews published in the past decade shows the positive effect of increasing surface functional groups towards the performance of biochar and other carbon material adsorption capacity, especially for dyes and heavy metals. The functional groups improve its hydrophilicity, increasing efficiency in wastewater application, and the acidic oxygen functional groups increase electrostatic interaction between the functional groups and the adsorbate molecule, especially negatively charged molecules such as heavy metals and cationic dyes [23,24,25,26]. Biochar surface can be functionalized using oxidizing chemicals such as nitric acid to increase its oxygen surface functional groups. Even though multiple studies report successful surface functionalization of biochar using nitric acid, the process usually requires a long period of time [27] and a very high concentration of nitric acid. In addition to that, the functionalization process tends to affect the morphology and pore structure of the carbon material modified, resulting in a reduction in surface area. Reduction in surface area, use of high concentration of caustic chemicals, and the prohibitively long time needed inhibit the implementation of the functionalization process in the industry due to the danger and cost it can incur. With this problem in hand, a functionalization process using an autoclave, which are readily available in palm oil mills as sterilizers, is suggested to accelerate biochar functionalization to improve biochar surface functionalities and subsequently its adsorption performance. The difference between autoclave and other reported methods of modification is the combination of elevated temperature and pressure during treatment. It is proposed that this will increase the degradation of nitric acid into nitrogen-containing species such as nitrous acid, which can also oxidize organic structures [28]. With multiple routes of oxidation available, the process efficiency can be greatly enhanced.
This process would reduce the cost of chemicals and equipment, reduce the danger related to the use of high concentration chemicals, and decrease the total time needed for the successful production of functionalized biochar. The additional benefit of producing higher-value products in the form of an adsorbent that can be sold can indirectly incentivize the industry to implement this process in their day to day business, promoting more research and development through collaboration with businesses and industries.
In this study, a simple functionalization process for biochar as an adsorbent from oil palm biomass was developed through the hydrothermal method using an autoclave. In this system, nitric acid was used as an oxidation agent to functionalize the surface of biochar to increase its oxygen surface functional groups. The autoclave was used as an apparatus to accelerate and increase the efficiency of the functionalization process. In addition to the increased efficiency, the functionalization process does not significantly change the structure of the biochar, as shown in scanning electron microscopy (SEM) analysis. In other words, the hydrothermal functionalization process successfully increases the amount of oxygen surface functional groups on the surface of the biochar using a lower concentration of nitric acid, a shorter period of time, and a simpler process compared to other surface functionalization process reported previously. Surface functional group change was observed through FTIR and EDX analysis. Functionalized biochar performance was also measured through the adsorption of methylene blue dye as a proof of concept.
2. Materials and Methods
2.1. Sample Preparation
Oil palm empty fruit bunch was collected from Seri Palm Oil Mill, Dengkil, Selangor. Biomass was dried in an oven for 48 h to reduce the initial moisture content before being ground and sieved to 2 mm in size. Ground biomass moisture content was measured using a moisture analyzer (Shimadzu, MOC-120H, Kyoto, Japan) and kept in an airtight container before carbonization. Concentrated nitric acid (69%), concentrated hydrochloric acid (36.0%), and methylene blue (98.5%) were obtained from FUJIFILM Wako Pure Chemical Corporation, Osaka, Japan. Deionized water (18.25 MΩ·cm) was obtained from a Milli-Direct 16 (MilliporeSigma, Massachusetts, USA).
2.2. Biomass Carbonization
Pre-weighted oil palm biomass was carbonized using a tightly closed muffle furnace to provide a low oxygen atmosphere at 450 °C for 30 min at a heating rate of 15 °C/min. After carbonization, the biochar was left to cool naturally in the muffle furnace for 12 hr. The biochar was then rinsed with 0.1 M HCl to remove any ash and deionized water until the rinsing water pH is 6–7. Rinsed biochar (EFB-BC) was dried in the oven at 75 °C for 24 h and weighted for yield calculation. Dried biochar was kept in the desiccator prior to functionalization.
2.3. Surface Functionalization
1.0 M nitric acid solution was prepared by diluting concentrated nitric acid with deionized water. 5.0 g biochar was mixed with 100 mL 1 M nitric acid solution in a 500 mL Erlenmeyer flask. The flask was covered with aluminum foil to avoid boil over and autoclaved in an autoclave (ASONE, NC-0170, Osaka, Japan) at 132 °C and 35 psi for 60 min. The mixture was left to cool to about 60 °C before filtered and rinsed with distilled water until the rinsing water pH reached 6–7. Functionalized biochar (EFB-FBC) was then dried in an oven at 75 °C for 24 h and kept in a desiccator for analysis.
2.4. Adsorption Test
Stock methylene blue (MB) solution (1000 mg/L) was prepared by dissolving analytical grade methylene blue in deionized water. Dilution was later carried out to prepare the desired concentrations. 50 mg of EFB-BC and EFB-FBC was added to 25 mL methylene blue solution and shaken with an orbital shaker at 300 rpm. For the isotherm experiment, the initial concentration used are 125, 150, 175, and 250 mg/L and for the kinetic experiment, the initial concentration is 125 mg/L. Unless stated, the adsorption process was done for 24 h at 30 °C to reach adsorption equilibrium. After 24 h, the mixture was filtered and the residual MB concentration was determined. All adsorption experiments were done in triplicates. Equilibrium adsorption capacity, qe, was calculated using the equation:
where C0 represents the initial MB concentration (mg/g), Ce represents the equilibrium MB concentration (mg/g), V is the volume of the solution and m is the mass of the adsorbent (mg).
qe = (C0 − Ce)V/m,
Adsorption kinetics and isotherm were analyzed and fitted to the Langmuir isotherm equation as shown below:
where Kads is the Langmuir constant related to the heat of adsorption (L/mg) and qmax is the maximum adsorption capacity (mg/g).
qe = (Kads·qmax·Ce)/(1 + Kads·Ce),
The kinetic data were fitted using the linear form of the Langmuir equation:
Ce/qe = (Ce/qmax) + (1/qmax·Kads),
By plotting Ce/qe vs. Ce, the value of Kads and qmax can be determined from the slope and intercept of the line.
For adsorption kinetic analysis, the data were fitted into 3 different kinetic models: pseudo-first-order (PFO), pseudo-second-order (PSO), and intraparticle diffusion (IPD) kinetic model. The equations for each kinetic model are shown below:
PFO kinetic model equation:
ln(Qe − Qt) = −k1t + ln(Qe)
PSO kinetic model equation:
where Qe represents the amount adsorbed on the adsorbent at equilibrium (mg/g), Qt represents the amount adsorbed on the adsorbent at time t (mg/g), t represents the time (h), and k1 (h−1) or k2 (g/mg·h) is the adsorption rate constant.
t/Qt = (1/Qe)·t + 1/Qe2·k2
The PFO model presume that the adsorption process is controlled by diffusion of adsorbate at the solid-liquid phase boundary (physisorption), while the PSO model attributes the adsorption process is controlled by the reaction of adsorbate and the surface at the solid-liquid phase boundary (chemisorption). The intraparticle diffusion model presume that the adsorption process proceeds in a multiple-stage of diffusions throughout the bulk material [29].
2.5. Analysis
Surface morphology and atomic composition of EFB-BC and EFB-FBC were analyzed using a JEOL-9000 SEM/EDX analyzer (JEOL, Tokyo, Japan). EDX analysis was done at 15 kV accelerating voltage. Surface functional groups were analyzed via Fourier Transform infrared spectroscopy performed on Nicolet iS5 spectrophotometer (ThermoFisher Scientific, Wisconsin, USA). The sample was measured via KBr pellet in the wavenumber range of 400–4000 cm−1. Thermogravimetric analysis was done to determine the thermal stability of EFB-BC and EFB-FBC using EXSTAR TG/DTA7000 (Hitachi High-Tech, Tokyo, Japan) under N2 atmosphere from 30–550 °C at 10 °C/min heating rate. BET surface area, pore diameter, and volume of EFB-BC and EFB-FBC were analyzed using Belsorp Mini-SPRII surface analyzer (MicrotracBEL, Osaka, Japan) using N2 and CO2 as adsorbate at 77 °K and 298 °K, respectively. The sample was dried in a vacuum drying oven at 105 °C for 48 h prior to analysis.
3. Results and Discussions
3.1. Carbonization and Functionalization Yield
The yield of the OPEFB carbonization process was 25.8% based on OPEFB dry weight. The yield is similar to the yield value reported by another researcher, with the range of values of 20–45% [30,31]. Functionalization process yield was around 95–99%, with yield loss attributed to losses during sample transfer and rinsing. This shows that the process does not affect the bulk structure of the biochar, and only affect the biochar surface.
3.2. FTIR Analysis
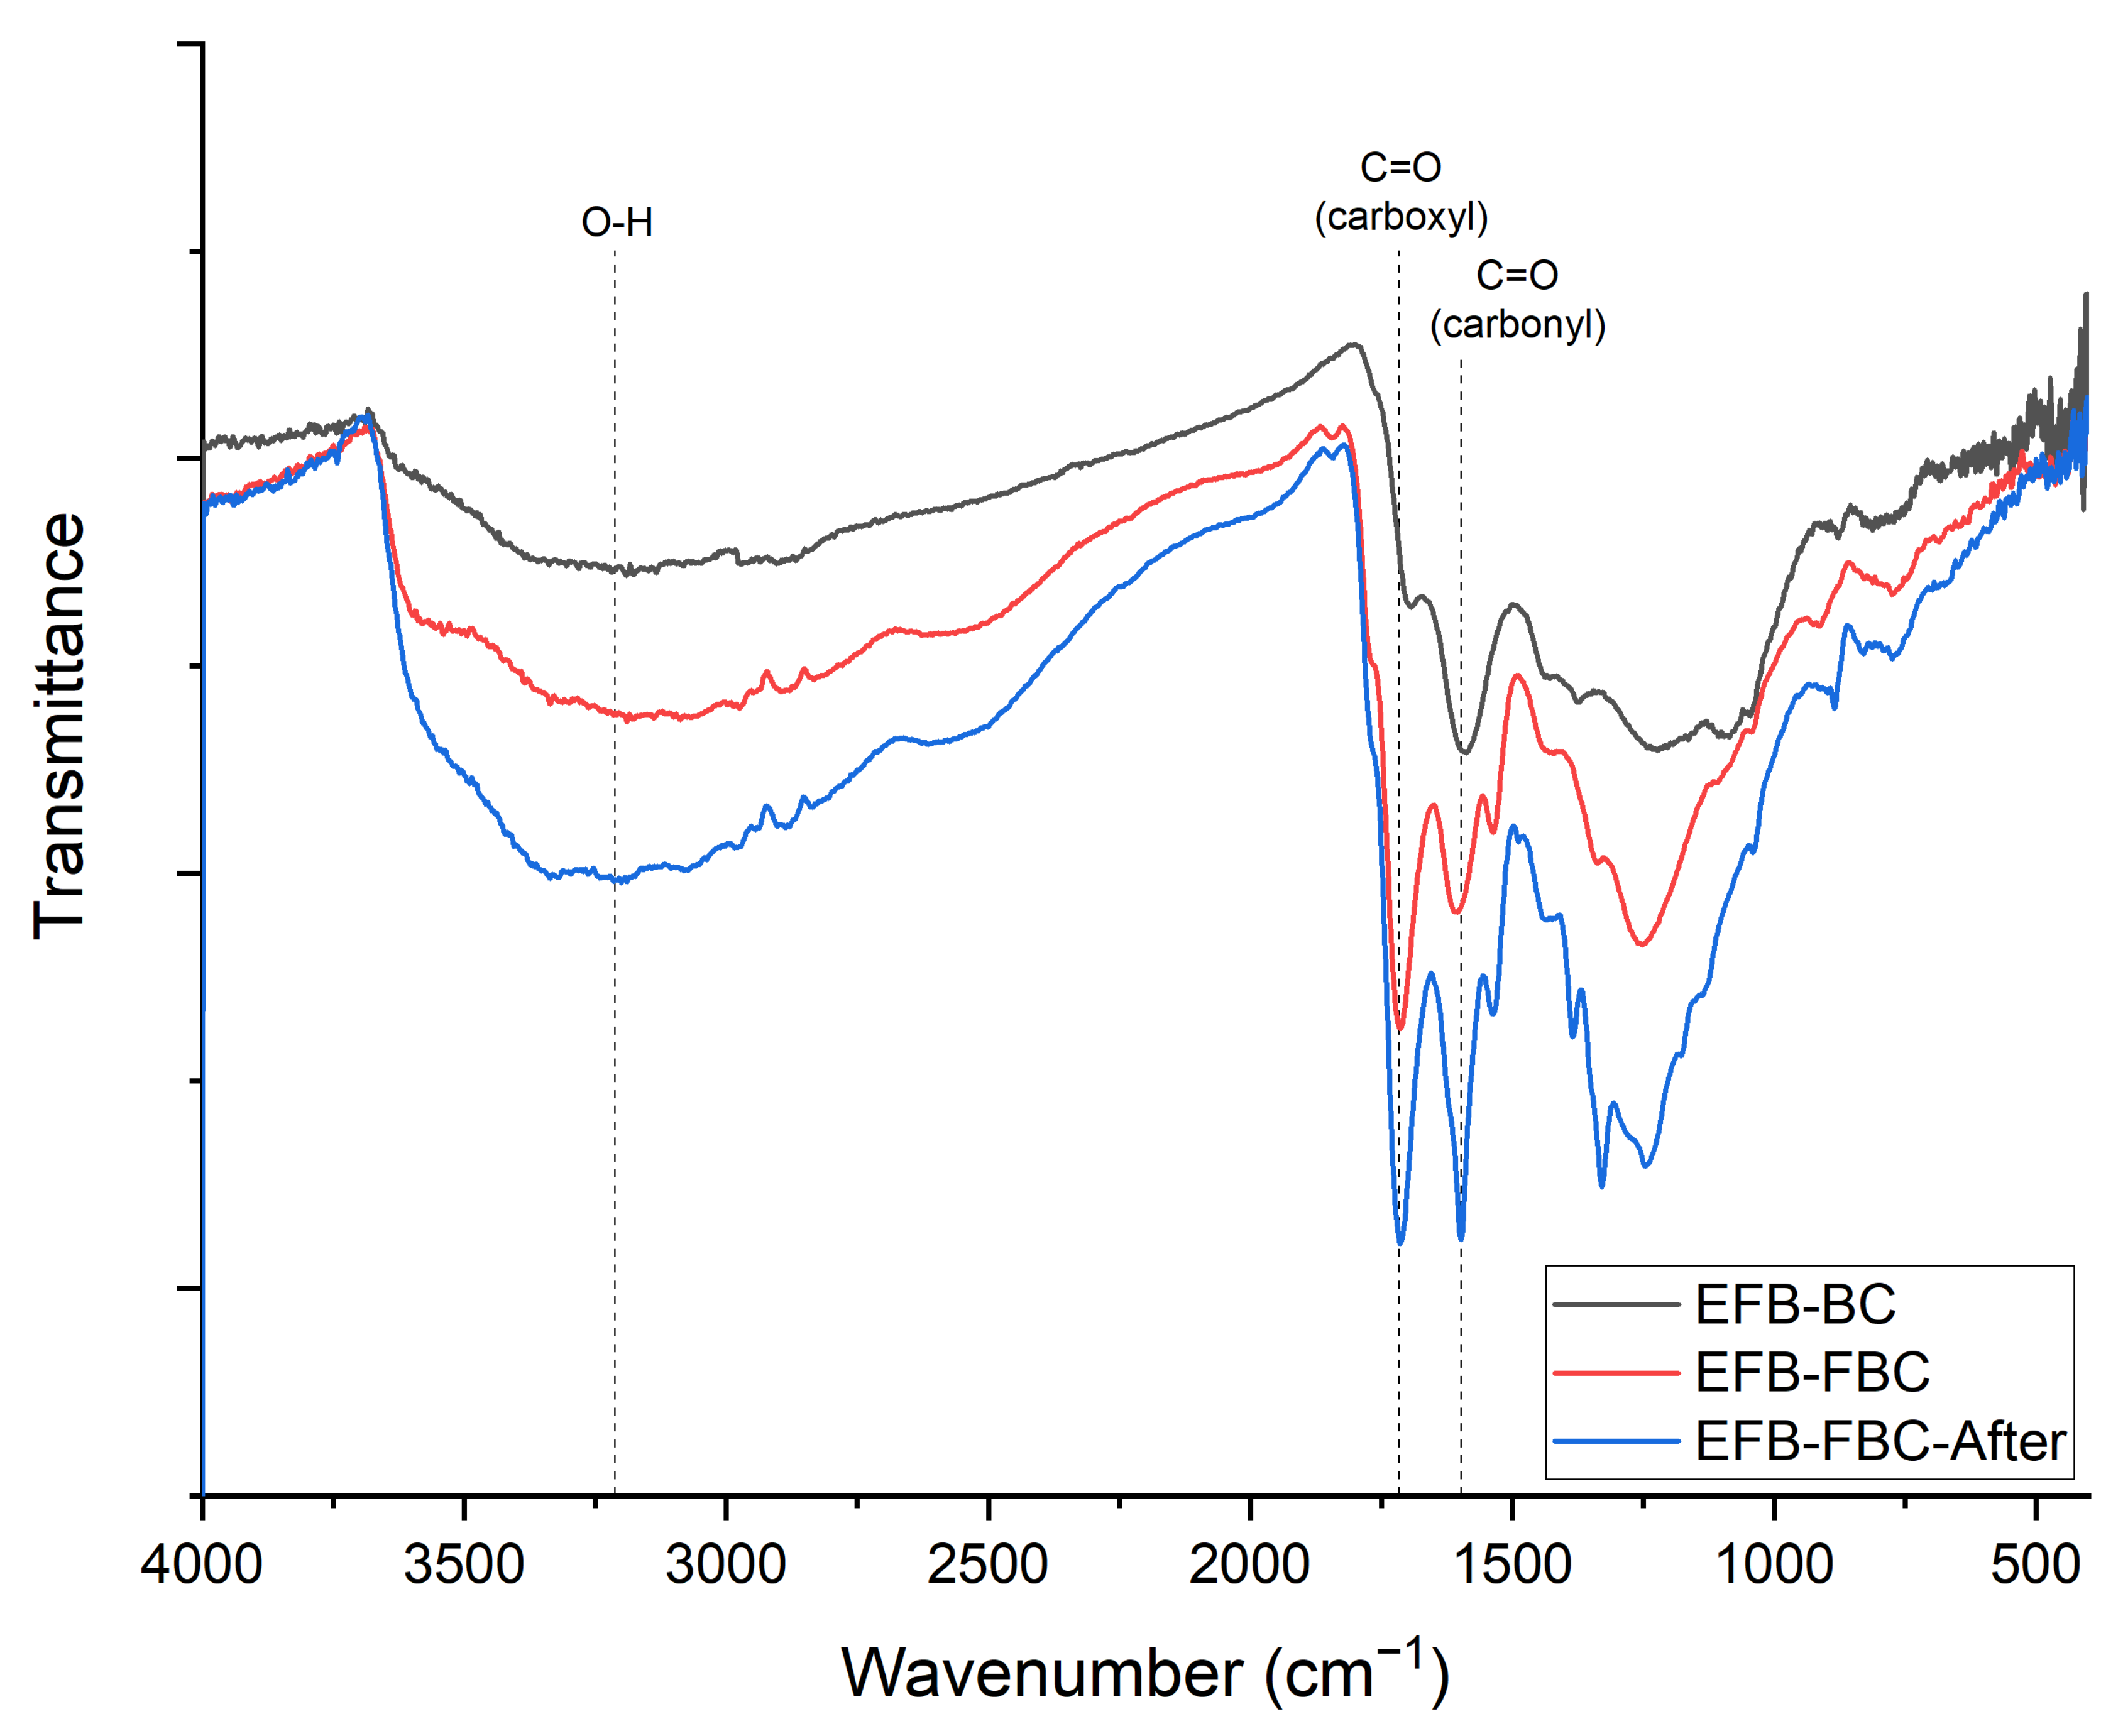
The surface functional groups of EFB-BC and EFB-FBC was analyzed via FTIR to determine whether the process was able to functionalize the surface of the biochar. A sample of EFB-BC refluxed with 1 M nitric acid at 80 °C for 24 h (EFB-24 h) was also analyzed to compare treatment with and without hydrothermal conditions. All FTIR are shown in Figure 1.
The EFB-FBC shows significant changes in FTIR spectra compared to EFB-BC. The distinct peak at 1710 cm−1 can be attributed to the C=O stretching vibrations of carboxylic groups. This peak is also present in EFB-BC, but at weaker intensity. The peak at 1605 cm−1 corresponds to the conjugated carbonyl C=O and C=C aromatic stretching vibrations. New peaks were present in the EFB-FBC spectra at 1535 and 1339 cm−1, which can be attributed to asymmetric and symmetric vibration of nitro (–NO2) group. This suggests that the nitric acid functionalization also introduces nitrogen-containing functional groups on the surface of the biochar. This is also reported by Gokce and Aktas with modification of waste tea activated carbon using nitric acid [32]. The peak at 1246 cm−1 corresponds to aromatic alkoxy stretching, most probably from phenolic C–O bonds. The broad absorption bands in the range from 2400–3500 cm−1 can be attributed to O–H stretching absorption with a wide absorption band indicative of carboxylic O–H [33]. Comparing treatment using just elevated temperature for a long period of time (EFB-24 h) with EFB-FBC, the changes in FTIR spectra of EFB-24 h is very minor. There are some increases in the nitro and carboxyl group absorption, but the amount is significantly lower compared to EFB-FBC. This highlights the importance of the hydrothermal condition for a successful functionalization of biochar surface using low nitric acid concentration. The significant increases in absorption bands of oxygen-containing functional groups, with the introduction of new peaks indicating the introduction of nitrogen-containing functional groups, shows that the functionalization of the surface of the biochar surface is successful.
3.3. Thermogravimetric Analysis
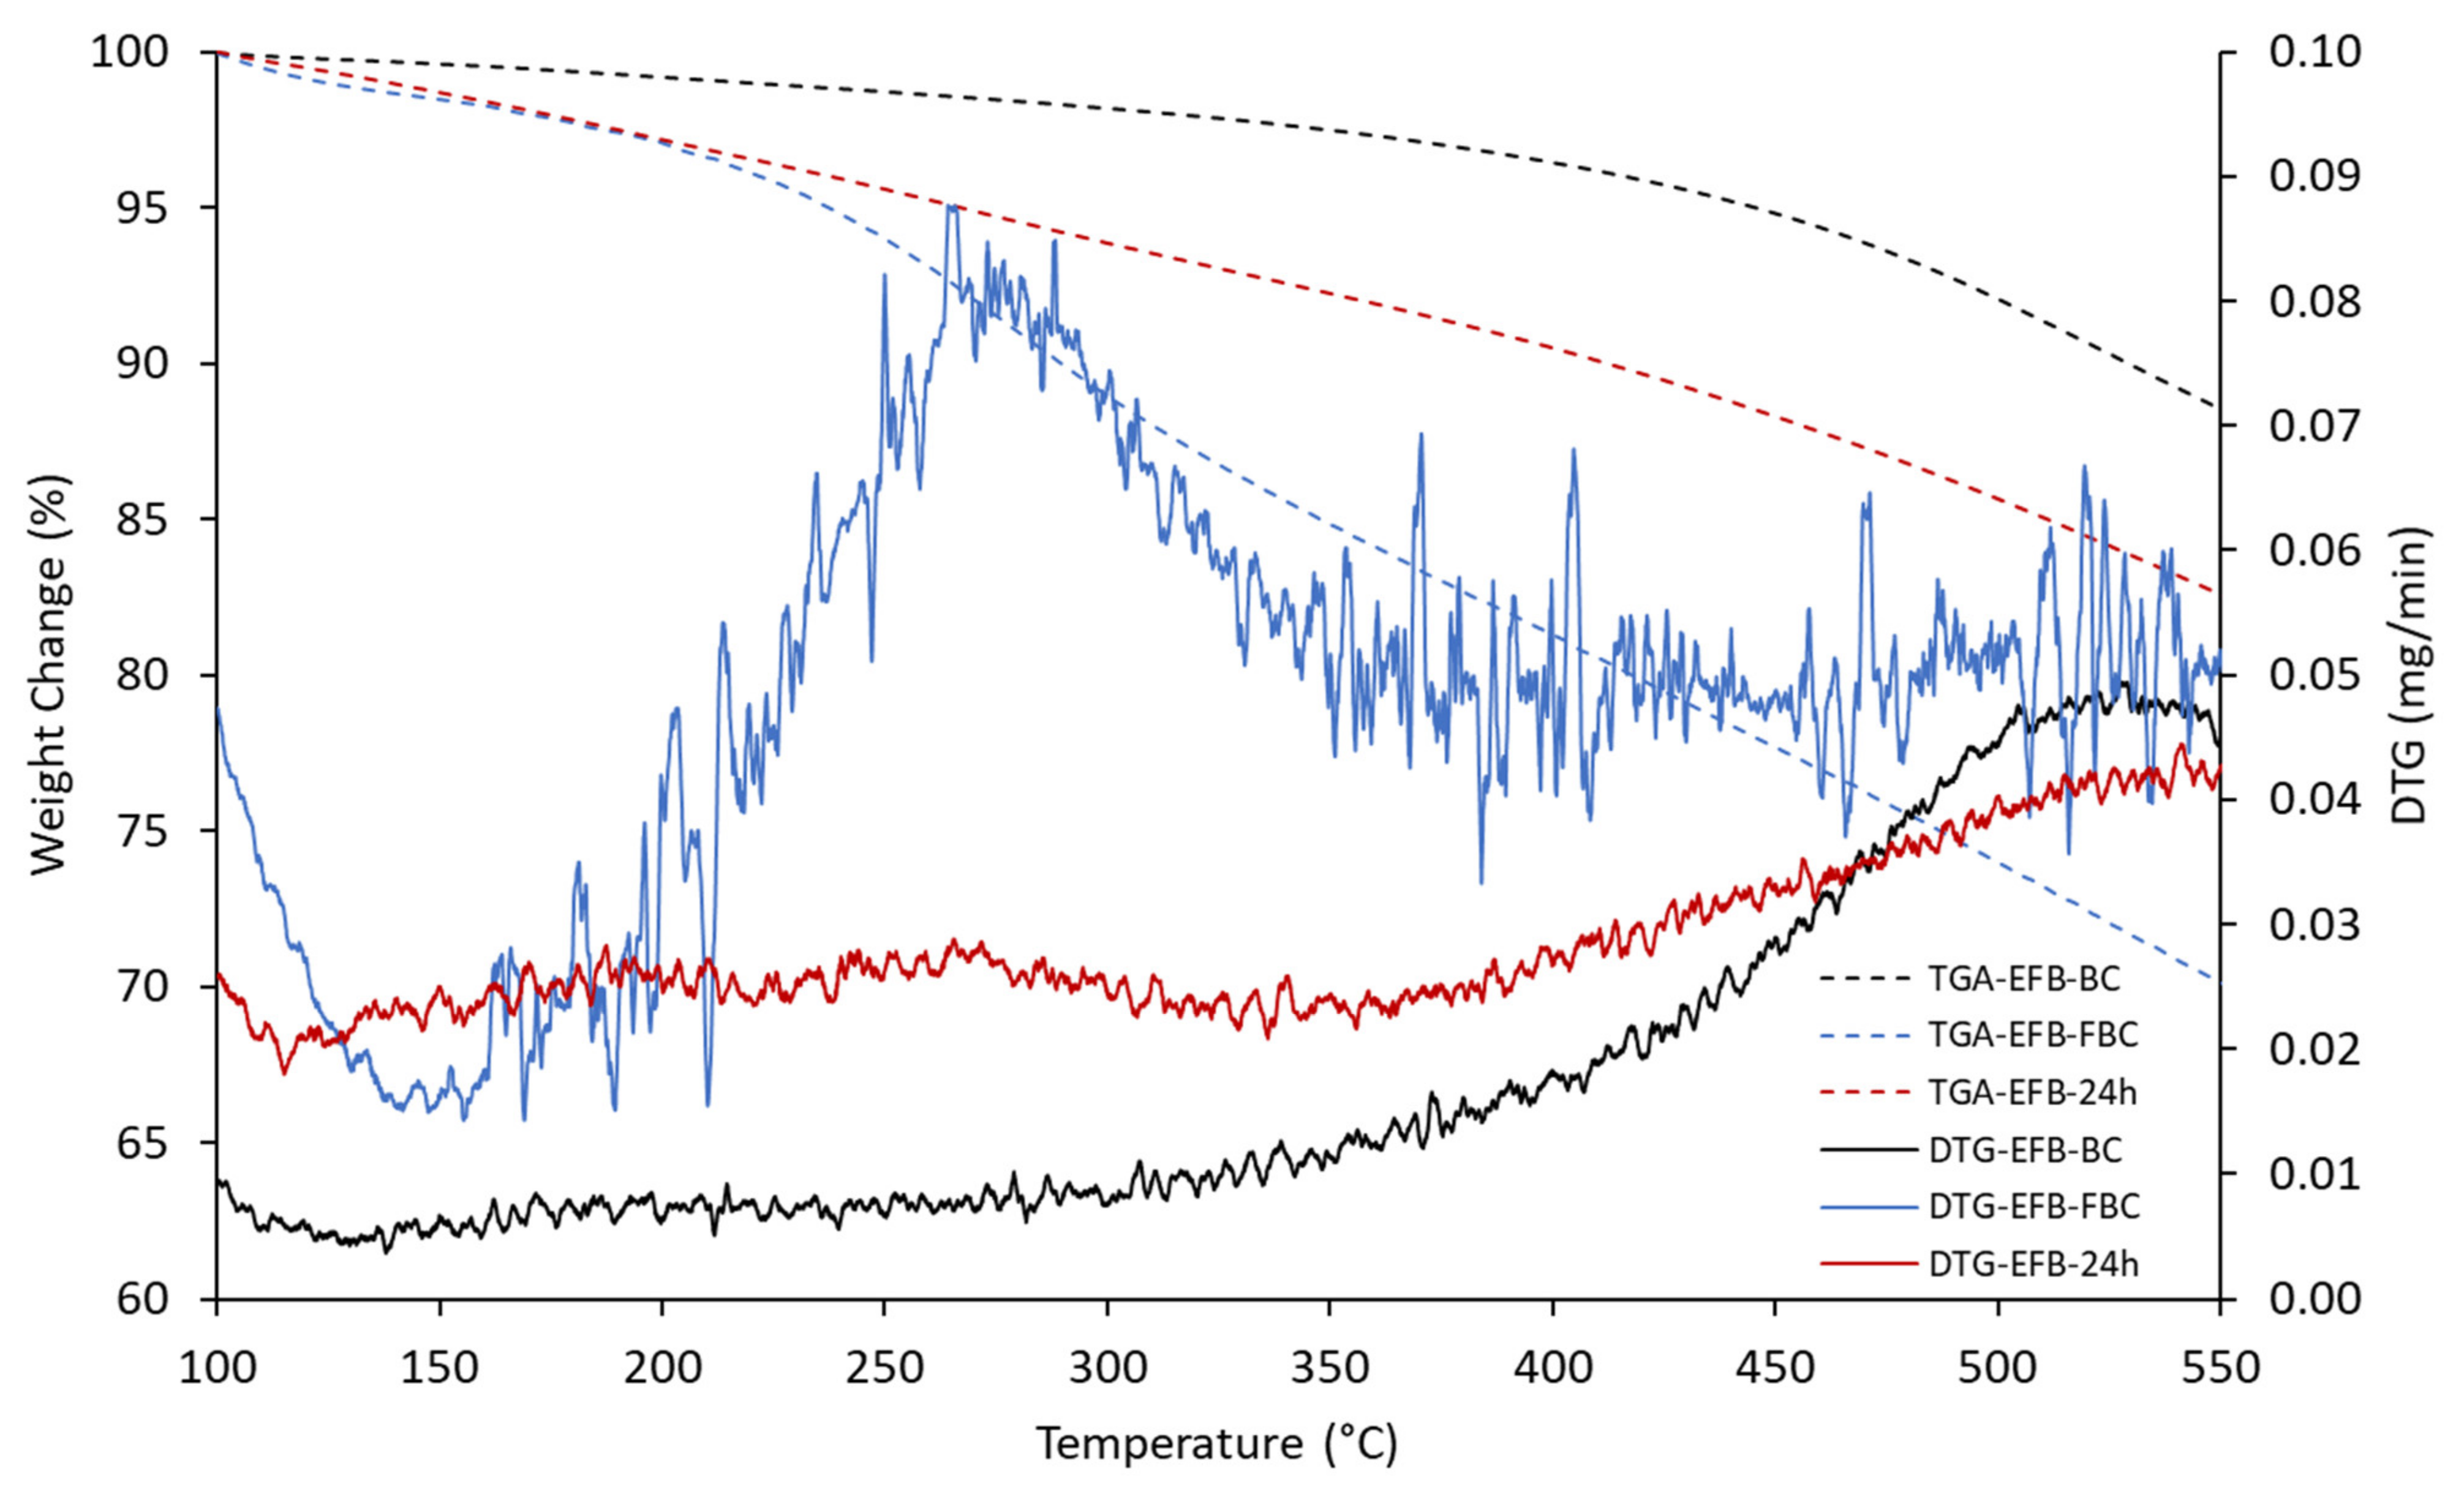
Thermogravimetric analysis (TGA) of EFB-BC, EFB-FBC, and EFB-24 h were done to determine its thermal stability. The thermogravimetric (TG) and differential thermogravimetric (DTG) curve of all sample is shown in Figure 2. EFB-BC starts to degrade at around 300 °C, with a maximum degradation rate at around 500 °C. This can be attributed to the degradation of recalcitrant lignin that is left from the carbonization and degradation of relatively unstable chemical structures and functional groups such as methoxy and carbonyl groups. A similar trend of biochar thermal degradation was also reported with biochar derived from various feedstock such as manure, switchgrass, water oak, rice husk, rice bran, and sludge [34,35]. For EFB-FBC, it can be seen that the sample degrades at a lower temperature of around 200 °C with a peak degradation rate at 275 °C. This can be attributed to the degradation of oxygen functional groups, which are introduced by nitric acid functionalization such as carboxyl and anhydride groups with the evolution of water and carbon dioxide [36]. For EFB-24 h, the degradation pattern shown by the EFB-FBC sample is not as obvious. There are more weight changes and a higher degradation rate shown in the DTG curve compared to EFB-BC, but it is not as significant as EFB-FBC. This supports the FTIR findings where nitric acid treatment introduces more carboxyl groups to the biochar surface and the hydrothermal condition is necessary for successful surface functionalization.
3.4. SEM Analysis
SEM micrograph of EFB-BC and EFB-FBC is shown in Figure 3. While the main structure of the biochar remains similar, there are some increases in macropores on the surface of the biochar. This might help the adsorption process by improving the diffusion of dye molecules throughout the structure of biochar.
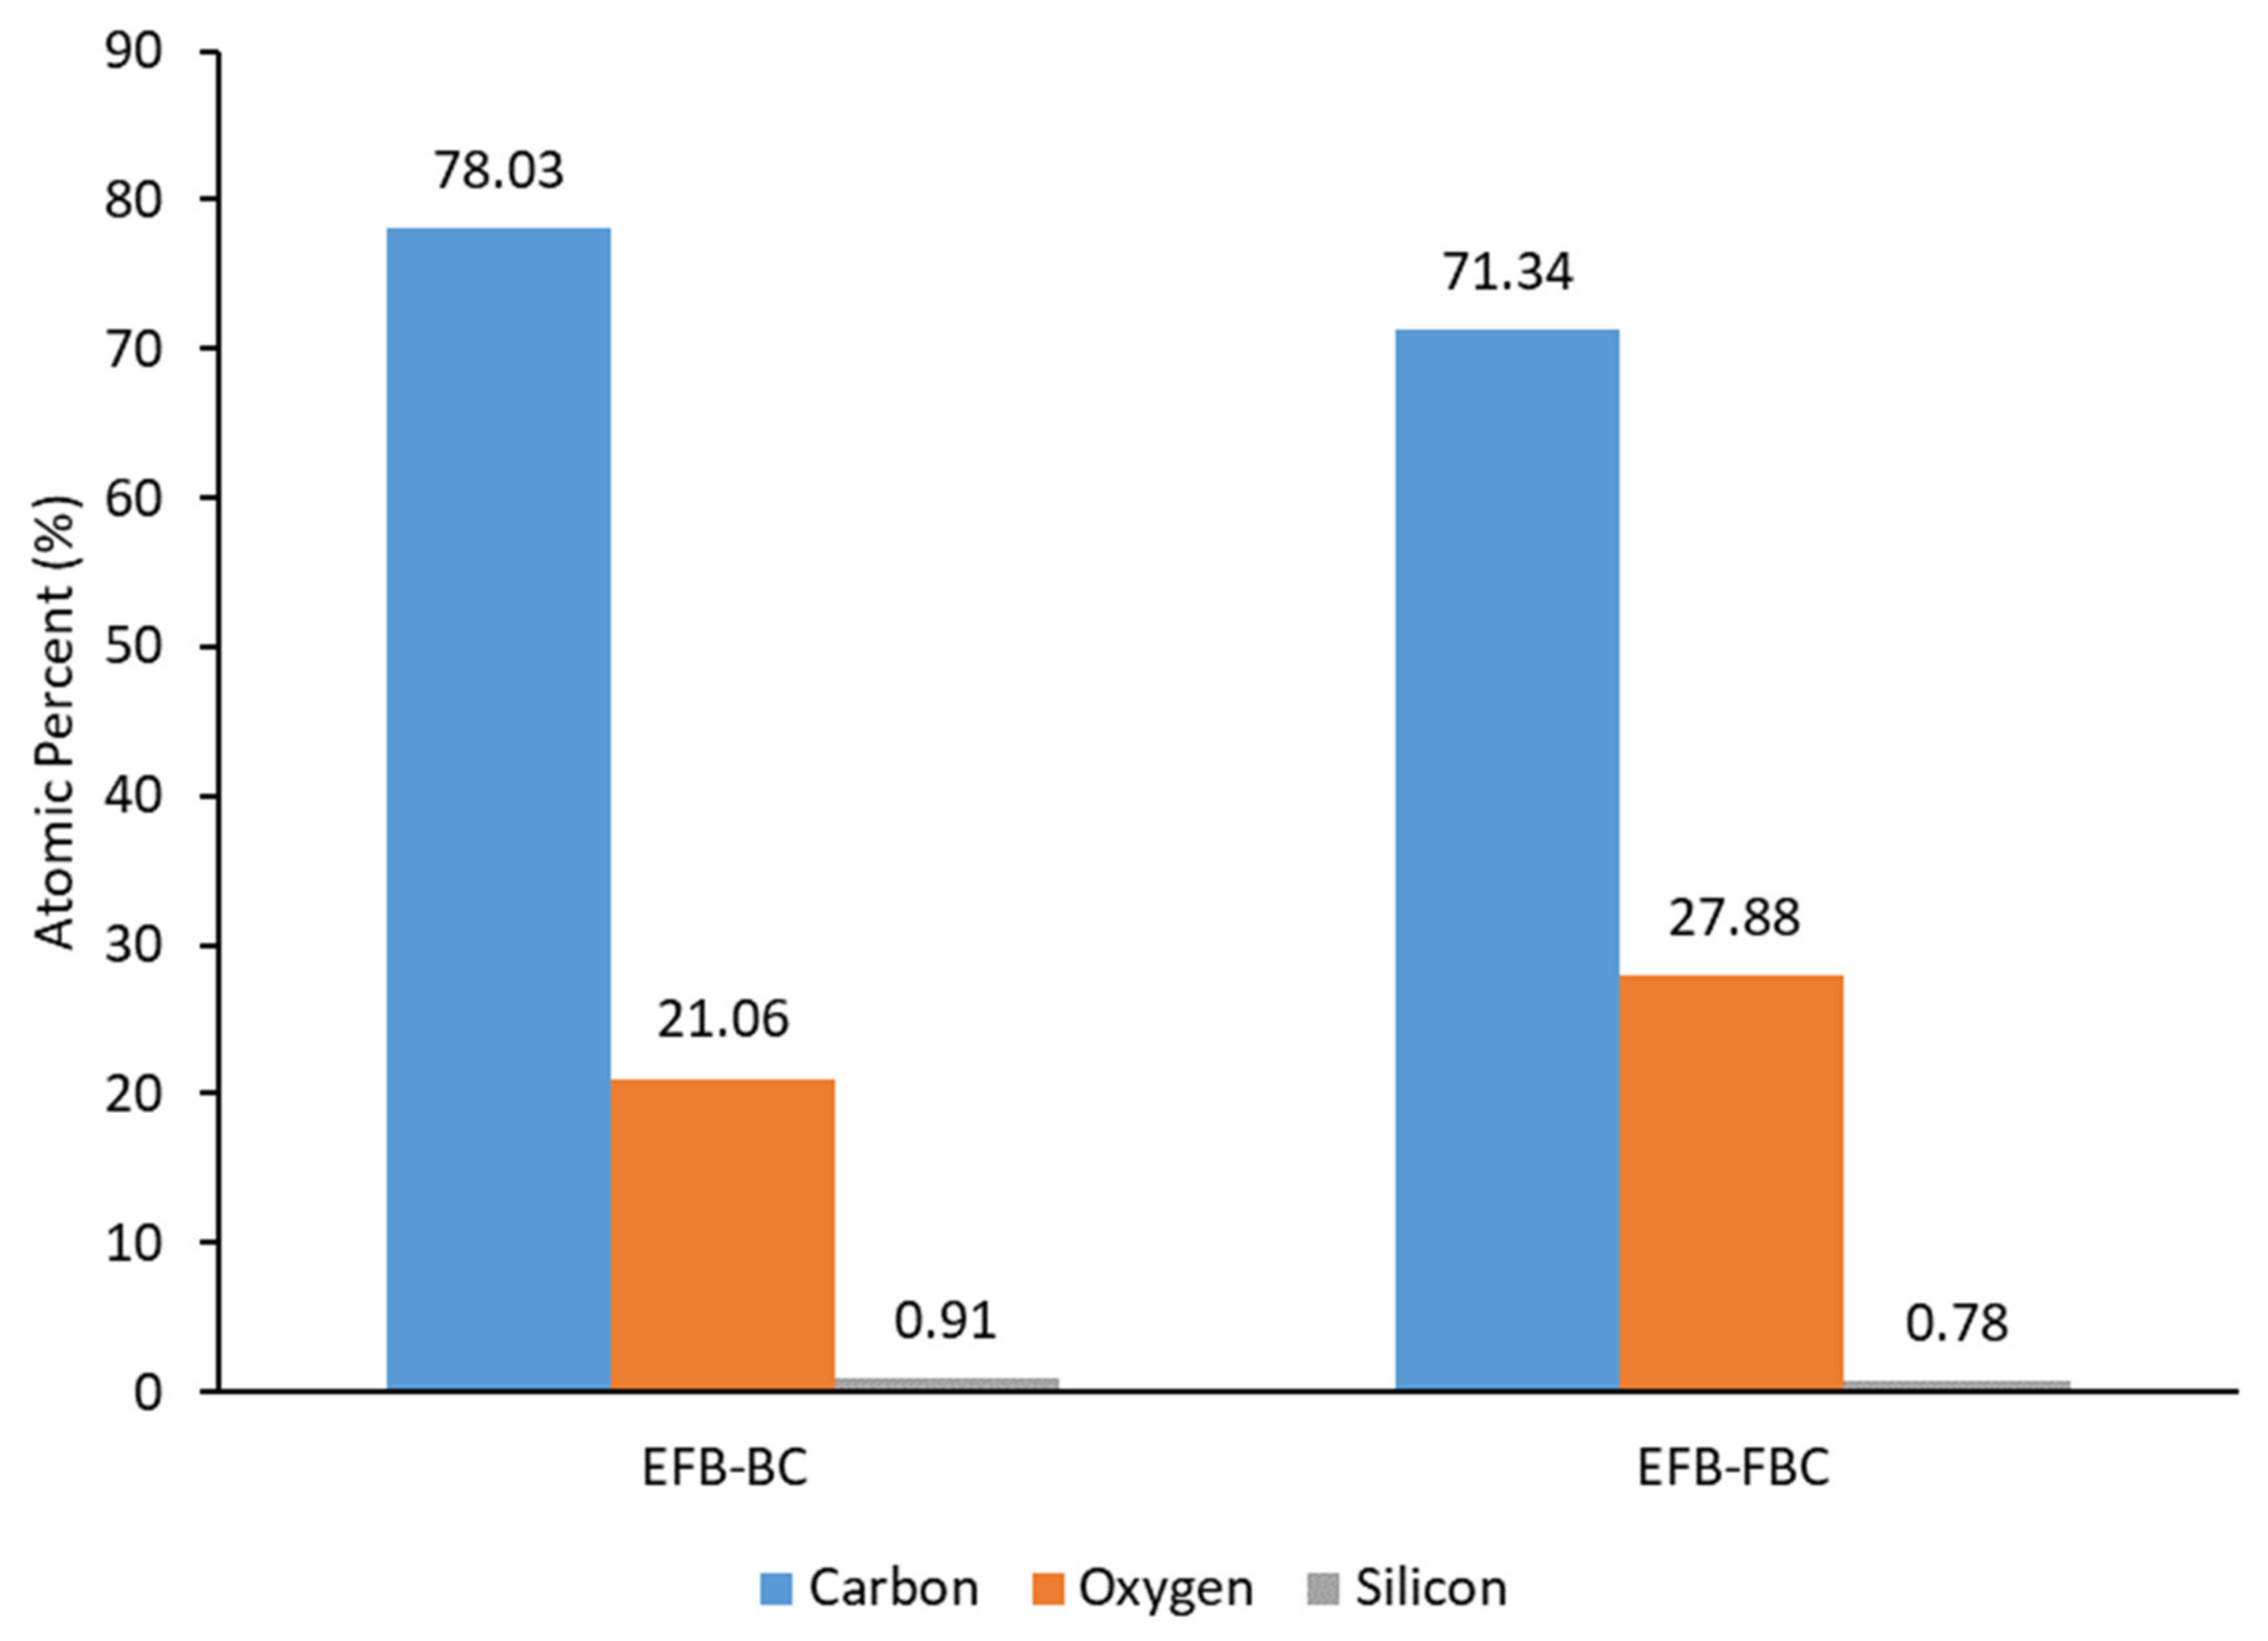
3.5. EDX Analysis
EDX analysis was done on both EFB-BC and EFB-FBC to quantify the surface elemental composition of the biochar. The oxygen atomic percent is shown in Figure 4.
EDX data shows an increase in surface oxygen content in EFB-FBC, suggesting an increase in oxygen surface functional groups. Silicon content also decreases after functionalization, suggesting the slight change of the morphology of the biochar as shown in the SEM micrograph might be due to the removal of silica bodies present on the surface of EFB-BC. Removal of silica bodies further exposes macropores on the biochar and improves the diffusion of dye molecules into the internal structures of the biochar.
3.6. BET Surface Area
The surface area of EFB-BC and EFB-FBC was analyzed to determine whether the functionalization process has any effect on the structure and morphology of the biochar. BET surface area (aSBET), total pore volume (VT), pore diameter (DP) micropore surface area (amic), and volume (Vmic) data are shown in Table 1.
N2 adsorption analysis shows that the surface area of the biochar does not change considerably after functionalization with the specific surface area value shows a decrease of about 20%. This is a significantly smaller change compared to what is reported by another researcher after nitric acid functionalization where surface area reduction can reach up to 96% [32,37,38]. Pore diameter and volume data indicate that both EFB-BC and EFB-FBC have prevalent microporous structures. CO2 adsorption data shows that the pore volume of the biochar decrease after functionalization from 0.1396 cm3/g to 0.1312 cm3/g which indicates that the functionalization process only functionalized the surface of the biochar without any major physical changes on the biochar structure that may increase or decrease the specific surface area. This also shows that the process can be applied to other carbon material to functionalize its surface without changing the physical structure which may affect its inherent surface area values.
3.7. Mechanism of Hydrothermal Functionalization Using Nitric Acid
Previously, oxidation and nitration of carbon materials using nitric acid have been reported but the concentration of nitric acid used was relatively high compared to this study. The temperature used was in the range of 50–140 °C but sustained at a long period of time, up to 5 h. Table 2 shows the comparison between previously reported nitric acid modification on carbon material and its treatment parameters. Based on the literature, it is clear that functionalization of carbon material using nitric acid has only been done either using a highly concentrated nitric acid solution, use of an extended period of treatment time, the high temperature under reflux, or a combination of each parameters. By using a hydrothermal process via autoclave, the increased pressure of the process was enough to improve the efficiency of the reaction between nitric acid and biochar surface, hence reducing the concentration and time needed to successfully functionalize the biochar surface.
The oxidation mechanism of biochar surface by nitric acid was not clearly explained in previous literature even though similar observation has been reported in terms of FTIR spectra changes and total surface acid groups. It is suggested that surface oxidation proceeds via the oxidation of aromatic groups in the bulk carbon structure of the biochar. This process is possible due to the inherent presence of some surface groups such as hydroxyl and carbonyl groups that can be further oxidized by nitric acid and other nitrogen-containing species, which might be produced due to the degradation of nitric acid, such as nitrous acid [45]. Multiple processes during carbonization such as depolymerization of cellulose and hemicellulose structure, bond cleavage of lignin structure and subsequent dehydration, decarboxylation, aromatization, and intramolecular condensation between the major component of the biomass and its degradation products result in a complex biochar structure rich with aromatic rings, aliphatic structures, and oxygen-containing functional groups. An excellent review by Liu et al. provides an in-depth explanation and characterization of the lignocellulosic carbonization process [23]. OPEFB carbonization temperature at 450 °C allows some functional groups to still be present on the biochar surface, as shown in the FTIR spectra of EFB-BC. A similar trend of functional group presence was also reported by Zhang et al., where they investigate the effect of pyrolysis temperature on the abundance of oxygen functional groups on the surface of barley grass biochar [46]. In addition to that, the functional groups activate the aromatic ring for nitration [47], which explains the nitro group peaks present in the FTIR spectra of the EFB-FBC.
3.8. Adsorption Capacity, Isotherms, and Kinetic Study
The adsorption performance of EFB-FBC was determined using methylene blue (MB) as synthetic adsorbate and EFB-BC as a control for comparison. The adsorption capacity of EFB-FBC increased significantly from 8.70 ± 0.09 mg/g to 62.52 ± 0.48 mg/g. This increase is due to the increase in oxygen surface functional groups after functionalization using nitric acid. The highly electronegative oxygen groups increase the electrostatic interaction between the EFB-FBC surface and dye molecule, increasing its adsorption capacity. This increased interaction improves the capacity of biochar without reducing biochar surface area as stated previously.
The adsorption isotherm and kinetic study of the EFB-FBC were conducted to characterize the adsorption process. The isotherm constant is as shown in Table 3.
The R2 value of the isotherm linear fitting suggests a very well representation of the adsorption process by the model. The qmax value calculated from the model also closely matched the experimental value. This result shows that the EFB-FBC surfaces are homogenous adsorption-wise and the adsorption of MB onto the surface of EFB-FBC proceed with the formation of MB monolayer on its surface.
Table 4 shows the adsorption kinetic constants of MB adsorption on EFB-FBC fitted using pseudo-first-order (PFO), pseudo-second-order (PSO), and intraparticle diffusion (IPD) model. The adsorption kinetics were best represented by the PSO model with an R2 value of 0.9666 compared to PFO of 0.9402. This suggests that the adsorption process was mainly chemisorption, where chemical interaction between the surface of EFB-FBC and MB dye molecule was dominant. As both PFO and PSO models cannot describe the overall adsorption process satisfactorily, the intraparticle diffusion model was also applied to the kinetic data. It is apparent from the IPD linear fit R2 values that the adsorption is a multi-layer adsorption process, from the multiple linear fit of the curve. The adsorption process can be separated into 3 different stages; (1) the adsorption of MB onto the external surface area of EFB-FBC (film diffusion), (2) the diffusion of MB molecule from the external surface into the pores of the EFB-FBC, and (3) the intra particle diffusion of MB molecule in the internal structures of the EFB-FBC. A similar multi-layer adsorption process was also reported by Zhou et al., with adsorption of hexavalent chromium ion on ramie biochar [48] and Fan et al., with adsorption of methylene blue on sewage sludge-based biochar [49]. The multi-layer adsorption process can also explain the relatively slow uptake of the MB by the EFB-FBC. As EFB-FBC has a low surface area, the diffusion of MB molecules was limited and needs a longer time to reach additional adsorption sites in the EFB-FBC internal structure. When the MB has adsorbed into the internal adsorption sites, the external surface might be freed up and able to accept more MB molecules. Isotherm and kinetic linear fit curves are provided in Supplementary Materials (Figures S1 and S2).
3.9. MB Adsorption Interaction
To explain the interaction between the MB molecule and the EFB-FBC surface functional groups, the FTIR spectra of EFB-FBC after adsorption were determined, as shown in Figure 5.
From the FTIR spectra, it is apparent that the intensity of carbonyl peak at 1610 cm−1 and carboxyl peak at 1715 cm−1 increased significantly suggesting the interaction between those surface functional groups with the MB molecule during adsorption. The increase in those peaks can also be contributed by the MB molecule itself. The increase of broad ~3400 cm−1 peak intensity and shifting of carbonyl and carboxyl peak values, suggesting hydrogen bonding might be contributing to the adsorption of MB to the surface of EFB-FBC [50].
Similar interaction of oxygen-containing functional groups with dyes, especially cationic or positively charged dyes such as methylene blue has been reported in several studies and compiled in reviews. In a review by Kah et al., the interaction was due to the dissociation of hydroxyl and carboxyl groups. The dissociation release hydrogen ion into the aqueous solution, causing the groups to have a negative charge, which in turns electrostatically attracts cationic dyes [51]. The electrostatic interaction also affects the performance of biochar in heavy metal adsorption, as heavy metals usually occur as cations in aqueous solutions. Effect of activated carbon modified with air shows increase in oxygen surface functional groups increase the adsorption capacity of activated carbon for Ni(II) and Cd(II) compared to unmodified activated carbon [52]. The methylene blue adsorption result, supported with the published literature on the effect of increased oxygen surface functional groups on the adsorption performance of carbon material shows that functionalization of biochar is a viable way to improve its adsorption performance, especially for dyes and heavy metal.
4. Conclusions
The objective of this study was successfully achieved. EFB-BC was successfully functionalized using nitric acid as an oxidizing agent, with autoclave as the accelerator for the process. The novelty of this process is that it effectively increases the amount of oxygen surface functional groups of biochar while using a significantly lower concentration of nitric acid and at a shorter treatment time compared to what is previously reported in the literature. The resulting biochar (EFB-FBC) has increased surface functional groups, which is important in the adsorption of pollutants such as dyes and heavy metals from aqueous solutions. The functionalization process does not affect the morphology of the biochar surface, with no major change seen on SEM micrograph and BET surface area values. The performance of EFB-FBC increased significantly, with 7 times increase in adsorption capacity from 8.70 ± 0.09 mg/g to 62.52 ± 0.48 mg/g compared to unmodified biochar. Autoclave accelerated nitric acid functionalization can be a new method to improve the performance of biochar. Additional studies related to determining the performance of biochar and other carbon material modified using this method, optimization of hydrothermal functionalization process parameters, in-depth study of the mechanism of the functionalization process, and large-scale functionalization experiment using real equipment in the field with real wastewater can be the next step forward in the future. These results can help to develop an appropriate technology using available equipment to the industry, with a simple method that can be implemented easily which can solve the biochar lack of adsorption performance and promotes the implementation of the technology, especially in the palm oil industry.
Supplementary Materials
The following are available online at https://www.mdpi.com/2227-9717/9/1/149/s1, Figure S1: Langmuir isotherm model linear fitting curve for MB adsorption on EFB-FBC (C = 125, 150, 175 and 250 mg/L, contact time = 24 h, temperature = 30 °C, dosage = 2 g/L), Figure S2: Methylene blue kinetic adsorption data for EFB-FBC fitted for (a) pseudo-first order (b) pseudo-second order and (c) intraparticle diffusion kinetic models.
Author Contributions
Conceptualization, I.I., Y.A. and M.A.H.; methodology, I.I.; validation, I.I.; formal analysis, I.I.; investigation, I.I.; resources, Y.A, T.T. and M.A.H.; data curation, I.I.; writing—original draft preparation, I.I.; writing—review and editing, I.I. and Y.A.; visualization, I.I.; supervision, Y.A. and M.A.H.; project administration, Y.A.; funding acquisition, Y.A. All authors have read and agreed to the published version of the manuscript.
Funding
This research receives no external funding.
Institutional Review Board Statement
Not applicable.
Informed Consent Statement
Not applicable.
Data Availability Statement
Data is contained within the article and Supplementary Materials.
Conflicts of Interest
The authors declare no conflict of interest.
References
- Manyà, J.J. Pyrolysis for biochar purposes: A review to establish current knowledge gaps and research needs. Environ. Sci. Technol. 2012, 46, 7939–7954. [Google Scholar] [CrossRef]
- Jiang, S.; Nguyen, T.A.H.; Rudolph, V.; Yang, H.; Zhang, D.; Ok, Y.S.; Huang, L. Characterization of hard- and softwood biochars pyrolyzed at high temperature. Environ. Geochem. Health 2017, 39, 403–415. [Google Scholar] [CrossRef] [PubMed]
- Rashidi, N.A.; Yusup, S. A review on recent technological advancement in the activated carbon production from oil palm wastes. Chem. Eng. J. 2017, 314, 277–290. [Google Scholar] [CrossRef]
- Samsudin, M.H.; Hassan, M.A.; Idris, J.; Ramli, N.; Mohd Yusoff, M.Z.; Ibrahim, I.; Othman, M.R.; Mohd Ali, A.A.; Shirai, Y. A one-step self-sustained low temperature carbonization of coconut shell biomass produced a high specific surface area biochar-derived nano-adsorbent. Waste Manag. Res. 2019, 37. [Google Scholar] [CrossRef]
- Kim, J.A.; Vijayaraghavan, K.; Reddy, D.H.K.; Yun, Y.S. A phosphorus-enriched biochar fertilizer from bio-fermentation waste: A potential alternative source for phosphorus fertilizers. J. Clean. Prod. 2018, 196, 163–171. [Google Scholar] [CrossRef]
- Liu, Y.; Cheng, H.; He, Y. Application and mechanism of sludge-based activated carbon for phenol and cyanide removal from bio-treated effluent of coking wastewater. Processes 2020, 8, 82. [Google Scholar] [CrossRef] [Green Version]
- Inyang, M.; Dickenson, E. The potential role of biochar in the removal of organic and microbial contaminants from potable and reuse water: A review. Chemosphere 2015, 134, 232–240. [Google Scholar] [CrossRef]
- Wang, H.Y.; Chen, P.; Zhu, Y.G.; Cen, K.; Sun, G.X. Simultaneous adsorption and immobilization of As and Cd by birnessite-loaded biochar in water and soil. Env. Sci. Pollut. Res. 2019, 26, 8575–8584. [Google Scholar] [CrossRef]
- Qambrani, N.A.; Rahman, M.M.; Won, S.; Shim, S.; Ra, C. Biochar properties and eco-friendly applications for climate change mitigation, waste management, and wastewater treatment: A review. Renew. Sustain. Energy Rev. 2017, 79, 255–273. [Google Scholar] [CrossRef]
- Malaysian Palm Oil Board. FFB Yield & Crude Palm Oil Yield of Oil Palm Estates 2019. Available online: http://bepi.mpob.gov.my/index.php/en/yield/yield-2019/yield-2019.html (accessed on 5 August 2020).
- Malaysian Palm Oil Board. Oil Palm Planted Area 2019. Available online: http://bepi.mpob.gov.my/index.php/en/area/area-2019/oil-palm-planted-area-as-at-dec-2019.html (accessed on 5 August 2020).
- Thoe, J.M.L.; Surugau, N.; Chong, H.L.H. Application of oil palm empty fruit bunch as adsorbent: A review. Trans. Sci. Technol. 2019, 6, 9–26. [Google Scholar]
- Bessou, C.; Verwilghen, A.; Beaudoin-Ollivier, L.; Marichal, R.; Ollivier, J.; Baron, V.; Bonneau, X.; Carron, M.P.; Snoeck, D.; Naim, M.; et al. Agroecological practices in oil palm plantations: Examples from the field. OCL Oilseeds FatsCrop. Lipids 2017, 24. [Google Scholar] [CrossRef] [Green Version]
- Yoshizaki, T.; Shirai, Y.; Hassan, M.A.; Baharuddin, A.S.; Raja Abdullah, N.M.; Sulaiman, A.; Busu, Z. Improved economic viability of integrated biogas energy and compost production for sustainable palm oil mill management. J. Clean. Prod. 2013, 44, 1–7. [Google Scholar] [CrossRef] [Green Version]
- Idris, J.; Shirai, Y.; Andou, Y.; Mohd Ali, A.A.; Othman, M.R.; Ibrahim, I.; Hassan, M.A. Self-sustained carbonization of oil palm biomass produced an acceptable heating value charcoal with low gaseous emission. J. Clean. Prod. 2015, 89, 257–261. [Google Scholar] [CrossRef] [Green Version]
- Idris, J.; Shirai, Y.; Andou, Y.; Mohd Ali, A.A.; Othman, M.R.; Ibrahim, I.; Yamamoto, A.; Yasuda, N.; Hassan, M.A. Successful scaling-up of self-sustained pyrolysis of oil palm biomass under pool-type reactor. Waste Manag. Res. 2016, 34, 176–180. [Google Scholar] [CrossRef] [PubMed]
- Mohamad Nor, N.; Lau, L.C.; Lee, K.T.; Mohamed, A.R. Synthesis of activated carbon from lignocellulosic biomass and its applications in air pollution control—A review. J. Environ. Chem. Eng. 2013, 1, 658–666. [Google Scholar] [CrossRef]
- Zhang, X.; Gao, B.; Creamer, A.E.; Cao, C.; Li, Y. Adsorption of VOCs onto engineered carbon materials: A review. J. Hazard. Mater. 2017, 338, 102–123. [Google Scholar] [CrossRef]
- Ibrahim, I.; Hassan, M.A.; Abd-Aziz, S.; Shirai, Y.; Andou, Y.; Othman, M.R.; Ali, A.A.M.; Zakaria, M.R. Reduction of residual pollutants from biologically treated palm oil mill effluent final discharge by steam activated bioadsorbent from oil palm biomass. J. Clean. Prod. 2017, 141, 122–127. [Google Scholar] [CrossRef]
- Rashidi, N.A.; Yusup, S.; Ahmad, M.M.; Mohamed, N.M.; Hameed, B.H. Activated carbon from the renewable agricultural residues using single step physical activation: A preliminary analysis. APCBEE Procedia 2012, 3, 84–92. [Google Scholar] [CrossRef] [Green Version]
- Liou, T.-H. Development of mesoporous structure and high adsorption capacity of biomass-based activated carbon by phosphoric acid and zinc chloride activation. Chem. Eng. J. 2010, 158, 129–142. [Google Scholar] [CrossRef]
- Wang, Y.; Liu, R. Comparison of characteristics of twenty-one types of biochar and their ability to remove multi-heavy metals and methylene blue in solution. Fuel Process. Technol. 2017, 160, 55–63. [Google Scholar] [CrossRef]
- Liu, W.J.; Jiang, H.; Yu, H.Q. Development of biochar-based functional materials: Toward a sustainable platform carbon material. Chem. Rev. 2015, 115, 12251–12285. [Google Scholar] [CrossRef] [PubMed]
- Park, D.; Yun, Y.-S.; Park, J.M. The past, present, and future trends of biosorption. Biotechnol. Bioprocess. Eng. 2010, 15, 86–102. [Google Scholar] [CrossRef]
- Sophia, A.C.; Lima, E.C. Removal of emerging contaminants from the environment by adsorption. Ecotoxicol. Env. Saf. 2018, 150, 1–17. [Google Scholar] [CrossRef] [PubMed]
- Wang, J.; Wang, S. Preparation, modification and environmental application of biochar: A review. J. Clean. Prod. 2019, 227, 1002–1022. [Google Scholar] [CrossRef]
- Tan, I.A.W.; Abdullah, M.O.; Lim, L.L.P.; Yeo, T.H.C. Surface modification and characterization of coconut shell-based activated carbon subjected to acidic and alkaline treatments. J. Appl. Sci. Process. Eng. 2017, 4, 186–194. [Google Scholar] [CrossRef] [Green Version]
- Housecroft, C.E.; Sharpe, A.G. Inorganic Chemistry, 3rd ed.; Pearson Prentice Hall: Harlow, UK, 2008; ISBN 9780131755536. [Google Scholar]
- Lim Teik Zheng, A.; Phromsatit, T.; Boonyuen, S.; Andou, Y. Synthesis of silver nanoparticles/porphyrin/reduced graphene oxide hydrogel as dye adsorbent for wastewater treatment. FlatChem 2020, 23, 100174. [Google Scholar] [CrossRef]
- Idris, J.; Shirai, Y.; Anduo, Y.; Ali, A.A.M.; Othman, M.R.; Ibrahim, I.; Husen, R.; Hassan, M.A. Improved yield and higher heating value of biochar from oil palm biomass at low retention time under self-sustained carbonization. J. Clean. Prod. 2015, 104, 475–479. [Google Scholar] [CrossRef] [Green Version]
- Claoston, N.; Samsuri, A.W.; Ahmad Husni, M.H.; Mohd Amran, M.S. Effects of pyrolysis temperature on the physicochemical properties of empty fruit bunch and rice husk biochars. Waste Manag. Res. 2014, 32, 331–339. [Google Scholar] [CrossRef]
- Gokce, Y.; Aktas, Z. Nitric acid modification of activated carbon produced from waste tea and adsorption of methylene blue and phenol. Appl. Surf. Sci. 2014, 313, 352–359. [Google Scholar] [CrossRef]
- Sritham, E.; Gunasekaran, S. FTIR spectroscopic evaluation of sucrose-maltodextrin-sodium citrate bioglass. Food Hydrocoll. 2017, 70, 371–382. [Google Scholar] [CrossRef]
- Li, S.; Chen, G. Thermogravimetric, thermochemical, and infrared spectral characterization of feedstocks and biochar derived at different pyrolysis temperatures. Waste Manag. 2018, 78, 198–207. [Google Scholar] [CrossRef]
- Xu, Y.; Chen, B. Investigation of thermodynamic parameters in the pyrolysis conversion of biomass and manure to biochars using thermogravimetric analysis. Bioresour. Technol. 2013, 146, 485–493. [Google Scholar] [CrossRef] [PubMed]
- Polovina, M.; Babić, B.; Kaluderović, B.; Dekanski, A. Surface characterization of oxidized activated carbon cloth. Carbon NY 1997, 35, 1047–1052. [Google Scholar] [CrossRef]
- Kasnejad, M.H.; Esfandiari, A.; Kaghazchi, T.; Asasian, N. Effect of pre-oxidation for introduction of nitrogen containing functional groups into the structure of activated carbons and its influence on Cu (II) adsorption. J. Taiwan Inst. Chem. Eng. 2012, 43, 736–740. [Google Scholar] [CrossRef]
- Yang, K.; Fox, J.T. Adsorption of humic acid by acid-modified granular activated carbon and powder activated carbon. J. Environ. Eng. 2018, 144, 04018104. [Google Scholar] [CrossRef]
- Li, B.; Li, K. Effect of nitric acid pre-oxidation concentration on pore structure and nitrogen/oxygen active decoration sites of ethylenediamine -modified biochar for mercury (II) adsorption and the possible mechanism. Chemosphere 2019, 220, 28–39. [Google Scholar] [CrossRef]
- Su, P.; Zhang, J.; Tang, J.; Zhang, C. Preparation of nitric acid modified powder activated carbon to remove trace amount of Ni (II) in aqueous solution. Water Sci. Technol. 2019, 80, 86–97. [Google Scholar] [CrossRef] [PubMed]
- Yao, S.; Zhang, J.; Shen, D.; Xiao, R.; Gu, S.; Zhao, M.; Liang, J. Removal of Pb (II) from water by the activated carbon modified by nitric acid under microwave heating. J. Colloid Interface Sci. 2016, 463, 118–127. [Google Scholar] [CrossRef]
- Li, Y.; Du, Q.; Liu, T.; Peng, X.; Wang, J.; Sun, J.; Wang, Y.; Wu, S.; Wang, Z.; Xia, Y.; et al. Comparative study of methylene blue dye adsorption onto activated carbon, graphene oxide, and carbon nanotubes. Chem. Eng. Res. Des. 2013, 91, 361–368. [Google Scholar] [CrossRef]
- Li, K.; Jiang, Y.; Wang, X.; Bai, D.; Li, H.; Zheng, Z. Effect of nitric acid modification on the lead (II) adsorption of mesoporous biochars with different mesopore size distributions. Clean Technol. Environ. Policy 2016, 18, 797–805. [Google Scholar] [CrossRef]
- Lang, J.W.; Yan, X.B.; Liu, W.W.; Wang, R.T.; Xue, Q.J. Influence of nitric acid modification of ordered mesoporous carbon materials on their capacitive performances in different aqueous electrolytes. J. Power Sources 2012, 204, 220–229. [Google Scholar] [CrossRef]
- Thiemann, M.; Scheibler, E.; Wiegand, K.W. Nitric acid, nitrous acid, and nitrogen oxides. In Ullmann’s Encyclopedia of Industrial Chemistry; Wiley-VCH Verlag GmbH & Co. KGaA: Weinheim, Germany, 2012; pp. 177–223. [Google Scholar]
- Zhang, Y.; Xu, X.; Zhang, P.; Zhao, L.; Qiu, H.; Cao, X. Pyrolysis-temperature depended quinone and carbonyl groups as the electron accepting sites in barley grass derived biochar. Chemosphere 2019, 232, 273–280. [Google Scholar] [CrossRef] [PubMed]
- Liljenberg, M.; Stenlid, J.H.; Brinck, T. Mechanism and regioselectivity of electrophilic aromatic nitration in solution: The validity of the transition state approach. J. Mol. Model. 2018, 24. [Google Scholar] [CrossRef] [PubMed] [Green Version]
- Zhou, L.; Liu, Y.; Liu, S.; Yin, Y.; Zeng, G.; Tan, X.; Hu, X.; Hu, X.; Jiang, L.; Ding, Y.; et al. Investigation of the adsorption-reduction mechanisms of hexavalent chromium by ramie biochars of different pyrolytic temperatures. Bioresour. Technol. 2016, 218, 351–359. [Google Scholar] [CrossRef]
- Fan, S.; Wang, Y.; Wang, Z.; Tang, J.; Tang, J.; Li, X. Removal of methylene blue from aqueous solution by sewage sludge-derived biochar: Adsorption kinetics, equilibrium, thermodynamics and mechanism. J. Environ. Chem. Eng. 2017, 5, 601–611. [Google Scholar] [CrossRef]
- Liu, S.; Li, J.; Xu, S.; Wang, M.; Zhang, Y.; Xue, X. A modified method for enhancing adsorption capability of banana pseudostem biochar towards methylene blue at low temperature. Bioresour. Technol. 2019, 282, 48–55. [Google Scholar] [CrossRef]
- Kah, M.; Sigmund, G.; Xiao, F.; Hofmann, T. Sorption of ionizable and ionic organic compounds to biochar, activated carbon and other carbonaceous materials. Water Res. 2017, 124, 673–692. [Google Scholar] [CrossRef]
- Lach, J.; Okoniewska, E.; Stepniak, L.; Ociepa-Kubicka, A. The influence of modification of activated carbon on adsorption of Ni (II) and Cd (II). Desalin. Water Treat. 2014, 52, 3979–3986. [Google Scholar] [CrossRef]
Figure 1.
FTIR spectra of functionalized biochar (EFB-FBC), EFB-BC, and EFB-24 h.

Figure 2.
Thermogravimetric (TG) and differential thermogravimetric (DTG) curves of EFB-BC, EFB-FBC, and EFB-24 h.
Figure 2.
Thermogravimetric (TG) and differential thermogravimetric (DTG) curves of EFB-BC, EFB-FBC, and EFB-24 h.

Figure 3.
SEM micrograph (1000× magnification) of (a) EFB-BC and (b) EFB-FBC.
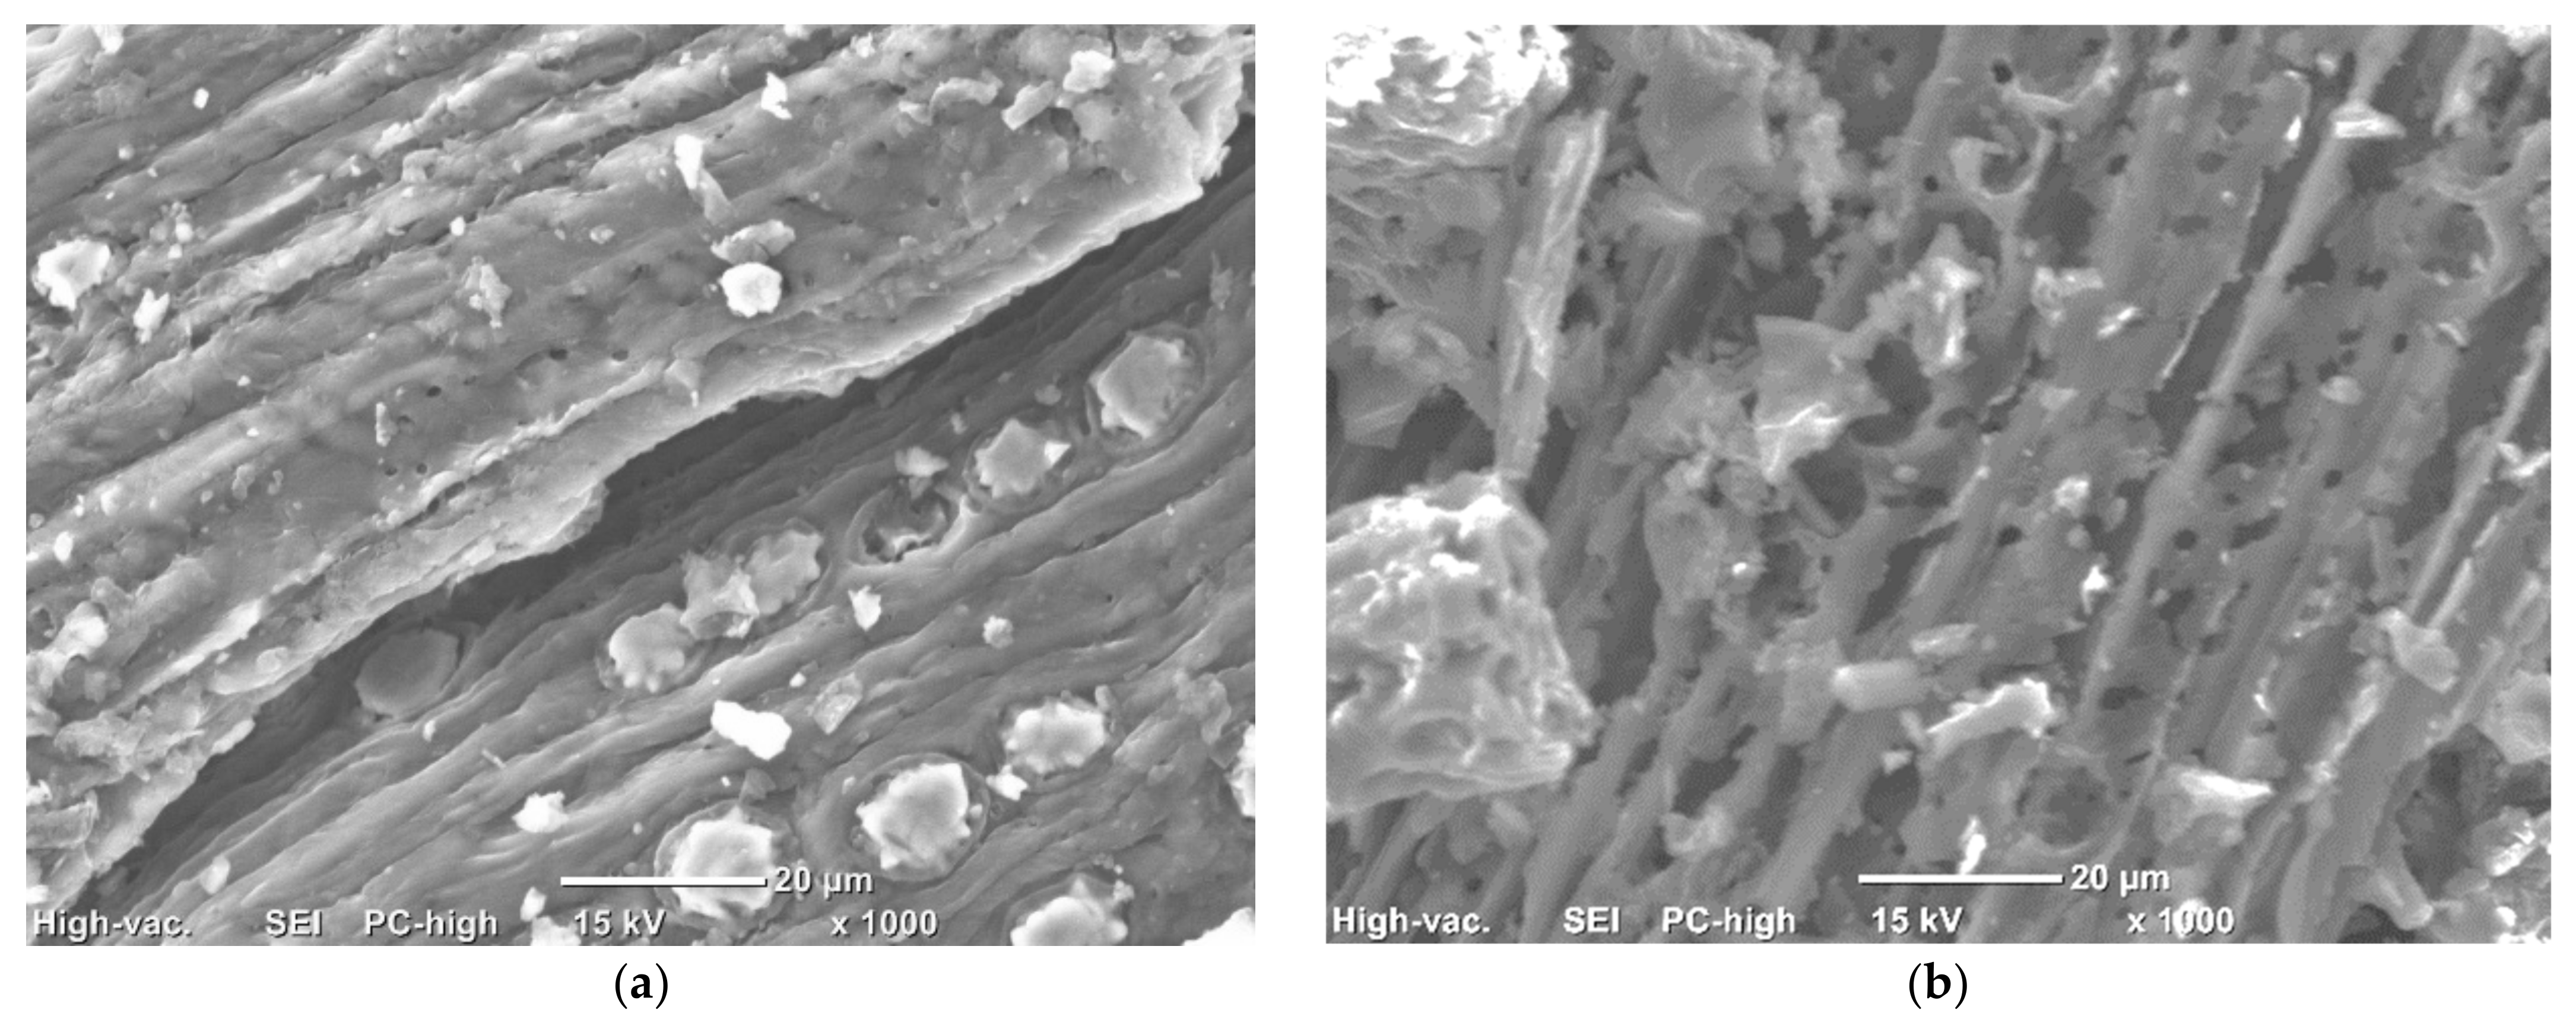
Figure 4.
Elemental composition of EFB-BC and EFB-FBC.

Figure 5.
FTIR spectra of EFB-FBC before and after MB adsorption.

Table 1.
N2 and CO2 adsorption data.
| N2 Adsorption | CO2 Adsorption | ||||
|---|---|---|---|---|---|
| aSBET (m2/g) | VT (cm3/g) | DP (nm) | amic (m2/g) | Vmic (cm3/g) | |
| EFB-BC | 3.7855 | 0.01836 | 19.401 | 3.44 | 0.1396 |
| EFB-FBC | 3.0499 | 0.01476 | 19.363 | 2.86 | 0.1312 |
Table 2.
Nitric acid functionalization of carbon materials.
| Carbon Material | Nitric Acid Concentration (v/v%) | Treatment Time (min) | Treatment Temperature (°C) | Reference |
|---|---|---|---|---|
| Biomass-based bagasse biochar | 10–25 | 360 | 60 | [39] |
| Coal-based activated carbon | 5–20 | 120 | 100 | [40] |
| Waste tea activated carbon | 20–80 | N/A a | 90 | [32] |
| Rice husk activated carbon | 42–71 | 20–50 | 90–150 | [41] |
| Activated carbon, carbon nanotube, and graphene oxide | N/A a | 30 | 140 | [42] |
| Carbon cloth | 68 | 60 | 90 | [36] |
| Bagasse activated carbon | 32.5 | 300 | 60 | [43] |
| Mesoporous carbon | 68 | 120 | 60 | [44] |
| Oil palm empty fruit bunch biochar | 6 | 60 | 132 | This study |
a 100 mL nitric acid solution at stated treatment time and temperature. No concentration value reported.
Table 3.
Langmuir isotherm model constants.
| qmax (mg/g) | Kads (L/mg) | R2 |
|---|---|---|
| 62.11 ± 0.14 | 0.9938 ± 0.0036 | 0.9991 |
Table 4.
Kinetic model constants for EFB-FBC adsorption of methylene blue (MB).
| Model | Constants | |
|---|---|---|
| Pseudo-first order | Qe1 (mg/g) | 42.674 ± 0.316 |
| k1 (1/min) | 0.076 ± 0.006 | |
| R2 | 0.9402 | |
| Pseudo-second order | Qe2 (mg/g) | 45.662 ± 0.338 |
| k2 (g/mg.min) | 0.015 ± 0.003 | |
| R2 | 0.9666 | |
| Intraparticle diffusion | kp1 | 17.312 ± 0.140 |
| R21 | 0.9991 | |
| kp2 | 9.007 ± 0.073 | |
| R22 | 0.9901 | |
| kp3 | 7.817 ± 0.063 | |
| R23 | 0.9703 |
Publisher’s Note: MDPI stays neutral with regard to jurisdictional claims in published maps and institutional affiliations. |
© 2021 by the authors. Licensee MDPI, Basel, Switzerland. This article is an open access article distributed under the terms and conditions of the Creative Commons Attribution (CC BY) license (http://creativecommons.org/licenses/by/4.0/).
Share and Cite
MDPI and ACS Style
Ibrahim, I.; Tsubota, T.; Hassan, M.A.; Andou, Y. Surface Functionalization of Biochar from Oil Palm Empty Fruit Bunch through Hydrothermal Process. Processes 2021, 9, 149. https://doi.org/10.3390/pr9010149
AMA Style
Ibrahim I, Tsubota T, Hassan MA, Andou Y. Surface Functionalization of Biochar from Oil Palm Empty Fruit Bunch through Hydrothermal Process. Processes. 2021; 9(1):149. https://doi.org/10.3390/pr9010149
Chicago/Turabian StyleIbrahim, Izzudin, Toshiki Tsubota, Mohd Ali Hassan, and Yoshito Andou. 2021. "Surface Functionalization of Biochar from Oil Palm Empty Fruit Bunch through Hydrothermal Process" Processes 9, no. 1: 149. https://doi.org/10.3390/pr9010149
Note that from the first issue of 2016, this journal uses article numbers instead of page numbers. See further details here.