
A Cotton High-Efficiency Water-Fertilizer Control System Using Wireless Sensor Network for Precision Agriculture


College of Mechanical and Electrical Engineering, Shihezi University, Shihezi 832003, China
*
Author to whom correspondence should be addressed.
Processes 2021, 9(10), 1693; https://doi.org/10.3390/pr9101693
Submission received: 2 September 2021
/
Revised: 15 September 2021
/
Accepted: 17 September 2021
/
Published: 22 September 2021
(This article belongs to the Special Issue Challenges in Machine Learning, Artificial Intelligence, Wireless Sensor Networks and Smart Cities)
Abstract
:Scientific researchers have applied newly developed technologies, such as sensors and actuators, to different fields, including environmental monitoring, traffic management, and precision agriculture. Using agricultural technology to assist crop fertilization is an important research innovation that can not only reduce the workload of farmers, but also reduce resource waste and soil pollution. This paper describes the design and development of a water-fertilizer control system based on the soil conductivity threshold. The system uses a low-cost wireless sensor network as a data collection and transmission tool and transmits the data to the decision support system. The decision support system considers the change in soil electrical conductivity (EC) and moisture content to guide the application of water-fertilizer, and then improves the fertilization accuracy of the water-fertilizer control system. In the experiment, the proposed water-fertilizer control system was tested, and it was concluded that, compared with the existing traditional water-fertilizer integration control system, the amount of fertilizer used by the system was reduced by 10.89% on average, and it could save 0.76–0.87 tons of fertilizer throughout the whole growth period of cotton.
1. Introduction
Crop yield is closely related to soil texture, and the improvement of the physical and chemical properties of soil can increase crop yield [1,2,3,4]. Soil texture is an important basis for drawing up soil utilization, management, and improvement measures, and the texture of the cultivated layer can be adjusted through farming and fertilization activities [5]. However, to increase crop yield, an increasing number of chemical fertilizers are being used in agricultural production, and the improper use of chemical fertilizers is gradually increasing. In 2011, the FAO pointed out that approximately 175.5 million tons of chemical fertilizers were used in agriculture to achieve the best crop yield [6]. A large amount of chemical fertilizers are deposited in the soil, resulting in a decline in crop yield and quality, environmental damage, and soil pollution [7,8].
Water-fertilizer integration technology [9] has been developed and applied rapidly in developed places such as Israel, Europe, and America, and this technology has the characteristics of high efficiency, water savings, and fertilizer savings [10]. At present, with the development of integrated sensor technology and wireless communication technology, the water-fertilizer integration system based on sensors has been greatly innovated and applied to agricultural production for scientific management, thus realizing the accurate and sustainable development of agriculture [11]. Canfora [12] pointed out that precision agriculture [13,14] represents the direction of agricultural development and is undoubtedly one of the most important technological changes in the 21st century. Among the research contents of precision agriculture, research on precision fertilization control systems of liquid fertilizer is an important technology that can improve the intelligence and precision of agriculture.
Xue Xiuyun [15] designed a variable depth fertilization system of liquid fertilizer, analyzed the relationship among the parameters of the system, and established a mathematical model according to the experimental data, which provided a reference for subsequent research on precision fertilization. Rui Liu [11] proposed a model of the precise regulation and control of alfalfa water and fertilizer based on an agricultural network physical system. The model accounts for alfalfa growth, its physical environment, and an irrigation strategy to improve the precise regulation of water and fertilizer. Yubin [16] designed an accurate water-fertilizer control system to solve the problem of accurate water-fertilizer control during agricultural fertilization and irrigation. The system adopts PID (proportional-integral-differential) control technology to accurately control the EC and pH of water-fertilizer. Zhang Yubin [17] designed a control model combining PID control, fuzzy control, and grey predictive control and designed, developed, and applied a high-efficiency water and fertilizer controller based on the model design. Khriji [18] proposed a precise irrigation system that realized precise irrigation through comprehensive analysis of external environmental data. Barkunan [19] proposed an automatic drip irrigation system that uses smartphones to collect soil images and calculate soil moisture and then uploads the data to the microcontroller through the GSM module, and then the microcontroller makes irrigation decisions. Compared with the modern drip irrigation method, the system uses nearly 13% less water. Chen Xiaoping [20] proposed a decision support system for irrigation scheduling (DSSIS) based on forecasting rainfall and the cotton water stress index. References [21,22,23,24] introduce different automatic irrigation management systems for specific sites. Based on the transpiration estimation of the Man Pen-montes model and the control strategy of leachate concentration of conductivity measurement, Steidle Neto [25] developed an automatic control system for real-time preparation and application of tomato fertilizer solution.
In addition, Israr Ullah [26] used the Kalman filter algorithm to accurately predict indoor climate parameters from noise sensor readings, used a learning module based on a neural network to estimate the error in current readings, and applied the Kalman filter algorithm based on a neural network to the prediction of intelligent greenhouse environments, which improves the accuracy of the prediction algorithm under dynamic conditions. Zheng [27] used wireless sensors to collect various environmental factors in greenhouses and then built a ZigBee self-organizing wireless sensor network to realize the intelligent control of the greenhouse environment. Yang [28] designed a greenhouse environmental monitoring system based on Wi-Fi wireless communication technology, which has been applied in greenhouses of many large-scale agricultural parks.
There is a great deal of research on greenhouse crop control technology. However, research on field crop control is very rare. Xinjiang has a vast agricultural operation area, and the integrated technology of water and fertilizer under mulch drip irrigation was applied earlier. In 2012, the cotton area under mulch drip irrigation in Xinjiang exceeded 11.3 hm2 [29]. It is very important to design and optimize water and fertilizer control systems when popularizing and applying the integrated water and fertilizer technology for cotton drip irrigation under a plastic film. Therefore, we developed an efficient water and fertilizer control system for cotton in Xinjiang. The system uses a low-cost wireless sensor network as a data collection and transmission tool, and it transmits the data to the decision support system. The decision support system considers the changes of soil EC and water moisture content, and controls the soil EC and soil moisture content at an appropriate level by setting the threshold values, thus achieving the purpose of accurately adjusting the amount of water and fertilizer application and improving the fertilization accuracy of the water.
Sensor Node Deployment Scheme
Sensors are devices, modules, or subsystems for sensing and observing environmental changes or events; they mainly collect and send data [30]. In agriculture, sensors are typically used to measure soil conditions, crops, environment, liquid level, and flow rate, and then are used together with other electronic devices to form a monitoring or control system [31,32]. There are often errors and uncertainties in single sensor measurement [33], while multisensor measurement deploys sensor nodes in different positions, and the collected data are more valuable.
The deployment scheme of multisensor nodes plays a decisive role in the effective life cycle and stability of the system [34]. A reasonable node deployment scheme can not only increase the limited coverage area of network nodes, but also greatly reduce the energy loss of the system. The key to node deployment lies in the optimal distribution of sensor nodes, which can ensure effective network coverage and minimize installation cost. In this paper, the deployment scheme of terminal nodes is determined by studying the regional coverage rate, the data connectivity rate between nodes, and the operation life cycle of the system network.
2. Proposed Water-Fertilizer Control System
2.1. Noise Filtering Technology
In the process of data collection, due to the interference of many noise factors, the collected data often contains abnormal values, which affects the quality of data collection. Therefore, the data collected by sensors must be processed before they are used to reduce or eliminate these abnormal values. There are many methods to process sensor data, such as simple moving average (SMA), weighted moving average (WMA), exponential moving average (EMA), and so on [35]. Among them, the SMA is the simplest method to eliminate noise from time series data, but it often has a great lag. Compared with the SMA, the WMA and EMA have a smaller lag. To make the processed data smooth enough when the fluctuation of the time series itself is not obvious, capture quickly when the time series changes greatly, and minimize the lag, the fractal adaptive moving average (FRAMA) [36] was adopted in this paper. The FRAMA definition can be determined by the following equations.
where, is the FRAMA of data points at time k – 1. α is the smoothing weight coefficient, and its value range is 0.01~1. For a given window T (including T data points), D is the fractal dimension in the time window 2T from the current time point k. G1 is the quotient of the max-min within the window W1 and the width of the window W1, G2 is the quotient of the max-min within the window W2 and the width of the window W2, G3 is the quotient of the max-min within the window W and the width of the window W. W1 is the window from time k to time k – T + 1, W2 is the window from time k − T to time k – 2T + 1, W is the window from time k to time k − 2T + 1, and W = W1 + W2. (W1)max, (W2)max, (W)max are the maximum values in windows W1, W2, W respectively, and (W1)min, (W2)min, (W)min are the minimum values in windows W1, W2, W respectively.
α = e−4.6 × (D − 1)
Data smoothing can compensate for the lost data due to sensor or other electrical system failures. In practice, the number of data points (T) used for data smoothing depends on the type of measured data. High-fluctuation data are smoothed with more data points, while low-fluctuation data are smoothed with fewer data points. In this paper, more data points than soil water content, soil EC, and electromagnetic flowmeter are defined to smooth the climate data of environmental sensors.
2.2. System Architecture and Deployment
Figure 1 is the structural diagram of the water-fertilizer control system. The system is mainly composed of three parts: the monitoring node, central control unit, and fertilization/irrigation unit, as follows:
(1) Monitoring Node
Among the monitoring nodes, Node MCU is a sensor node that sends and receives data. The monitoring nodes include air temperature and humidity sensors, soil humidity sensors, and soil conductivity sensors. The SHT20 temperature and humidity sensor is selected to measure air temperature and humidity, the RS-WS-*-TR-1 soil humidity sensor is selected to measure soil humidity, the ST-EC-V23-A1 soil conductivity sensor is selected to measure soil EC value, and the Node MCU is used as the main microcontroller for data transmission to summarize the data measured from the sensors. The MCU is used because it is an MCU integrated with the Wi-Fi function, which is not only easy to develop, but is also inexpensive. However, the Node MCU can only transmit data up to 300 m away without hindrance. Therefore, the system enhances the data uplink transmission capability through the sink node, as shown in Figure 2, which is the regular hexagonal node deployment scheme of the system.
(2) Central Control Unit
In the central control unit, STM32F103RET6 is selected as the main controller, which is the management node responsible for receiving and transmitting data from sensor nodes as well as the decision support unit responsible for the water-fertilizer control strategy. As a management node, the main controller receives time series data from monitoring nodes. As a decision support unit of water-fertilizer control strategy, the main controller forwards the data to the decision support system and makes decisions and then drives the corresponding pumps in the water-fertilizer control system. In any application, the precise implementation of a control strategy depends on the selection of appropriate technology, sensors, and parameters to be monitored [37], and the selection of parameters varies with the application. To achieve the best fertilizer efficiency, in our research, the pipeline is filled with water first, then liquid fertilizer is introduced, and finally irrigation water is introduced in the application process of liquid fertilizer. The amount of water applied with fertilizer solution is closely related to the soil moisture content and environmental temperature and humidity. The water-fertilizer control strategy of the system is designed by judging whether the soil EC and soil moisture content exceed the threshold, as shown in Figure 1, so the soil conductivity sensor and soil moisture sensor are selected. Soil EC is very important to consider for making an accurate water-fertilizer plan. When the difference between the soil EC sensing value and fertilizer EC value is lower than the threshold value, the region needs fertilizer solution.
(3) Fertilization/Irrigation Unit
In this system, the fertilization/irrigation unit adopts drip irrigation technology under film, which is mainly composed of water and fertilizer supply system, pump, valve, main drip irrigation pipeline, and each branch pipeline. First, the central controller sends a decision signal to the serial port-to-space vector pulse width modulation (SVPWM) module, and the serial port-to-SVPWM module outputs three-phase six-channel SVPWM waves with the corresponding frequency and duty ratio and then drives the motor through the intelligent power module (IPM) so that the fertilizer/water pump can rotate at different speeds. Among them, the decision support system determines the running status of the motor according to whether the difference between the soil EC sensing value and the fertilizer EC value is within the threshold range. In addition, in order to measure the amount of liquid fertilizer, an electromagnetic flow sensor is installed in the system.
2.3. Proposed Decision Support System
The system collects relevant parameters from the soil and environment through sensors of monitoring nodes deployed in farmland, and the collected data are forwarded to the microprocessor for processing, and then they are transmitted to the central control unit through the gateway. The data sensed by three different sensors are merged into one data packet, and then these data packets are forwarded to the noise detection and elimination module. After eliminating abnormal values, the data are stored, uploaded to the cloud platform, and entered into the decision support system for further processing. In the decision support system, these data packets are checked by comparing different parameters with their thresholds (especially soil EC values). For example, the soil EC threshold is determined by the known EC value of fertilizer solution, and if the data are within the defined threshold range, the data are stored in the database. In contrast, the pump start-stop control signal is sent to the main controller of the central control unit to control the pump to start or stop. In the system we studied, the EC value of the fertilizer solution was 150 μs/cm. When the absolute value of the difference between the soil EC sensing value and fertilizer EC value is less than 50 μs/cm, the main controller controls the pump to stop. When the absolute value of the difference between the soil EC sensing value and the fertilizer EC value is greater than 50 μs/cm, the main controller controls the pump to start. Particularly, when the difference between the soil EC sensing value and fertilizer EC value is greater than 50 μs/cm, the main controller controls the water pump to start independently under decision-making assisted by environmental information. Figure 3 summarizes the workflow of the water and fertilizer control system studied.
3. Experimental Setup and Results
3.1. Experimental Setup
The field experiment was carried out in a plot of 30 × 22 m2 at the experimental base of No. 146 regiment in Shihezi, Xinjiang. The locations obtained by GPS were 44.31 and 86.06 (latitude and longitude), and the altitude was 466 meters. Compared with the traditional water-fertilizer integrated control system, the effect of the proposed water-fertilizer control system was tested, and the effectiveness of the water-fertilizer control strategy of the system was verified. In the experiment, the traditional water-fertilizer integrated control system was a water-fertilizer drip irrigation system based on a predefined time. By means of pressure irrigation system or natural drop of terrain, the system directly supplies the liquid fertilizer and irrigation water to crops in a set time according to the proportion through the pipeline system, so as to meet the demand of crops for water and nutrients in a timely and appropriate manner and realize synchronous management of water and fertilizer. Cotton, a field crop in Xinjiang, was used as a drip irrigation object in this experiment. The selected fertilizer was compound liquid fertilizer of Voda Agricultural Science and Technology Co., Ltd., Xinjiang, China and the test time was from April 15 to 17, 2021. Figure 4 provides deployment photos of monitoring nodes in the test plot, and Figure 5 is the field test diagram. All measurements were collected every 5 min during the whole test.
3.2. Data Processing
To compare the effect of the data filtering algorithm, a comparison before and after data filtering was made. Figure 6 shows the filtering curve of soil water content data before and after filtering, and the data were collected every five minutes. Figure 6a shows the data collection without the filtering algorithm from 10:00 to 12:00 in the morning, and Figure 6b shows the data collection with the filtering algorithm from 16:00 to 18:00 in the afternoon.
In Figure 6a, the soil water content received at 10:15 is 16%, representing the latest data, while the data of 47% soil water content collected at 10:10 is the last accurate value stored in the database, and their difference is far greater than the defined threshold (10%). Therefore, the data at this time are temporarily stored until the next group of data comes. The data received at 10:20 matches the data collected at 10:10, and their difference is 2, which is lower than the threshold value; therefore, the temporarily stored data are abnormal values, which are replaced by the average value of the data collected at 10:10 and 10:20 and then stored in the database. In another case, the soil water content received at 10:45 is 58%, and the difference from the last accurate value stored in the database (47% at 10:40) is larger than the defined threshold. At this time, the data are temporarily stored. The data received at 10:50 are similar to the temporarily stored data, so both values are stored in the database.
By comparison, it can be seen that after filtering the collected data, the quality of the collected data is not only obviously improved but also the inconsequential outliers are greatly reduced. Figure 6a shows the data acquisition without the filtering algorithm, and the error rate reaches 4.0%. Figure 6b shows the data acquisition with the filtering algorithm, and the error rate is zero.
3.3. Analysis of Results
Figure 7, Figure 8 and Figure 9 show the related measurement data of the soil EC value, soil water content, and electromagnetic flowmeter in the field test for three days. The working time of the system is from 10:00 to 20:00. Before each fertilization, water is supplied first, then liquid fertilizer is supplied, and finally water is supplied again. The threshold value of soil EC is 100 μs/cm to 200 μs/cm. The threshold value of the soil water content is 40% to 80%. As shown in the figure, when the soil EC is greater than 200 μs/cm (before point A in Figure 7), under the action of the decision support system, the water pump runs, the system carries out irrigation, the soil EC decreases, and the water content increases. When the soil EC is between 100 μs/cm and 200 μs/cm (point A–B in Figure 7), the system causes the water/fertilizer pump to stop running. When the soil EC is less than 100 μs/cm (point B–C in Figure 7), under the action of a decision support system, the water/fertilizer pump is caused to apply liquid fertilizer. The time for water/fertilizer to flow through the drip irrigation pipeline of the system is different, so there is still a time lag in the system to a certain extent. For example, the water pump stops running after point A, but due to time lag, there is still a large amount of irrigation water in the drip irrigation pipeline, and the soil moisture content at point A–B still increases for a short time. In addition, the factors affecting soil EC and water content are not only irrigation and fertilization, but also meteorological factors, cotton canopy evapotranspiration, and other factors. For example, there was short-term light rain on the second and third days, so there were many obvious fluctuations in soil EC and water content. It can be observed that before and after the system works, the soil EC value and water content gradually stabilize within the set threshold range.
Traditional water and fertilizer integrated control systems apply water-fertilizer to crops in different growth cycles according to artificial experience, which often has the problems of wasting water and fertilizer resources and soil pollution. Figure 9 is a diagram comparing the liquid fertilizer usage between the water-fertilizer control system proposed in this paper and the traditional water-fertilizer integrated control system based on time. The liquid fertilizer applied by the water-fertilizer control system proposed in this paper is obviously less than that of the traditional water-fertilizer integrated control system, and the average fertilizer consumption per mu is reduced by 10.89%. In addition, the sample plot used in this experiment was limited (approximately 1 mu), and in the actual situation of Xinjiang, the area of one-time fertilization in cotton fields was generally more than 100 mu. Therefore, when this system is applied in an actual cotton field, it can save at least 32.7 kg/100 mu of fertilizer at the seedling stage and 0.76–0.87 tons/100 mu of fertilizer during the entire growth period of cotton.
Based on these experimental results, the proposed water-fertilizer control system can accurately adjust the water and fertilizer according to the soil water content and soil EC threshold. The implementation of the system can not only improve the soil water condition but also reduce the risk of soil pollution. It can be concluded that the proposed water-fertilizer control system is an effective water-fertilizer application strategy, and the efficiency of agricultural water-fertilizer consumption is significantly improved by adopting the proposed water-fertilizer control system. In the current research, we mainly focus on developing a water-fertilizer decision-making control system considering the changes in soil electrical conductivity and soil water content. However, farmland is a system greatly influenced by the external environment, and there are many factors that affect crop growth, of which soil electrical conductivity and soil water content are only some factors. For future systems, it is recommended to install more different kinds of sensors (such as soil pH sensors, soil temperature sensors, light intensity sensors and carbon dioxide sensors) to obtain more data to study the interaction among the data and the influence of each data point on crop growth. In addition, it is recommended to use deep learning technology to establish a cotton growth evaluation model and realize intelligent monitoring of cotton with dynamic thresholds and to improve wireless network communication capabilities and study data transmission networks that can cover a larger range.
4. Discussion
In this study, the application of water-fertilizer was guided by controlling soil moisture and soil conductivity which are closely related to cotton growth. With the research of greenhouse crop control system by many researchers (such as Section 1), the cotton high-efficiency water-fertilizer control system developed by this system is more suitable for Xinjiang field crops. In addition, the system uses a low-cost wireless sensor network as a data collection and transmission tool and controls soil electrical conductivity and soil moisture content within the threshold range suitable for cotton growth under the action of decision support system, as shown in Figure 7 and Figure 8. As shown in Figure 9, compared with the traditional water-fertilizer integrated control system, using this system can reduce the fertilizer per mu by 10.89% on average. Therefore, this system puts forward an effective water-fertilizer application strategy suitable for cotton, which significantly improves the efficiency of agricultural water and fertilizer consumption.
5. Conclusions
This paper mainly introduces the design and implementation of cotton high-efficiency water-fertilizer control systems based on low-cost wireless sensor networks. The proposed water-fertilizer decision support system considers both soil EC value and the soil moisture content. By setting the threshold values of soil EC value and soil moisture content, the soil EC and soil moisture content are controlled at an appropriate level, thus achieving the purpose of accurately adjusting the application amount of water and fertilizer, and the reliability and accuracy have been significantly improved. Therefore, the proposed water-fertilizer decision support system is effective in improving accurate fertilization. The experimental results show that the water-fertilizer control system can save 10.89% of water-fertilizer per mu on average, and the amount of water-fertilizer used is significantly reduced. It can be concluded that the system can help improve the efficiency of water-fertilizer use and has certain significance for the sustainable development of agriculture.
Author Contributions
This study was conceptualized by C.D. and L.Z. The system was designed by C.D. and validated by X.M. and X.L. C.D. provided resources and C.D. curated data. The original draft of the manuscript was prepared by C.D., R.Z. Y.S., X.M. and H.L. reviewed and edited the manuscript. L.Z. assisted with project administration and X.L. managed funding acquisition. All authors have read and agreed to the published version of the manuscript.
Funding
This research was funded by the National Natural Science Foundation of China, grant number 52065055.
Institutional Review Board Statement
Not applicable.
Informed Consent Statement
Not applicable.
Data Availability Statement
All relevant data presented in the article are stored according to institutional requirements and, as such, are not available online. However, all data used in this Manuscript can be made available upon request to the authors.
Conflicts of Interest
The authors declare no conflict of interest.
References
- Pittelkow, C.M.; Liang, X.Q.; Linquist, B.A.; van Groenigen, K.J.; Lee, J.; Lundy, M.E.; van Gestel, N.; Six, J.V.E.; Venterea, R.T.; van Kessel, C. Productivity limits and potentials of the principles of conservation agriculture. Nature 2015, 517, 365–368. [Google Scholar] [CrossRef]
- Kader, A.; Senge, M.; Mojid, M.; Ito, K. Recent advances in mulching materials and methods for modifying soil environment. Soil Tillage Res. 2017, 168, 155–166. [Google Scholar] [CrossRef]
- Zheng, C.; Jiang, Y.; Chen, C.; Sun, Y.; Feng, J.; Deng, A.; Song, Z.; Zhang, W. The impacts of conservation agriculture on crop yield in China depend on specific practices, crops and cropping regions. Crop J. 2014, 2, 289–296. [Google Scholar] [CrossRef] [Green Version]
- Xiao, L.; Ding, M.; Wei, C.; Zhu, R.; Zhao, R. The Impacts of Conservation Agriculture on Water Use and Crop Production on the Loess Plateau: From Know-What to Know-Why. Sustainability 2020, 12, 7449. [Google Scholar] [CrossRef]
- Baryga, A.; Połeć, B.; Klasa, A. Quality of Sugar Beets under the Effects of Digestate Application to the Soil. Processes 2020, 8, 1402. [Google Scholar] [CrossRef]
- FAO; WHO. Evaluation of Certain Food Additives Eighty-Seventh Report of the Joint FAO/WHO Expert Committee on Food Additives; World Health Organization: Geneva, Switzerland, 2019; Volume 1020. [Google Scholar]
- Gan, L. Environmental risks of fertilizer use and the prevention and control measures in Chinese rural areas. Chim. OG-GI-Chem. Today 2016, 34, 33–38. [Google Scholar]
- Ajeng, A.A.; Abdullah, R.; Malek, M.A.; Chew, K.W.; Ho, Y.-C.; Ling, T.C.; Lau, B.F.; Show, P.L. The Effects of Biofertilizers on Growth, Soil Fertility, and Nutrients Uptake of Oil Palm (Elaeis Guineensis) under Greenhouse Conditions. Processes 2020, 8, 1681. [Google Scholar] [CrossRef]
- Lv, X.; Pan, D.-M. Research on the water-fertilizer integration and coordination management pattern of cotton with drip irrigation under mulch film. In Proceedings of the 2009 4th International Conference on Computer Science & Education, Nanning, China, 25–28 July 2009; pp. 929–932. [Google Scholar]
- Wang, C.; Zhao, C.; Zhang, X.; Qiao, X.; He, Y. Research and Exploitation of Precise Irrigation-Fertilization Controller. In Proceedings of the 2007 2nd IEEE Conference on Industrial Electronics and Applications, Harbin, China, 23–25 May 2007; pp. 172–175. [Google Scholar] [CrossRef]
- Liu, R.; Zhang, Y.; Ge, Y.; Hu, W.; Sha, B. Precision Regulation Model of Water and Fertilizer for Alfalfa Based on Agriculture Cyber-Physical System. IEEE Access 2020, 8, 38501–38516. [Google Scholar] [CrossRef]
- Canfora, L.; Malusà, E.; Salvati, L.; Renzi, G.; Petrarulo, M.; Benedetti, A. Short-term impact of two liquid organic fertilizers on Solanum lycopersicum L. rhizosphere Eubacteria and Archaea diversity. Appl. Soil Ecol. 2014, 88, 50–59. [Google Scholar] [CrossRef]
- Zhang, N.Q.; Wang, M.H.; Wang, N. Precision agriculture—A worldwide overview. Comput. Electron. Agric. 2002, 36, 113–132. [Google Scholar] [CrossRef]
- Hakkim, V.M.A.; Joseph, E.A.; Gokul, A.J.A.; Mufeedha, K. Precision Farming: The Future of Indian Agriculture. J. Appl. Biol. Biotechnol. 2016, 4, 68–72. [Google Scholar] [CrossRef] [Green Version]
- Xiuyun, X.; Xufeng, X.; Zelong, Z.; Bin, Z.; Shuran, S.; Zhen, L.; Tiansheng, H.; Huixian, H. Variable Rate Liquid Fertilizer Applicator for Deep-fetilization in Precision Farming Based on ZigBee Technology. IFAC-PapersOnLine 2019, 52, 43–50. [Google Scholar] [CrossRef]
- Yubin, Z.; Zhengying, W.; Lei, Z.; Weibing, J. The Control Strategy and Verification for Precise Water-Fertilizer Irrigation System. In Proceedings of the 2018 Chinese Automation Congress (CAC), Xi’an, China, 30 November–2 December 2018; pp. 4288–4292. [Google Scholar]
- Zhang, Y.; Wei, Z.; Lin, Q.; Zhang, L.; Xu, J. MBD of grey prediction fuzzy-PID irrigation control technology. Desalin. Water Treat. 2018, 110, 328–336. [Google Scholar] [CrossRef] [Green Version]
- Khriji, S.; El Houssaini, D.; Jmal, M.W.; Viehweger, C.; Abid, M.; Kanoun, O. Precision irrigation based on wireless sensor network. IET Sci. Meas. Technol. 2014, 8, 98–106. [Google Scholar] [CrossRef]
- Barkunan, S.R.; Bhanumathi, V.; Sethuram, J. Smart sensor for automatic drip irrigation system for paddy cultivation. Comput. Electr. Eng. 2019, 73, 180–193. [Google Scholar] [CrossRef]
- Chen, X.; Qi, Z.; Gui, D.; Sima, M.W.; Zeng, F.; Li, L.; Li, X.; Gu, Z. Evaluation of a new irrigation decision support system in improving cotton yield and water productivity in an arid climate. Agric. Water Manag. 2020, 234, 106139. [Google Scholar] [CrossRef]
- Das, J.; Cross, G.; Qu, C.; Makineni, A.; Tokekar, P.; Mulgaonkar, Y.; Kumar, V. Devices, Systems, and Methods for Automated Mon-itoring enabling Precision Agriculture. In Proceedings of the IEEE International Conference on Automation Science and Engineering, Gothenberg, Sweden, 24–28 August 2015; pp. 462–469. [Google Scholar]
- Rubio-Castro, E.; Ponce-Ortega, J.M.; Cervantes-Gaxiola, M.E.; Hernández-Calderón, O.M.; Ortiz-del-Castillo, J.R.; Milán-Carrillo, J.; Hernández-Martínez, J.F.; Meza-Contreras, J.A. Optimal design of integrated agricultural water networks. Comput. Chem. Eng. 2016, 84, 63–82. [Google Scholar] [CrossRef]
- Wang, Z.; Bian, Q.; Zhang, J.; Zhou, B. Optimized Water and Fertilizer Management of Mature Jujube in Xinjiang Arid Area Using Drip Irrigation. Water 2018, 10, 1467. [Google Scholar] [CrossRef] [Green Version]
- Wen, Y.; Wang, Z.; Guo, L.; Li, W. Establishing a Physiology-Yield-Quality Evaluation Model for Optimizing Drip Irrigation on Grape Fields in Extremely Arid Regions. Appl. Eng. Agric. 2021, 37, 267–278. [Google Scholar] [CrossRef]
- Steidle Neto, A.J.; Zolnier, S.; Lopes, D.D.C. Development and evaluation of an automated system for fertigation control in soilless tomato production. Comput. Electron. Agric. 2014, 103, 17–25. [Google Scholar] [CrossRef]
- Ullah, I.; Fayaz, M.; Naveed, N.; Kim, D. ANN Based Learning to Kalman Filter Algorithm for Indoor Environment Prediction in Smart Greenhouse. IEEE Access 2020, 8, 159371–159388. [Google Scholar] [CrossRef]
- Zheng, H. Design and application for greenhouse environment monitoring system based on ZigBee. J. Chang. Norm. Univ. 2018, 8, 42–45. [Google Scholar]
- Yang, F.; Xie, T.; Wu, Y.; Su, W. Design of monitoring system for greenhouse environment of agricultural Internet of Things based on WIFI. Jisuanji Celiang Yu Kongzhi 2017, 2, 50–53. [Google Scholar]
- Zou, J.; Chen, S.; Huang, Y.; Xing, Q. Spatiotemporal changes in cotton growing areas in XinJiang (2000–2015). Bangladesh J. Bot. 2017, 46, 1213–1224. [Google Scholar]
- Rawat, P.; Singh, K.D.; Chaouchi, H.; Bonnin, J.M. Wireless sensor networks: A survey on recent developments and potential synergies. J. Supercomput. 2014, 68, 1–48. [Google Scholar] [CrossRef]
- Feng, X.; Yan, F.; Liu, X. Study of Wireless Communication Technologies on Internet of Things for Precision Agriculture. Wirel. Pers. Commun. 2019, 108, 1785–1802. [Google Scholar] [CrossRef]
- Ferrandez-Pastor, F.J.; Garcia-Chamizo, J.M.; Nieto-Hidalgo, M.; Mora-Pascual, J.; Mora-Martinez, J. Developing Ubiquitous Sensor Network Platform Using Internet of Things: Application in Precision Agriculture. Sensors 2016, 16, 1141. [Google Scholar] [CrossRef] [Green Version]
- Soulis, K.X.; Elmaloglou, S. Optimum soil water content sensors placement for surface drip irrigation scheduling in layered soils. Comput. Electron. Agric. 2018, 152, 1–8. [Google Scholar] [CrossRef]
- Le, T.D.; Tan, D.H. Design and Deploy a Wireless Sensor Network for Precision Agriculture. In Proceedings of the 2015 2nd National Foundation for Science and Technology Development Conference on Information and Computer Science (NICS), Ho Chi Minh City, Vietnam, 16–18 September 2015; pp. 294–299. [Google Scholar]
- Haq, A. An improved mean deviation exponentially weighted moving average control chart to monitor process dispersion under ranked set sampling. J. Stat. Comput. Simul. 2013, 84, 2011–2024. [Google Scholar] [CrossRef]
- Aslam, M.; Bantan, R.A.R.; Khan, N. Design of S-N(2)—NEWMA Control Chart for Monitoring Process having Indeterminate Production Data. Processes 2019, 7. [Google Scholar] [CrossRef] [Green Version]
- Burnak, B.; Diangelakis, N.A.; Pistikopoulos, E.N. Towards the Grand Unification of Process Design, Scheduling, and Con-trol—Utopia or Reality? Processes 2019, 7, 461. [Google Scholar] [CrossRef] [Green Version]
Figure 1.
The proposed structure of the water-fertilizer control system.

Figure 2.
Deployment scheme of regular hexagonal nodes.
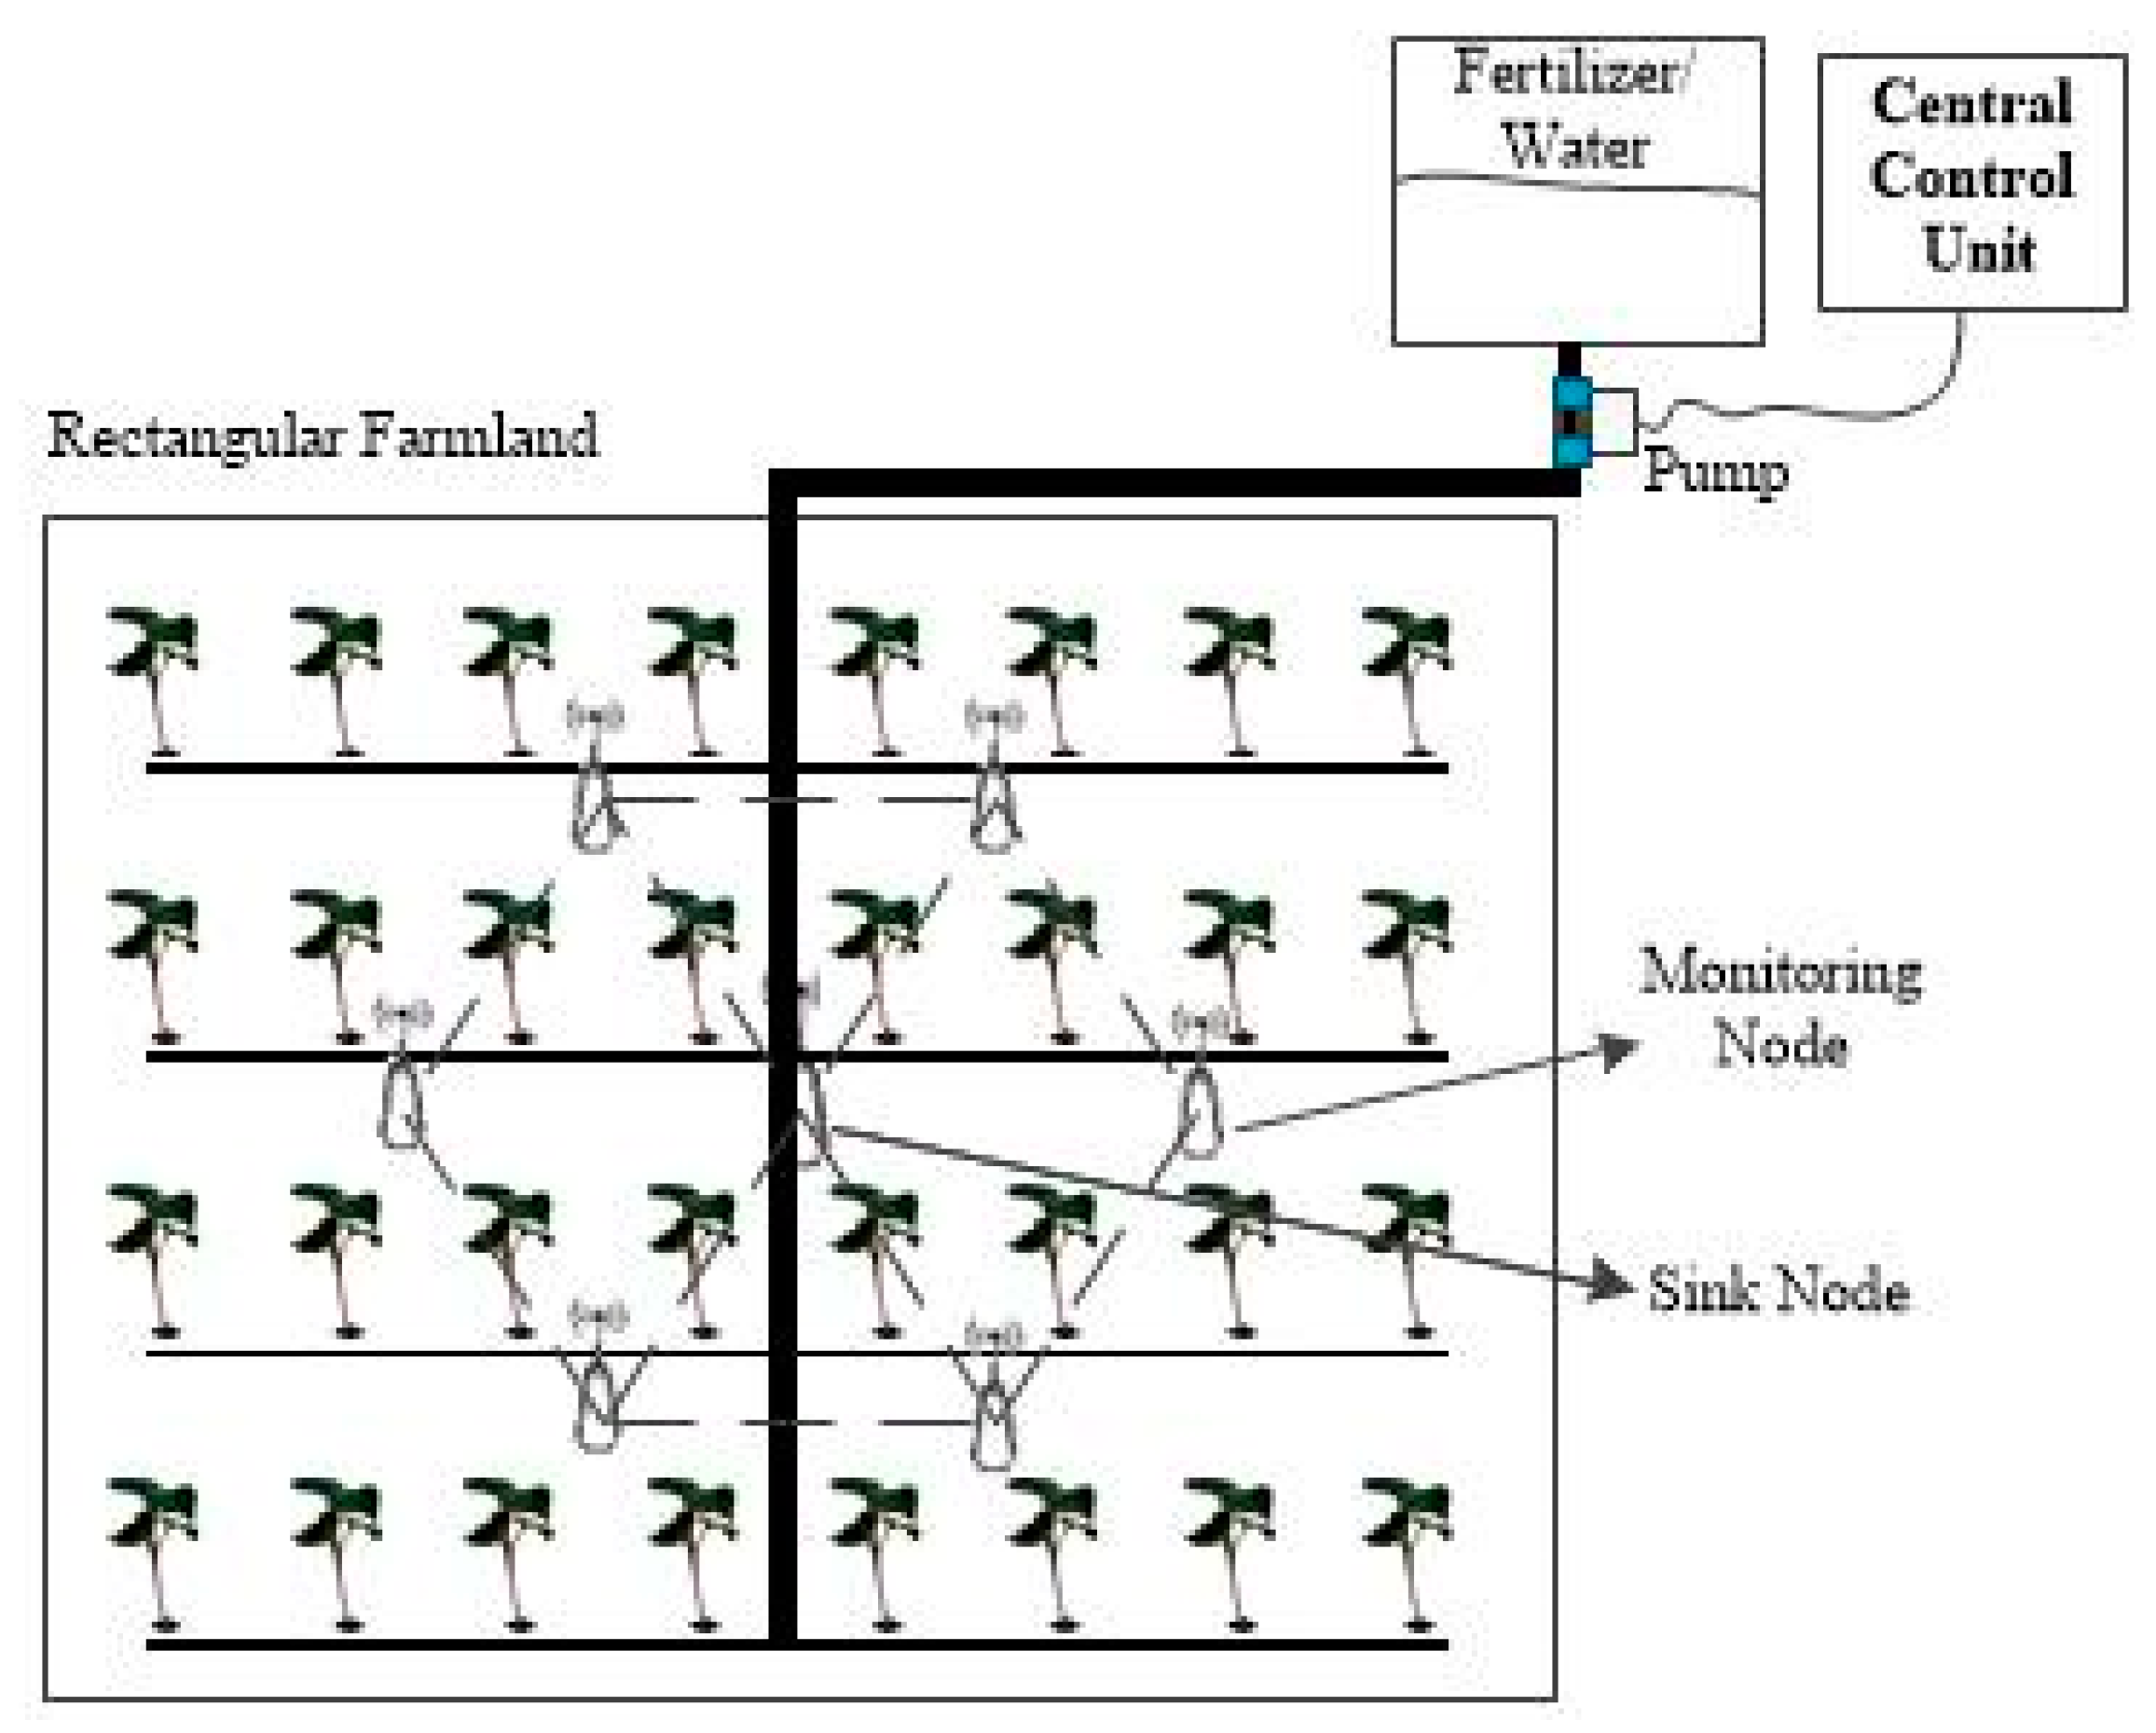
Figure 3.
The workflow of the proposed water-fertilizer control system.
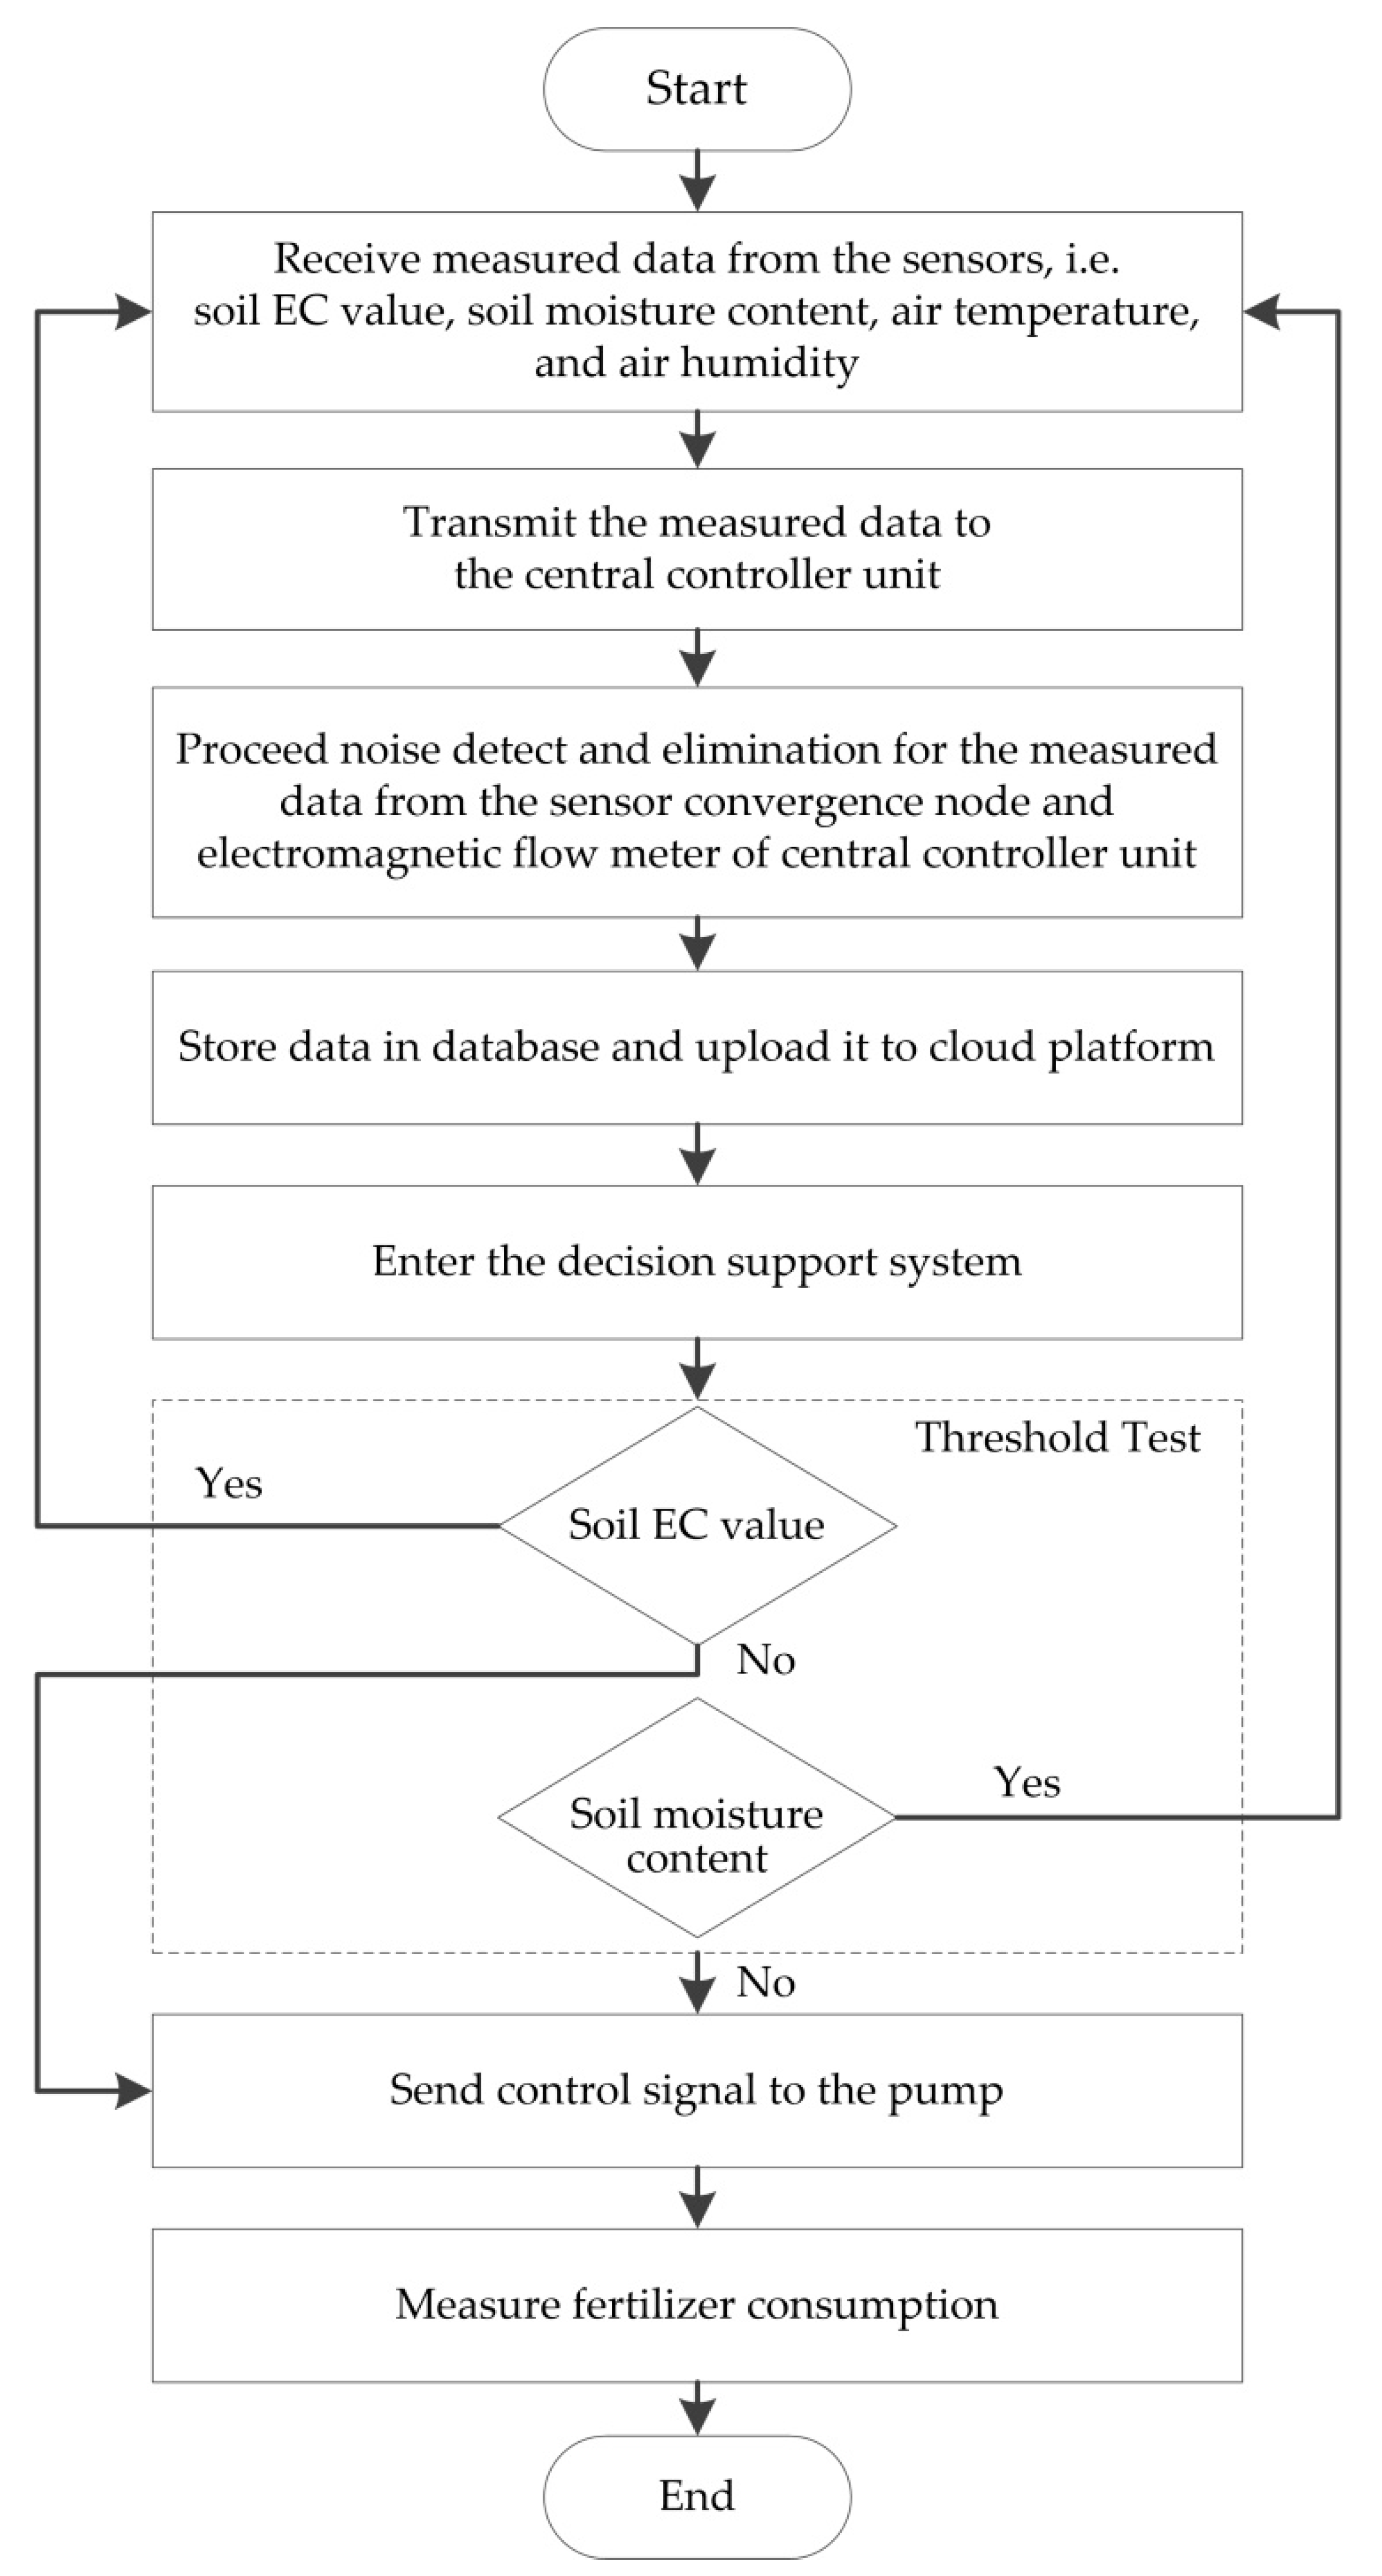
Figure 4.
Deployment of monitoring nodes in experimental plots.
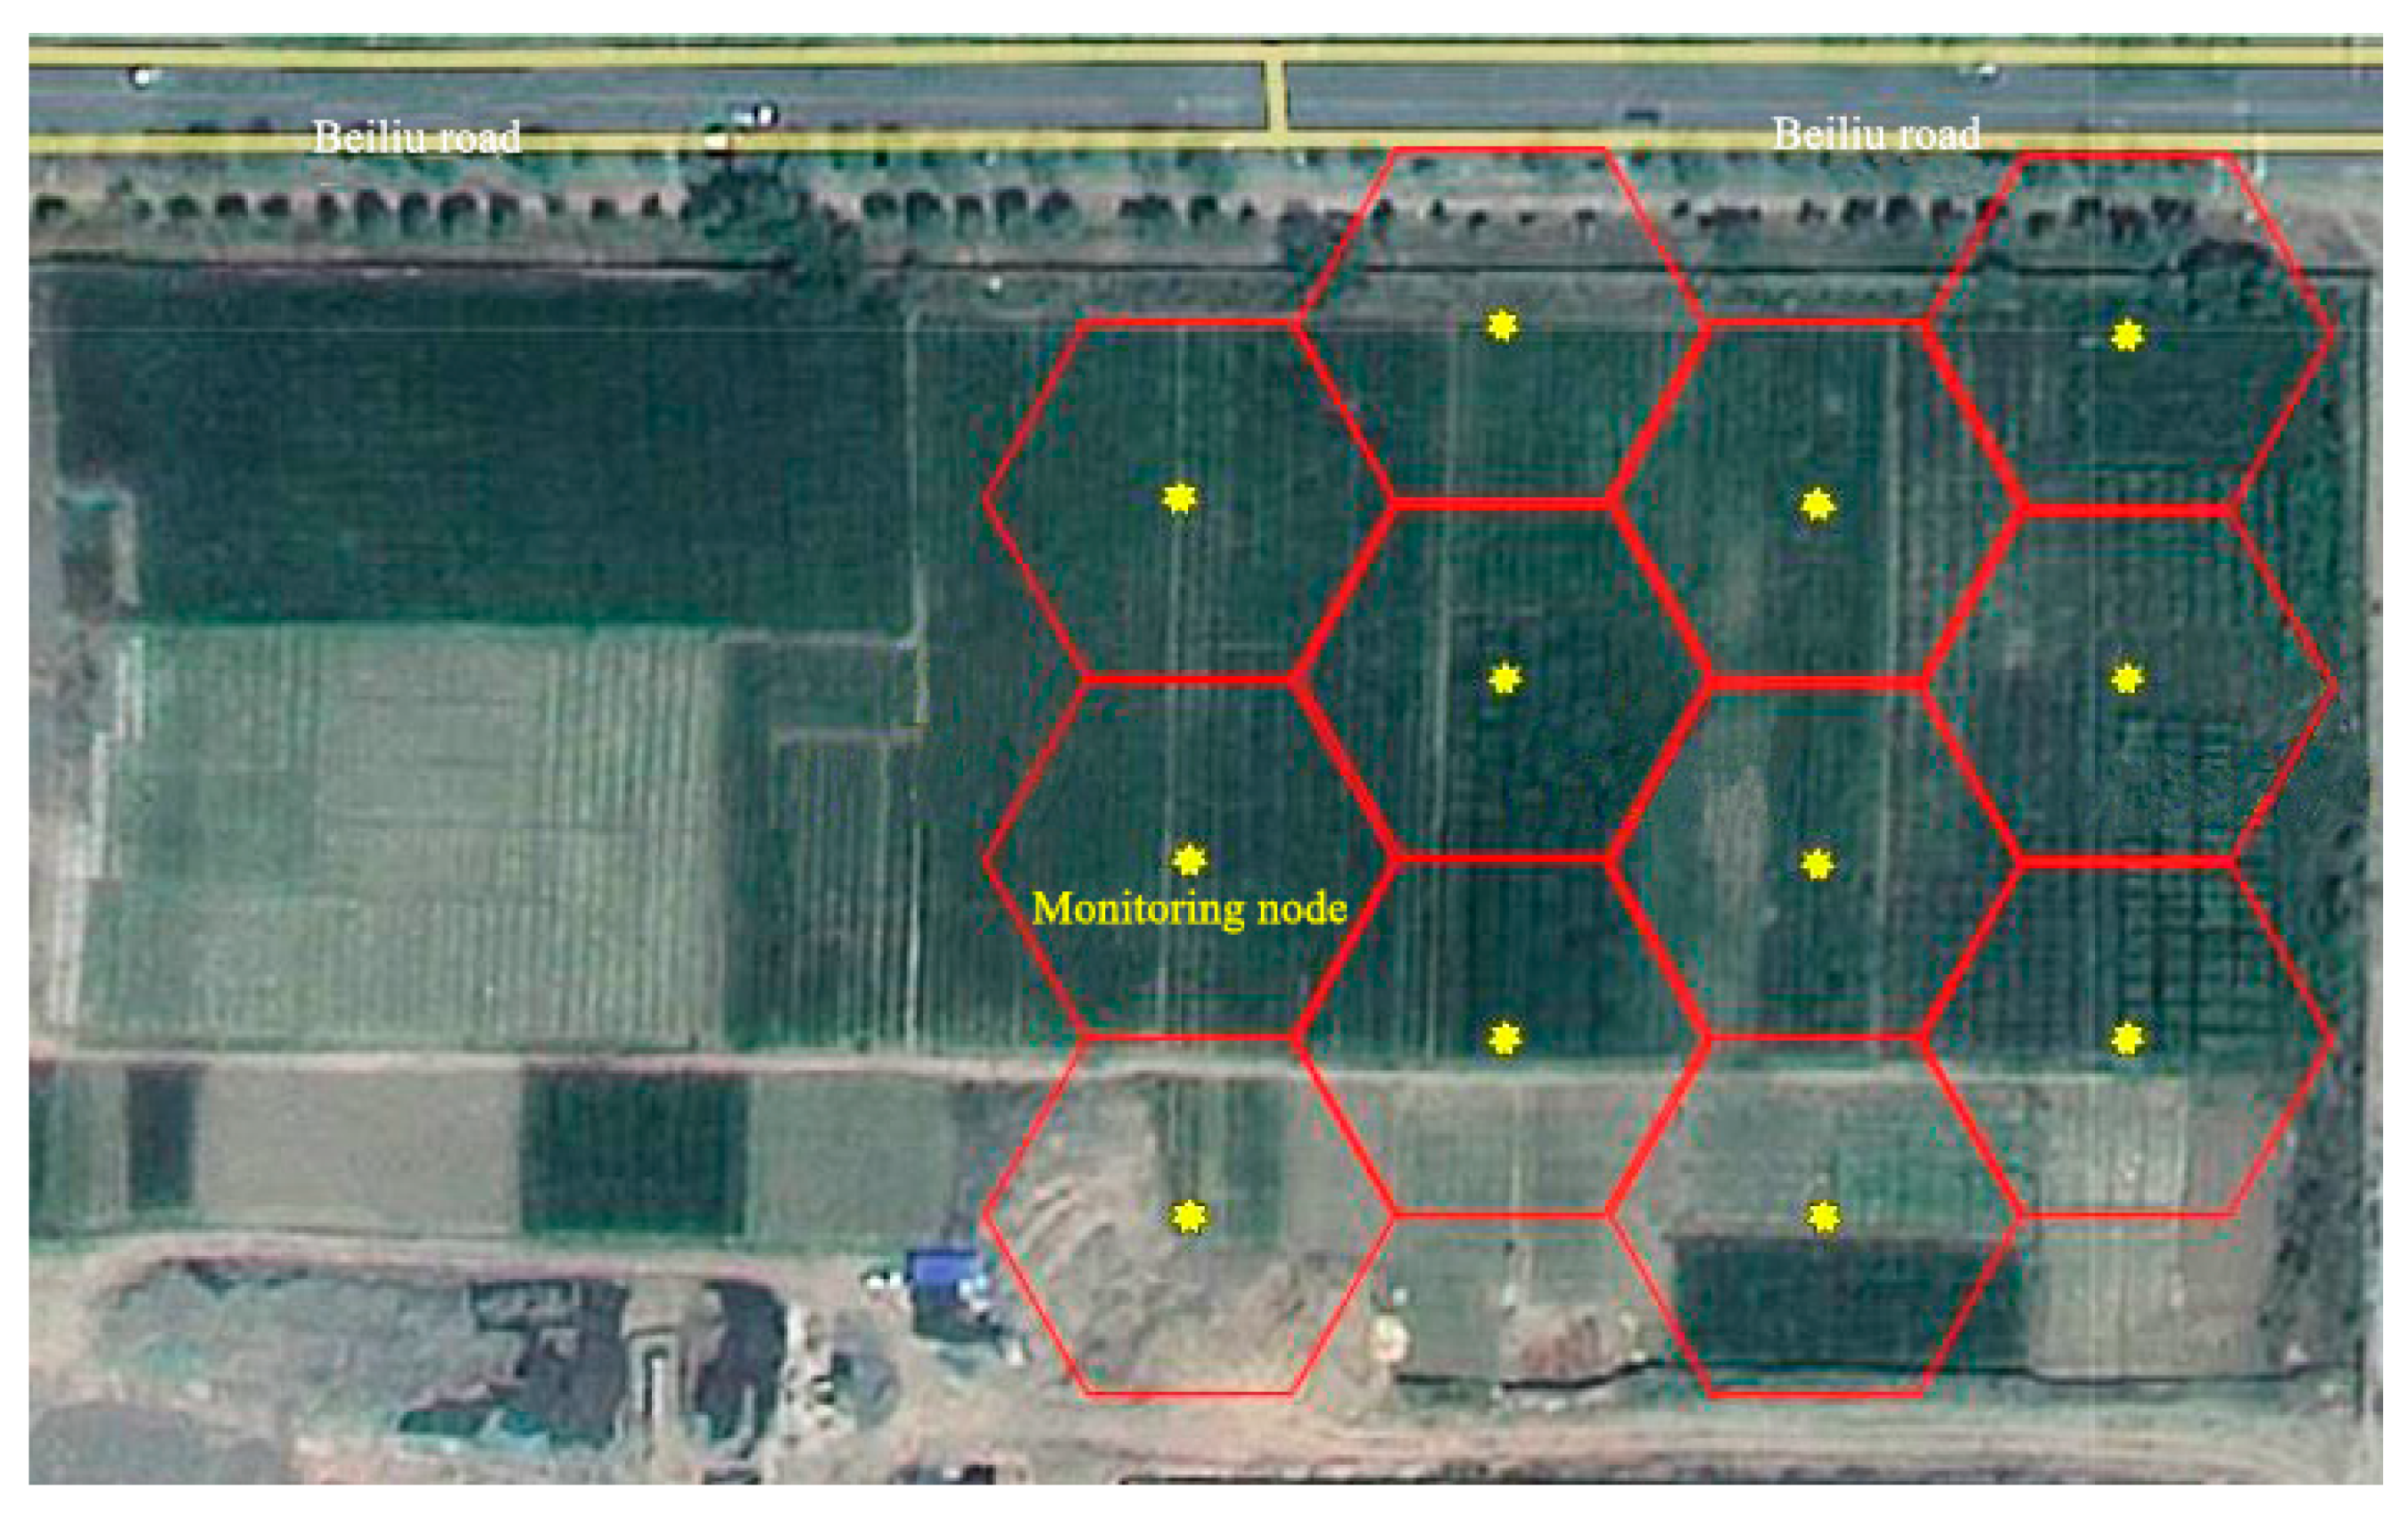
Figure 5.
Picture of field test.

Figure 6.
Comparison of data filtering curves. (a) Soil moisture before filtering and (b) soil moisture after filtering.
Figure 6.
Comparison of data filtering curves. (a) Soil moisture before filtering and (b) soil moisture after filtering.

Figure 7.
Measured and calculated data of soil EC used by the proposed system over 3 days.

Figure 8.
Measured and calculated data of soil moisture content used by the proposed system over 3 days.
Figure 8.
Measured and calculated data of soil moisture content used by the proposed system over 3 days.
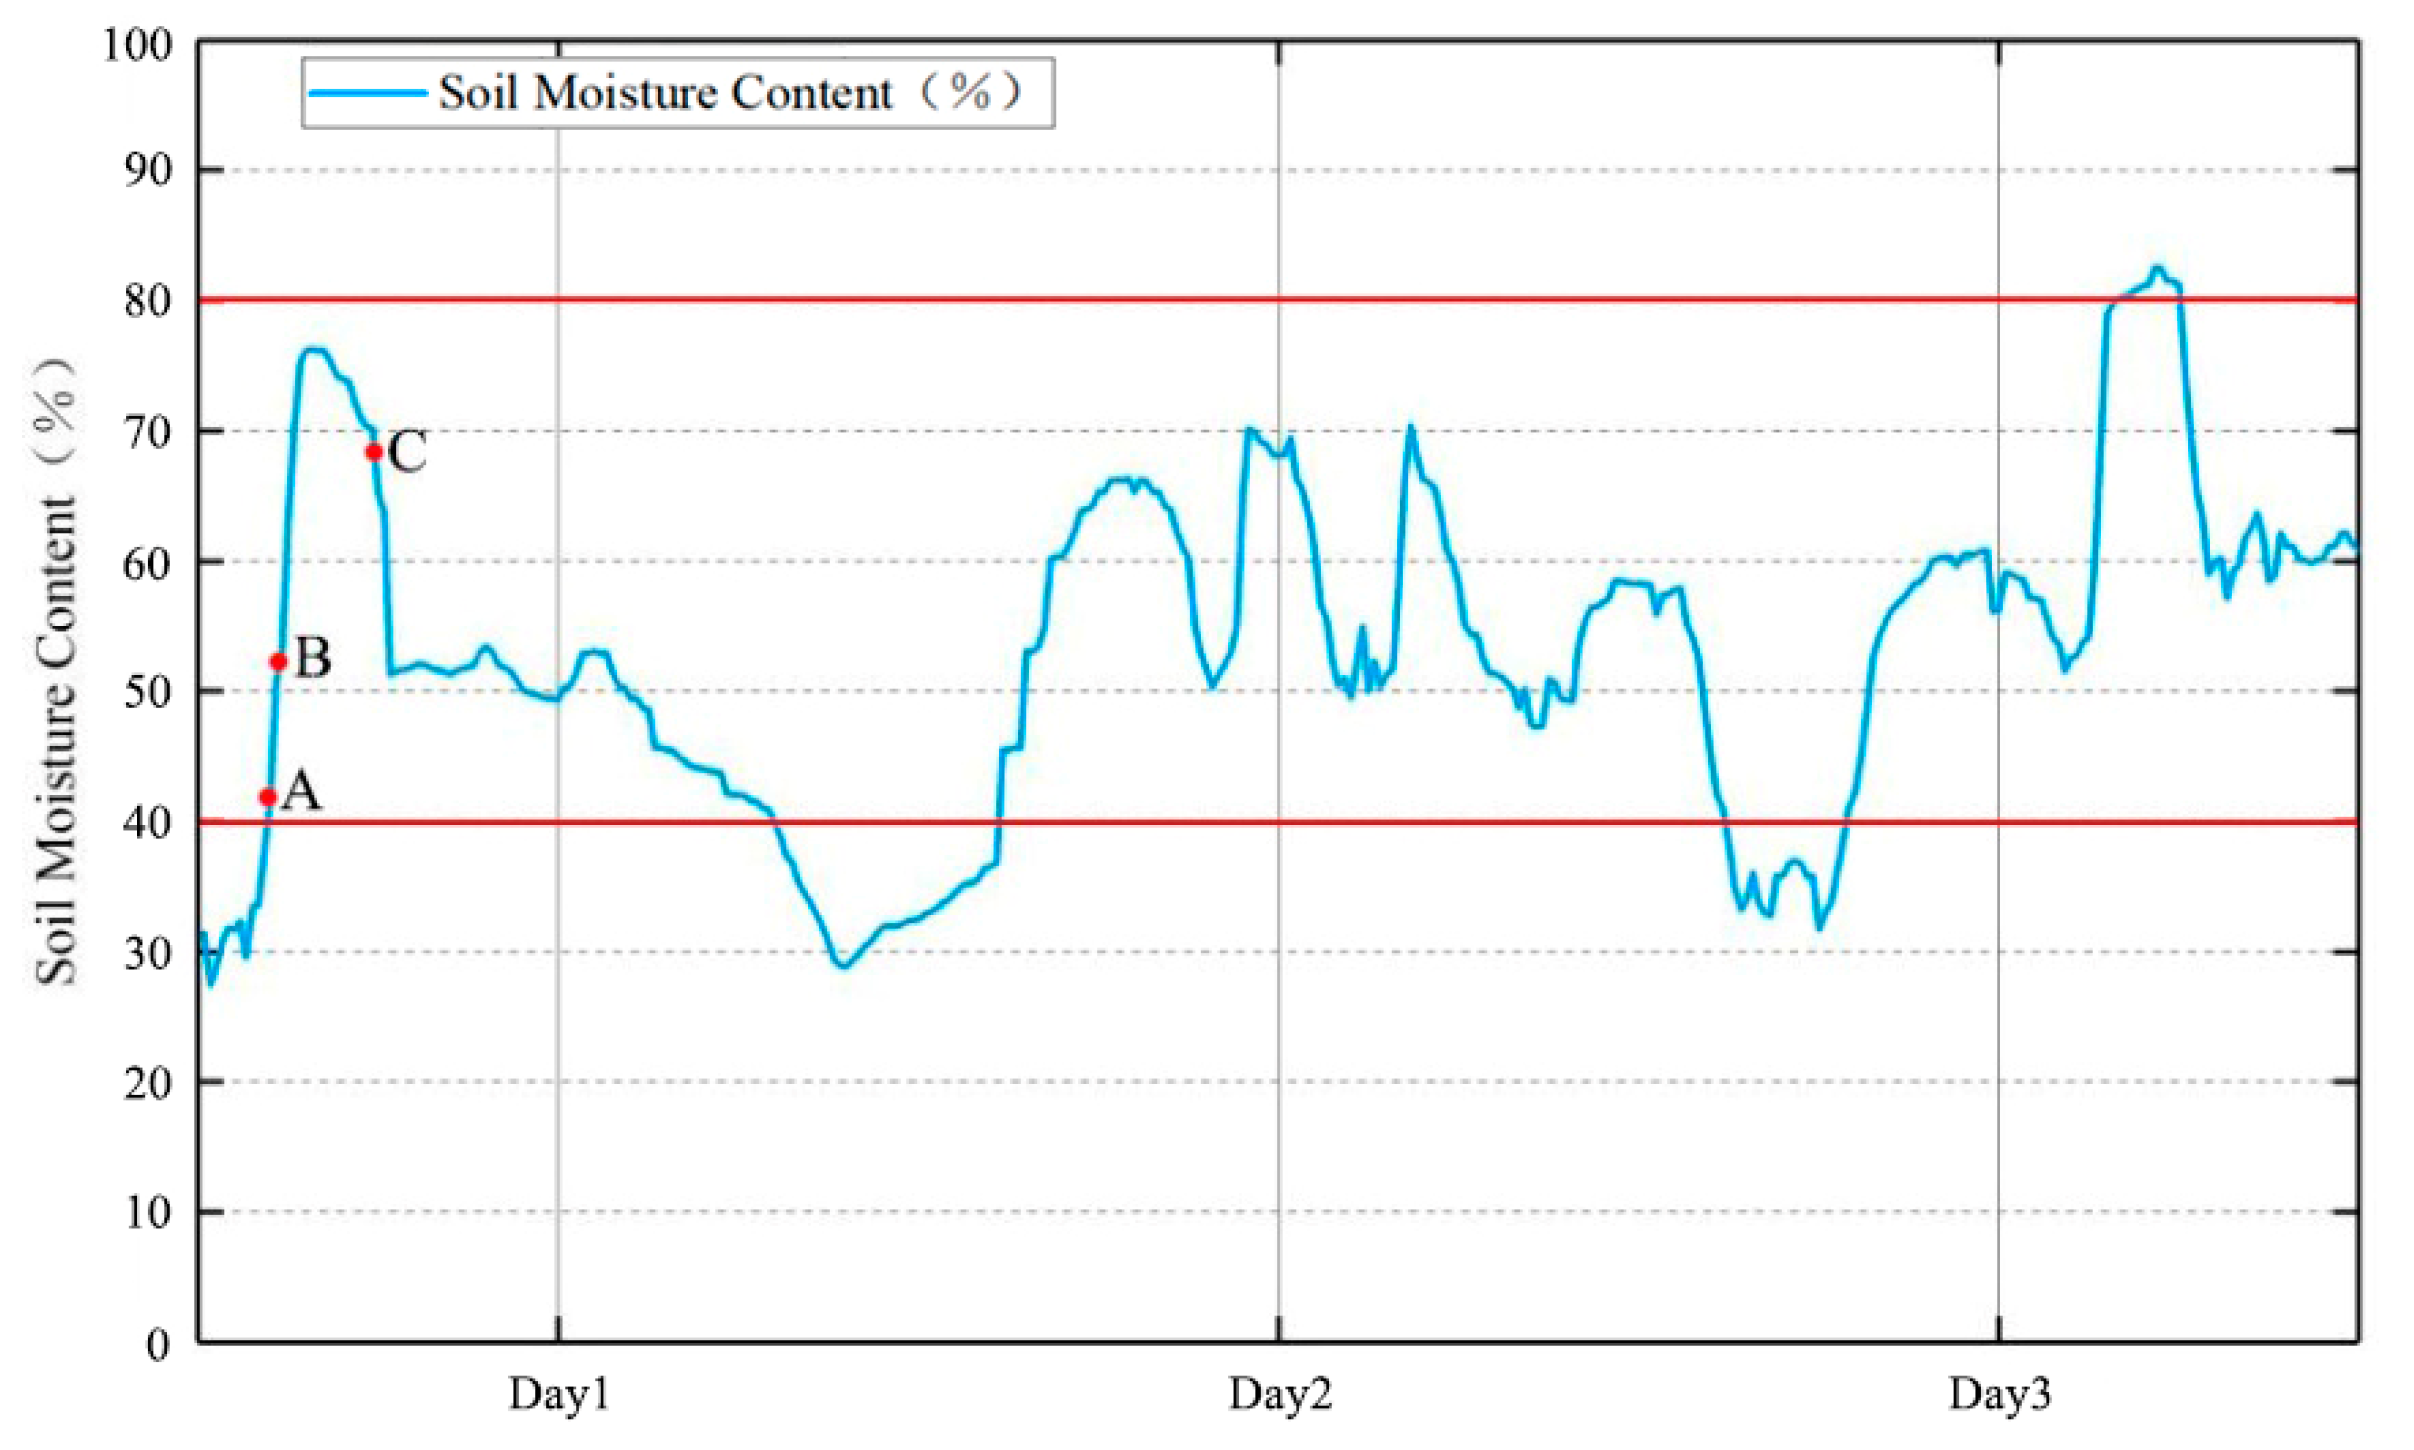
Figure 9.
Comparative results for fertilizer consumption.

Publisher’s Note: MDPI stays neutral with regard to jurisdictional claims in published maps and institutional affiliations. |
© 2021 by the authors. Licensee MDPI, Basel, Switzerland. This article is an open access article distributed under the terms and conditions of the Creative Commons Attribution (CC BY) license (https://creativecommons.org/licenses/by/4.0/).
Share and Cite
MDPI and ACS Style
Du, C.; Zhang, L.; Ma, X.; Lou, X.; Shan, Y.; Li, H.; Zhou, R. A Cotton High-Efficiency Water-Fertilizer Control System Using Wireless Sensor Network for Precision Agriculture. Processes 2021, 9, 1693. https://doi.org/10.3390/pr9101693
AMA Style
Du C, Zhang L, Ma X, Lou X, Shan Y, Li H, Zhou R. A Cotton High-Efficiency Water-Fertilizer Control System Using Wireless Sensor Network for Precision Agriculture. Processes. 2021; 9(10):1693. https://doi.org/10.3390/pr9101693
Chicago/Turabian StyleDu, Chanchan, Lixin Zhang, Xiao Ma, Xiaokang Lou, Yongchao Shan, He Li, and Runmeng Zhou. 2021. "A Cotton High-Efficiency Water-Fertilizer Control System Using Wireless Sensor Network for Precision Agriculture" Processes 9, no. 10: 1693. https://doi.org/10.3390/pr9101693
Note that from the first issue of 2016, this journal uses article numbers instead of page numbers. See further details here.