
Analysis of Global Warming’s Influence on the Dimensioning of Borehole Heat Exchangers at a Climate-Exposed Site


1
Department of Geological Engineering, Faculty of Mining and Geology, VSB-Technical University of Ostrava, 17. listopadu 2172/15, Ostrava, 708 00 Poruba, Czech Republic
2
Faculty of Mining and Geoengineering, Silesian University of Technology, ul. Akademicka 2A, 44-100 Gliwice, Poland
*
Author to whom correspondence should be addressed.
Processes 2021, 9(3), 501; https://doi.org/10.3390/pr9030501
Submission received: 29 January 2021
/
Revised: 5 March 2021
/
Accepted: 7 March 2021
/
Published: 10 March 2021
(This article belongs to the Special Issue Enhancement of Heat Transfer and Fluid Flow)
Abstract
:A borehole heat exchanger (BHE) presents the most reliable source of geothermal energy for any object where the heat pump system is to be installed. The main objective of BHE optimization in a specific rock massive and for calculated heat consumption is to design a BHE with proper capacity and sustainable performance. One of the most important inputs for the preparation of such a model is the average outer air temperature on the site during the year. While the properties of the local rock massive are from the heat project lifetime view (tens of years) stable, the local average outer temperature fluctuates according to global climate changes. This article presents a study of the impact of climate changes on the dimensioning process of a BHE and consequently on its performance using data from a real installation at a highly climate-exposed site in the Czech Republic. During the dimensioning of a BHE, this study could help to better quantify the objective risks that result from climate changes. However, the results of this study show that the currently calculated impact of an increase in outer temperature is not crucial, but it is advisable to take this new fact into account during the design and dimensioning process, especially for large installations. To study the ground in terms of usable energy potential at climate-exposed locations properly, the available data were critically analyzed and the results were then synthesized in an appropriate way for the needs of the data simulations.
1. Introduction—Earth’s Heat Sources
The impact of climate change on borehole heat exchanger (BHE) performance and the temperature of the surrounding ground have already been studied by several researchers. In [1], the influence of the increase in outer annual mean temperature on BHE ground temperature was demonstrated using measured temperatures in the groundwater monitoring well around the GHP system and the prediction of the future temperature distribution of the BHE field through the simulation model. Heat pump systems installed at three sites with different climate regimes were investigated in [2]. The annual mean temperature has been projected until the year 2050; consequently, the performance of heating and cooling pumps has been evaluated. The impact of global warming on the performance of ground source heat pumps in U.S. climate zones was analyzed in [3], and the long-term effect of global warming on heat pump operation and performance was presented for three large world cities in [4].
We rank Earth’s heat as a renewable energy source. In the context of the current trend in the development of low-carbon and ultimately carbon-free energy sources, geothermal heat plays an important role. The thermal energy of the Earth’s crust can be used in several ways, depending on the energy potential of a particular geothermal resource. An example of the classification of geothermal resources by enthalpy is shown in Table 1 [5].
Research on all categories of Earth’s heat sources has undergone intensive development over the past 20 years. For energy-intensive sources, their utilization is limited by their relatively low occurrence and by the technological possibility for their use. In this case, the thermal energy of the Earth’s crust is used primarily to produce electricity. The number of locations where the geological conditions are appropriate and, at the same time, it is technically possible to build a geothermal power plant is relatively small. This fact corresponds to the total installed geothermal power capacity in the world, with 15,406 MW in operation in 2019 [6]. For comparison, as of 31 December 2019, the total installed power of all power plants in the Czech Republic was at 21,965.8 MW [7]. The share of the capacity of power plants using geothermal resources in the total output of all power plants in the world is about 0.2% [8].
Geothermal sources with medium and low energy potential are more likely to be suitable for heat production and direct heat supply. To generate electricity from medium enthalpy geothermal sources, special technology such as the Rankin organic cycle has to be used. However, the output of this type of plant is relatively low and their operation is technically and operationally demanding. Low-potential sources are broadly applicable, combining heat pumps to produce useful heat. Using this equipment, the Earth’s heat can be drawn from primary exchangers, which are represented by BHE systems installed in the ground rocks.
In practice, this is a vertical system consisting of heat production wells drilled to depths most often of around 200 m.
2. Dimensioning of Borehole Heat Exchangers
In order to assess the risks in the dimensioning of drilled borehole exchangers properly, several fundamental factors need to be considered. The first is the size of the installation. The second is knowledge of the geological environment from projects already carried out. Both of these elements can cause incorrect dimensioning, which determines the size and cost of measures required for eliminating such a mistake. Based on these elementary criteria, heat pump projects with drilled exchangers can be broken down into the following groups.
2.1. Small Projects in Known Localities
As a rule, this situation is represented by the heating of family houses on those sites where similar installations already exist close to the site and are functional, or field tests (thermal response tests (TRTs)) have already been carried out in the past and the necessary data have been provided (see below). Typically, it is a new family house in a passive standard as the next object of a satellite town. The designer projects the system based on experience already gained or known by experimentally detected data. The risks of wrong dimensioning are minimal.
2.2. Small Projects in Unknown Locations
The projection solution is based on available geological and hydrogeological data. The risk of under-designing the primary exchanger capacity can be offset relatively cheaply by moderate oversizing. The cost of this type of correction measure is usually lower than the cost of complicated field tests and is, in particular, acceptable in the case of new builds. If the designer considers that the risk from potential over-dimensioning is high, then field tests (TRTs) and subsequent modeling are required (see below).
2.3. Large Projects in Known Locations
If the designer has reliable information about the ground rock environment where the drilled BHE will be installed, dimensioning can be carried out using the existing data. However, dimensioning must be done using an appropriate computer program to model the borehole field (set of boreholes) and the thermal load on a long-term scale, for a minimum of 25 years. For example, suitable software for a given simulation is a computer program called Earth Energy Designer (EED) 4. The basic data necessary for modeling are the aggregate coefficient of the thermal conductivity of the rocks for a given borehole, the thermal resistance of this borehole, the specific thermal capacity of the given rocks, the average annual temperature at the site, and the annual thermal consumption of the object expressed month by month. Furthermore, dimensioning requires a number of other technical data that can be identified from the documentation of the heat pump itself. Dimensioning must preferably be handled in several variants in such a way that any deviations and risks arising from them are clearly identified. Corrective measures in an improperly designed BHE are mostly expensive and technically difficult to implement. The Faculty of Electrical Engineering and Computer Science of the VSB - Technical University of Ostrava can serve as an example of such an installation. Data from the neighboring Aula building (Audience Hall) on the same university campus, which is heated by a heat pump system with a total capacity of 700 kW, were used to design this reasonably big primary exchanger.
2.4. Large Projects in Unknown Locations
The dimensioning process is no different from the previous group, but the problem of obtaining the necessary data has to be fixed. In essence, it presents a complex exploration phase of the project. As part of this stage, it is necessary to collect available data on geology, hydrogeology, climate, and location. The next step is to conduct a field experiment—the thermal response test (TRT). For the field test, a borehole needs to be drilled with the same completion as the future boreholes of the BHE. This provides the necessary data on the geological profile, the hydrogeological situation, the coefficient of thermal conductivity, and the thermal resistance of the borehole. Laboratory measurements of rock samples can determine their specific heat capacity. This group of projects is clearly the most challenging to prepare for, both in terms of the funding needed and in terms of time. Such a process took place in the case of the exploration of low-potential heat sources for the previously mentioned Aula (Audience Hall) construction [9,10,11].
In the context of the paragraphs above, it is necessary to define what a small or large project is. Opinions on the boundary between these two categories may vary. The most common view on what is small or large is based on a comparison of the cost of the TRT itself and the cost of additional meters for the BHE to offset the risk of low footage. Under market conditions in the Czech Republic, the value of the TRT is approximately equal to the price of 100 m for the BHE, which can cover 8–10% of the total footage of the BHE for 50 kW installations. Thus, the Czech value of the threshold has been defined as 50 kW of required heat output.
A properly sized borehole exchanger must meet the following criteria [12]:
- supply the required amount of thermal energy;
- have high operational reliability;
- have high operational stability;
- be cost-effective.
The dimensioning of the primary exchanger involves the determination of the following parameters [10]:
- number of wells;
- depth of individual wells;
- positioning and deployment of wells;
- drilling design;
- well completion materials;
- grouting mixture material.
3. Borehole Heat Exchanger (BHE) Simulation Using Analytical Methods
The most widely used analytical tool is the Earth Energy Designer (EED) software. When simulating with this type of analytical tool, it is necessary to be aware of the limitations:
- thermal characteristics cannot be specified for separate layers of the rock massive at the installation site and aggregate representative values must be chosen for the affected part of the rock massive within the entire BHE volume;
- physical basement implies that there is only a possible simulation of thermal energy conduction and not convection. (It is not possible to simulate cases precisely when the thermal characteristics are affected by flowing groundwater, for example.)
The underlying EED software tool algorithm is based on an analytical solution using g-functions and is defined using numerical modeling and expressing the relationship between drill depths and their deployment. The program works with input data related to external temperature, the heat consumption of the heated object, the rock massive, drilling equipment, and the heat transfer fluid and its flow in the primary circuit. The total depth of the boreholes, the positioning and depth of each borehole, or the temperature of the exchanger’s heat transfer fluid, as appropriate, represent the outputs of this evaluation, which are available in the form of tables and graphs. It is possible to export the outputs to spreadsheets and work with them as needed.
The basic data to be collected before beginning the simulation preparation in the EED program are as follows:
- profile through the rock massive to the desired depth (geological profile);
- average annual surface temperature;
- number of possible wells of the drilled heat exchanger in terms of land area;
- drilling configuration (i.e., drilling location plan of the area around the object);
- spacing between wells;
- diameter of wells;
- mode of equipment (e.g., 1-U configuration or 2-U configuration);
- tube diameter;
- U-tube wall thickness;
- thermal conductivity of the U-tube material (tube type suffices; values are known for the most used U-tube types);
- axis distance between the cold and warm lines in the U-tube;
- ground mixture and its thermal conductivity;
- type of heat transfer fluid, its hydraulic properties, and its freezing point (for a number of types, the values are known);
- heat load required for heating (including the monthly requirement, unless this is a normal case based on a standard curve);
- heat load required to prepare hot water (including the monthly requirement, unless this is a normal case based on a standard curve);
- amount of heat required to accumulate in the BHE at the time of excess heat;
- potential peak heat collections for both cases;
- share of the bivalent resource and its use.
The result of the simulation is a text file documenting the input and output data of the entire simulation and a graphical representation of the fundamental values. Both from the numerical data presented in the text and from their graphic expression, it can be deduced whether the system of the proposed BHE will meet the energy needs in terms of thermal energy supply for the proposed building in the long run.
4. Objective Risks When Dimensioning
For projects where the exploration phase is not fully implemented, the designer works with existing data. The accuracy and plausibility of these data present risks. In general, the smaller the project, the smaller the risk of mis-dimensioning. For large and complex projects where no reliable data are available and, therefore, a complete exploration phase including the TRT has to be carried out, the risks are objective and subjective. The subjective risks result from the poor performance of the test or from inaccurate calculation of the thermal requirements (thermal loss) of the object, i.e., mainly human errors. The article does not discuss these risks. The objective risks are listed below:
4.1. Coefficient of Thermal Conductivity
The transfer of heat in dry rocks is carried out by conduction. If there are aquifers with groundwater flowing in the rock environment where the primary exchanger will be installed, there is heat transfer between the rock environment and the carrier fluid in the borehole by convection as well. If this situation is stable and the level of saturation of the aquifer (water flow rate and direction) does not change over the long term, the data measured with the TRT are reliable. If there is flowing water underground during the TRT, the measured parameters are significantly affected by this situation. Logically, this influence will be transferred to the design of the primary exchanger. If, for example, the situation underground changes due to a prolonged drought, the primary BHE will not work as engineers expected, i.e., with a sufficient level of efficiency. However, the effect may also be contradictory and result in the oversizing of the primary borehole exchanger, thus increasing unnecessary investment costs.
4.2. Long-Term Average Surface Temperature
When modeling, the designer works with data from the past. By default, the average surface temperature is determined as the average of the temperatures over the past 10 years at the nearest official measuring point—a weather station. The objective risk stems from the fact that current climate change may affect the average surface temperature in that certain location in the future, both positively and negatively.
5. Case Study of the Climate-Exposed Lysá Hora Site (Beskydy Mountains, Czech Republic)
The site for the study of objective risks in dimensioning the primary borehole exchanger was chosen deliberately because of its uniqueness. Lysá hora is the highest mountain in the Beskydy Mountains (Figure 1), and, with an altitude of 1324 m, it has a unique climate and annual weather pattern. Several tourist, telecommunication, and meteorological structures have been built at the top of Lysá hora (Figure 1). One of them is named “Bezručova chata”, where heating has been designed with a groundwater heat pump. In addition, an important location in terms of the research of objective risk factors is the Meteorological Station, where the thermal response test (TRT) was performed. The two structures are separated by an aerial line of approximately 80 m.
5.1. Nature Conditions
Lysá hora is situated in the eastern part of the Czech Republic in the Moravian-Silesian region; the nearest large town is Frýdek Místek. In terms of geomorphological classification, the Lysá hora is part of the Alpine-Himalayan system, the Carpathian region of the Western Carpathian subprovince, and the Moravian-Silesian Beskydy Mountains [13].
From a hydrogeological point of view, the area belongs to region number 3212 [14], with the name “flysh”, in the Ostravice basin of the Odra river in the Carpathian Paleogene and Cretaceous. Several mountain streams flow from the side of Lysá hora, such as Winter Creek, Dry Creek, Sepetný potok, Mazák, and Satina Creek.
Climate wise, the area is characterized by Quitt (Figure 2) to CH6: “Thus, spring is long and cold, summer is short, slightly cold and wet, autumn is long and slightly cold, winter is very long, slightly cold and wet” [15]. The average temperatures are given in Figure 3.
Geologically, the site is part of the western province of the Western Carpathians and the central part of the Moravian-Silesian Beskydy Mountains. It is mainly made up of Silesian units, which are characterized by regular alternation of clay, dust, and sandstone with occasional occurrences of calcareous rocks. The contiguous area here is made up of up to 3 km of a powerful succession of pews of greenish glauconian sandstone (Godul sandstone) separated by interlaces of clay shale varying in strength [13]. During the orogeny, a system of cracks was created and formed a permeable geohydrodynamic system affecting the underground conditions today.
5.2. Case I: Meteorological Station—A Small Project in a Geothermally Unknown Location
A thermal response test (TRT) was conducted on this site in September 2011. The input parameters of the test were:
- length of the BHE [m]: 125;
- diameter of borehole [mm]: 150;
- heating load [W]: 7420 ± 9.9% (fluctuation of electric boiler);
- undisturbed temperature [°C]: 7.18;
- volumetric heat capacity pCp [MJ/K/m3]: 2.3;
- test duration [h]: 71.17.

The result of the temperature response test on the site was as follows:
- coefficient of the thermal conductivity of rocks: 3.91 W/(m·K);
- borehole thermal resistance: 0.060 (K·m)/W.
5.3. Case II: Bezručova Chata—A Small Project in a Geothermally Known Location
This is a new chalet that was built on the site of the original “Bezručova chata”, which was put in operation in 1933 and burned down in 1978. The new facility was officially commissioned in 2015. The current building provides basic services for tourists—catering and accommodation. It is architecturally designed as a traditional wooden structure with a high stone base. The built-up area is 384 m2, the floor area is 715.9 m2, and the total enclosed area is 1960.9 m3. The horizontal plan has dimensions of 14.0 × 26.5 m, and the height of the building is 11 m. The accommodation capacity is 20 people and the capacity of the restaurant is 27 people in the internal dining room and 32 people seated on the terrace [13]. The heating of the building is provided by a ground-type heat pump combined with photovoltaic panels and a powerful internal fireplace connected to the heating system.
The installed NIBE F1345 heat pump forms the core of the central heating and has a power output of 30 kW. It is equipped with two compressors, each with a power of 15 kW [17]. Both produce heat for heating purposes, and one provides hot sanitary utility water. The primary borehole heat exchanger is created by five boreholes each 100 m long, giving a total primary length of 500 m. In 2019, the temperature of the return branch pipe of the heat-bearing fluid (Base max. parameter) was zero degrees Celsius.
The system has an equitherm control and is equipped with a 750 L storage tank that serves only for heating and a boiler of the same volume that is heated directly by the heat pump. The heat distribution system is composed of three circuits—radiators, floor heating, and air conditioning. The heating is supplemented by a 5 kW photovoltaic and a 25 kW fireplace. The backup is a 28 kW electric boiler, which, as of July 2019, had been in operation for only 1865 h, particularly when the new building needed to be dried out. Currently, this heat source is not being used [13].
The heating system is set to turn off when the outside temperature exceeds 18 °C in the previous 24 consecutive hours. The example of the 2018 data examined [13] shows that such a case was virtually absent and thus the heater was running continuously but with varying efficiency.
At work [13], the heat requirement of the chalet’s premises in the average year for each month was determined by calculation and expert estimation, both for heating hot utility water and for heating. On average, the building uses a total of 210.55 MWh of thermal energy per year, of which 98.11 MWh is for heating sanitary water and 112.44 MWh is for its own heating. These values have been used for subsequent modeling.
6. Effects of Objective Factors—Input Parameters of Model Research
To analyze the impacts of different outer average annual air temperature, four scenarios were investigated. In Scenario 1, the model was calculated using the data that would have been available at the time of dimensioning this particular BHE, i.e., in 2011. After that, another three scenarios were considered; all of them had the objective of modeling the possible development of working fluid temperatures within a 25-year period. These models were proposed to analyze the following key points:
- simulation of original model with “old” average outer temperature (Scenario 1);
- impact of the “new” average outer temperature on the working fluid temperature (Scenario 2);
- Scenario 2 adjusted by an additional number of meters of the BHE to be in compliance with the VD4640 standard (Scenario 3);
- scenario adjusted by the theoretical coefficient of thermal conductivity to meet the VD4640 standard (Scenario 4).
The preliminary conclusion of this four-step simulation is that even the real average outer temperature (from 2019) is relatively higher compared to the one used for the initial calculation (from 2011). This positive fact did not have a significant influence on the performance of the system, characterized by the temperature of the heat-carrier fluid in 25 years of operation (Scenario 2). To rectify the performance model, we needed to add 47 m to each borehole (Scenario 3) or increase the coefficient of thermal conductivity significantly (Scenario 4).
In all scenarios, only the base load of annual heat distribution (month by month) was simulated. As a result of this approach, the values of Peak min. were equal to the values of Base min., and the curve Peak max. was the same as the curve Base max. Table 2 summarizes the key input parameters of each scenario.
7. Results and Discussion of Individual Scenarios
7.1. Scenario 1
This scenario presents the dimensioning of the primary exchanger using measured TRT values from a neighboring location and with an average outdoor temperature derived from measurements in the period when the TRT was carried out. The average temperature for the calculation was obtained from an online weather source [18] over a period of 10 years from January 2001 to January 2011 (Figure 6), assuming that dimensioning with EED 4 must have taken place in 2012.
The resulting number of wells was five, each 100 m long. The model result can be seen in Figure 7, which shows that the temperatures of both the warm and cold lines of the primary circuit are well below zero in the 25th year of the simulation.
7.2. Scenario 2
In the second simulation, the actual average outdoor temperature, which is higher compared to Scenario 1, was added to the calculation. This was obtained in the same way as in the previous case but for the period of November 2015 to December 2019 (see Figure 8). Maintaining the other values and the new value of the average outdoor temperature, Scenario 2 (Figure 9) demonstrates a shift in the temperatures of the working fluid in both pipelines of the primary circuit over a 25-year time span compared to Scenario 1. This scenario can be verified by the real temperature of the heat-carrier fluid in the fifth year of operation. The model calculated the Base max. temperature close to zero, which is in line with operational data.
7.3. Scenario 3
This scenario was consistent with Scenario 2 but limited the lowest temperature of Base min. to −3.5 °C by BHE extension. The results are shown in Figure 10. The total footage calculated was 735.5 m, or 147.1 m depth for each well.
7.4. Scenario 4
This scenario was identical to Scenario 2 but had a variable thermal conductivity coefficient so that the current primary exchanger of 5 × 100 m ensured system functionality in the 25th year of operation with an average minimum monthly temperature (Base min.) of −3.5 °C. The temperature pattern is shown in Figure 11. The resulting heat conductivity coefficient value in this scenario was 7 W/(m·K).
8. Conclusions
When analyzing the case study, the following general conclusions can be drawn.
Changes in the average outer temperature resulting from global warming have a recognizable impact on the dimensioning and design of a BHE. However, this impact is not critical and should be considered during the modeling process only when the project is reasonably large.
For small- and medium-sized projects (30–50 kW), it is wise to pay attention to the average external temperature, especially in limited cases where every meter of primary borehole exchanger will matter. In these cases, the average external temperature may have an important effect.
The theoretical models under Scenarios 3 and 4 show the adjustment of two different parameters having an influence on the BHE performance. In compliance with the best practices in dimensioning, another 235.5 m should be drilled or the value of the coefficient of thermal conductivity should be redefined.
Today, it would be advisable to follow good design practices and consider these objective risks during the design of the primary heat pump exchanger. If the effects are significant, a responsible designer must implement measures that will mitigate the objective risks.
Author Contributions
Conceptualization, A.K. and D.P.; methodology, A.K.; software, M.K.; validation, P.B., A.K. and M.K.; formal analysis, M.K.; investigation, A.K.; resources, M.K.; data curation, D.P.; writing—original draft preparation, M.K.; writing—review and editing, M.K.; visualization, M.K.; supervision, A.K.; project administration, M.K.; funding acquisition, A.K. All authors have read and agreed to the published version of the manuscript.
Funding
This research received no external funding.
Institutional Review Board Statement
Not applicable.
Informed Consent Statement
Not applicable.
Data Availability Statement
Data sharing not applicable.
Conflicts of Interest
The authors declare no conflict of interest.
References
- Kim, S.-K.; Lee, Y. Evaluation of Ground Temperature Changes by the Operation of the Geothermal Heat Pump System and Climate Change in Korea. Water 2020, 12, 2931. [Google Scholar] [CrossRef]
- Kharseh, M.; Altorkmany, L.; Al-Khawaja, M.; Hassani, F. Analysis of the effect of global climate change on ground source heat pump systems in different climate categories. Renew. Energy 2015, 78, 219–225. [Google Scholar] [CrossRef]
- Shen, P.; Lukes, J.R. Impact of global warming on performance of ground source heat pumps in US climate zones. Energy Convers. Manag. 2015, 101, 632–643. [Google Scholar] [CrossRef]
- Kharseh, M.; Altorkmany, L.; Nordell, B. Global warming’s impact on the performance of GSHP. Renew. Energy 2011, 36, 1485–1491. [Google Scholar] [CrossRef]
- O´Sullivan, J. Introduction of Geothermal Science and Engineering. Engineering Science; University of Auckland: Auckland, New Zealand, 2014; Available online: https://www.irena.org/-/media/Files/IRENA/Agency/Events/2014/Jun/2/1_Sullivan.pdf?la=en&hash=7B8C0F4B0F52944710B21166BFC30352DD7AC288 (accessed on 6 December 2020).
- Richter, A. Top 10 Geothermal Countries 2019. 2020. Available online: https://www.thinkgeoenergy.com/the-top-10-geothermal-countries-2019-based-on-installed-generation-capacity-mwe/ (accessed on 5 January 2021).
- CSO 2020. Production and Consumption of Electricity in the Czech Republic; Czech Statistical Office, branch Brno; Available online: https://www.czso.cz/csu/xb/vyroba-a-spotreba-elektricke-energie-v-jihomoravskem-kraji-v-roce-2019 (accessed on 12 January 2021).
- Energy Statistics Pocketbook; Statistic Papers Series E No. 3; Department of Economic and Social Afairs, United Nations: New York, NY, USA, 2020; Available online: https://unstats.un.org/unsd/energystats/pubs/documents/2018pb-web.pdf (accessed on 12 January 2021).
- Bujok, P.; Rapantová, N.; Pospíšil, P.; Koziorek, J.; Ochodek, T.; Hrubešová, E.; Vrtek, M.; štrof, P.; Rozehnal, Z.; Gryzc, D.; et al. Use of the Thermal Energy of the Earth’s Crust to Establish Renewable Energy Sources Including Verification of the Possibility of Heat Accumulation; Final Report for TAČR TA01020932; VSB–Technical University of Ostrava: Ostrava, Czech Republic, 2015. [Google Scholar]
- Kunz, A. Comprehensive Assessment of the Rock Environment as a Source of Low-Potential Thermal Energy. Ph.D. Thesis, Ostrava, Czech Republic, 2009. Available online: http://hdl.handle.net/10084/83410 (accessed on 18 November 2020).
- Vojčinák, P. Methodology for Automated Measurement and Evaluation of Temperatures in Wells. Ph.D. Thesis, Ostrava, Czech Republic, 2015. Available online: https://dspace.vsb.cz/handle/10084/110408 (accessed on 11 December 2020).
- McCorry, M.; Jones, G.L. Geotrainet. Training Manual for Designers of Shallow Geothermal Systems; GeoTrained: Brussels, Belgium, 2011; ISBN 978-2-9601071-0-4. [Google Scholar]
- Piotrowski, D. Complex Analysis of the Ground as the Source of Low Enthalpy Energy for Heat Pumps in the North-Eastern Part of Czech Republic. Master’s Thesis, Silesian University of Technology, Gliwice, Poland, May 2019. [Google Scholar]
- CGS 2020. Map Application, Czech Geological Survey. Available online: https://mapy.geology.cz/hydro_rajony/ (accessed on 4 May 2020).
- Quitt, E. Climates Area of Czechoslovakia. Academia, Praha. 1971. Available online: http://moravske-karpaty.cz/prirodni-pomery/klima/klimaticke-oblasti-dle-e-quitta-1971/ (accessed on 6 December 2020).
- Blomberg, T.; Claesson, J.; Eskilson, P.; Hellström, G.; Sanner, B. EED v3.2 Manual, Tutorial Examples. Blocon. February 2015. Available online: https://buildingphysics.com/manuals/EED3.pdf (accessed on 25 April 2019).
- Nibe 2013. Installation Guide LEK NIBE F1345 heat Pump Type Earth-Water, Water-Water. IHB CZ 1649-5 331048. Available online: https://www.nibe.cz/ke-stazeni/category/29-nibe-f1345-novinka?layout=eximium:nibecategories (accessed on 13 November 2020).
- Weatheronline. Climate Robot Lysa Hora. 2020. Available online: https://www.weatheronline.co.uk/weather/maps/city?LANG=en&WMO=11787&PAG=0&CONT=euro&UP=0&R=150&LEVEL=162®ION=0001&LAND=CZ&MOD=tab&ART=TMX&NOREGION=1 (accessed on 4 December 2020).
Figure 1.
Position of Lysá hora and an aerial view at the top of the mountain [13].
Figure 1.
Position of Lysá hora and an aerial view at the top of the mountain [13].
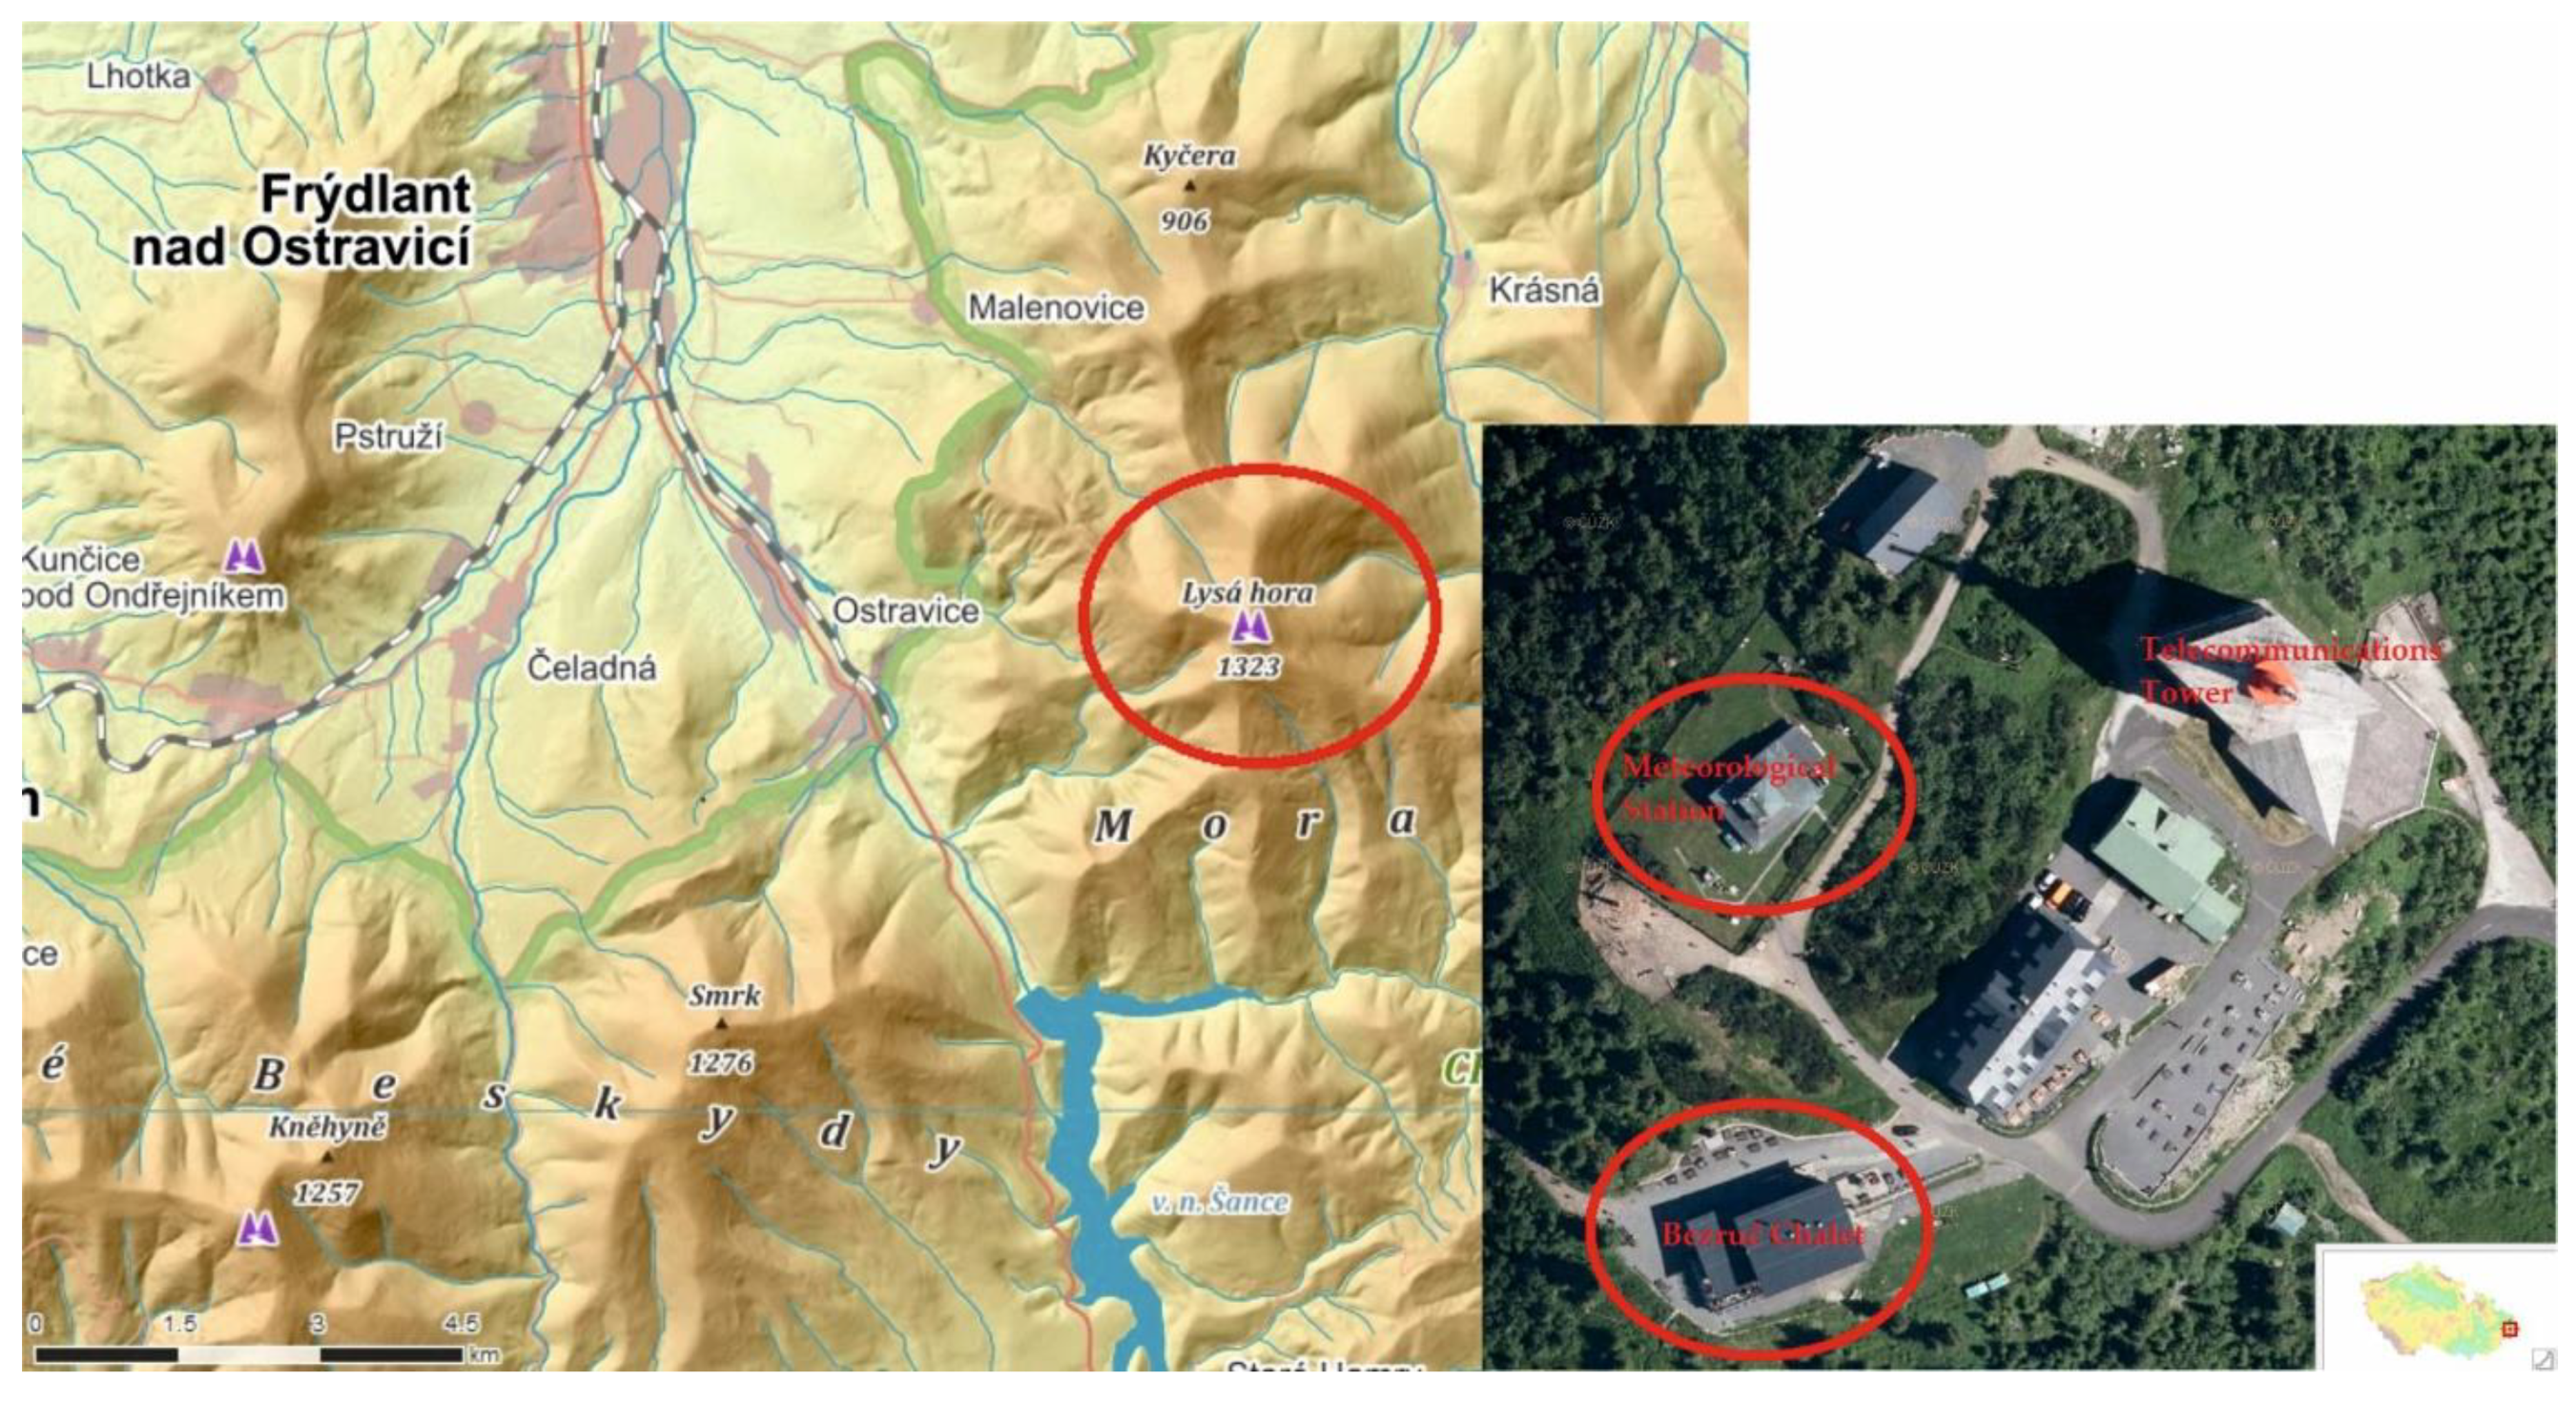
Figure 2.
Climate areas according to the Quitt classification (adjusted by [15]).
Figure 2.
Climate areas according to the Quitt classification (adjusted by [15]).

Figure 3.
Average temperatures at Lysá hora in 2018 [13].
Figure 3.
Average temperatures at Lysá hora in 2018 [13].


Figure 6.
Calculation of the average outdoor temperature in Scenario 1 [18].
Figure 6.
Calculation of the average outdoor temperature in Scenario 1 [18].

Figure 7.
Temperature progression over 25 years under Scenario 1 (calculated by [16]).
Figure 7.
Temperature progression over 25 years under Scenario 1 (calculated by [16]).

Figure 8.
Calculation of the average outdoor temperature in Scenario 2 [18].
Figure 8.
Calculation of the average outdoor temperature in Scenario 2 [18].

Figure 9.
Temperature progression over 25 years under Scenario 2 (calculated by [16]).
Figure 9.
Temperature progression over 25 years under Scenario 2 (calculated by [16]).

Figure 10.
Temperature progression over 25 years under Scenario 3 (calculated by [16]).
Figure 10.
Temperature progression over 25 years under Scenario 3 (calculated by [16]).

Figure 11.
Temperature progression over 25 years under Scenario 4 (calculated by [16]).
Figure 11.
Temperature progression over 25 years under Scenario 4 (calculated by [16]).


Table 1.
Example of geothermal resource allocation [5].
Table 1.
Example of geothermal resource allocation [5].
| Category | Temperature (T) | Production Enthalpy (h) | |
|---|---|---|---|
| warm water (low temperature) | T < 125 °C | h < 600 kJ/kg | |
| hot water (intermediate temperature) | T < 225 °C | h < 1000 kJ/kg | |
| two-phase (high temperature) | low enthalpy (very hot water) | 225 °C < T < 270 °C | 1000 kJ/kg < h < 1300 kJ/kg |
| high enthalpy (boiling water and steam) | 250 °C < T < 330 °C | 1300 kJ/kg < h < 2500 kJ/kg | |
| vapor-dominated (dry steam) | 250 °C < T < 330 °C | 2500 kJ/kg < h < 2800 kJ/kg | |
Table 2.
Overview of parameters for each scenario.
| Parameter | Unit | Scenario 1 | Scenario 2 | Scenario 3 | Scenario 4 |
|---|---|---|---|---|---|
| thermal conductivity coefficient | W/(m·K) | 3.9 | 3.9 | 3.9 | 6.9 |
| outside average temperature | °C | 6.9 | 7.7 | 7.7 | 7.7 |
| number of wells | no. | 5.0 | 5.0 | 5.0 | 5.0 |
| well length | m | 100.0 | 100.0 | 147.1 | 100.0 |
| total well length | m | 500.0 | 500.0 | 735.5 | 500.0 |
| min. average monthly temperature in 25th year | °C | −9.8 | −9.0 | −3.5 | −3.5 |
| max. average monthly temperature in 25th year | °C | −4.6 | −3.8 | 0.2 | 0.3 |
Publisher’s Note: MDPI stays neutral with regard to jurisdictional claims in published maps and institutional affiliations. |
© 2021 by the authors. Licensee MDPI, Basel, Switzerland. This article is an open access article distributed under the terms and conditions of the Creative Commons Attribution (CC BY) license (http://creativecommons.org/licenses/by/4.0/).
Share and Cite
MDPI and ACS Style
Kunz, A.; Klempa, M.; Bujok, P.; Piotrowski, D. Analysis of Global Warming’s Influence on the Dimensioning of Borehole Heat Exchangers at a Climate-Exposed Site. Processes 2021, 9, 501. https://doi.org/10.3390/pr9030501
AMA Style
Kunz A, Klempa M, Bujok P, Piotrowski D. Analysis of Global Warming’s Influence on the Dimensioning of Borehole Heat Exchangers at a Climate-Exposed Site. Processes. 2021; 9(3):501. https://doi.org/10.3390/pr9030501
Chicago/Turabian StyleKunz, Antonín, Martin Klempa, Petr Bujok, and Dawid Piotrowski. 2021. "Analysis of Global Warming’s Influence on the Dimensioning of Borehole Heat Exchangers at a Climate-Exposed Site" Processes 9, no. 3: 501. https://doi.org/10.3390/pr9030501
Note that from the first issue of 2016, this journal uses article numbers instead of page numbers. See further details here.