
Cellulose Paper Sorptive Extraction (CPSE) Combined with Gas Chromatography–Mass Spectrometry (GC–MS) for Facile Determination of Lorazepam Residues in Food Samples Involved in Drug Facilitated Crimes

 ,
,  ,
,  , ,
, ,
Abstract
:
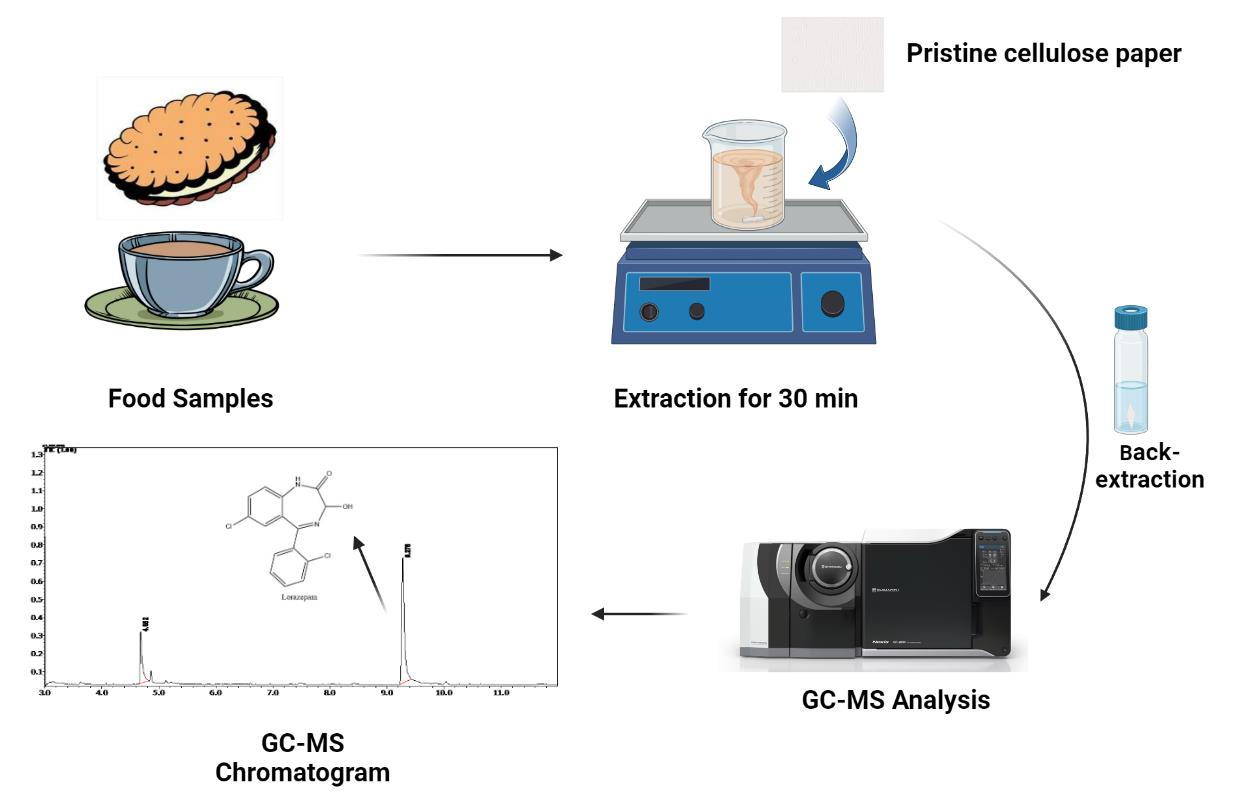
1. Introduction
2. Results and Discussion
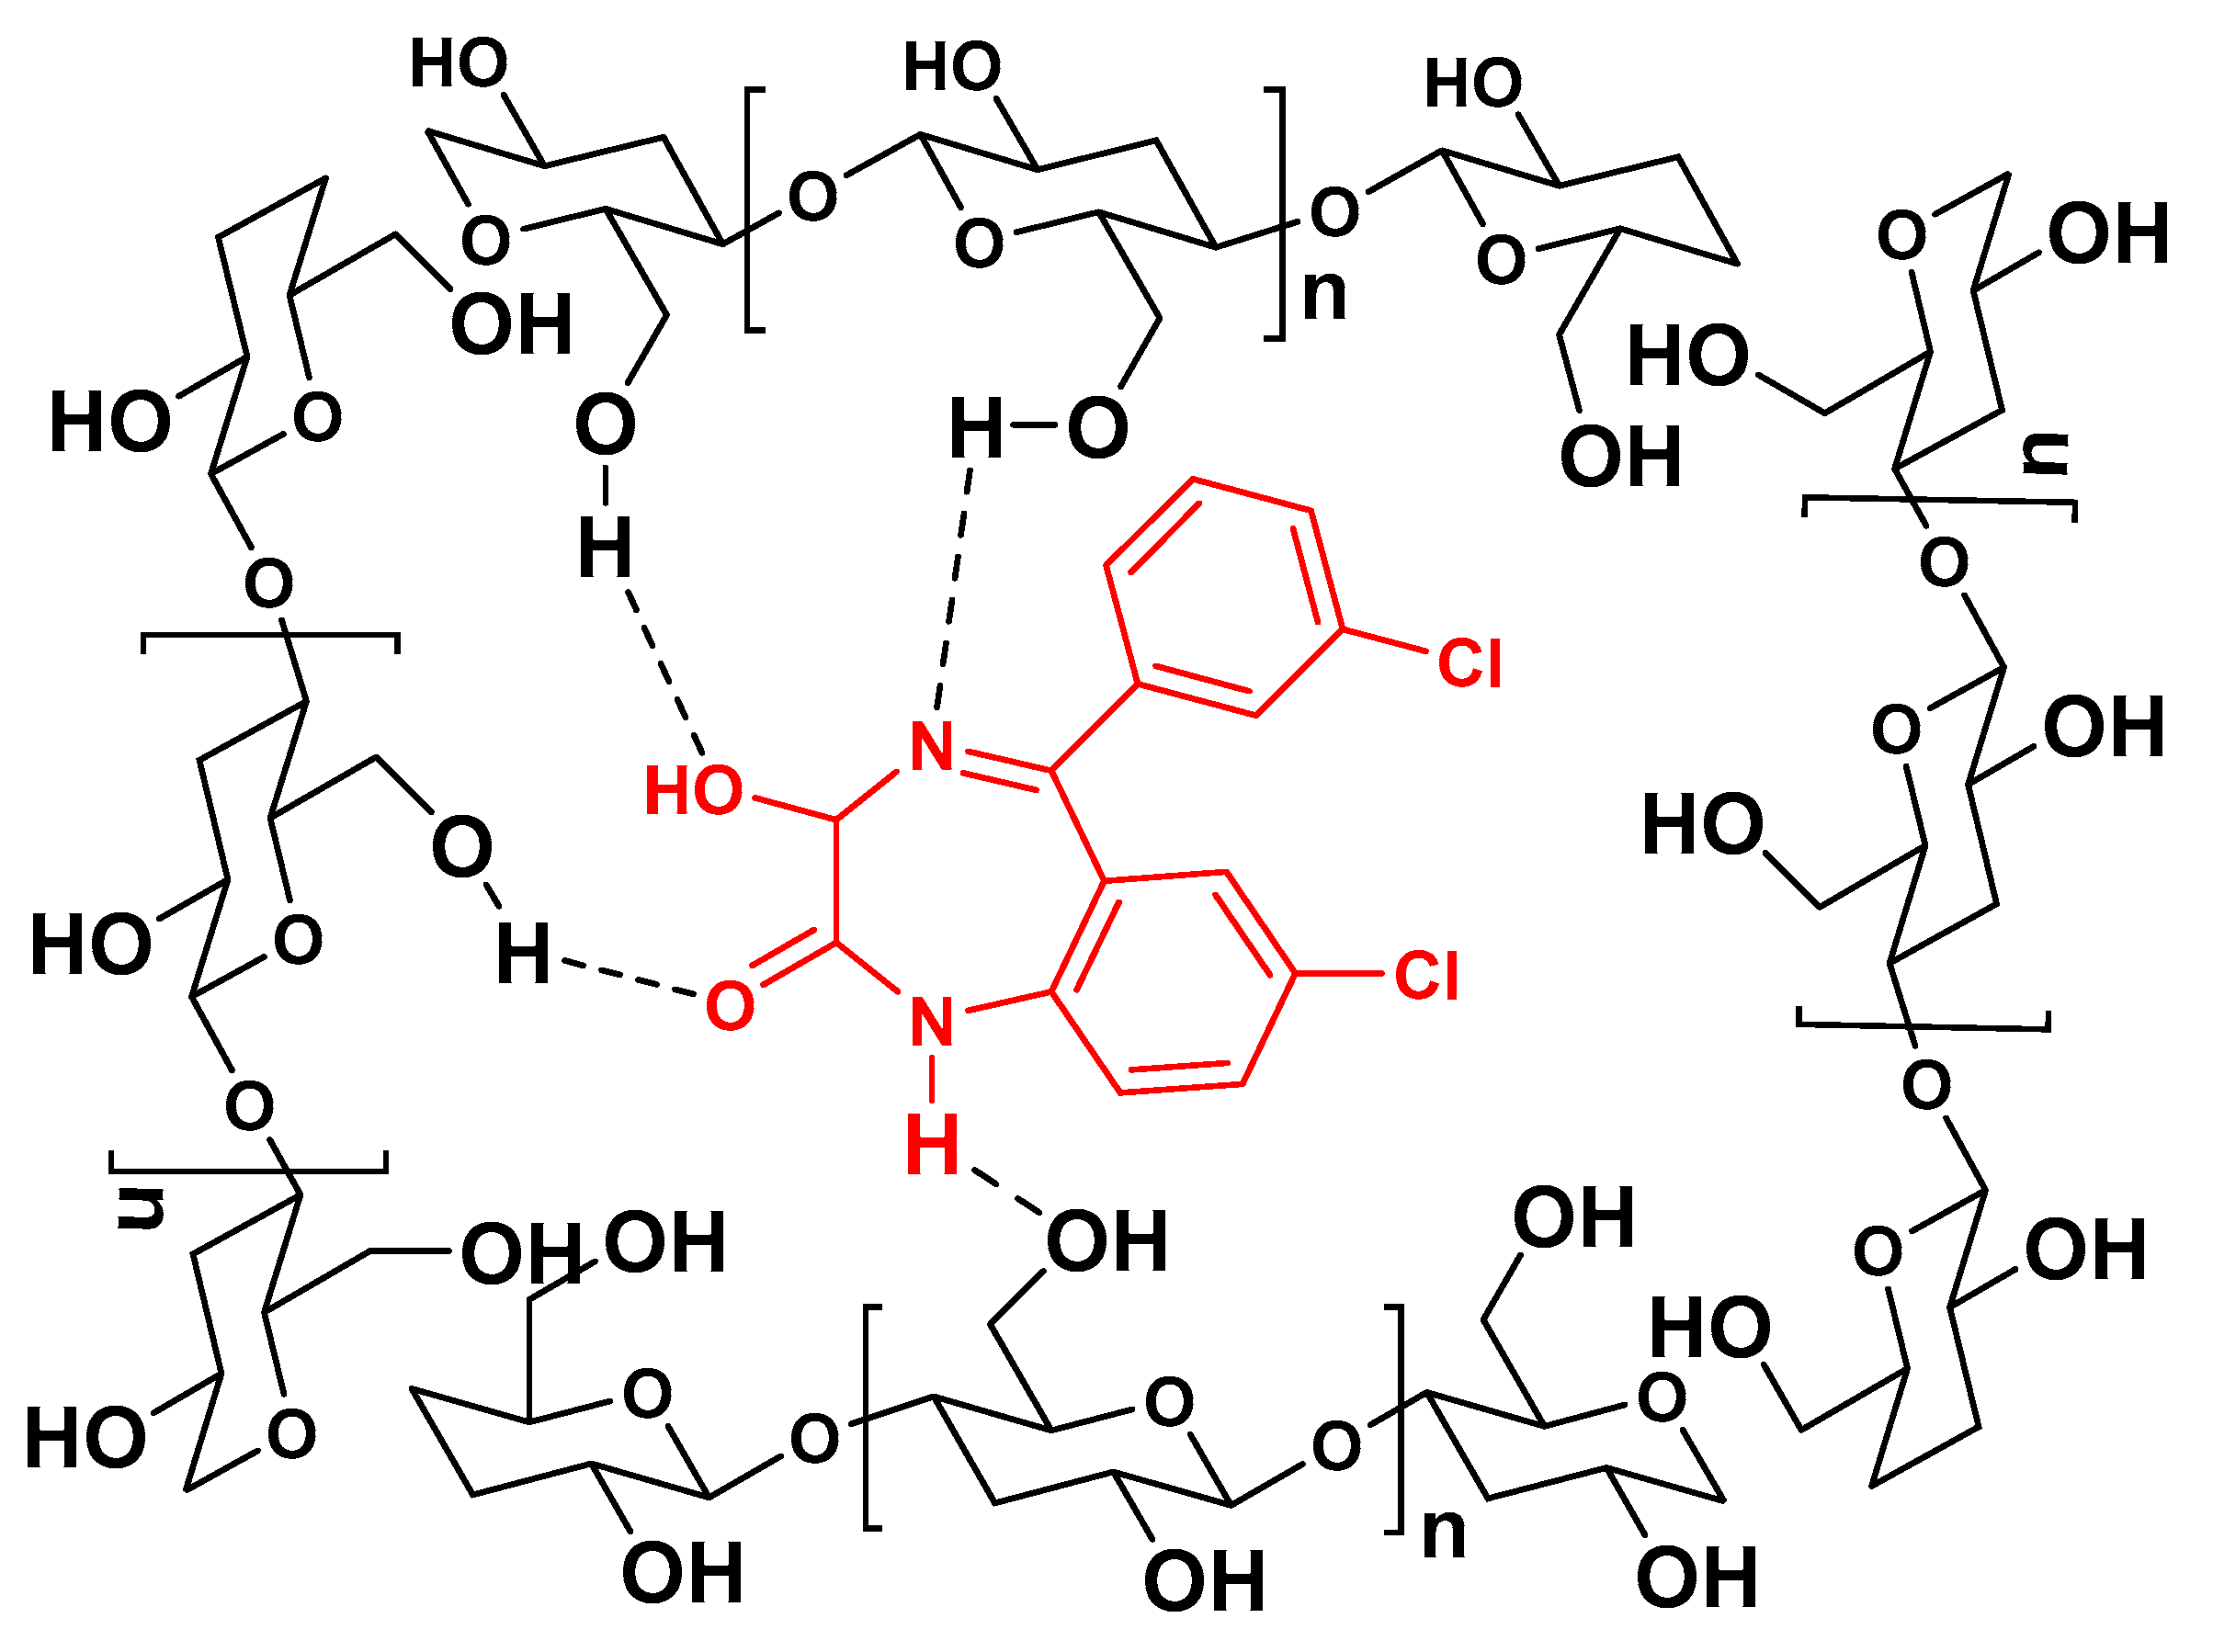
2.1. Mechanism of Extraction
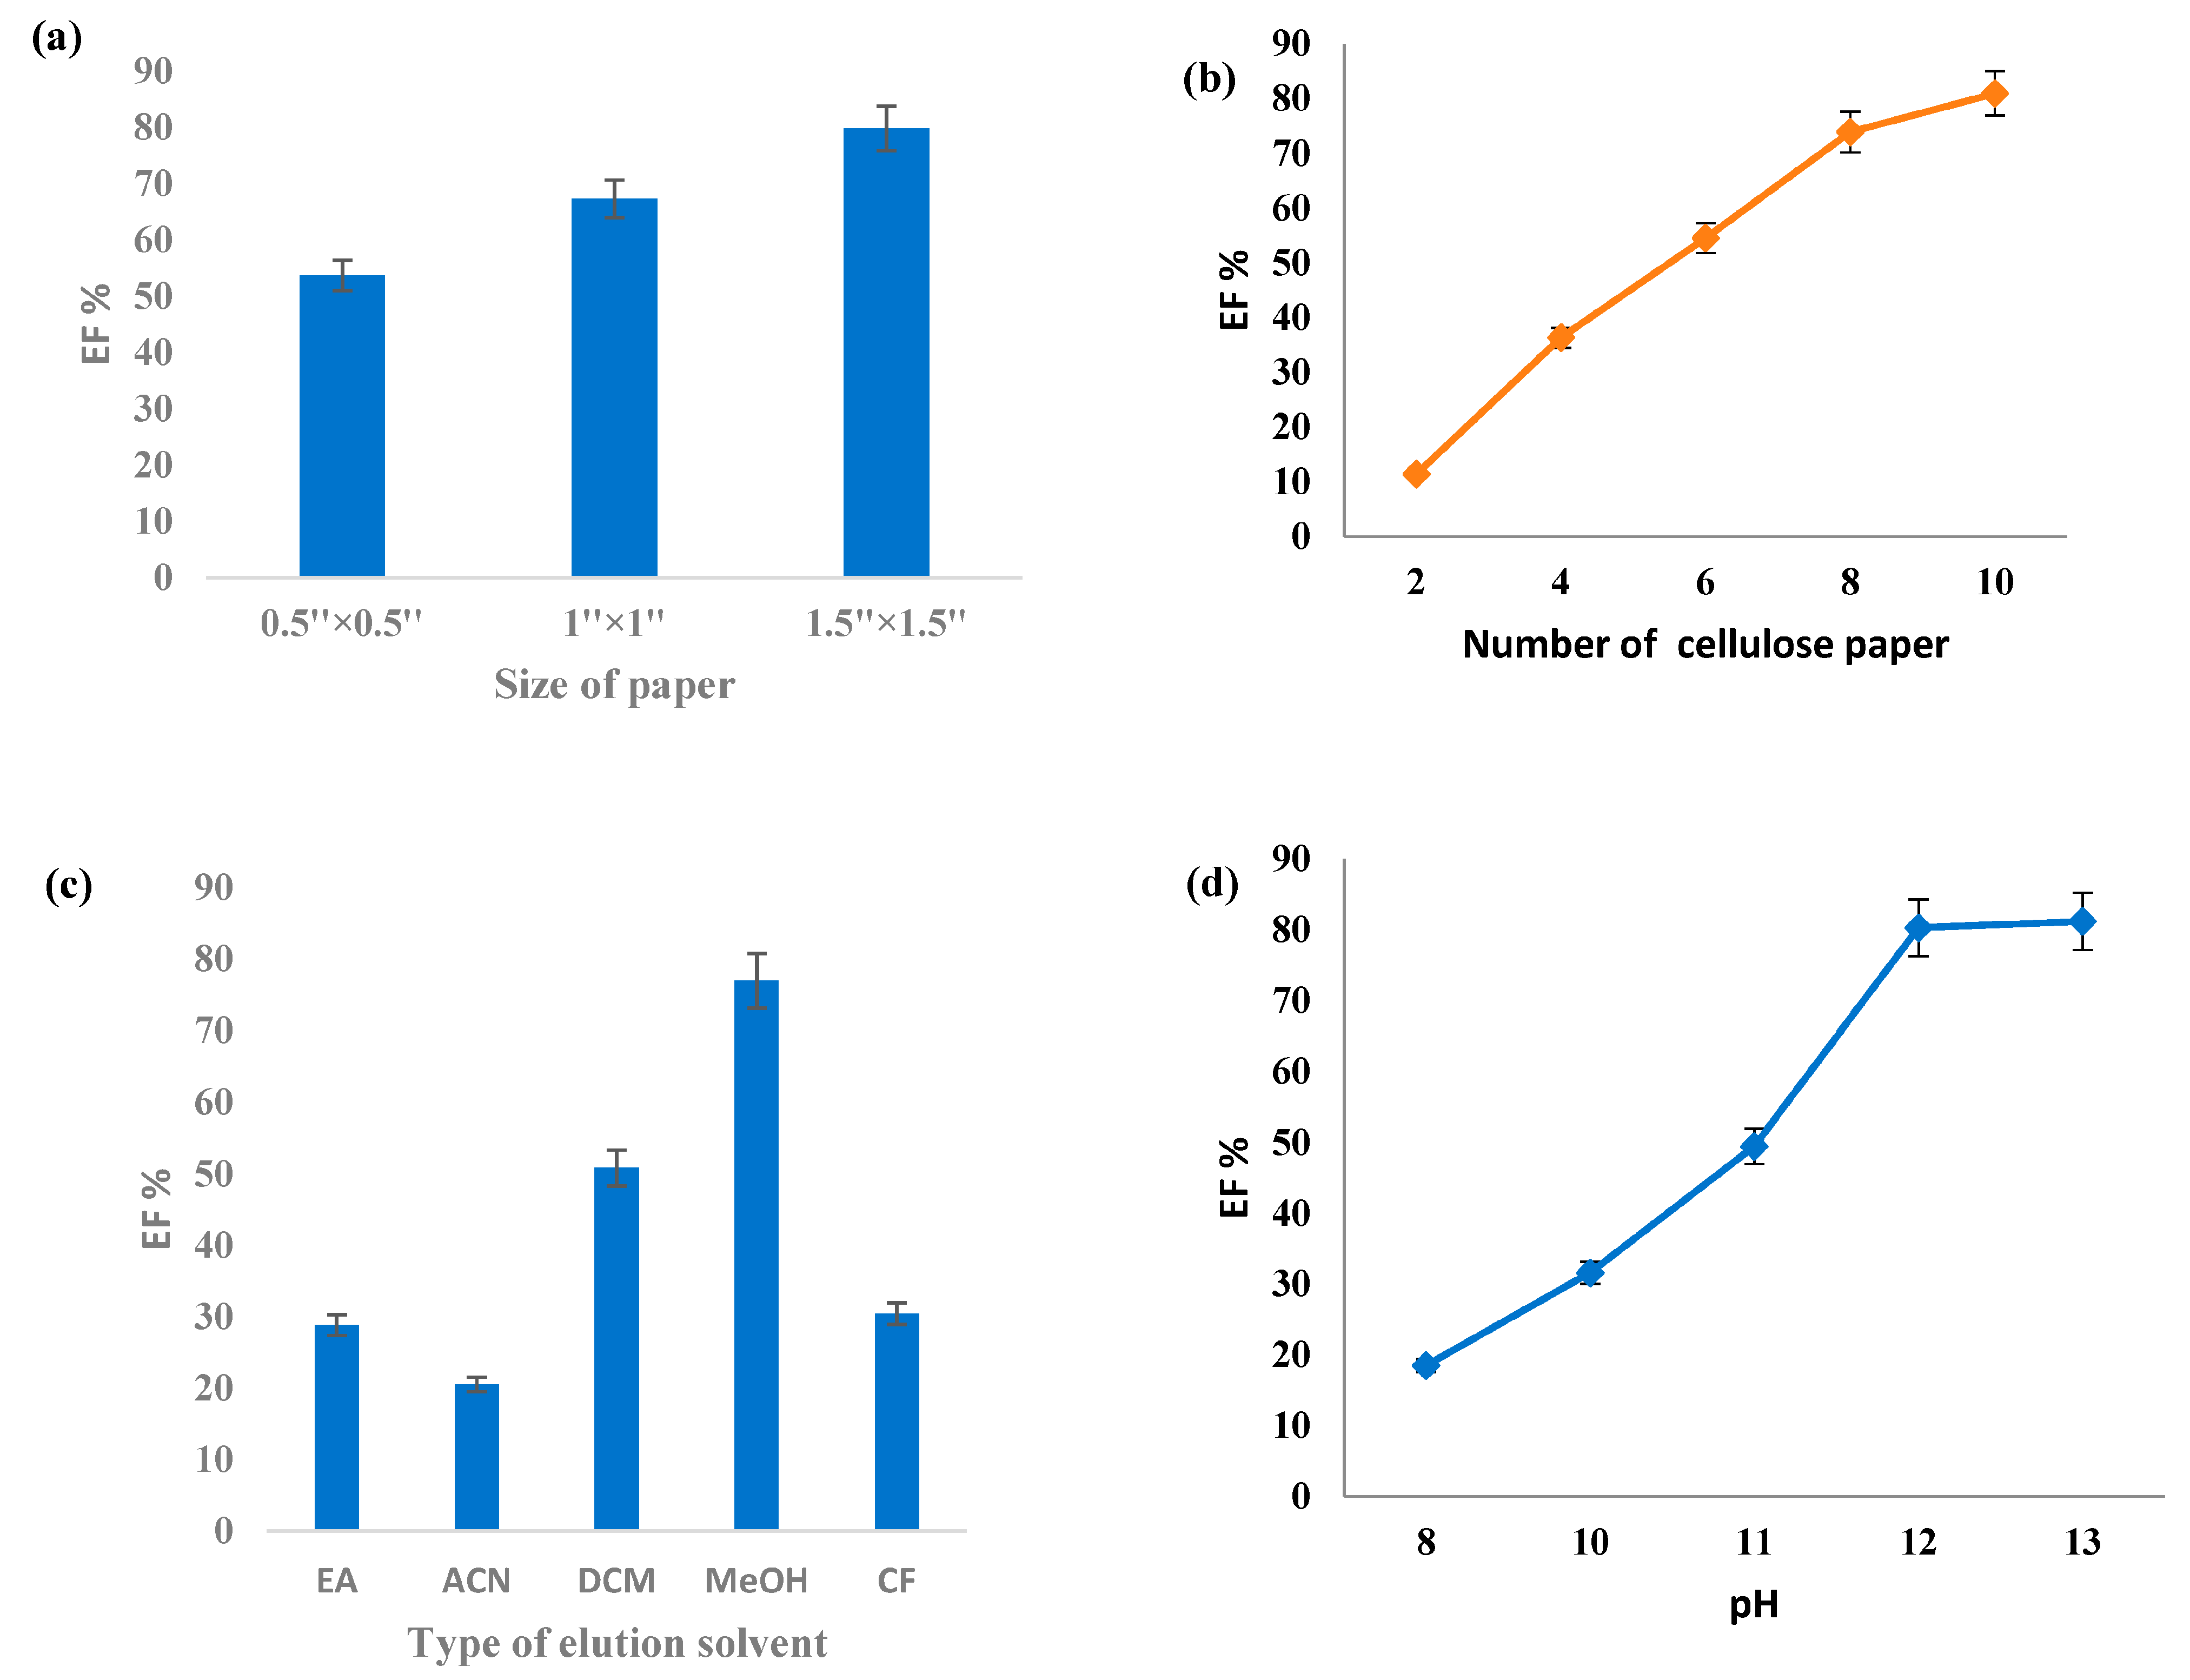
2.2. Size and Quantity of Cellulose Paper
2.3. Type and Volume of Back-Extraction Solvent
2.4. Optimization of pH and Ionic Strength
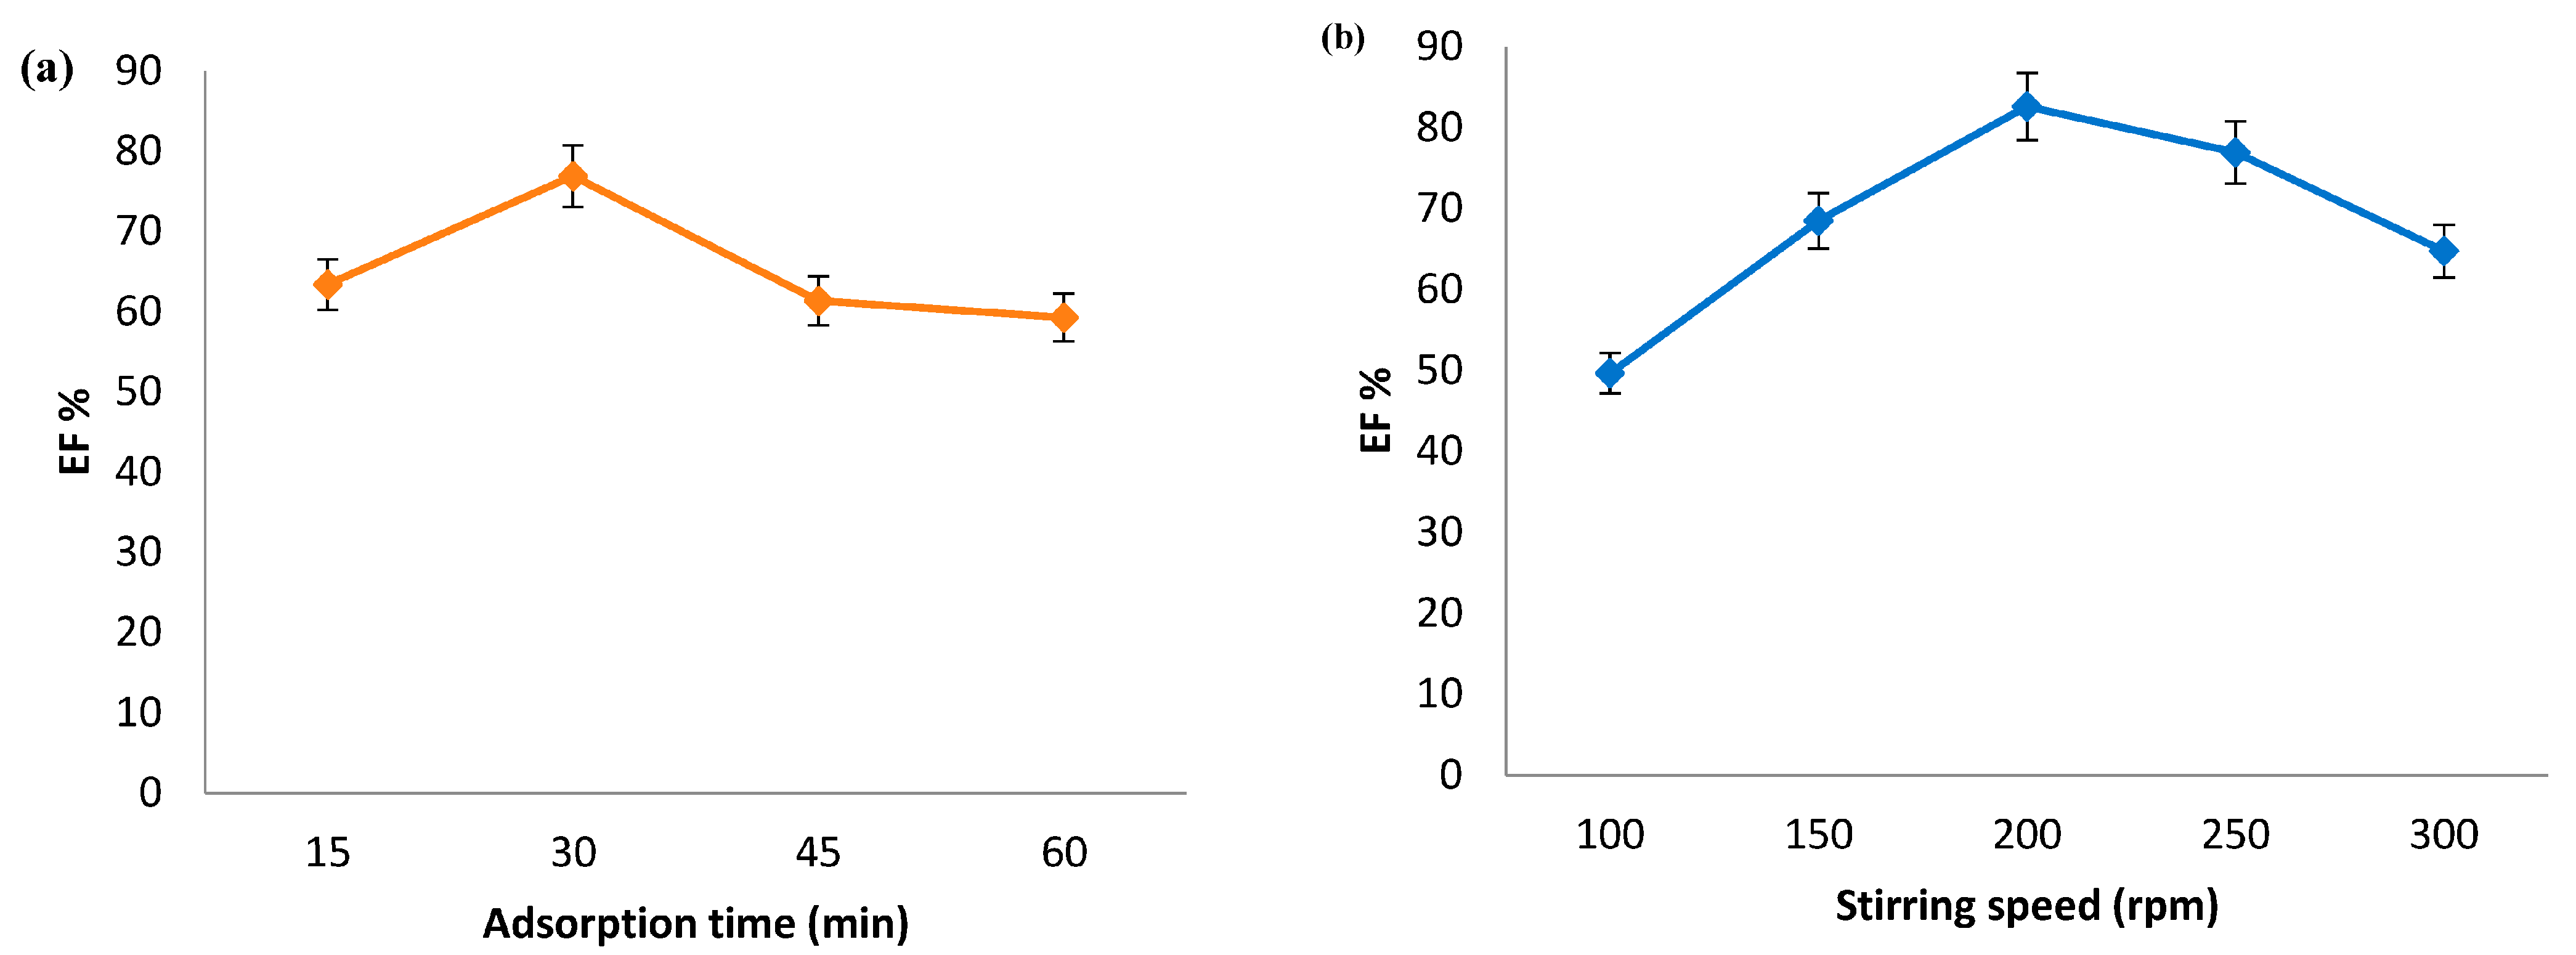
2.5. Optimization of Adsorption Conditions
2.6. Optimization of Back-Extraction Mode
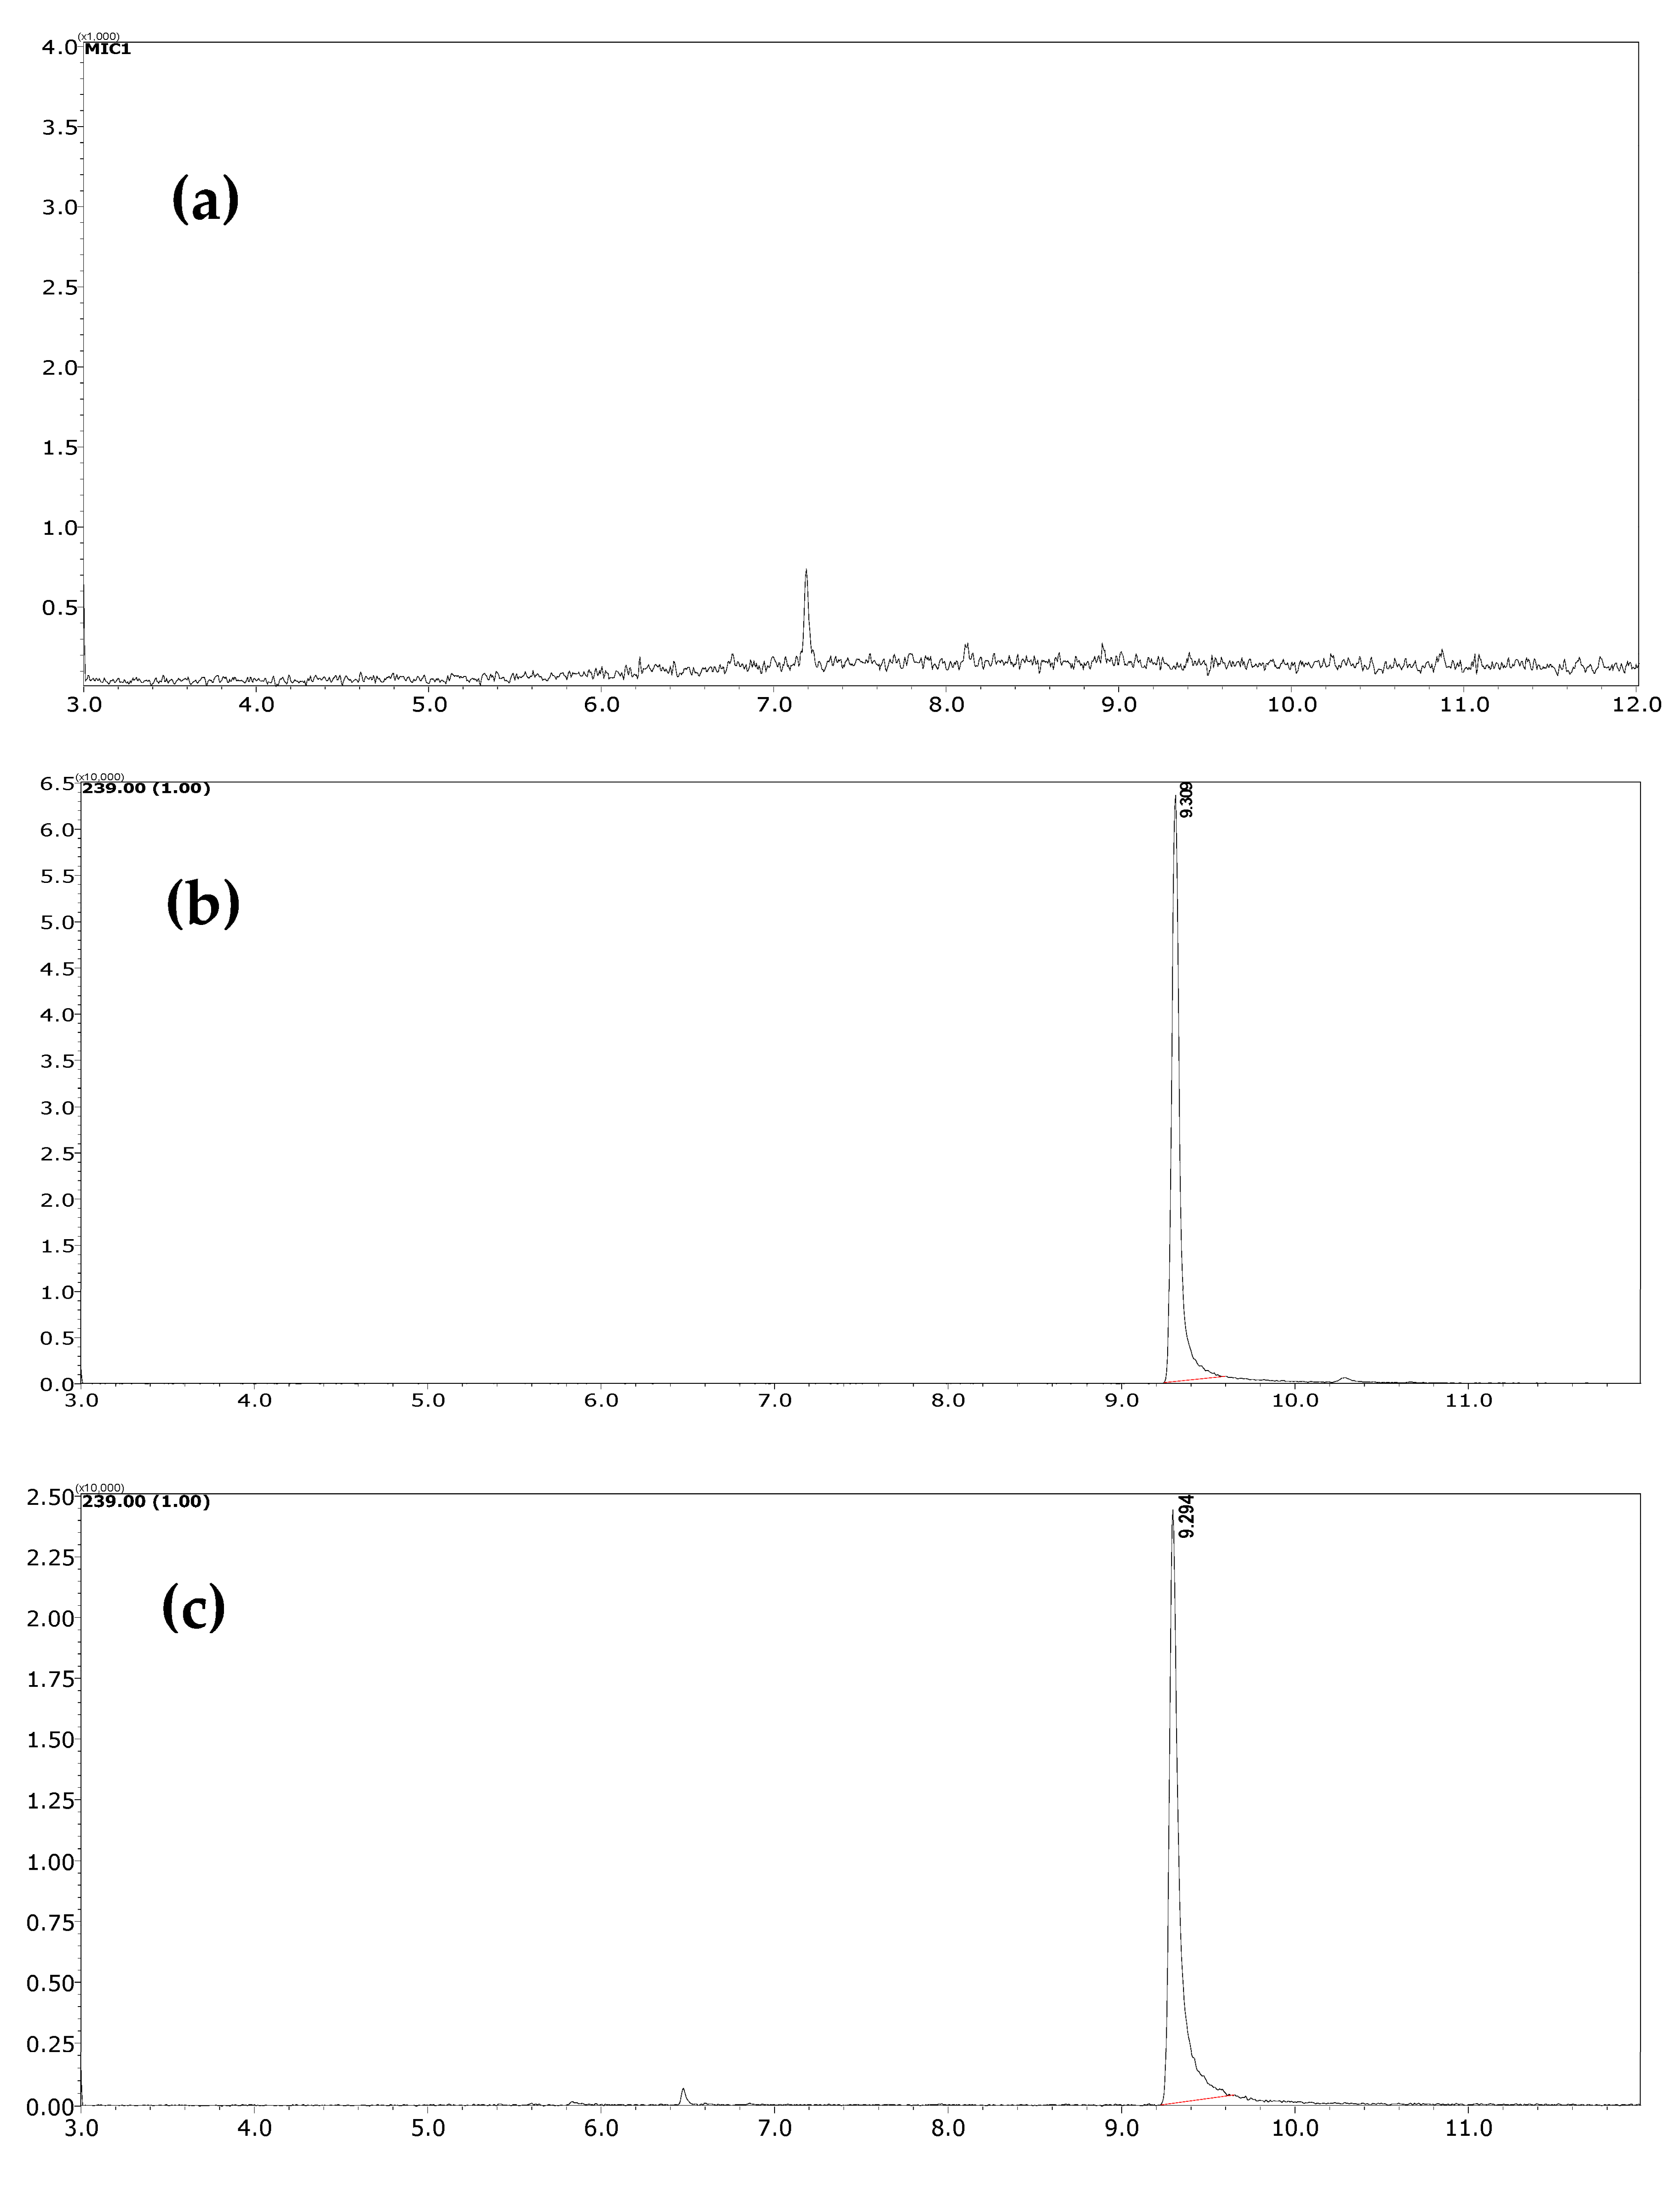
3. Analytical Performance
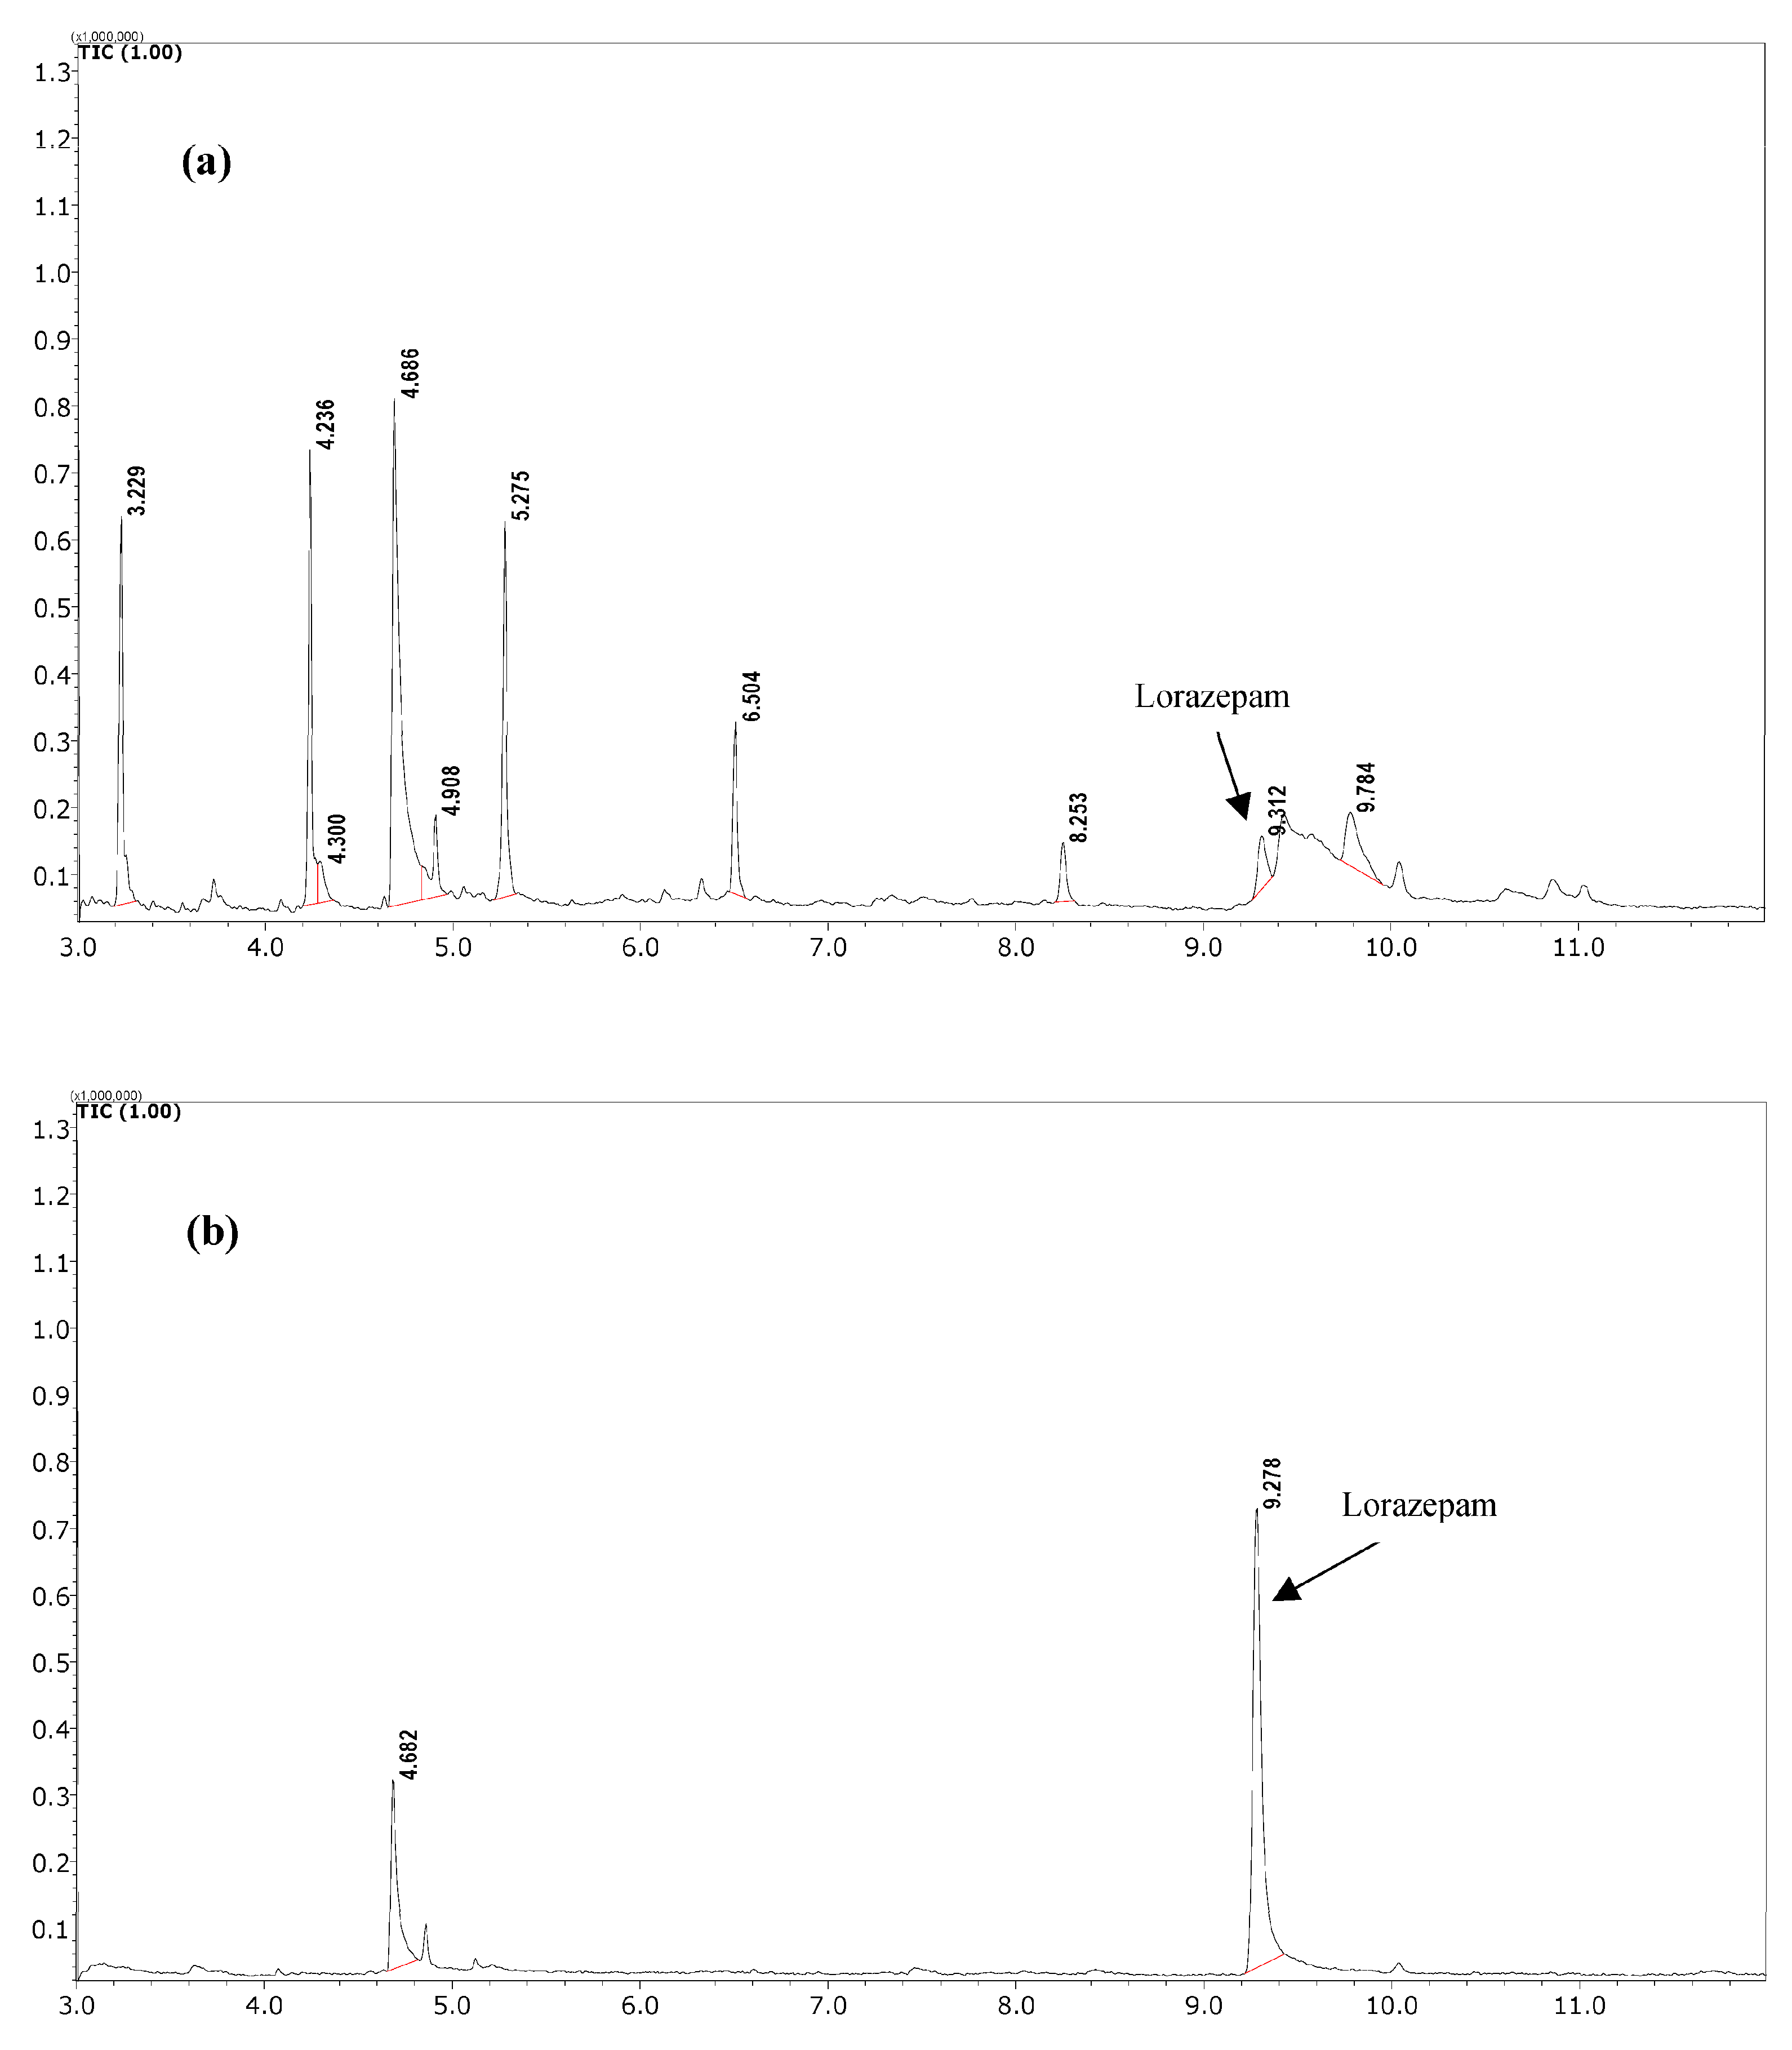
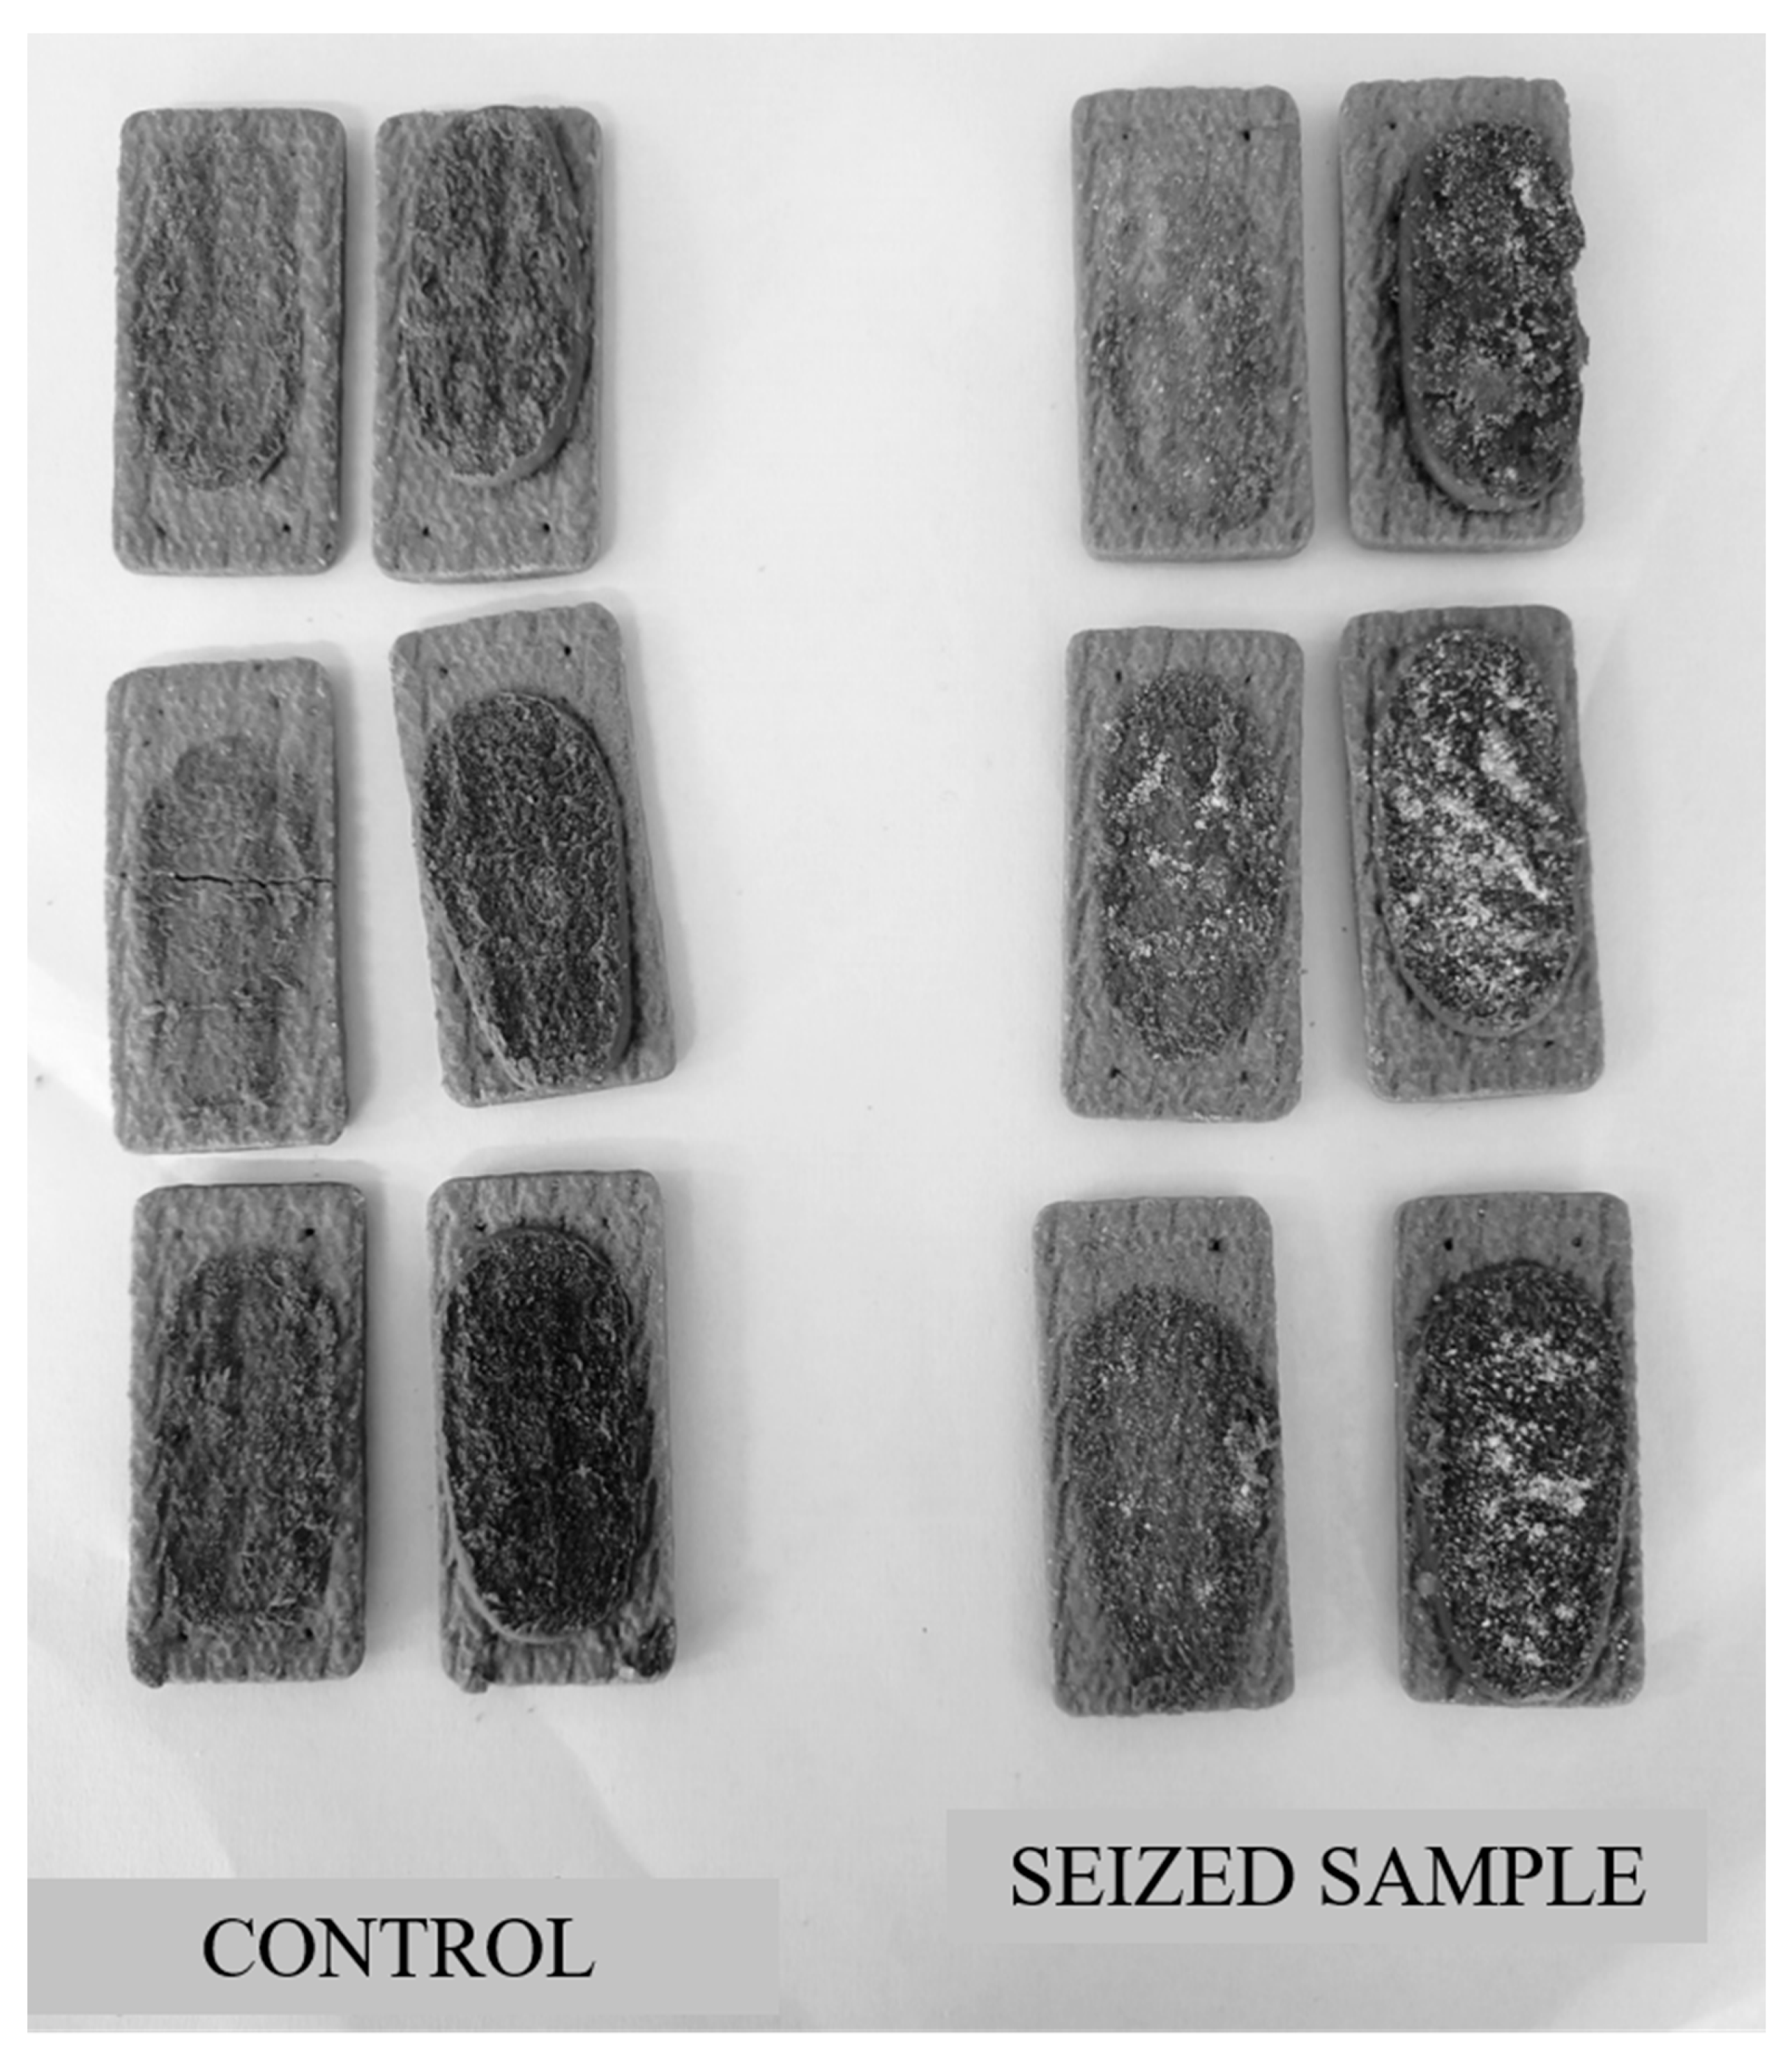
4. Application to Real Forensic Samples and Pharmacological Interpretation
5. Assessment of the Green Character of the Method
6. Experimental
6.1. Material and Methods
6.2. Cellulose Paper Sorptive Extraction (CPSE) Procedure
6.3. Gas Chromatography—Mass Spectrometry (GC–MS) Analysis
6.4. Method Validation
6.5. Sample Stability
7. Case History
8. Conclusions
Supplementary Materials
Author Contributions
Funding
Data Availability Statement
Acknowledgments
Conflicts of Interest
References
- Gharedaghi, F.; Hassanian-Moghaddam, H.; Akhgari, M.; Zamani, N.; Taghadosinejad, F. Drug-facilitated crime caused by drinks or foods. Egypt. J. Forensic Sci. 2018, 8, 68. [Google Scholar] [CrossRef]
- Kintz, P.; Villain, M.; Cirimele, V.; Pépin, G.; Ludes, B. Windows of detection of lorazepam in urine, oral fluid and hair, with a special focus on drug-facilitated crimes. Forensic Sci. Int. 2004, 145, 131–135. [Google Scholar] [CrossRef] [PubMed]
- Jufer-Phipps, R.A.; Levine, B.S. Benzodiazepines. In Principles of Forensic Toxicology; Springer: Cham, Switzerland, 2020; pp. 317–331. [Google Scholar]
- Sasaki, K.; Shima, N.; Kamata, T.; Ishikawa, A.; Nitta, A.; Wada, M.; Nakano-Fujii, S.; Kakehashi, H.; Sato, T.; Katagi, M. Incorporation of five common hypnotics into hair after a single dose and application to a forensic case of drug facilitated crimes. Forensic Sci. Int. 2021, 325, 110881. [Google Scholar] [CrossRef]
- Chèze, M.; Villain, M.; Pépin, G. Determination of bromazepam, clonazepam and metabolites after a single intake in urine and hair by LC–MS/MS: Application to forensic cases of drug facilitated crimes. Forensic Sci. Int. 2004, 145, 123–130. [Google Scholar] [CrossRef]
- Chèze, M.; Duffort, G.; Deveaux, M.; Pépin, G. Hair analysis by liquid chromatography–tandem mass spectrometry in toxicological investigation of drug-facilitated crimes: Report of 128 cases over the period June 2003–May 2004 in metropolitan Paris. Forensic Sci. Int. 2005, 153, 3–10. [Google Scholar] [CrossRef] [PubMed]
- Kim, J.; In, S.; Choi, H.; Lee, S. Illegal use of benzodiazepines and/or zolpidem proved by hair analysis. J. Forensic Sci. 2013, 58, 548–551. [Google Scholar] [CrossRef] [PubMed]
- Kintz, P. Bioanalytical procedures for detection of chemical agents in hair in the case of drug-facilitated crimes. Anal. Bioanal. Chem. 2007, 388, 1467–1474. [Google Scholar] [CrossRef]
- Humbert, L.; Hoizey, G.; Lhermitte, M. Drugs involved in drug-facilitated crimes (DFC): Analytical aspects: 1—Blood and urine. In Toxicological Aspects of Drug-Facilitated Crimes; Academic Press: Cambridge, MA, USA, 2014; pp. 159–180. [Google Scholar]
- Acikkol, M.; Mercan, S.; Karadayi, S. Simultaneous determination of benzodiazepines and ketamine from alcoholic and nonalcoholic beverages by GC-MS in drug facilitated crimes. Chromatographia 2009, 70, 1295–1298. [Google Scholar] [CrossRef]
- de Paula, C.; Jurisch, M.; Piccin, E.; Augusti, R. Recognizing drug facilitated crimes: Detection and quantification of benzodiazepines in beverages using fast liquid–liquid extraction with low temperature partitioning and paper spray mass spectrometry. Drug Test. Anal. 2018, 10, 1348–1357. [Google Scholar] [CrossRef]
- Ghosh, P.; Reddy, M.M.; Rao, B.S.; Sarin, R.K. Determination of diazepam in cream biscuits by liquid chromatography. J. AOAC Int. 2004, 87, 569–572. [Google Scholar] [CrossRef]
- Stelmaszczyk, P.; Gacek, E.; Wietecha-Posłuszny, R. Green aspects in the procedure of detection ketamine, flunitrazepam, and diazepam in drinks based on dried sample spot analysis. Green Anal. Chem. 2022, 3, 100029. [Google Scholar] [CrossRef]
- Piergiovanni, M.; Cappiello, A.; Famiglini, G.; Termopoli, V.; Palma, P. Determination of benzodiazepines in beverages using green extraction methods and capillary HPLC-UV detection. J. Pharm. Biomed. Anal. 2018, 154, 492–500. [Google Scholar] [CrossRef] [PubMed]
- Famiglini, G.; Capriotti, F.; Palma, P.; Termopoli, V.; Cappiello, A. The rapid measurement of benzodiazepines in a milk-based alcoholic beverage using QuEChERS extraction and GC–MS analysis. J. Anal. Toxicol. 2015, 39, 306–312. [Google Scholar] [CrossRef]
- Magrini, L.; Cappiello, A.; Famiglini, G.; Palma, P. Microextraction by packed sorbent (MEPS)-UHPLC-UV: A simple and efficient method for the determination of five benzodiazepines in an alcoholic beverage. J. Pharm. Biomed. Anal. 2016, 125, 48–53. [Google Scholar] [CrossRef] [PubMed]
- Xu, M.L.; Gao, Y.; Wang, X.; Han, X.X.; Zhao, B. Comprehensive strategy for sample preparation for the analysis of food contaminants and residues by gc–ms/ms: A review of recent research trends. Foods 2021, 10, 2473. [Google Scholar] [CrossRef]
- Díaz-Liñán, M.C.; Lucena, R.; Cárdenas, S.; López-Lorente, A.I. Unmodified cellulose filter paper, a sustainable and affordable sorbent for the isolation of biogenic amines from beer samples. J. Chromatogr. A 2021, 1651, 462297. [Google Scholar] [CrossRef]
- Kumar, S.; Bhushan, P.; Bhattacharya, S. Fluid transport mechanisms in paper-based microfluidic devices. In Paper Microfluidics; Springer: Singapore, 2019; pp. 7–28. [Google Scholar]
- Jain, B.; Jain, R.; Jha, R.R.; Ghosh, A.; Basu, D.; Abourehab MA, S.; Bajaj, A.; Chauhan, V.; Kaur, S.; Sharma, S. Cellulose paper sorptive extraction (CPSE): A simple and affordable microextraction method for analysis of basic drugs in blood as a proof of concept. J. Chromatogr. B Anal. Technol. Biomed. Life Sci. 2023, 1214, 123551. [Google Scholar] [CrossRef]
- Bagheri, A.R.; Aramesh, N.; Lee, H.K. Chitosan-and/or cellulose-based materials in analytical extraction processes: A review. TrAC Trends Anal. Chem. 2022, 157, 116770. [Google Scholar] [CrossRef]
- Godage, N.H.; Gionfriddo, E. Use of natural sorbents as alternative and green extractive materials: A critical review. Anal. Chim. Acta 2020, 1125, 187–200. [Google Scholar] [CrossRef]
- Gałuszka, A.; Migaszewski, Z.; Namieśnik, J. The 12 principles of green analytical chemistry and the SIGNIFICANCE mnemonic of green analytical practices. TrAC Trends Anal. Chem. 2013, 50, 78–84. [Google Scholar] [CrossRef]
- Nowak, P.M.; Wietecha-Posłuszny, R.; Pawliszyn, J. White Analytical Chemistry: An approach to reconcile the principles of Green Analytical Chemistry and functionality. TrAC Trends Anal. Chem. 2021, 138, 116223. [Google Scholar] [CrossRef]
- Kabir, A.; Mesa, R.; Jurmain, J.; Furton, K.G. Fabric phase sorptive extraction explained. Separations 2017, 4, 21. [Google Scholar] [CrossRef]
- Sheikh, M.; Hadjmohammadi, M.R.; Fatemi, M.H. Simultaneous extraction and analysis of clozapine and lorazepam from human plasma using dual solvent-stir bar microextraction with different acceptor phases followed by high-performance liquid chromatography ultra-violet detection. Anal. Methods 2021, 13, 110–116. [Google Scholar] [CrossRef] [PubMed]
- Moffat, A.C.; Osselton, M.D.; Widdop, B.; Watts, J. Clarke’s Analysis of Drugs and Poisons; Pharmaceutical Press: London, UK, 2011; Volume 3. [Google Scholar]
- Wan Ibrahim, W.N.; Sanagi, M.M.; Mohamad Hanapi, N.S.; Kamaruzaman, S.; Yahaya, N.; Wan Ibrahim, W.A. Solid-phase microextraction based on an agarose-chitosan-multiwalled carbon nanotube composite film combined with HPLC–UV for the determination of nonsteroidal anti-inflammatory drugs in aqueous samples. J. Sep. Sci. 2018, 41, 2942–2951. [Google Scholar] [CrossRef]
- Alampanos, V.; Kabir, A.; Furton, K.; Samanidou, V. Magnet integrated fabric phase sorptive extraction of selected endocrine disrupting chemicals from human urine followed by high-performance liquid chromatography–photodiode array analysis. J. Chromatogr. A 2021, 1654, 462459. [Google Scholar] [CrossRef]
- Manousi, N.; Kabir, A.; Furton, K.G.; Zachariadis, G.A.; Rosenberg, E. Expanding the applicability of magnet integrated fabric phase sorptive extraction in food analysis: Extraction of triazine herbicides from herbal infusion samples. Microchem. J. 2022, 179, 107524. [Google Scholar] [CrossRef]
- Leppik, I.E. Status epilepticus in the elderly. Epilepsia 2018, 59, 140–143. [Google Scholar] [CrossRef]
- de Araújo, É.J.F.; Rezende-Júnior, L.M.; Lima LK, F.; da Silva-Júnior, M.P.; Silva, O.A.; de Sousa Neto, B.P.; Lima, F.D.C.A. Pathophysiological investigations, anxiolytic effects and interaction of a semisynthetic riparin with benzodiazepine receptors. Biomed. Pharmacother. 2018, 103, 973–981. [Google Scholar] [CrossRef]
- Vlastra, W.; Delewi, R.; Rohling, W.J.; Wagenaar, T.C.; Hirsch, A.; Meesterman, M.G.; Vis, M.M.; Wykrzykowska, J.J.; Koch, K.T.; de Winter, R.J.; et al. Premedication to reduce anxiety in patients undergoing coronary angiography and percutaneous coronary intervention. Open Heart 2018, 5, e000833. [Google Scholar] [CrossRef]
- Ghiasi, N.; Bhansali, R.K.; Marwaha, R. Lorazepam. In StatPearls; StatPearls Publishing: Tampa, FL, USA, 2021. [Google Scholar]
- Kang, M.; Galuska, M.A.; Ghassemzadeh, S. Benzodiazepine Toxicity. 2018. Available online: https://europepmc.org/article/nbk/nbk482238 (accessed on 7 February 2023).
- Tanaka, E. Toxicological interactions between alcohol and benzodiazepines. J. Toxicol. Clin. Toxicol. 2002, 40, 69–75. [Google Scholar] [CrossRef]
- Jones, C.M.; Paulozzi, L.J.; Mack, K.A. Alcohol involvement in opioid pain reliever and benzodiazepine drug abuse–related emergency department visits and drug-related deaths—United States, 2010. Morb. Mortal. Wkly. Rep. 2014, 63, 881. [Google Scholar]
- Tori, M.E.; Larochelle, M.R.; Naimi, T.S. Alcohol or benzodiazepine co-involvement with opioid overdose deaths in the United States, 1999–2017. JAMA Netw. Open 2020, 3, e202361. [Google Scholar] [CrossRef] [PubMed]
- Gałuszka, A.; Migaszewski, Z.M.; Konieczka, P.; Namieśnik, J. Analytical Eco-Scale for assessing the greenness of analytical procedures. TrAC Trends Anal. Chem. 2012, 37, 61–72. [Google Scholar] [CrossRef]
- Płotka-Wasylka, J. A new tool for the evaluation of the analytical procedure: Green Analytical Procedure Index. Talanta 2018, 181, 204–209. [Google Scholar] [CrossRef]
- Jain, R.; Jain, B.; Chauhan, V.; Deswal, B.; Kaur, S.; Sharma, S.; Abourehab, M.A. Simple determination of Dichlorvos in cases of fatal intoxication by Gas Chromatography-Mass Spectrometry. J. Chromatogr. B 2022, 1215, 123582. [Google Scholar] [CrossRef]
- Ahmed, A.B.; Gamal, M.; Naguib, I.A.; Ali, H.M.; Abdallah, F.F. Environmental impact of the reported chromatographic methods for the determination of the first FDA-Approved therapy for COVID-19 Patients, Remdesivir: A comparative study. Microchem. J. 2022, 176, 107242. [Google Scholar] [CrossRef]
- Abdelgawad, M.A.; Abdelaleem, E.A.; Gamal, M.; Abourehab, M.A.; Abdelhamid, N.S. A new green approach for the reduction of consumed solvents and simultaneous quality control analysis of several pharmaceuticals using a fast and economic RP-HPLC method; a case study for a mixture of piracetam, ketoprofen and omeprazole drugs. RSC Adv. 2022, 12, 16301–16309. [Google Scholar] [CrossRef]
- Jain, B.; Jain, R.; Kabir, A.; Sharma, S. Rapid Determination of Non-Steroidal Anti-Inflammatory Drugs in Urine Samples after In-Matrix Derivatization and Fabric Phase Sorptive Extraction-Gas Chromatography-Mass Spectrometry Analysis. Molecules 2022, 27, 7188. [Google Scholar] [CrossRef]
- Shaaban, H. The ecological impact of liquid chromatographic methods reported for bioanalysis of COVID-19 drug, hydroxychloroquine: Insights on greenness assessment. Microchem. J. 2023, 184, 108145. [Google Scholar] [CrossRef]
- Jain, B.; Jain, R.; Jha, R.R.; Bajaj, A.; Sharma, S. A green analytical approach based on smartphone digital image colorimetry for aspirin and salicylic acid analysis. Green Anal. Chem. 2022, 3, 100033. [Google Scholar] [CrossRef]
- Jain, R.; Jain, B.; Kabir, A.; Bajaj, A.; Ch, R.; Sharma, S. Fabric phase sorptive extraction-gas chromatography-mass spectrometry for the determination of favipiravir in biological and forensic samples. Adv. Sample Prep. 2023, 6, 100058. [Google Scholar] [CrossRef]
- Locatelli, M.; Covone, S.; Rosato, E.; Bonelli, M.; Savini, F.; Furton, K.G.; Gazioglu, I.; D’Ovidio, C.; Kabir, A.; Tartaglia, A. Analysis of seven selected antidepressant drugs in post–mortem samples using fabric phase sorptive extraction followed by high performance liquid chromatography-photodiode array detection. Forensic Chem. 2022, 31, 100460. [Google Scholar] [CrossRef]
- Guidance for Industry: Bioanalytical Method Validation; US Department of Health and Human Services, Food and Drug Administration, Center for Drug Evaluation and Research (CDER), Center for Biologics Evaluation and Research (CBER): Rockville, MD, USA, 2001.
- Melo, P.; Lourdes Bastos, M.; Teixeira, H.M. Benzodiazepine stability in postmortem samples stored at different temperatures. J. Anal. Toxicol. 2012, 36, 52–60. [Google Scholar] [CrossRef] [PubMed]


| Sample | LOD | LOQ | R2 | Linearity | Calibration Curve | Precision (%RSD) | |||||
|---|---|---|---|---|---|---|---|---|---|---|---|
| Intra-Day | Inter-Days | ||||||||||
| 0.5 | 5 | 10 | 0.5 | 5 | 10 | ||||||
| Tea a | 0.05 | 0.016 | 0.998 | 0.2–10 | y = (12,733 ± 191.9) × − (1673.6 ± 1024.1) | 3.12 | 2.37 | 1.28 | 8.9 | 8.78 | 6.5 |
| Biscuit b | 0.054 | 0.018 | 0.996 | 0.2–10 | y = (10,283 ± 258) × + (1703.6 ± 1376.6) | 4.44 | 3.5 | 2.59 | 9.5 | 8.1 | 7.3 |
| Matrix | RR% | Accuracy | EF | ER (%) | ||||
|---|---|---|---|---|---|---|---|---|
| 0.5 | 5 | 10 | 0.5 | 5 | 10 | |||
| Tea a | 91.1 | 88.4 | 86 | 108.1 | 96.2 | 100.1 | 46 | 95.8 |
| Biscuit b | 89.6 | 81.5 | 72.6 | 72.9 | 99.0 | 95.9 | 41 | 83.2 |
| Analyte(s) | Sample Matrix | Sample Preparation Method | Analytical Technique | Sensitivity | Recovery (%) | Ref. | |
|---|---|---|---|---|---|---|---|
| LOD | LOQ | ||||||
| Flunitrazepam, clonazepam, alprazolam, diazepam and ketamine | Alcoholic and non-alcoholic beverages | LLE with CF: IPA (1 mL) | GC–MS | 1.3–34.2 µg·mL−1 | 3.9–103.8 µg·mL−1 | 73–112.6 | [10] |
| Diazepam, alprazolam, bromazepam, clonazepam and cloxazolam | Alcoholic beverages | LLE with ACN (5 mL) | PS–MS | 0.05 µg·mL−1 of diazepam | - | 90–100 | [11] |
| Diazepam | Cream biscuit | LLE with EtOH (50 mL) | HPLC | 0.6 µg·mL−1 | 1.75 µg·mL−1 | 95 | [12] |
| Ketamine, flunitrazepam, and diazepam | Alcoholic and non-alcoholic beverages | MAE at 50 °C for 15 min with EA (3 mL) | LC–TOF–MS | 25–100 ng·mL−1 | - | - | [13] |
| Chlordiazepoxide, flurazepam, bromazepam, oxazepam, lorazepam, clobazam, clonazepam, and flunitrazepam | Non-alcoholic and light alcoholic beverages | UA-DLLME with 0.2 mL of DCM and 0.3 mL of ACN | HPLC–UV | 0.86–1.75 µg·mL−1 | 2.88– 5.83 µg·mL−1 | 14.30–103.28 | [14] |
| Diazepam, chlordiazepoxide, clobazam, flunitrazepam, bromazepam, flurazepam, nitrazepam and clonazepam | Milk-based alcoholic beverages | QuEChERS with 10 mL of ACN | GC–MS | 0.02–0.1 µg·mL−1 | 0.1–0.5 µg·mL−1 | 8.89–66.24 | [15] |
| Chlordiazepoxide; lorazepam; diazepam; oxazepam; medazepam | Alcoholic beverages | MEPS with 0.2 mL of ACN | HPLC–UV | 0.5–1 µg·mL−1 | 1–2 µg·mL−1 | 60.5–90.6 | [16] |
| Lorazepam | Cream biscuit and tea | CPSE with 2 mL of MeOH | GC–MS | 0.054 µg·g−1 and 0.05 µg·mL−1 | 0.18 µg·g−1 and 0.16 µg·mL−1 | 72.6–91.1% (RR%) and 72.9–108.1% (Accuracy) | Present Work |
| Methods | ECO-SCALE | GAPI | Reference | |
|---|---|---|---|---|
| LLE–GC–MS | Reagents | Penalty Points |  | [10] |
| CF | 6 | |||
| ISA | 4 | |||
| Instrument | ||||
| Energy used | 2 | |||
| Waste | 3 | |||
| Total | 12 | |||
| Score | 85 | |||
| LLE–PS–MS | Reagents | Penalty Points |  | [11] |
| ACN | 4 | |||
| Instrument | ||||
| Energy used | 2 | |||
| Waste | 3 | |||
| Total | 9 | |||
| Score | 91 | |||
| LLE–HPLC | Reagents | Penalty Points |  | [12] |
| EtOH | 8 | |||
| Instrument | ||||
| Energy used | 1 | |||
| Waste | 3 | |||
| Total | 12 | |||
| Score | 88 | |||
| LC-MS/MS | Reagents | Penalty Points |  | [13] |
| MeOH | 6 | |||
| ACN | 4 | |||
| Instrument | ||||
| Energy used | 2 | |||
| Occupational hazard | 3 | |||
| Waste | 3 | |||
| Treatment | 3 | |||
| Total | 15 | |||
| Score | 79 | |||
| UA–DLLME–HPLC–UV | Reagents | Penalty Points |  | [14] |
| ACN | 4 | |||
| DCM | 4 | |||
| Instrument | ||||
| Energy used | 1 | |||
| Waste | 3 | |||
| Total | 12 | |||
| Score | 88 | |||
| QuEchERS–GC–MS | Reagents | Penalty Points |  | [15] |
| ACN | 8 | |||
| Instrument | ||||
| Energy used | 2 | |||
| Total | 10 | |||
| Score | 90 | |||
| MEPS–HPLC–UV | Reagents | Penalty Points |  | [16] |
| ACN | 4 | |||
| Instrument | ||||
| Energy used | 1 | |||
| Waste | 3 | |||
| Treatment | 2 | |||
| Total | 10 | |||
| Score | 90 | |||
| CPSE–GC–MS | Reagents | Penalty Points |  | Present study |
| MeOH | 6 | |||
| Instrument | ||||
| Energy used | 2 | |||
| Total | 8 | |||
| Score | 92 | |||
Disclaimer/Publisher’s Note: The statements, opinions and data contained in all publications are solely those of the individual author(s) and contributor(s) and not of MDPI and/or the editor(s). MDPI and/or the editor(s) disclaim responsibility for any injury to people or property resulting from any ideas, methods, instructions or products referred to in the content. |
© 2023 by the authors. Licensee MDPI, Basel, Switzerland. This article is an open access article distributed under the terms and conditions of the Creative Commons Attribution (CC BY) license (https://creativecommons.org/licenses/by/4.0/).
Share and Cite
Jain, B.; Jain, R.; Kabir, A.; Ghosh, A.; Zughaibi, T.; Chauhan, V.; Koundal, S.; Sharma, S. Cellulose Paper Sorptive Extraction (CPSE) Combined with Gas Chromatography–Mass Spectrometry (GC–MS) for Facile Determination of Lorazepam Residues in Food Samples Involved in Drug Facilitated Crimes. Separations 2023, 10, 281. https://doi.org/10.3390/separations10050281
Jain B, Jain R, Kabir A, Ghosh A, Zughaibi T, Chauhan V, Koundal S, Sharma S. Cellulose Paper Sorptive Extraction (CPSE) Combined with Gas Chromatography–Mass Spectrometry (GC–MS) for Facile Determination of Lorazepam Residues in Food Samples Involved in Drug Facilitated Crimes. Separations. 2023; 10(5):281. https://doi.org/10.3390/separations10050281
Chicago/Turabian StyleJain, Bharti, Rajeev Jain, Abuzar Kabir, Abhishek Ghosh, Torki Zughaibi, Vimukti Chauhan, Sonali Koundal, and Shweta Sharma. 2023. "Cellulose Paper Sorptive Extraction (CPSE) Combined with Gas Chromatography–Mass Spectrometry (GC–MS) for Facile Determination of Lorazepam Residues in Food Samples Involved in Drug Facilitated Crimes" Separations 10, no. 5: 281. https://doi.org/10.3390/separations10050281