
Programmable Low-Pressure Chromatographic Sub-90 s Assay of Parabens in Cosmetics with Post-Column Chemiluminescence Detection


Department of Chemistry, National and Kapodistrian University of Athens, 157 71 Athens, Greece
*
Author to whom correspondence should be addressed.
Separations 2023, 10(6), 350; https://doi.org/10.3390/separations10060350
Submission received: 18 May 2023
/
Revised: 7 June 2023
/
Accepted: 9 June 2023
/
Published: 11 June 2023
(This article belongs to the Collection Recent Trends in the Separation of Natural Products and Pharmaceuticals)
Abstract
:This work describes a new programmable low-pressure chromatography method with post-column chemiluminescence (CL) detection for the rapid and cost-effective determination of four parabens in cosmetic products. Elution of the target analytes was achieved using a programmable mobile phase prepared by implementing a linear solvent gradient protocol based on appropriate flow rate modulation of 2 MilliGAT pumps. A 5 mm monolithic C18 column was used to separate the parabens. Post-column reaction of the eluted parabens with an acidic Ce(IV)-rhodamine 6G (Rho 6G) medium was carried out by introducing a flow stream of the reactants into the column eluate. The light generated from the CL reaction was detected with a flow-through CL detector fabricated in-house. The whole sequence of operations (including sample injection, generation of the mobile phase, addition of the post-column reaction reagents and signal acquisition) was under full computer control. Various operational parameters (the mobile phase composition and gradient conditions, the CL reagents’ concentrations and flow rates and the length of the reaction coil) were studied. The method was validated and applied to the analysis of various cosmetic products. The proposed approach allows sub-90 s separation of the four parabens and their determination with a limit of quantification of 0.2 μg L−1 with a sample throughput of 24 samples h−1. In addition, the method is economical, makes use of low-cost low-pressure components, is fully automated and produces a low amount of waste.
1. Introduction
Parabens are esters of p-hydroxybenzoic acid, which are extensively used as preservative agents in cosmetic, pharmaceutical, and food products. Parabens exhibit chemical stability in a wide pH range (from acidic and to weakly alkaline conditions), are biodegradable, are easy and inexpensive to produce, are colorless, odorless and tasteless and exhibit a broad-spectrum antimould and antimicrobial activity [1,2,3,4,5,6]. The preservative activity and the hydrophobicity of parabens increases as the alkyl chain length increases. The most commonly used parabens are the methyl, ethyl, propyl and butyl parabens (MeP, EtP, PrP, BuP, respectively) [1,2,3,4,5,6]. Parabens are one of the most widely classes of additives in the cosmetic and pharmaceutical industry. The use of parabens peaked around the middle of the 2000s and has decreased since, which is attributed to stricter regulatory guidelines.
Although early risk assessment studies conducted before 2000 indicated that parabens were safe for human use, later research suggested that parabens have shown harmful effects on human health. Thus, they may affect the endocrine system, be involved in gestational diabetes mellitus and can lead to the development or the proliferation of cancer [1,2,3,4,5,6]. Moreover, parabens resulting from the disposable of cosmetics pollute the environment, in turn affecting human health [1,2,5].
Most countries have approved the use of parabens as preservatives in cosmetics; however, there is a current marketing trend toward “paraben-free” cosmetic products and some countries have regulated their use. In the European Union (EU), the maximum limits of parabens in cosmetics are set in the Regulations (EC) no. 358/2014 and (EC) no. 1004/2014 [7,8]. These specify that iso-PrP, iso-BuP, phenylparaben (PhP), benzylparaben (BzP) and pentylparaben (PeP) are prohibited. The maximum limits for the other parabens are 0.14% for BuP or PrP, 0.4% for MeP or EtP and 0.8% for mixtures of these four compounds, but the sum of the individual concentrations of BuP and PrP cannot exceed 0.14%, while the use of BuP and PrP is prohibited in leave-on products intended for the nappy area of young children below the age of three. In the United States, the use of parabens in cosmetics is unrestricted but the Cosmetic Ingredient Review Organization has recommended adopting the same levels as the EU [9]. Some international certification agencies as ECORCERT (France), BDIH (Germany), NaTrue (Belgium), Soil Association (United Kingdom), ICEA (Italy) and BIOCOSC (Switzerland) do not certify products containing parabens, while the Professional Association for Natural, Ecological and Organic cosmetics (CosmeBio) has banned the use of parabens in cosmetics since 2002 [10].
Different methodologies, mainly based on liquid chromatography, have been proposed for the separation and the determination of parabens in cosmetics [11,12,13]. Over the last few years, low-pressure separation approaches have been developed and applied to the separation and determination of many organic compounds [14,15,16,17]. Low-pressure techniques utilize simpler and less expensive components (pumps, valves) than the high-pressure ones necessary for HPLC. In addition, these same components can be combined in different modular constructions offering flexibility in the design of the desired experimental configuration. The development of these approaches was accelerated by advances in the field of short, monolithic separation columns that are compatible with low-pressure separation manifolds [18,19,20].
Low pressure flow methodologies have been used for the separation and determination of the four common parabens with monolithic C18 columns and UV detection. The simpler methods rely on isocratic elution with a mobile phase consisting of a single solvent. However, since the four parabens normally used in cosmetics differ in polarity (from the highly polar MeP to the more hydrophobic BuP), separation under isocratic conditions is time-consuming and not efficient; therefore, it has been limited to the assay of the more polar parabens [21,22]. A more efficient approach to modulate the elution force of the mobile phase is based on the sequential use of two or more solvents of decreasing polarity [23,24,25]. However, such brute step-gradient protocols for the simultaneous determination of parabens with UV detection lead to baseline changes that manifest as “ghost” peaks. These problems have been attributed to the Schlieren effect caused by large changes in solvent absorption as the concentration profile of the different solvents undergo abrupt changes along the separation column [25,26]. The most efficient and versatile approach for the low-pressure separation of parabens was introduced by our group and involves a mobile phase of continuously changing composition prepared by the appropriate flow rate modulation of two computer-controlled pumps that deliver two solvents of different polarities [27] based on previous work by Aldock et al. [28]. However, the solvent gradient profile is still limited by the aforementioned Schlieren effect so that the separation requires more than 4 min, which is inconvenient for the purpose of rapid assays. The baseline problem has been addressed by applying post-column CL detection of parabens using the CL reaction of acidic Ce(IV)-rhodamine 6G (Rho 6G) with parabens [29,30]. This CL reaction is based on the acidic hydrolysis of parabens to form p-hydroxybenzoic acid that reduces Ce(IV), causing excitation ofRho 6G, which returns to its ground date by light emission. This mode of detection has been utilized for parabens detection using low-pressure chromatography with step-gradient elution, but these assays are slow, typically requiring several minutes to complete [29,30].
In this work, we propose a new methodology that combines linear gradient elution for the separation of parabens and post-column CL detection. Unlike the existing step-gradient CL methods [29,30], the new methodology allows the stepless judicious optimization of the mobile phase composition, thus achieving sub-90 s assay of the four parabens without compromising the separation efficiency. Moreover, the new method is “greener” and more cost-effective, as the faster separation requires less solvents and generates less waste while the limits of detection and quantification are improved considerably, compared to UV detection.
2. Materials and Methods
2.1. Chemicals and Reagents
All the chemicals were of analytical grade and were purchased from Merck (unless stated otherwise). HPLC-grade water was used throughout. HPLC-grade MeOH was purchased from Chem-Lab (Zedelgem, Belgium). Parabens (United States Pharmacopeia reference standards) were used for the preparation of the paraben standard solutions. The Ce(IV) solution was prepared by dissolving ammonium cerium(IV) sulfate dehydrate in H2SO4.
2.2. Instrumentation
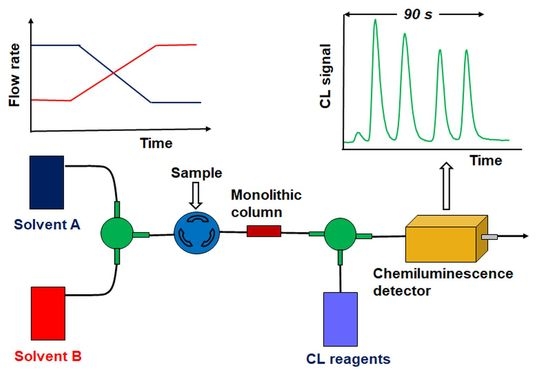
A schematic diagram of the low-pressure chromatography setup is shown in Figure 1. It comprises 2 MilliGAT LF pumps (MG1 and MG2) (Global FIA) for delivery of the 2 solvents, a Minipuls3 pump (PP1) (Gilson) for sample loading, a Minipuls3 pump (PP2) (Gilson) for post-column delivery of the CL reagents, a Cheminert Model C12 six-port sample injector (IV) (VICI Valco) equipped with 40 μL loop for sample injection, a Chromolith RP-18e 5 mm × 4.6 mm monolithic separation column (MC) (Merck), a 3-way mixer (M1) and a 4-way mixer (M2) (Vici Jour), a mixing coil (MC) and a flow-through CL detector constructed in-house (CLD) (described in P1 and shown in Figure S1 of the Supplementary Materials). The peripherals are connected to a personal computer (PC), which performs control and data acquisition. The control of the manifold is described in P1 (Supplementary Materials), while the front panel of the control and data acquisition application developed in LabVIEW 2013 are illustrated in Figure S2 (Supplementary Materials). The flow tubing is Teflon (0.5 mm i.d.) and a pressure-sensitive release valve (PV) (activated at pressure >100 psi, Global FIA) was used to prevent accidental excessive backpressure in the manifold.
2.3. Experimental Procedure
2.3.1. Preparation of Standard Solutions and Sample Extraction
Stock standard solutions containing 1.0 × 10⁻² mol L−1 of each paraben were prepared by weighing the solid compounds and dissolving them in MeOH. From these, aqueous stock solutions containing 1.0 × 10⁻⁴ mol L−1 of each paraben were prepared by dilution with doubly distilled water. Working standard solutions containing 0.2–20 μmol L−1 of all the parabens at equal concentrations were prepared in solvent A. Before the analysis, the standard solutions were ultrasonicated for 5 min to remove dissolved gas. Extraction of the samples and recovery experiments were carried out as described previously [27]; details of the procedures are provided in P2 (Supplementary Materials).
2.3.2. Experimental Sequence
The experimental sequence for the analysis involved the steps shown in Table 1; the numerical values are the finally selected ones. The sequence was fully computer-controlled and the total analysis time (including column equilibration and sample injection) was 150 s, allowing a sample throughput of 24 samples h−1. The details of the reference HPLC method are provided in P2 (Supplementary Materials).
3. Results and Discussion
3.1. Selection of the Chromatographic Conditions
For all the experiments, the flow rate of the mobile phase was set to 2.4 mL min−1 since this flow rate allows for a faster separation without causing excessive backpressure in the low-pressure manifold. Initial conditions for the CL detection were: [Ce(IV)], 5 mmol L−1; [H2SO4], 3.5 mol L−1; [Rho 6G], 2 mmol L−1; flow rate of the CL reagents, 2 mL min−1.
In this work, an elution protocol was applied in which a single rather polar solvent (solvent A) was used as a mobile phase in the first part of the chromatographic run in order to separate MeP and EtP, which are polar and elute early from the monolithic C18 column. As illustrated in Figure 2A, a solvent containing 20% MeOH allowed baseline separation between the MeP and EtP peaks and was selected as solvent A. A less polar solvent containing 24% MeOH did not allow a satisfactory separation between the two peaks while a more polar solvent containing 16% MeOH resulted in longer retention times and unacceptably wide peaks for for MeP and PrP.
However, the 20% (v/v) MeOH solvent A was not appropriate for the elution of the MeP and PrP since it led to rather long retention times for PrP and BuP and the widening of their peaks. Therefore, after isocratic elution of MeP and PrP using solvent A, the mobile phase was gradually made less polar by changing its composition. For these experiments, the isocratic elution step was set to 50 s, i.e., directly after the complete elution of EtP. Then, a linear solvent gradient was implemented by a flow rate modulation of two pumps delivering solvent A and a less polar solvent B containing 36% (v/v) MeOH. The flow rate of the pump delivering solvent A decreased linearly, while the flow rate of the pump delivering solvent B increased simultaneously at the same rate so that the total flow rate of the mobile phase remained constant. The effect of the flow rate gradient (expressed as pump flow rate acceleration/deceleration in mL s−2) is illustrated in Figure 2B. When a step solvent change was used (i.e., step change from solvent A to solvent B), the resolution between the PrP and BuP peaks was not satisfactory. As the value of the flow rate gradient decreased, the resolution between the PrP and BuP peaks improved, but the analysis time also increased. A flow rate gradient of 3.6 mL s−2 was selected for further work since it provided satisfactory resolution between the PrP and BuP peaks and short analysis time.
As previously mentioned, the duration of the isocratic step with solvent A before applying the two-solvent gradient was initially set at 50 s (i.e., after the EtP had eluted). At this stage, the duration of the isocratic step was studied with the view to further speed up the analysis while maintaining favorable chromatographic conditions. As illustrated in Figure 2C, decreasing the isocratic elution step from 50 to 30 s (a time which corresponds to the valley between the MeP and EtP) resulted in a faster elution of the PrP and BuP peaks, which were still well-separated. Further reduction in the isocratic elution step to 20 s (i.e., directly before the MeP peak) caused a further reduction in the retention times of the PrP and BuP peaks, but made the separation of the MeP and EtP worse while the sensitivity of the BuP peak decreased. Finally, a 30 s- long isocratic step was selected as the best compromise between peak separation, sensitivity and analysis time.
Typical chromatograms of the four parabens using isocratic elution and linear gradient elution with the selected chromatographic conditions are shown in Figure 2D, illustrating the gains in analysis time and in sensitivity for the late-eluting peaks.
Comparative chromatograms of the four parabens with the same elution protocol and UV and CL detection are illustrated in Figure S3 (Supplementary Materials). While the CL detection leads to sharp and well-separated peaks for all the parabens, the UV detection results in the appearance of ghost peaks, distorted baseline and decrease in sensitivity for the PrP and BuP peaks. This effect has been observed before in conjunction with fast solvent gradients in both low-pressure chromatography and HPLC and is attributed to the sudden changes in solvent absorption as the profile of the mobile phase undergoes substantial composition gradients along the separation column [25,26]. Therefore, UV detection is not compatible with the fast elution gradient, which is used in the present work to provide the fast separation of the four parabens, and the advantage of CL detection is evident. Other important advantages of CL detection are the lower cost of the photomultiplier CL detector with respect to a UV–Vis spectrometer and the ability to tailor the detection sensitivity by varying the high-voltage supplied to the photomultiplier unit.
3.2. Selection of the Post-Colum CL Reaction Conditions
The different parameters for the post-column CL reaction were the composition of the H2SO4/Ce(IV) solution, the concentration of the Rho 6G solution, the flow rate of the CL reagents and the length of the reaction coil; a univariate approach was used to study their effect.
As illustrated in Figure 3A, the CL signal for all the parabens increases with increasing H2SO4 concentration in the H2SO4/Ce(IV) solution in the range studied (1–4 mol L−1); this trend is attributed to the fact that the hydrolysis of parabens, which is necessary for the CL reaction, is favored at strongly acidic conditions. Given the adequate sensitivity of detection, higher concentrations of H2SO4 were not tested to avoid possible chemical attack of the flow components and to reduce reagent consumption. The highest concentration of 4 mol L−1 H2SO4 was finally selected.
The Ce(IV) concentration in the H2SO4/Ce(IV) was studied in the range 0.2–50 mmol L−1 (Figure 3B). The response curve exhibited a maximum at 10 mmol L−1 of Ce(IV) and decreased at higher Ce(IV) concentrations. This decrease has been attributed to either a self-absorption of the light emitted by the colored Ce(IV) solution or to the fact that the reaction rate increases with Ce(IV) concentration so that the maximum CL intensity occurs before the solution reaches the detector [30]. However, at around the maximum value of the response curve (10 mmol L−1 of Ce(IV)), small variations in the Ce(IV) concentration would affect the robustness of the method and, therefore, 20 mmol L−1 Ce(IV) was selected.
The Rho 6G concentration was studied in the range 0.1–2 mmol L−1 (Figure 3C). Maximum CL signals were obtained at 0.2 mmol L−1 of Rho 6G and the signals decreased at a higher Rho 6G, which can be accounted for by the formation of nonfluorescent dimers of Rho 6G, which quench the radiation emitted [30]. An amount of 0.5 mmol L−1 of Rho 6G was selected, again with the view to improve the robustness of the method.
The effect of the flow rate of the CL reagents is illustrated in Figure 3D. The CL signals increased as the flow rate increased by up to 1.5 mL min−1 and then levelled off. This was probably due to the fact that, at lower flow rates, the CL reaction had decayed by the time the solution had reached the detector. A flow rate of 2 mL min−1 was selected.
The length of the reaction coil varied between 15 and 103 cm and the results are shown in Figure 3E. The highest CL signals were obtained with the shortest reaction coil, but the precision, especially for the PrP and BuP peaks, was low. A 45 cm long reaction coil was selected as the best compromise between detection sensitivity and good precision.
The final chemical and instrumental conditions used for the analysis are summarized in Table 2. The consumption of reagents for a complete chromatographic run is detailed in Table S1 (Supporting Materials), indicating that the method is economical in terms of consumables, which is mainly due to the short analysis time.
The chromatographic parameters of the paraben peaks are provided in Table 3.
3.3. Method Validation
Calibration curves of the four parabens were plotted as peak areas vs. concentration in the range 0.2–50 μmol L−1 for all the parabens. The slopes and intercepts obtained on three different days were subjected to a t-test, which indicated that they did not differ statistically at a confidence level of 95%. The calibration features are provided in Table 4 and typical chromatograms are illustrated in Figure S4 (Supplementary Materials).
The limit of detection (LOD) of the method for the four parabens was calculated as the concentration at which the peak height of the corresponding paraben was equal to 3.3 times the peak-to-peak noise of the baseline (signal-to-noise (S/N) ratio of 3.3). The practical LOQ was the concentration of the more dilute standard used for drawing the calibration curves (i.e., 0.2 μmol L−1 for all the parabens). The LODs and LOQs are summarized in Table 4. As shown in Table S2 (Supporting Materials), the LODs and LOQs are lower than those of the existing low-pressure separation methods for the assay of parabens, while the separation is faster than all the existing methods without compromising the chromatographic efficiency.
The instrumental repeatability, RSDr %, was expressed as the relative standard deviation of the peak areas of six successive chromatographic runs and ranged from 1.1 to 2.7% (Table 5).
The trueness and precision of the method were calculated through experiments conducted over four different days. The trueness was estimated by calculating the % recovery, R%, using the following equation:
where Csp is the concentration calculated in the spiked paraben-free sample from the calibration plot and Cst is the spiking concentration (10 μmol L−1). The mean recoveries over 4 days ranged from 88 to 102%, which are considered satisfactory given the simple and rapid pre-treatment approach used to extract the target analytes. The precision of the method (reproducibility), RSDR %, was expressed as the relative standard deviation of the recoveries at the four different days, which ranged from 5.5 to 8.7%. The results are summarized in Table 6.
R% = Csp/Cst × 100
The robustness of the method, in terms of peak areas, was studied by intentionally introducing small perturbations around the nominal values of some important experimental factors, as summarized in Table S3 (Supplementary Materials). A two-level Placket Burman experiment was designed, comprising nine experiments with an appropriate combination of factors, as illustrated in Table S4 (Supplementary Materials). The experiments were conducted by analyzing a standard containing 10 μmol L−1 of all the parabens and the response was recorded in triplicate. The intervals of each parameters within which the method is robust at the 95% confidence level were calculated as previously reported [31], and the results are provided in Table 7.
3.4. Application to Samples of Cosmetics
The present low-pressure chromatography method was applied to the rapid assay of parabens in liquid soap, face lotion and wet tissue samples. Representative chromatograms of liquid soap and wet tissue samples are illustrated in Figure 4. The results using the present low-pressure chromatography method and HPLC (as a reference method using a methodology adopted from [32]) are provided in Table 8. The % bias was calculated according to the equation:
where mlp and mHPLC are the contents calculated by the low pressure chromatography method and by HPLC, respectively. A statistical t-test demonstrated that the contents of parabens determined in the samples with the two methods were statistically not significantly different at the 95% confidence level.
% bias = (mlp − mHPLC)/mHPLC × 100
4. Conclusions
A new low-pressure chromatography method with CL detection has been developed, validated and applied to the analysis of cosmetics. The proposed method approach allows the sub-90 s separation of the four parabens and their determination with a limit of quantification of 0.2 μg L−1 with a sample throughput of 24 samples h−1; these figures are better than the existing low-pressure methods (Table S3, Supplementary Materials). In addition, the method is economical, makes use of low-cost low-pressure components, is fully automated and produces a low amount of waste and is fit-for-purpose, accurate and robust.
Supplementary Materials
The following supporting information can be downloaded at: https://www.mdpi.com/article/10.3390/separations10060350/s1, Paragraph P1: Control/data acquisition, chemiluminescence and UV detectors; Figure S1: Schematic diagram of the flow-through CL detector; Figure S2: User-interface of the control and data acquisition programs; Paragraph P2: Treatment of samples, recovery experiments, HPLC analysis; Figure S3: Chromatographs of the four parabens with: (A) CL detection and (B) UV detection using the elution protocol shown in Table 2 of the manuscript; Table S1: Consumption of reagents per chromatographic run; Figure S4: Chromatographs of the four parabens in the concentration range 0.2–20 μmol L−1; Table S2: Comparison of the existing low pressure separation methods with the present method for the determination of the four parabens; Table S3: Factors tested and the nominal values and perturbation values; Table S4: The combination of factors for the nine experiments conducted in the two-level Placket Burman experimental design.
Author Contributions
Conceptualization, A.E.; methodology, A.E. and M.B.; software, A.E.; validation, M.B.; investigation, M.B.; data curation, A.E. and M.B.; writing—original draft preparation, M.B.; writing—review and editing, A.E. All authors have read and agreed to the published version of the manuscript.
Funding
This research received no external funding.
Data Availability Statement
The data presented in this study are available in the article and the Supplementary Materials.
Conflicts of Interest
The authors declare no conflict of interest.
References
- Wei, F.; Mortimer, M.; Cheng, H.; Sang, N.; Guo, L.H. Parabens as chemicals of emerging concern in the environment and humans: A review. Sci. Total Environ. 2021, 778, 146150. [Google Scholar] [CrossRef] [PubMed]
- Matwiejczuk, N.; Galicka, A.; Brzóska, M.M. Review of the safety of application of cosmetic products containing parabens Journal of Applied Toxicology. J. Appl. Toxicol. 2020, 40, 176–210. [Google Scholar] [CrossRef]
- Mitra, P.; Chatterjee, S.; Paul, N.; Ghosh, S.; Das, M. An Overview of Endocrine Disrupting Chemical Paraben and Search for An Alternative—A Review. Proc. Zool. Soc. 2021, 74, 479–493. [Google Scholar] [CrossRef]
- Al-Halaseh, L.K.; Al-Adaile, S.; Mbaideen, A.; Abu Hajleh, M.N.; Al-Samydai, A.; Zakaraya, Z.Z.; Dayyih, W.A. Implication of parabens in cosmetics and cosmeceuticals: Advantages and limitations. J. Cosmet. Dermatol. 2022, 21, 3265–3271. [Google Scholar] [CrossRef] [PubMed]
- Lincho, J.; Martins, R.C.; Gomes, J. Paraben Compounds—Part I: An Overview of Their Characteristics, Detection, and Impacts. Appl. Sci. 2021, 11, 2307. [Google Scholar] [CrossRef]
- de Freitas Resende, D.; da Silva Alves, G.C.; Oliveira do Couto, R.; Sanches, C.; Drumond Chequer, F.M. Can parabens be added to cosmetics without posing a risk to human health? A systematic review of its toxic effects, Rev. Ciênc. Farm. Básica Apl. 2021, 42, e706. [Google Scholar] [CrossRef]
- Commission Regulation (EU) No 358/2014 of 9 April 2014 Amending Annexes II and V to Regulation (EC) No 1223/2009 of the European Parliament and on the Council on Cosmetic Products. EUR-Lex-32014R0358-EN-EUR-Lex. Available online: https://eur-lex.europa.eu/legal-content/EN/TXT/PDF/?uri=CELEX:32014R0358 (accessed on 16 May 2023).
- Commission Regulation (EU) No 1004/2014 of 18 September 2014 Amending Annex V to Regulation /EC) No 1223/2009 of the European Parliament and of the Council on Cosmetic Products. EUR-Lex-32014R1004-EN-EUR-Lex. Available online: https://eur-lex.europa.eu/legal-content/EN/TXT/?uri=CELEX%3A32014R1004 (accessed on 16 May 2023).
- Błędzka, D.; Gromadzińska, J. Wojciech Wąsowicz, Parabens. From environmental studies to human health. Environ. Int. 2014, 67, 27–42. [Google Scholar] [CrossRef] [PubMed]
- Francisco, A.; Fonseca, A.P. Parabens paradoxes in cosmetic formulations: A review. Int. J. Med. Res. Pharm. Sci. 2016, 8, 3. [Google Scholar] [CrossRef]
- Rudi, F. Review of analytical methods for determination of parabens in cosmetic products. Def. ST Tech. Bull. 2020, 13, 217–226. Available online: https://www.researchgate.net/profile/Mohd-Faris-Mohd-Rudi/publication/344638102_REVIEW_OF_ANALYTICAL_METHODS_FOR_DETERMINATION_OF_PARABENS_IN_COSMETIC_PRODUCTS/links/5f864f55299bf1b53e262269/REVIEW-OF-ANALYTICAL-METHODS-FOR-DETERMINATION-OF-PARABENS-IN-COSMETIC-PRODUCTS.pdf (accessed on 16 May 2023).
- Piao, C.; Chen, L.; Wang, Y. A review of the extraction and chromatographic determination methods for the analysis of parabens. J. Chromatogr. B 2014, 969, 139–148. [Google Scholar] [CrossRef]
- Ocaña-González, J.A.; Villar-Navarro, M.; Ramos-Payán, M.; Fernández-Torres, R.; Bello-López, M.A. New developments in the extraction and determination of parabens in cosmetics and environmental samples. A review. Anal. Chim. Acta 2015, 858, 1–15. [Google Scholar] [CrossRef] [PubMed]
- Fernández, M.; Forteza, R.; Cerdà, V. Monolithic columns in flow analysis: A review of SIC and MSC techniques. Instrum. Sci. Technol. 2012, 40, 90–99. [Google Scholar] [CrossRef]
- Idris, A.M. The second five years of sequential injection chromatography: Significant developments in the technology and methodologies. Crit. Rev. Anal. Chem. 2014, 44, 220–232. [Google Scholar] [CrossRef] [PubMed]
- Hartwell, S.K.; Kehling, A.; Lapanantnoppakhun, S.; Grudpan, K. Flow injection/sequential injection chromatography: A review of recent developments in low pressure with high performance chemical separation. Anal. Lett. 2013, 46, 1640–1671. [Google Scholar] [CrossRef]
- Economou, A. Advances in the Hyphenation of Flow Analysis Techniques with Liquid Separations for Pharmaceutical Analysis. Pharm. Anal. Acta 2012, 12, 615. [Google Scholar] [CrossRef] [Green Version]
- Ikegami, T.; Tanaka, N. Recent Progress in Monolithic Silica Columns for High-Speed and High-Selectivity Separations. Annu. Rev. Anal. Chem. 2016, 9, 317–342. [Google Scholar] [CrossRef]
- Svec, F.; Lv, Y. Advances and Recent Trends in the Field of Monolithic Columns for Chromatography. Anal. Chem. 2015, 87, 250–273. [Google Scholar] [CrossRef]
- Urban, J. Current trends in the development of porous polymer monoliths for the separation of small molecules. J. Sep. Sci. 2016, 39, 51–68. [Google Scholar] [CrossRef]
- Batista, A.D.; Rocha, F.R.P. On-column preconcentration in sequential injection chromatography: Application to determination of parabens. Anal. Methods 2015, 7, 4371–4375. [Google Scholar] [CrossRef]
- Kondylis, P.; Barbatsi, M.; Economou, A. Automated Flow Injection Chromatography for the Rapid Assay of Parabens in Hygiene Wipes. Anal. Lett. 2015, 49, 690–698. [Google Scholar] [CrossRef]
- García Jiménez, J.F.; Carmen Valencia, M.; Capitán-Vallvey, L.F. Parabens determination with a hybrid FIA/HPLC system with ultra-short monolithic column. J. Anal. Chem. 2010, 65, 188–194. [Google Scholar] [CrossRef]
- García-Jiménez, J.F.; Valencia, M.C.; Capitán-Vallvey, L.F. Simultaneous determination of antioxidants, preservatives and sweetener additives in food and cosmetics by flow injection analysis coupled to a monolithic column. Anal. Chim. Acta 2007, 594, 226–233. [Google Scholar] [CrossRef] [PubMed]
- Hartwell, K.S.; Kehling, A.; Lapanantnoppakhun, S. Low-Pressure Chromatographic Separation of p-Hydroxybenzoates Using Sequential Injection with Lab-on-Valve System and Miniature Monolithic Column. Chromatographia 2014, 77, 883–891. [Google Scholar] [CrossRef]
- Gritti, F.; Guiochon, G. Separations by gradient elution: Why are steep gradient profiles distorted and what is their impact on resolution in reversed-phase liquid chromatography. J. Chromatogr. A 2014, 1344, 66–75. [Google Scholar] [CrossRef]
- Barbatsi, M.; Koupparis, M.; Economou, A. A new flow-injection chromatography method exploiting linear-gradient elution for fast quantitative screening of parabens in cosmetics. Anal. Methods 2016, 8, 8337–8344. [Google Scholar] [CrossRef]
- Adcock, J.L.; Francis, P.S.; Agg, K.M.; Marshall, G.D.; Barnet, N.W. A hybrid FIA/HPLC system incorporating monolithic column chromatography. Anal. Chim. Acta. 2007, 600, 136–141. [Google Scholar] [CrossRef]
- Rodas, M.; Portugal, L.A.; Avivar, J.; Estela, J.M.; Cerdà, V. Parabens determination in cosmetic and personal care products exploiting a multi-syringe chromatographic (MSC) system and chemiluminescent detection. Talanta 2015, 143, 254–262. [Google Scholar] [CrossRef] [PubMed]
- Ballesta Claver, J.; Valencia, M.C.; Capitán-Vallvey, L.F. Analysis of parabens in cosmetics by low pressure liquid chromatography with monolithic column and chemiluminescent detection. Talanta 2009, 79, 499–506. [Google Scholar] [CrossRef]
- van der Heyden, Y.; Nijhuis, A.; Smeyers-Verbeke, J.; Vandeginste, B.G.M.; Massart, D.L. Guidance for robustness/ruggedness tests in method validation. J. Pharm. Biomed. Anal. 2001, 24, 723–753. [Google Scholar] [CrossRef]
- Separation of Paraben Preservatives by Reverse-Phase HPLC, Application Note, Agilent Technologies. Available online: https://www.google.com/url?sa=t&rct=j&q=&esrc=s&source=web&cd=&ved=2ahUKEwiT1ejN8K7_AhXLDd4KHVObAFEQFnoECAoQAQ&url=https%3A%2F%2Fwww.agilent.com%2FLibrary%2Fapplications%2F5989-3635EN.pdf&usg=AOvVaw3pLls0aOu9En1ZZDzWtAsi (accessed on 6 June 2023).
Figure 1.
Schematic diagram of the low-pressure chromatography manifold. MG1 and MG2, MilliGAT pumps; PP1 and PP2, peristaltic pumps; IV, six-port injection valve; M1 and M2, passive mixers; MC, monolithic separation column; CLD, CL detector; PV, pressure release valve; PC, personal computer; W, waste; S, sample. Thick lines represent flow lines. Dotted lines represent control/data acquisition lines.

Figure 2.
Chromatograms for the separation of the four parabens under different conditions. (A) isocratic elution with different concentrations of MeOH; (B) gradient elution with gradients of different steepness (20% (v/v) MeOH as solvent A, 36% (v/v) MeOH as solvent B, start of gradient at 50 s indicated by black arrow); (C) gradient elution with different starts of gradient (20% (v/v) MeOH as solvent A, 36% (v/v) MeOH as solvent B, gradient 3.6 mL min−2); (D) comparison between isocratic elution and gradient elution with the final conditions.

Figure 3.
Effect of (A) the H2SO4 concentration in the H2SO4/Ce(IV) solution, (B) the Ce(IV) concentration in the H2SO4/Ce(IV) solution, (C) the Rho 6G concentration, (D) the flow rate of the CL reagents, (E) the length of the reaction coil.
Figure 3.
Effect of (A) the H2SO4 concentration in the H2SO4/Ce(IV) solution, (B) the Ce(IV) concentration in the H2SO4/Ce(IV) solution, (C) the Rho 6G concentration, (D) the flow rate of the CL reagents, (E) the length of the reaction coil.

Figure 4.
Chromatograms of extracts of: (A) liquid soap, (B) wet tissues.


Table 1.
The experimental sequence for a complete chromatographic run.
| Step | Operation | Total Time (s) | Separation Time (s) a | PP1 d | PP2 e | MG1 (mL min−1) | MG2 (mL min−1) | Solvent A/Solvent B f (% v/v) | Position of IV | Data Acquisition |
|---|---|---|---|---|---|---|---|---|---|---|
| 1 | Column equilibration in solvent A | 0–30 | - | Off | Off | 2.4 | 0 | 100:0 | Inject | Off |
| 2 | Sample loading | 31–35 | - | On | Off | 2.4 | 0 | 100:0 | Load | Off |
| 3 | Isocratic elution with solvent A | 36–55 | 0–30 | Off | On | 2.4 | 0 | 100:0 | Inject | On |
| 4 | Gradient elution | 56–129 | 31–95 | Off | On | 2.4 → 0 b | 0 → 2.4 c | 100:0 → 0:100 | Inject | On |
| 5 | Isocratic column cleaning in solvent B | 130–150 | - | Off | Off | 0 | 2.4 | 0:100 | Inject | Off |
a Time from sample injection. b The linear flow rate gradient of solvent A was −3.6 mL min−2. c The linear flow gradient of solvent B was 3.6 mL min−2. d The flow rate of PP1 was 2.4 mL min−1. e The flow rate of PP2 was 2.0 mL min−1. f Solvent A, 20% (v/v) MeOH; solvent B, 36% (v/v) MeOH.
Table 2.
Selected values of the experimental parameters.
| Parameter (Units) | Value |
|---|---|
| Chromatographic conditions | |
| Sample volume (μL) | 40 |
| Flow rate of the mobile phase (mL min−1) | 2.4 |
| Duration of the isocratic step (s) | 30 |
| Gradient rate (mL min−2) | 3.6 |
| Solvent A | MeOH 20% (v/v) |
| Solvent B | MeOH 36% (v/v) |
| CL detection conditions | |
| Flow rate of the CL reagents (mL min−1) | 2 |
| [Ce(IV)] (mmol L−1) | 20 |
| [Rho 6G] (mmol L−1) | 0.5 |
| [H2SO4] (mol L−1) | 4 |
Table 3.
Chromatographic features of the four parabens.
| Parameter (Units) | MeP | EtP | PrP | BuP |
|---|---|---|---|---|
| Retention time, tR (s) | 20.7 | 38.4 | 65.7 | 81.3 |
| Asymmetry factor, As | 1.32 | 1.56 | 1.42 | 1.68 |
| Resolution, Rs | 1.8 | 2.0 | ||
| Number of theoretical plates, Ν | 85 | 211 | 1150 | 2094 |
| Theoretical plates per column length (N/m) | 17,000 | 42,200 | 230,000 | 418,800 |
Table 4.
Calibration features of the four parabens.
| MeP | EtP | PrP | BuP | |
|---|---|---|---|---|
| Linear range (μmol L−1) | 0.2–20 | 0.2–20 | 0.2–20 | 0.2–20 |
| Slope (±SD) | 60.9 ± 0.10 | 66.4 ± 0.09 | 46.7 ± 0.08 | 42.0 ± 0.07 |
| Intercept (±SD) | 10.5 ± 8.5 | 6.0 ± 7.8 | 3.5 ± 6.6 | 4.0 ± 6.4 |
| R2 | 0.999 | 0.999 | 0.999 | 0.998 |
| LOD (μmol L−1) | 0.05 | 0.05 | 0.06 | 0.06 |
| LOQ (μmol L−1) | 0.2 | 0.2 | 0.2 | 0.2 |
Table 5.
Instrumental repeatability.
| Concentration | RSDr (%) | |||
|---|---|---|---|---|
| MeP | EtP | PrP | BuP | |
| 1 μmol L−1 | 1.4 | 2.0 | 2.0 | 2.7 |
| 10 μmol L−1 | 1.1 | 2.4 | 2.3 | 2.7 |
Table 6.
Precision and trueness of the method.
| MeP | EtP | PrP | BuP | |
| Paraben-free wet tissues | ||||
| R% | 101 | 102 | 95 | 93 |
| RSDR % | 8.5 | 6.2 | 6.2 | 8.1 |
| Paraben-free liquid soap | ||||
| R% | 94 | 92 | 88 | 90 |
| RSDR % | 5.5 | 5.5 | 6.2 | 6.4 |
| Paraben-free face lotion | ||||
| R | 96 | 97 | 93 | 94 |
| RSDR % | 7.8 | 5.5 | 6.7 | 8.7 |
Table 7.
Intervals of the studied parameters within which the method is robust at the 95% confidence level (gray values represent cases whereby the intervals within which the method is robust is narrower than the perturbation interval).
Table 7.
Intervals of the studied parameters within which the method is robust at the 95% confidence level (gray values represent cases whereby the intervals within which the method is robust is narrower than the perturbation interval).
| Interval | ||||
|---|---|---|---|---|
| MeP | EtP | PrP | BuP | |
| Gradient rate (mL min−2) | [3.8, 3.4] | [3.8, 3.4] | [3.7, 3.5] | [3.7, 3.5] |
| MeOH (% v/v) in solvent A | [19, 21] | [19, 21] | [18,22] | [18, 22] |
| MeOH (% v/v) in solvent B | [33, 39] | [33, 39] | [33, 39] | [34, 38] |
| Isocratic elution time (s) | [28, 32] | [28, 32] | [28, 32] | [28, 32] |
| [Ce(IV)] (mmol L−1) | [18, 22] | [18, 22] | [18, 22] | [18, 22] |
| [Rho 6G] (mmol L−1) | [0.45, 0.55] | [0.45, 0.55] | [0.45, 0.55] | [0.45, 0.55] |
| H2SO4 (mol L−1) | [3.8–4.2] | [3.8–4.2] | [3.8–4.2] | [3.8–4.2] |
Table 8.
Results for the determination of parabens in different samples (results are the mean of three determinations).
Table 8.
Results for the determination of parabens in different samples (results are the mean of three determinations).
| MeP | EtP | PrP | BuP | |
|---|---|---|---|---|
| Wet tissues (% (w/w) | ||||
| Low pressure chromatography | 0.080 | 0.016 | 0.011 | 0.026 |
| HPLC | 0.088 | 0.017 | 0.010 | 0.024 |
| % bias | −9.1 | 5.9 | 10 | −8.3 |
| Liquid soap (% (w/w) ± SD) | ||||
| Low pressure chromatography | 0.11 | 0.020 | 0.014 | 0.025 |
| HPLC | 0.12 | 0.021 | 0.015 | 0.023 |
| % bias | 8.3 | 8.5 | 6.7 | −8.7 |
| Face lotion (% (w/w) ± SD) | ||||
| Low pressure chromatography | 0.092 | 0.023 | 0.0092 | 0.023 |
| HPLC | 0.086 | 0.021 | 0.0088 | 0.025 |
| % bias | −7.0 | −9.5 | −4.5 | 8.0 |
Disclaimer/Publisher’s Note: The statements, opinions and data contained in all publications are solely those of the individual author(s) and contributor(s) and not of MDPI and/or the editor(s). MDPI and/or the editor(s) disclaim responsibility for any injury to people or property resulting from any ideas, methods, instructions or products referred to in the content. |
© 2023 by the authors. Licensee MDPI, Basel, Switzerland. This article is an open access article distributed under the terms and conditions of the Creative Commons Attribution (CC BY) license (https://creativecommons.org/licenses/by/4.0/).
Share and Cite
MDPI and ACS Style
Barbatsi, M.; Economou, A. Programmable Low-Pressure Chromatographic Sub-90 s Assay of Parabens in Cosmetics with Post-Column Chemiluminescence Detection. Separations 2023, 10, 350. https://doi.org/10.3390/separations10060350
AMA Style
Barbatsi M, Economou A. Programmable Low-Pressure Chromatographic Sub-90 s Assay of Parabens in Cosmetics with Post-Column Chemiluminescence Detection. Separations. 2023; 10(6):350. https://doi.org/10.3390/separations10060350
Chicago/Turabian StyleBarbatsi, Margarita, and Anastasios Economou. 2023. "Programmable Low-Pressure Chromatographic Sub-90 s Assay of Parabens in Cosmetics with Post-Column Chemiluminescence Detection" Separations 10, no. 6: 350. https://doi.org/10.3390/separations10060350
Note that from the first issue of 2016, this journal uses article numbers instead of page numbers. See further details here.