Article

Selective Aqueous Extraction and Green Spectral Analysis of Furfural as an Aging Indicator in Power Transformer Insulating Fluid

1
Korea Electric Power Research Institute, Korea Electric Power Cooperation, Daejeon 34056, Republic of Korea
2
Biotechnology, Department of Chemistry, Lund University, SE-22100 Lund, Sweden
*
Authors to whom correspondence should be addressed.
Separations 2023, 10(7), 381; https://doi.org/10.3390/separations10070381
Submission received: 1 June 2023 / Revised: 22 June 2023 / Accepted: 26 June 2023 / Published: 28 June 2023
(This article belongs to the Collection State of the Art in Separation and Analysis of Energies)

Abstract

:
Furfural is an intermediary and aldehyde compound degraded from paper insulation, which is used with liquid fluid in power transformers. It can be utilized as an important indicator to evaluate the degradation degree of the paper insulation and the condition of transformers to predict their lifetime. However, the conventional methods are inevitably inconvenient as they require additional derivatization with hazardous agents and time-consuming chromatographic separation and processes. In this work, a facile and green analysis method for the determination of furfural concentration in the insulating fluid of operating power transformers was developed. As furfural was selectively extracted from the insulting fluid by deionized water, the aqueous solution could be directly subjected to a UV spectral analysis without any derivatization using hazardous agents or hindrance of the fluid in the UV spectrum. The results showed that the spectral method could obtain a favorable linear relationship between the concentration of furfural and its characteristic absorbance at 280 nm (λ max). The limit of detection (LOD) was below 0.1 ppm, which is a sufficient detection level to evaluate the condition of the insulating fluid. Furthermore, the method was compared with the conventional HPLC and colorimetric analyses, revealing satisfactory accuracy and verification of the results. It is possible to measure the furfural concentration in situ using a portable UV-spectrometer at a single wavelength, 280 nm, after simple extraction in the field. This approach offers a novel and green analytical method to quantitatively determine the aromatic furan compounds in a power transformer’s insulating fluid in place without the use of an organic extraction solvent or hazardous reagents for derivatization and analysis.

1. Introduction

The power transformer is one of the most important and essential components in a power system, and also requires one of the largest capital costs in electrical power transmission and distribution networks [1,2,3]. The maintenance of the consistency and efficiency of power transformers is very important to maintain the continuity of the power flow in networks and achieve desired revenue [1,2,3]. Since the insulation system suffers electrical, thermal, chemical, and mechanical stresses that damage it during the period of continuous operation [1,2,3], malfunctions often occur in the transformer insulating system. Electrical utilities in turn incur tremendous losses due to the switching-off operation of the transformer to repair its faults [3,4,5,6]. Therefore, the monitoring, inspection, and periodic maintenance of a transformer are crucial in ensuring a prolonged lifespan of the equipment, and are required in order to avoid the undesired outages of transformers from service caused by the insulation system, which consists of insulating oil and paper [1,2,3,4,5,6,7].
The insulation system (paper/oil) of transformers comprises liquid and solid insulation to cover the supportive structure such as the winding and inter-turns, and to separate different bodies from each other and from the core and tank [1,2]. The degradation of transformer insulation (oil and paper) is worsened at higher temperatures and in the presence of oxygen and moisture [7]. To detect and analyze the transformer’s condition and faults, electrical, physical, and chemical tests are performed to identify the state of the insulating paper, which can be based on the degree of polymerization (DP) of the insulating paper samples [7]. However, the measurement of actual insulating paper samples from a transformer is impractical because it is difficult to take out the insulation paper without shutting down the transformer from its service [1,7].
Therefore, estimating the DP of the paper can be accomplished by possible testing parameters relevant to the DP of the insulating paper, such as dissolved gases (DGA), breakdown voltage (BDV), oil interfacial tension (IF), oil acidity (ACI), moisture content (MC), oil color (OC), dielectric loss (Tan δ), and furan concentration (2-furfuraldhyde (FA)) [7,8]. Cellulose (paper) insulation aging is a permanent breaking of hydrogen and covalent bonds between cellulose polymer chains under the collective effects of moisture, oxygen, and heat during the continuous operation of transformers [2,9], and causes loss of mechanical strength and renders the paper breakable [2,10].
In this aging process by the degradation of the insulating paper, furanic compounds (or furans) such as 2-furfural, 5-methyl- 2-furfural, 2-furfuryl alcohol, 2-acetylfuran, and 5-hydroxymethyl-2-furfural are generated and impregnated with oil, as they are appreciably oil soluble, and thus furanic compounds provide information about paper destruction in the transformers (Scheme 1) [3,11]. Based on this aging process, therefore, measuring the furan compounds that dissolve in the insulating oil provides a prominent indicator to interpret the insulating paper degradation through measurement of the DP [7,12].
Furfural is generated mainly by the 1,2-enolisation pathway via 3-deoxyosone [13,14], while furan is predominantly formed through the 2,3-enolisation pathway in a glucose and serine model, where the degradation of hexoses, through direct enolization in the Maillard reaction, is the initial step [13,14]. Furfural analysis has been utilized as a useful tool for assessing the aging of the solid insulation of oil-immersed transformers because the furanic compounds found in transformers are solely formed by the degradation of the cellulosic insulation [1,2,3,15,16,17].
Currently, the determination of furan aldehydes is usually carried out by traditional chromatographic methods such as gas chromatography (GC), high performance liquid chromatography (HPLC) based on the International Electrotechnical Commission (IEC) 61198 standard [17,18], and spectrophotometric methods [13,16,19,20]. However, these methods are often hindered by matrix effects and insufficient selectivity, and typically require several analytical steps including extraction and derivatization before analysis [20]. The detection limits could be improved by using precolumn derivatization reactions with various compounds, e.g., dinitrophenylhidrazine (DNPH), which is the most popular derivatization reagent for the HPLC-UV analysis of aldehydes [19,20,21]. Although these methods have provided accurate and reproducible results, they have several drawbacks, such as a time-consuming sample preparation protocol and the use of expensive instrumentation, that limit their application [21]. The detection of furanic compounds from the UV–visible region up to the mid-infrared region [22,23,24] has highlighted the advantages and provided good correlations with the conventional methods, but the detection at the UV–visible region can be affected by the color intensity of the insulation oil [25] and the conducting materials in the insulation oil [26].
Colorimetric techniques have been developed to the degree that they are among the most common assays, and have gained high visibility with notable research and commercial interest in the last two decades because of their simple operation, use of portable devices, low cost, and convenient readout with the naked eye [19,27]. Generally, the colorimetric detection of aldehyde is based on a nucleophilic addition to a carbonyl group by an amine, such as aniline, DNPH, and 4-amino-3-hydrazino-5-mercapto-1,2,4-triazole (Purpald), in the formation of an imine, which gives a different UV–Vis absorption band [28,29]. However, these methods also require a time-consuming sample preparation protocol and the use of an additional colorimetric chemical, acid, or special functional polymer film [19,21], making in situ analysis difficult. Therefore, the conventional methods are inevitably inconvenient as they require additional derivatization with hazardous agents and time-consuming chromatographic separation and processes, thus limiting in situ analysis.
In this work, we report a simple spectral analysis method for furfural in a power transformer’s insulating fluid that consists of the selective liquid–liquid extraction of furfural from the fluid using deionized water and the direct measurement of absorbance at 280 nm by a UV–Vis spectrophotometer. The method was verified with an actual sample taken from a power transformer’s insulating fluid, showing a high correlation with results obtained by the conventional HPLC method and the aniline-acetate and UV spectral analysis method. The suggested approach thus provides in situ determination without the use of an organic extraction solvent or hazardous reagents for derivatization and analysis. The suggested approach thus provides a novel and green analytical method to quantitatively determine aromatic furan compounds in a power transformer’s insulating fluid in place without the use of an organic extraction solvent or hazardous reagents for derivatization and analysis.

2. Materials and Methods

2.1. Materials

Ultrapure water was obtained using a Milli-Q water purification system (Millipore, Burlington, MA, USA). Furfural (99%), 5-hydroxymethylfurfural (99%), levulinic acid (LA), methanol, acetonitrile, dimethyl sulfoxide, ethanol, deuterium oxide (D2O, 99.9 atom%), dimethyl sulfoxide-d6 (99.8 atom%), and chloroform-d (99.8 atom%) were obtained from Sigma-Aldrich (St. Louis, MO, USA). All chemicals were used without further treatment.

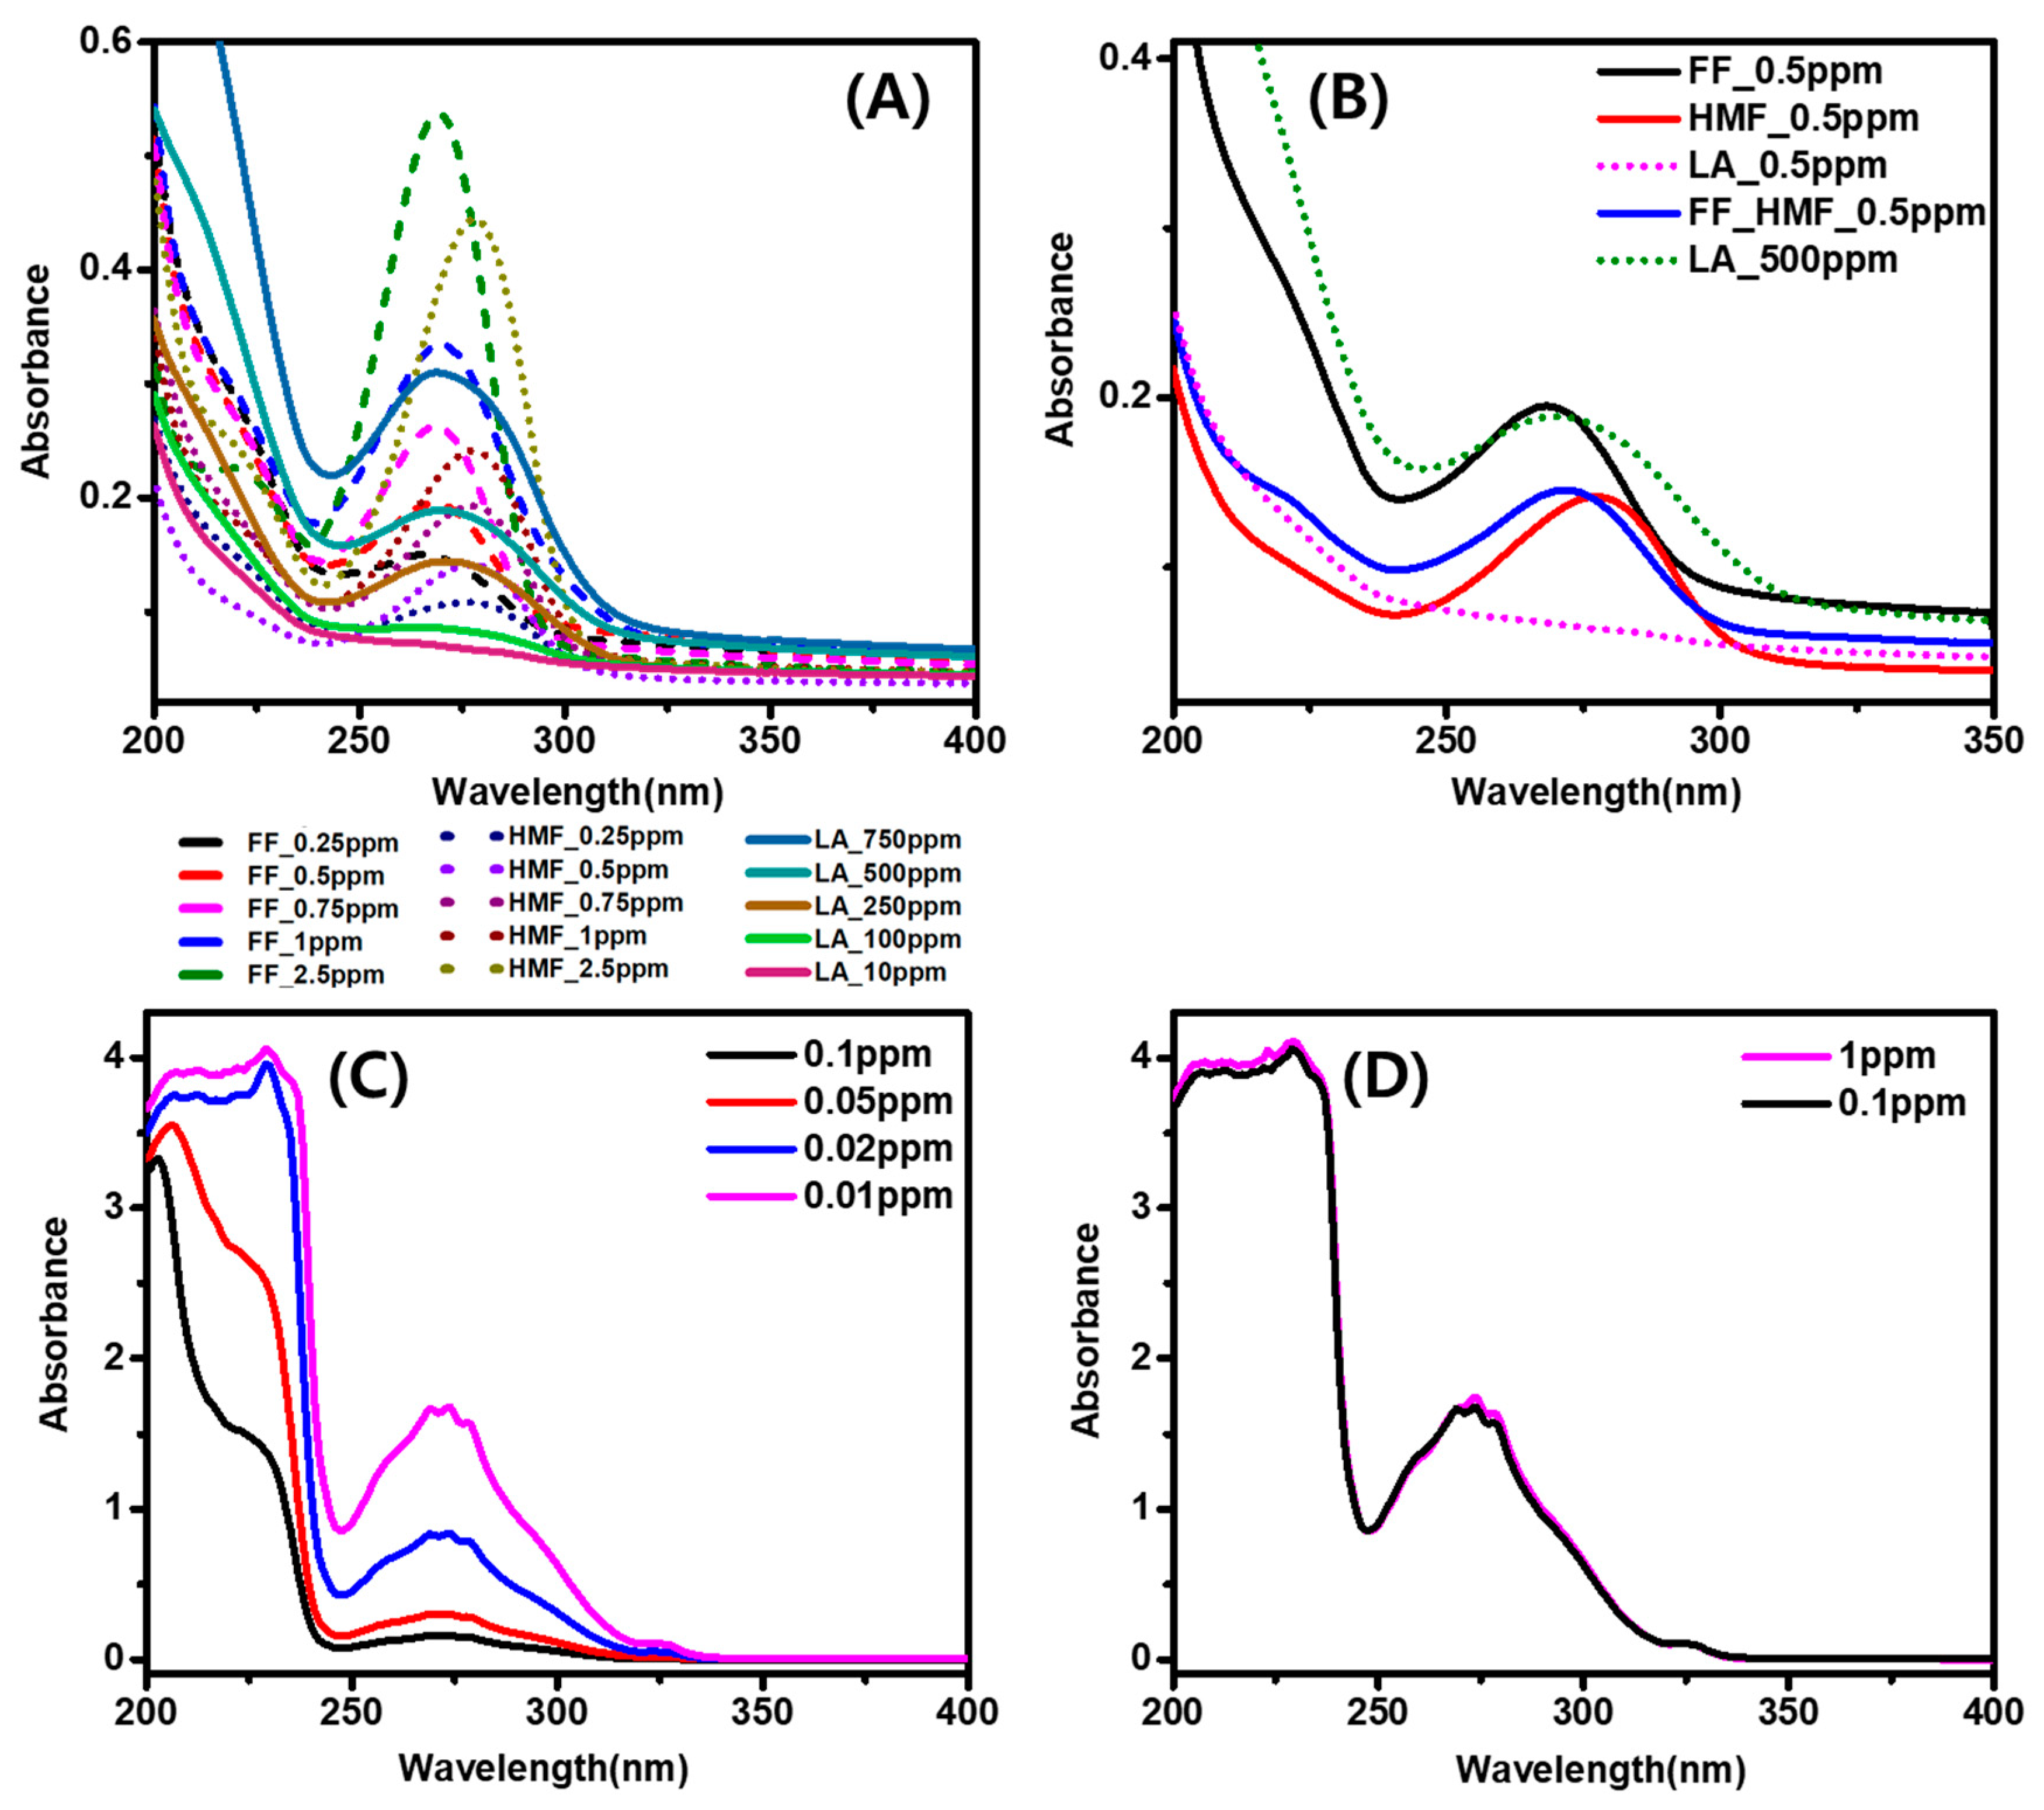
2.2. UV Absorption Features of Furfural, 5-Hydroxyfurfural (HMF), and Levulinic Acid (LA)

First, 0.25, 0.5, 0.75, 1, and 2.5 ppm furfural and HMF were respectively prepared in acetonitrile. In addition, 10, 100, 250, 500, and 450 ppm LA were prepared in acetonitrile. The diluted sample series of insulating fluid containing 1 ppm furfural was prepared using n-hexane as a hydrocarbon diluent. A UV–Vis spectrophotometer (UV-VIS-NIR, Perkin Elmer, Waltham, MA, USA, Lambada 1050) was used to obtain optical absorbance measured from 200 to 500 nm. A 10 mm optical path length of a UV quartz cell was used during the measurements, and deionized water or acetonitrile was used as a blank.

2.3. Preparation, Extraction, and Analysis of Furfural Standard Samples in Model Transformer Insulating Fluid

Furfural samples with concentrations of 100, 250, 500, and 1000 ppb were prepared in a transformer insulating fluid and used as standard samples. A 5 g fluid sample was placed into a 10 mL conical tube and 1 mL of solvent was added. Solvents of deionized water, ethanol, methanol, and DMSO were employed at certain ratios to fluid. After two phases were clearly formed, the bottom phase (polar phase) was extracted and used for analysis of the furfural concentration. Brief centrifugation at 10,000 rpm for 10 s can be optionally applied to reduce the phase separation time. A UV–Vis spectrophotometer (UV-VIS-NIR, Perkin Elmer, Lambada 1050) was used to obtain the optical absorbance measured from 200 to 500 nm. A 10 mm optical path length of a UV quartz cell was used during the measurements, and deionized water or acetonitrile was used as a blank.

2.4. Aqueous Extraction and Analysis of Furfural in Insulating Fluids Collected from Operating Power Transformers

Three different insulating fluids were collected from three currently operating power transformers. The same method as described above using a 2 g fluid sample placed into a 10 mL conical tube with 1 mL of deionized water was employed. The color and phase separation after the extraction in a 4 mL vial were compared. A UV–Vis spectrophotometer was used to obtain the optical absorbance measured from 200 to 500 nm. The selected values measured at 280 nm were collected to calculate the concentration of furfural.

2.5. Comparison and Validation of Developed Analysis Methods with (1) Conventional HPLC (ASTM), (2) Aqueous Extraction and HPLC, and (3) Aqueous Extraction and Aniline-Acetate Colorimetric Analysis

Three different insulating fluids collected from three currently running power transformers were used and compared with the above results.
(1) High-performance liquid chromatography (HPLC) analysis (ASTM D5387):
The three different insulating fluids were injected directly into the HPLC. The calibration curve was obtained from 10 ppb, 20 ppb, 100 ppb, and 1000 ppb furan standard solutions in 25% acetonitrile. An HPLC (WATERS, ACQUITY H Class) equipped with a C18 revers-phase column (2.1 × 100, 1.7 um ACQUITY UPLC BEH C18) and UV detector was used. The column was maintained in a column chamber at 40 °C, and the chromatogram was obtained by monitoring at 280 nm. The system was equilibrated using a mobile phase (25% acetonitrile and 75% in water) at a flow rate of 0.3 mL/min. After a 2 µL sample was injected, the mobile phase was kept (0–2 min), and other variables were gradually changed by the gradient program with 75% acetonitrile and 25% water, 100% water, and methylene chloride followed by cleaning and equilibrium steps [17].
(2) Aqueous extraction and high-performance liquid chromatography (HPLC) analysis
The same aqueous extracts obtained as described in the above section were used. The calibration curve was obtained in a range of 100–1000 ppb furfural using aqueous extracts obtained by extraction of 2 g furfural standard fluids using 1 mL of deionized water. The samples were analyzed by HPLC using the same method as delineated above.
(3) Aqueous extraction and aniline-acetate colorimetric analysis.
The same aqueous extracts obtained as described in the above section were used. The aniline-colorimetry assay was performed according to a modified method from a previous report [16]. The aniline-acetate solution was prepared by adding pure aniline to glacial acetic acid at a ratio of 1:9 (v/v). The fresh solution was then mixed and kept below 20 °C before being used. Subsequently, a 1 mL extract was added to a 1.5 mL aniline-acetate solution. Next, 2 mL of the mixed solution was measured by a UV–Vis spectrometer recorded at 200–700 nm (Agilent, Santa Clara, CA, USA, Cary 5000, UV-VIS-NIR-spectrometer). The calibration curve of furfural was obtained in a range of 100–1000 ppb using an extracted aqueous solution obtained from a 2 g furfural standard fluid using 1 mL of deionized water.
All the data were obtained from two independent experiments and analyses, and are provided as the average of the replicates with standard deviation.

3. Results

3.1. General Physical and UV Absorption Features of Furfural, 5-Hydroxyfurfural (HMF), and Levulinic Acid (LA)

Furfural, also named 2-furaldehyde or furfuraldehyde, has an aromatic odor reminiscent of almonds, and holds two functional groups, an aldehyde (C=O) and a conjugated system (C=C-C=C) [30]. With its unique functionality and attractive properties, it has been used as a sensitive indicator to evaluate the aging of power transformer insulating fluid, since it is produced from cellulose in the fluid in the transformer during operation [1,2,3,16,17]. Furfural is soluble in most organic solvents, such as benzene (570 ± 40 g/L), ethylacetate (1030 ± 70 g/L), acetone (810 ± 600 g/L), acetonitrile (910 ± 60 g/L), DMSO (820 ± 60 g/L), methanol (960 ± 70 g/L), and ethanol (990 ± 70 g/L), as well as in water (90 ± 10 g/L) at 25 °C [31]. Therefore, these solvents can be used for extraction of furfural from the transformer insulating fluid, and for diluting furfural in the sample preparation and analysis.
Meanwhile, the two functional groups of an aldehyde (C=O) and a conjugated system (C=C-C=C) in the aromatic furfural respond with very high intensity of absorption at 280 nm in UV–Vis spectroscopy, which enables highly sensitive analysis for a 0.1–1 ppm level of furfural concentration (Figure 1A,B). This contrasts with aliphatic LA, a product from cellulose degradation, which responds with relatively very low intensity at the same concentration, although it overlaps with the absorbance peak of furfural at around 270 nm. Notably, the absorbance of LA at about 1000 times higher concentration (500 ppm) was similar to that of furfural (0.5 ppm) at 270 nm and 280 nm, respectively. Therefore, the absorbance at 280 nm is mainly from aromatic furan compounds at the 0.1–1 ppm level, and can be used for the highly sensitive detection of furfural.
However, in general, furan is contained in a concentration of 0.1–1 ppm in the transformer insulating fluid, which is practically in operation and should be monitored. Therefore, the absorption peak of furfural at 280 nm is obscured by that of the fluid (Figure 1C,D).
The absorption profile of the model fluid sample containing 1 ppm furfural showed high intensity at 200–250 nm for C-C bonding of aliphatic chemicals, and an overlapped profile with aromatic furan at 250–325 nm for the series of dilutions using n-hexane (Figure 1C). In addition, there were no differences in the spectral profiles between 0.1 and 1.0 ppm furfural in the fluid, thus indicating that the absorption is mainly from the fluid (Figure 1D). Therefore, direct analysis of the furan concentration in the fluid by UV spectroscopy after dilution of the fluid is not practical.

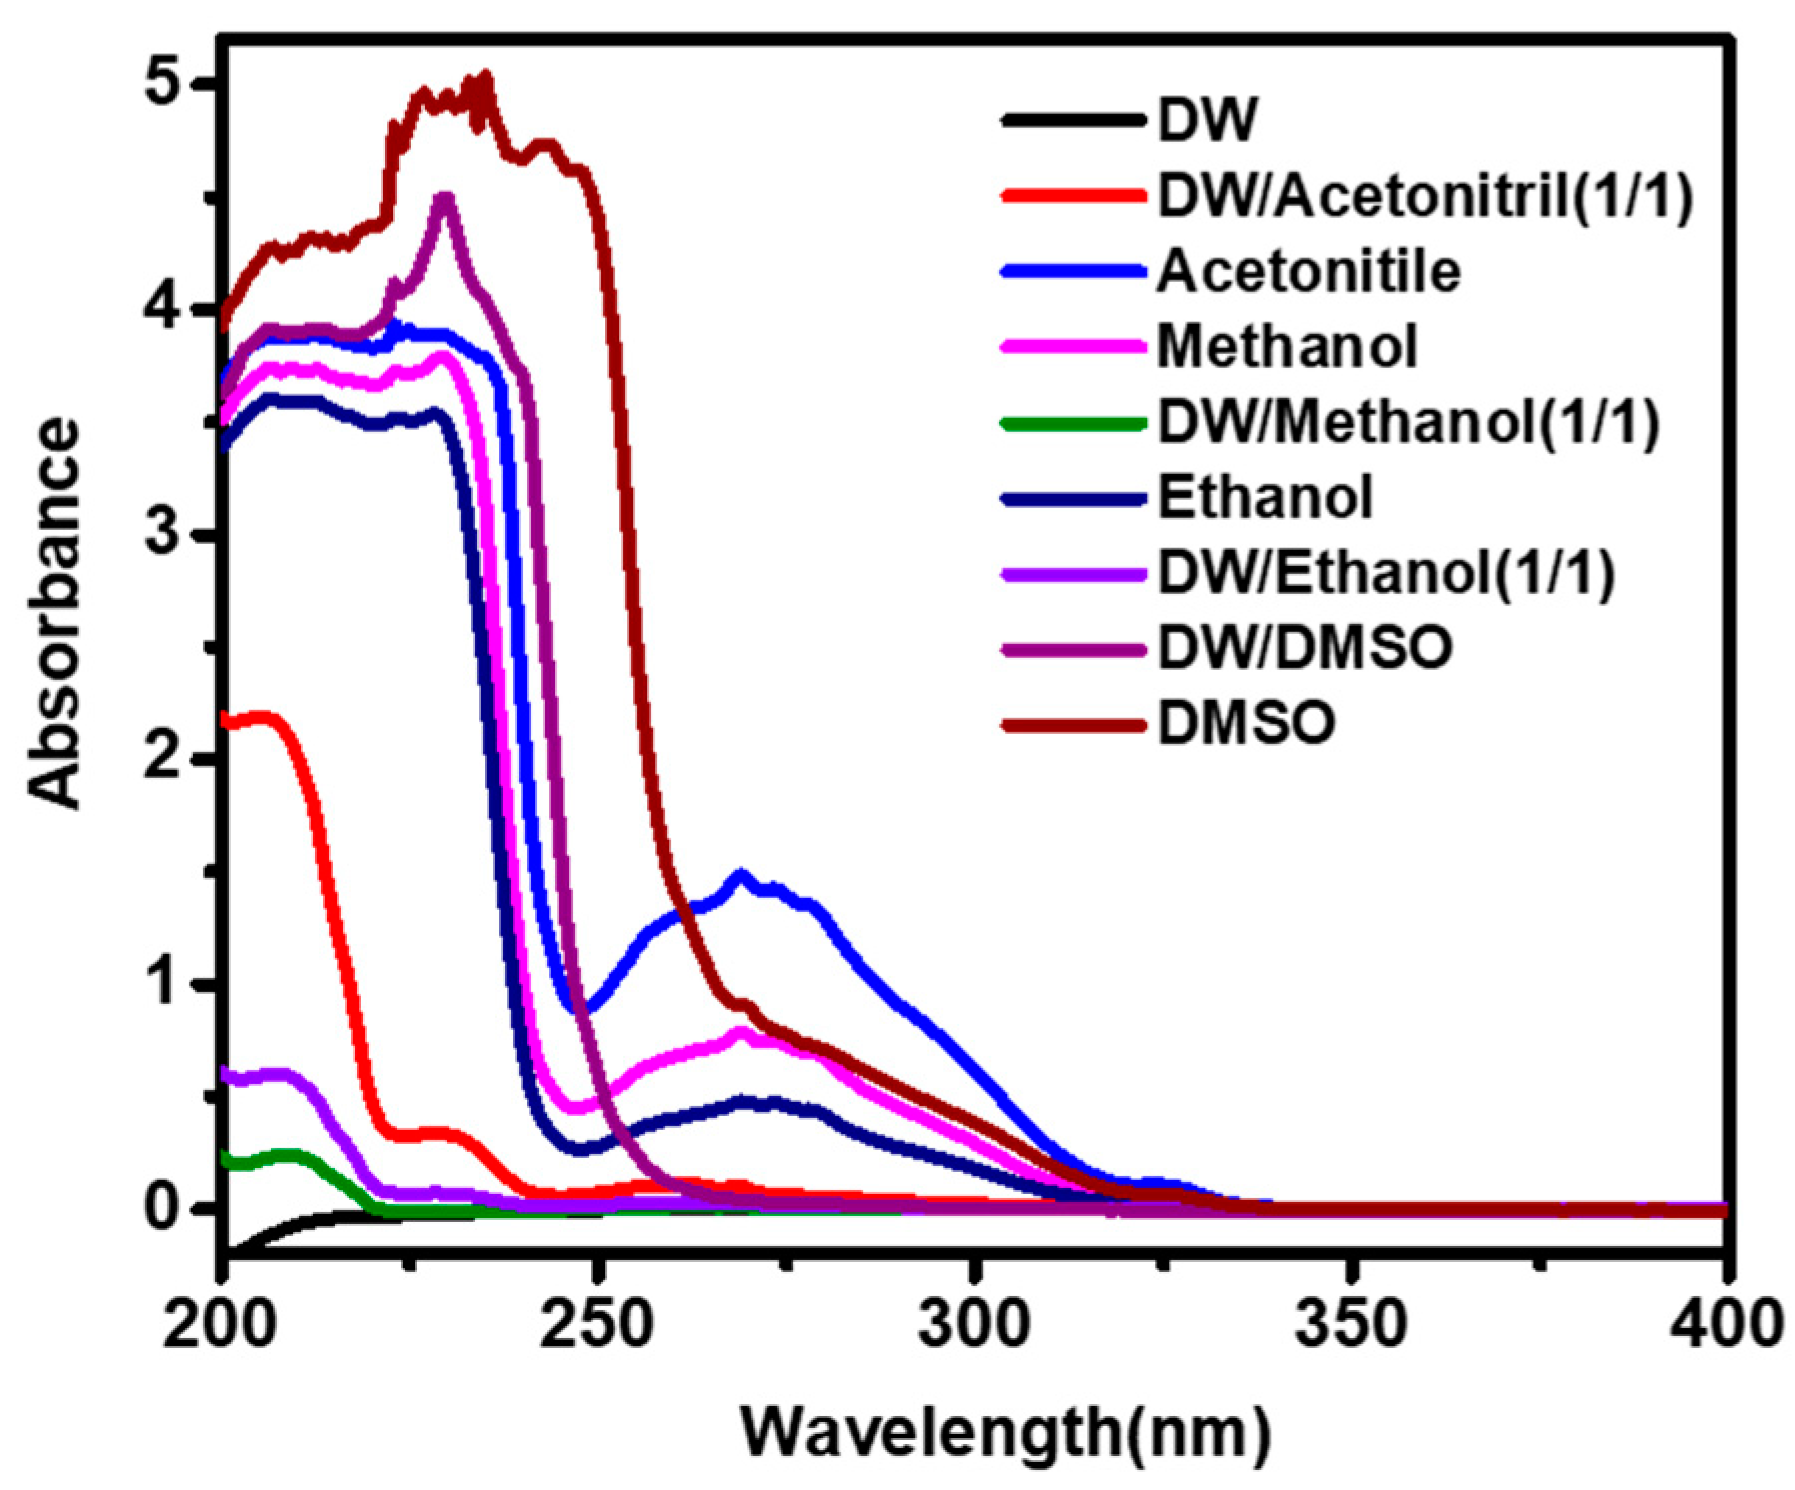
3.2. Effect and Selection of Solvent on the Extraction of Furfural from Transformer Insulating Fluid for UV–Vis Spectroscopy

In previous reports [16,17,32,33], generally, furfural in the insulating fluid was extracted by different solvents such as methanol, ethanol, and acetonitrile, followed by an instrumental analysis using HPLC and UV spectroscopy with or without derivatization of furfural. DNPH-derivatization has been used to increase the response of UV absorption in aldehyde detection and analysis, coupled with HPLC and GC [19,20,21]. The addition of 2,4-DNPH results in a condensation reaction between the aldehyde carbonyl group and 2,4-DNPH to form aldehyde-DNP-hydrazone. However, this necessitates chromatographical separation using HPLC or GC to prevent the effect of the remaining DNPH, and thus is not applicable for the quantification of aldehydes by UV spectroscopy. In addition, it requires a time-consuming sample preparation protocol and the use of expensive instrumentation that limit its application [21,22].
Therefore, selective extraction of furfural from the insulating fluid is desirable to avoid possible hindrance caused by the fluid matrix, and can allow direct and facile analysis of furfural without further derivatization and separation by UV spectroscopy. The extractions of furfural from the insulating fluid were performed using solvents of DMSO, acetonitrile, methanol, ethanol, and deionized water, respectively, followed by UV spectroscopy analysis (Figure 2). The model fluid sample of 1 ppm furfural was extracted at a ratio of 1.5 to 8.5 solvent under diluted conditions using excess amounts of solvent. The extracts obtained using DMSO, acetonitrile, methanol, and ethanol still contained significant amounts of fluid compound in the solution, while the solvent mixture with water contained a smaller amount. Interestingly, a slight absorption band in the water extract was observed at around 280 nm, which was a response from the furan compounds, and there was no response from the fluid matrix at 200–250 nm.
Although the solubility of furfural in water (90 ± 10 g/L, 90,000 ppm) is relatively lower than that in other organic solvents at 25 °C [31], it is sufficient to dissolve the furfural at a 0.1–1 ppm level, even with higher concentrations in the insulating fluid. Therefore, this was a promising indication for the selective aqueous extraction of furfural, and warranted further investigation to establish a new simple method.

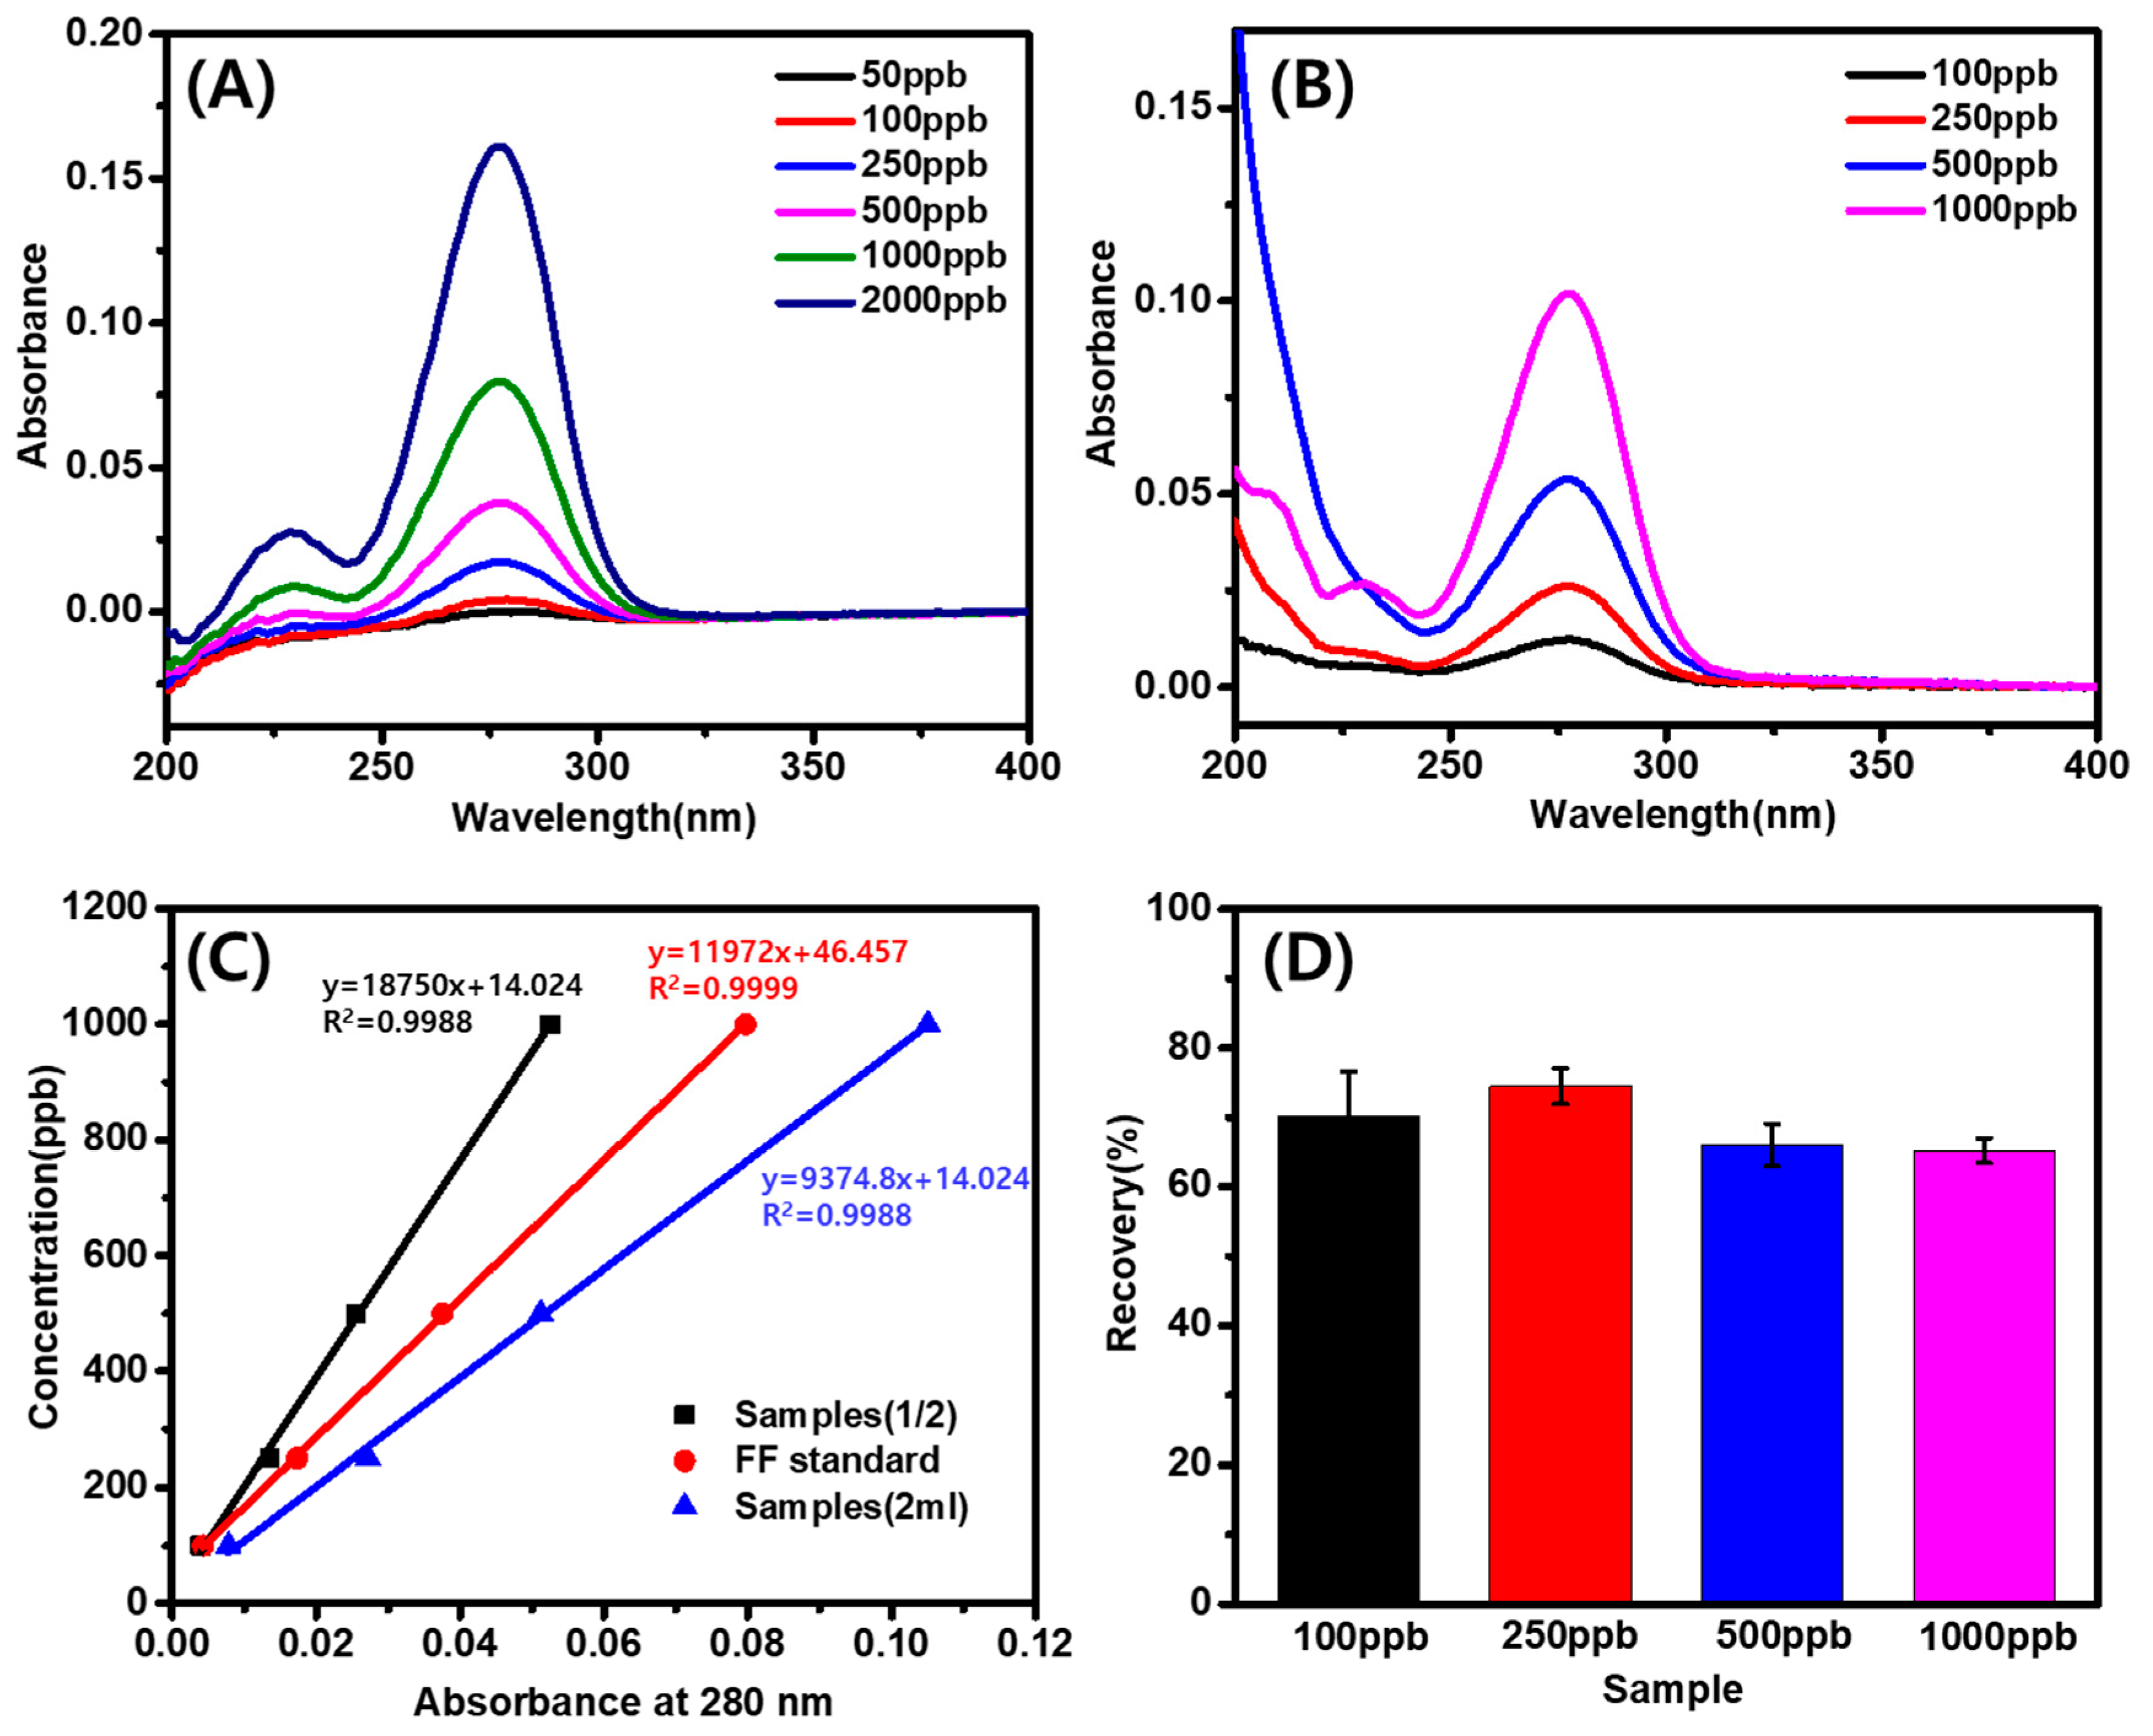
3.3. Recovery and Correlation of Furfural at Various Concentrations in Aqueous Extraction

The co-relationship between the analyte, furfural concentration, and absorbance at a given wavelength or λ max is one of the most important factors in the spectral analysis. The conjugated aromatic structure of an aldehyde (C=O) and a conjugated system (C=C-C=C) can strongly absorb UV light at 280 nm, and provides high sensitivity for furfural analysis by a UV-spectrometer [30]. A series of furfural concentrations at 50–2000 ppb in deionized water was prepared, and their UV absorbance was measured at 200–400 nm by a UV-spectrometer (Figure 3). Absorption bands for concentrations higher than 0.1 ppm furfural could be identified in the spectrum (Figure 3A) and high linearity (R2 = 0.9999) of the furfural concentration vs. absorbance at 280 nm was obtained (Figure 3C).
Therefore, based on the results from the furfural samples prepared in water, 100 ppb was empirically obtained as the limit of detection (LOD), also known as the minimum detectable value, within the effective linearity of the furfural concentration on UV spectral analysis. However, this should be reevaluated according to the furfural concentration in the insulating fluid since it needs to be extracted from the fluid and evaluated for hindrance from absorption of the fluid in our analysis.
As model insulating fluid samples, 100, 250, 500 and 1000 ppb furfural samples were prepared in the insulating fluid, and extracted by deionized water at a ratio of 2 to 1 water (v/v). The absorbance of the resulting extracts was measured at 200–400 nm by a UV-spectrometer, and the results showed a well-separated absorbance band at 250–300 nm, which was not overlapped by absorbance of the fluid (Figure 3B). This contrasted with the high-intensity bands of the fluid obtained by solvent extraction (Figure 2), and can be reasonable evidence supporting the selective extraction of furfural from the fluid by deionized water. Furthermore, high linearity between the concentration and absorbance at 280 nm was obtained within the concentration range. Generally, in liquid–liquid extraction, the partition coefficient varies depending on the solute and solvent, and multiple extractions are required to obtain sufficient extraction yield. The recovery of furfural in the extraction step could be calculated from the results of the two experiments (in water and in insulating fluid), and an average value of 69% was obtained at a range from 100 ppb to 1000 ppb furfural for the one-time extraction (Figure 3C,D). This is a relatively high recovery rate and sufficient to employ for further analysis.
Furthermore, by increasing the ratio of the fluid amount to water, a concentration effect can be realized to obtain a higher concentration of furfural, thus lowering the LOD with higher sensitivity.

3.4. Employment of Analysis Method on Samples from Running Power Transformer Fluid

Three different fluids were collected from three operating power transformers in the field, and were investigated with the developed analysis method. Furfural solutions were obtained by the extraction of 2 mL fluids using 1 mL of deionized water, and analyzed by a UV-spectrometer, respectively. The three fluids collected showed no color (A1), yellow (A2), and deep red (A3), respectively. Nevertheless, their aqueous extracts (A1a, A2a, and A3a) were clean solutions without color, which indicated the selective extraction of furfural by deionized water without fluid components (Figure 4A).
Three different spectra were obtained and showed different intensities of absorption at 280 nm, respectively (Figure 4B). Based on the results and the standard curve obtained from the model fluid (Figure 3), the concentration was calculated from the absorbance at 280 nm. A very low concentration (0.06 ppm) of furfural was obtained from the first sample (non-colored), while increasing concentrations of furfural were obtained from the two other samples (yellow and red), indicating a higher absorption at 280 nm. In addition, absorption at 200–250 nm was also observed, and may reflect aliphatic compounds such as levulinic acid, formic acid, etc., which are also soluble in water. Therefore, comparing the results from Figure 2 and Figure 3, the absorption band at a range of 200–225 nm could be from the degradation products of the insulating paper. In addition, a correlation between the degree of fluid color and the furfural concentration in the fluid was observed, and this can be valuable information for further investigation in the future. Based on the standard calibration curve obtained from the aqueous extracts obtained from the 2 mL furfural standard samples at 100, 500, and 1000 ppb, by extraction using 1 mL of deionized water, the concentrations of samples A1, A2, and A3 collected from an operating power transformer in the field were determined as 60.9, 576.5, and 951.5 ppb, respectively (Table 1).

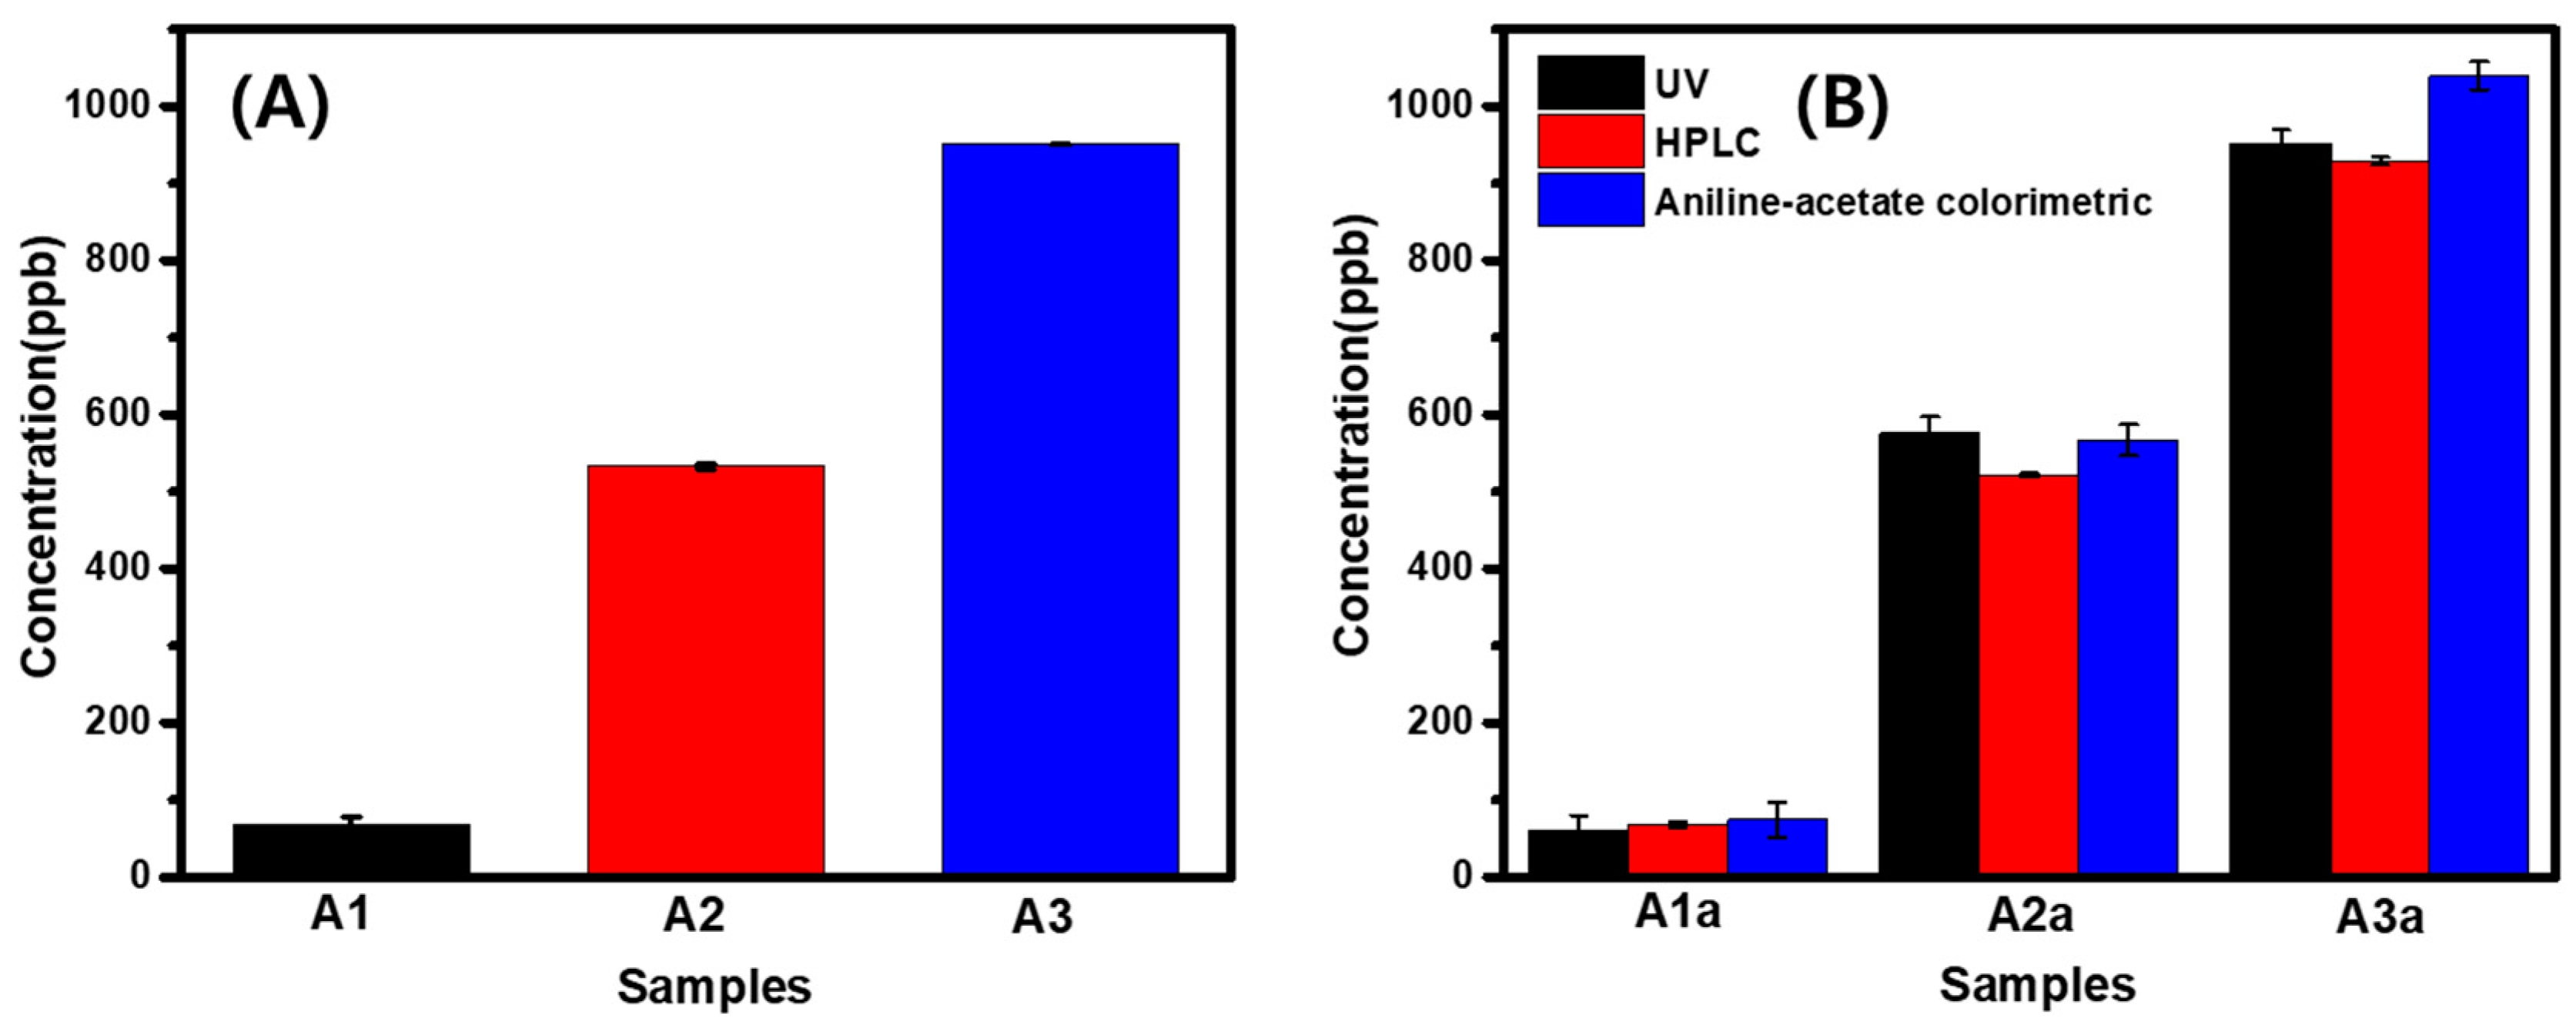
3.5. Verification of Developed Analysis Method by Comparative Investigation Using HPLC and Colorimetric Method

The resulting concentrations of the three samples obtained by selective aqueous extraction coupled with a UV–Vis spectral analysis can be compared to validate the accuracy and applicability with other conventional methods such as the ASTM D5387 method, HPLC, and aniline-acetate colorimetric analysis [23,24] (Figure 5 and Figure 6).
ASTM D5387 using HPLC was employed as a standard method to determine the furfural concentration in the fluid of operating power transformers, and resulted in 69.2, 532.6, and 950.2 ppb furfural concentrations for the same fluids, respectively (Figure 5A and Figure 6A, Table 2), which were very similar with the values (60.9, 576.5, and 951.5 ppb) obtained using the UV spectral method (Figure 4, Table 1). Therefore, the developed UV spectral method was comparable with the ASTM D5387 standard method, offering high accuracy and a simple and fast analytical method without the use of expensive instruments or a time-consuming process.
This comparison of the overall process and results thus validates the accuracy of the developed selective aqueous extraction and spectral method. Additionally, two different analytical methods (Figure 5B,C) using the same aqueous extract were tested to compare the results obtained with those of the above developed method (Figure 4), and can be compared without influences from the sample preparation. The aqueous extracts obtained in Figure 4 were employed in the HPLC method (Figure 5B) and in the aniline-acetate colorimetric analysis coupled with UV–Vis spectral analysis (Figure 5C, Table 1), respectively.
Based on the high linearity of the standard curves obtained from both methods, three samples were analyzed and the results showed similar concentrations and trends with those from Figure 6B, which were also compared with the ASTM D5387 standard method in Figure 6.
The results also showed similar ranges of concentration for the three samples by the three methods, thus confirming the accuracy of the analysis of the fluid from three operating power transformers (Figure 6B). All methods are applicable to below 100 ppb concentration of the sample as a LOD as well in the operating power transformer fluids.
The insulation system is very important to a power transformer’s operational performance and life expectancy. As a result of aging, the insulating cellulose paper is degraded to furanic compounds due to some chemical reactions such as pyrolysis (heat), hydrolysis (moisture), and oxidation (oxygen) that affect its degree of polymerization [3]. Thus, proper monitoring of the condition of the paper/oil composite insulation is required, as an increase in moisture, temperature, and oxygen (air) accelerates the insulation paper’s hydrolytic, pyrolytic, and oxidative degradation, respectively [3]. Since the collection of paper samples from an operational power transformer is almost impossible [1,2,3], measuring the furan compounds that dissolve in the insulating oil provides a prominent indicator to interpret the insulating paper degradation through the measurement of the DP [7,12], and has been a major concern [1,2,3].
Although the ASTM D5387 standard method allows direct injection of the fluid into the HPLC, the expensive analytical system (HPLC) and a mobile organic solvent are required, thus impeding in situ analysis. The traditional chromatographic methods using HPLC are often hindered by matrix effects and insufficient selectivity, and usually require several analytical steps and precolumn derivatization reactions with various compounds, e.g., dinitrophenylhidrazine (DNPH) [20], involving time-consuming sample preparation and analysis using expensive instrumentation that limit their application [21]. While the colorimetric techniques such as the aniline-acetate reaction coupled with UV–Vis spectral analysis are among the most common assays and have gained high visibility with notable research and commercial interest in the last two decades [19,27], they also require time-consuming sample preparation and the use of an additional colorimetric chemical, acid, or special functional polymer film [19,21,22]. The use of organic solvents and hazardous agents, e.g., aniline for derivatizing furfural before analysis, makes in situ analysis difficult due to environmental issues and safety concerns for the individuals performing the sample preparation and analysis. In contrast to the conventional methods, as a very simple and green protocol, this newly developed method can be conducted using deionized water only, without the use of hazardous solvent and agents, providing in situ determination enabled by using a portable UV-spectrometer at a single wavelength, 280 nm, after simple aqueous extraction.
Furthermore, the selective aqueous extraction and UV spectral analysis can be applied to determine the furan concentration in food products and vegetable oils in the food industry as well, since furan compounds have been widely studied in foods for over a decade [13,14]. In particular, researchers have identified their formation in the thermal processing of foods, a dynamic process involving heat and mass transfer, thus leading to a number of physical and chemical changes [34]. They also can be used as markers of heating processes in many products that contain sugars in their composition [35].

4. Conclusions

A facile and efficient analysis method was developed to determine the concentration of furfural as an aging indicator of the insulating fluid in power transformers. The selective aqueous extraction of furfural from the insulting fluid was observed by using deionized water, and provided a simple method for spectral analysis without hindrance in the UV spectrum at 280 nm (λ max). The proposed method can prevent the use of a solvent, the derivatization of furfural with additional hazardous agents such as aniline and DNPH, and the time-consuming chromatographic separation process. The LOD is below 0.1 ppm, which could be a sufficient detection level to evaluate the condition of the insulating fluid. The method was compared with the ASTM D5387 standard method, HPLC, and colorimetric analysis and it was verified that it provides accurate results. Furthermore, it is possible to measure the furfural concentration in situ using a portable UV-spectrometer at a single wavelength, 280 nm. The suggested approach thus offers a novel and green analytical method to quantitatively determine aromatic furan compounds in situ in power transformer insulating fluid.

Author Contributions

H.P. and S.-H.P. conceived and designed the study. All authors performed the experiments. H.P. and S.-H.P. wrote the initial draft of the manuscript, and all authors revised the manuscript. All authors have read and agreed to the published version of the manuscript.

Funding

This work was supported by the Research Fund for the Korea Electric Power Research Institute (Republic of Korea), and the Technology Innovation Program (20014436, Development of biodegradable polycarbonate material and mass production process technology) funded by the Ministry of Trade, Industry & Energy (MOTIE, Republic of Korea).

Data Availability Statement

The data can be found within the article.

Conflicts of Interest

The authors declare no conflict of interest.

References

  1. Ghoneim, S.S.M. Determination of Transformers’ Insulating Paper State Based on Classification Techniques. Processes 2021, 9, 427. [Google Scholar] [CrossRef]
  2. Kaliappan, G.; Rengaraj, M. Aging Assessment of Transformer Solid Insulation: A Review. Mater. Today Proc. 2021, 47, 272–277. [Google Scholar] [CrossRef]
  3. Adekunle, A.A.; Oparanti, S.O.; Fofana, I. Performance Assessment of Cellulose Paper Impregnated in Nanofluid for Power Transformer Insulation Application: A Review. Energies 2023, 16, 2002. [Google Scholar] [CrossRef]
  4. Farhan Naeem, M.; Hashmi, K.; Abdul Rahman Kashif, S.; Shahzeb Khan, M.; Alghaythi, M.L.; Aymen, F.; Ali, S.G.; AboRas, K.M.; Ben Dhaou, I. A Novel Method for Life Estimation of Power Transformers Using Fuzzy Logic Systems: An Intelligent Predictive Maintenance Approach. Front. Energy Res. 2022, 10, 977665. [Google Scholar] [CrossRef]
  5. Chandran, L.R.; Babu, G.A.; Nair, M.G.; Ilango, K. A Review on Status Monitoring Techniques of Transformer and a Case Study on Loss of Life Calculation of Distribution Transformers. Mater. Today Proc. 2021, 46, 4659–4666. [Google Scholar] [CrossRef]
  6. Li, S.; Ge, Z.; Abu-Siada, A.; Yang, L.; Li, S.; Wakimoto, K. A New Technique to Estimate the Degree of Polymerization of Insulation Paper Using Multiple Aging Parameters of Transformer Oil. IEEE Access 2019, 7, 157471–157479. [Google Scholar] [CrossRef]
  7. Ghoneim, S.S.M. The Degree of Polymerization in a Prediction Model of Insulating Paper and the Remaining Life of Power Transformers. Energies 2021, 14, 670. [Google Scholar] [CrossRef]
  8. Zhang, E.; Liu, J.; Zhang, C.; Zheng, P.; Nakanishi, Y.; Wu, T. State-of-Art Review on Chemical Indicators for Monitoring the Aging Status of Oil-Immersed Transformer Paper Insulation. Energies 2023, 16, 1396. [Google Scholar] [CrossRef]
  9. Thiviyanathan, V.A.; Ker, P.J.; Leong, Y.S.; Abdullah, F.; Ismail, A.; Jamaludin, Z. Power Transformer Insulation System: A Review on the Reactions, Fault Detection, Challenges and Future Prospects. Alex. Eng. J. 2022, 61, 7697–7713. [Google Scholar] [CrossRef]
  10. Hill, D.J.T.; Le, T.T.; Darveniza, M.; Saha, T. A Study of Degradation of Cellulosic Insulation Materials in a Power Transformer, Part 1. Molecular Weight Study of Cellulose Insulation Paper. Polym. Degrad. Stab. 1995, 48, 79–87. [Google Scholar] [CrossRef]
  11. Teymouri, A.; Vahidi, B. Power Transformer Cellulosic Insulation Destruction Assessment Using a Calculated Index Composed of CO, CO2, 2-Furfural, and Acetylene. Cellulose 2020, 28, 489–502. [Google Scholar] [CrossRef]
  12. Łojewski, T.; Sawoszczuk, T.; Łagan, J.M.; Zięba, K.; Łojewska, J. Furfural as a Marker of Cellulose Degradation. A Quantitative Approach. Appl. Phys. A Mater. Sci. Process. 2010, 100, 873–884. [Google Scholar] [CrossRef]
  13. Srivastava, R.; Bousquières, J.; Cepeda-Vázquez, M.; Roux, S.; Bonazzi, C.; Rega, B. Kinetic Study of Furan and Furfural Generation during Baking of Cake Models. Food Chem. 2018, 267, 329–336. [Google Scholar] [CrossRef] [PubMed]
  14. Rannou, C.; Laroque, D.; Renault, E.; Prost, C.; Sérot, T. Mitigation Strategies of Acrylamide, Furans, Heterocyclic Amines and Browning during the Maillard Reaction in Foods. Food Res. Int. 2016, 90, 154–176. [Google Scholar] [CrossRef]
  15. Rigling, M.; Höckmeier, L.; Leible, M.; Herrmann, K.; Gibis, M.; Weiss, J.; Zhang, Y. Characterization of the Aroma Profile of Food Smoke at Controllable Pyrolysis Temperatures. Separations 2023, 10, 176. [Google Scholar] [CrossRef]
  16. Park, H.J.; Jeong, N.H.; Nam, C.H. Simple Test Method for Furan in Aged Transformer Oil and its kit. KR patent KR101231586, 4 February 2013. [Google Scholar]
  17. ASTM D5837-99 (reapproved2005); Standard Test Method for Furanic Compounds in Electrical Insulating Liquids by High-Performance Liquid Chromatography (HPLC). ASTM International: Conshohocken, PA, USA, 2005.
  18. Nezami, M.; Wani, S.A.; Khan, S.A.; Khera, N.; Sohail, S. An MIP-Based Novel Capacitive Sensor to Detect 2-FAL Concentration in Transformer Oil. IEEE Sens. J. 2018, 18, 7924–7931. [Google Scholar] [CrossRef]
  19. Rico-Yuste, A.; González-Vallejo, V.; Benito-Peña, E.; de las Casas Engel, T.; Orellana, G.; Moreno-Bondi, M.C. Furfural Determination with Disposable Polymer Films and Smartphone-Based Colorimetry for Beer Freshness Assessment. Anal. Chem. 2016, 88, 3959–3966. [Google Scholar] [CrossRef]
  20. Xing, Q.; Ma, Y.; Fu, X.; Cao, Q.; Zhang, Y.; You, C. Effects of heat treatment, homogenization pressure, and overprocessing on the content of furfural compounds in liquid milk. J. Sci. Food Agric. 2020, 100, 5276–5282. [Google Scholar] [CrossRef]
  21. Kishikawa, N.; El-Maghrabey, M.H.; Kuroda, N. Chromatographic Methods and Sample Pretreatment Techniques for Aldehydes Determination in Biological, Food, and Environmental Samples. J. Pharm. Biomed. Anal. Open 2019, 175, 112782. [Google Scholar] [CrossRef]
  22. N’cho, J.; Fofana, I.; Hadjadj, Y.; Beroual, A. Review of Physicochemical-Based Diagnostic Techniques for Assessing Insulation Condition in Aged Transformers. Energies 2016, 9, 367. [Google Scholar] [CrossRef] [Green Version]
  23. Lin, M.; Lin, K.; Lin, A.; Gras, R.; Luong, J. Ultra-Trace Analysis of Furanic Compounds in Transformer/Rectifier Oils with Water Extraction and High-Performance Liquid Chromatography. J. Sep. Sci. 2016, 39, 2777–2784. [Google Scholar] [CrossRef]
  24. Pita-Calvo, C.; Guerra-Rodríguez, M.E.; Vázquez, M. Analytical Methods Used in the Quality Control of Honey. J. Agric. Food Chem. 2017, 65, 690–703. [Google Scholar] [CrossRef] [PubMed]
  25. Leong, Y.S.; Ker, P.J.; Jamaludin, M.Z.; Nomanbhay, S.M.; Ismail, A.; Abdullah, F.; Looe, H.M.; Lo, C.K. UV-Vis Spectroscopy: A New Approach for Assessing the Color Index of Transformer Insulating Oil. Sensors 2018, 18, 2175. [Google Scholar] [CrossRef] [Green Version]
  26. Alshehawy, A.M.; Mansour, D.-E.A.; Ghali, M.; Lehtonen, M.; Darwish, M.M.F. Photoluminescence Spectroscopy Measurements for Effective Condition Assessment of Transformer Insulating Oil. Processes 2021, 9, 732. [Google Scholar] [CrossRef]
  27. Liang, J.; Li, H.; Wang, J.; Yu, H.; He, Y. Cascade Chromogenic System with Exponential Signal Amplification for Visual Colorimetric Detection of Acetone. Anal. Chem. 2020, 92, 6548–6554. [Google Scholar] [CrossRef]
  28. Li, Z.; Fang, M.; LaGasse, M.K.; Askim, J.R.; Suslick, K.S. Colorimetric Recognition of Aldehydes and Ketones. Angew. Chem. Int. Ed. 2017, 56, 9860–9863. [Google Scholar] [CrossRef]
  29. Feng, L.; Musto, C.J.; Suslick, K.S. A Simple and Highly Sensitive Colorimetric Detection Method for Gaseous Formaldehyde. J. Am. Chem. Soc. 2010, 132, 4046–4047. [Google Scholar] [CrossRef] [PubMed] [Green Version]
  30. Yan, K.; Wu, G.; Lafleur, T.; Jarvis, C. Production, Properties and Catalytic Hydrogenation of Furfural to Fuel Additives and Value-Added Chemicals. Renew. Sustain. Energy Rev. 2014, 38, 663–676. [Google Scholar] [CrossRef]
  31. Jakob, A.; Grilc, M.; Teržan, J.; Likozar, B. Solubility Temperature Dependence of Bio-Based Levulinic Acid, Furfural, and Hydroxymethylfurfural in Water, Nonpolar, Polar Aprotic and Protic Solvents. Processes 2021, 9, 924. [Google Scholar] [CrossRef]
  32. Lin, Y.; Liao, R.; Tao, F.; Wei, C. Effects of Moisture on Furfural Partitioning in Oil-Paper Insulation System and Aging Assessment of Power Transformers. Electr. Power Compon. Syst. 2019, 47, 192–199. [Google Scholar] [CrossRef]
  33. Feng, D.; Yang, L.; Zhou, L.; Liao, R.; Chen, X. Effect of Oil–Paper–Pressboard Mass Ratio on Furfural Content in Transformer Oil. IEEE Trans. Dielectr. Electr. Insul. 2019, 26, 1308–1315. [Google Scholar] [CrossRef]
  34. Cepeda-Vázquez, M.; Blumenthal, D.; Camel, V.; Rega, B. Multivariate Optimization of Headspace Trap for Furan and Furfural Simultaneous Determination in Sponge Cake. Talanta 2017, 164, 708–715. [Google Scholar] [CrossRef] [PubMed]
  35. Milani, M.I.; Rossini, E.L.; Castoldi, K.; Pezza, L.; Pezza, H.R. Paper Platform for Reflectometric Determination of Furfural and Hydroxymethylfurfural in Sugarcane Liquor. Microchem. J. 2017, 133, 286–292. [Google Scholar] [CrossRef] [Green Version]
Scheme 1. Schematic diagram of a power transformer (oil/paper) and the degradation of the insulation paper (cellulose) to furfural through 5-HMF.
Separations 10 00381 sch001
Figure 1. (A) UV spectrum of furfural (FF), 5-hydroxyfurfural (HMF), and levulinic acid (LA) at various concentrations in acetonitrile. (B) Comparison of UV spectrum of FF, HMF, and LA at 0.5 ppm in acetonitrile. UV–Vis spectra of (C) n-hexane diluted series samples obtained from standard insulating fluid containing 1 ppm furfural and (D) insulating fluid samples containing 0.1 and 1.0 ppm furfural.
Separations 10 00381 g001
Figure 2. Effect of extraction solvents. UV–Vis spectra of extracts from model insulating fluid samples containing 1 ppm furfural using various solvents and deionized water, respectively.
Separations 10 00381 g002
Figure 3. UV–Vis spectral analysis of furfural. (A) UV–Vis spectrum obtained from samples at 50, 100, 250, 500, 1000, and 2000 ppb furfural in deionized water. (B) UV–Vis spectrum of aqueous extract samples obtained from 2 mL of furfural insulate fluid by extraction using 1 mL of deionized water. (C) Correlation at various furfural concentrations vs. UV absorbance at 280 nm; (●) plot for absorbance from (A); (▲) plot for absorbance from (B); and (■) plot for ½ absorbance (representative to 1 mL) from (B). (D) Recovery of furfural calculated from furfural concentrations from insulate fluid and deionized water in (C).
Separations 10 00381 g003
Figure 4. Three samples (A1, A2, and A3) of 2 mL of fluid from operating power transformers and their extract solutions (A1a, A2a and A3a) obtained by using 1 mL of deionized water (A) and UV–Vis spectrum (B).
Separations 10 00381 g004
Figure 5. Comparison and verification of the developed method with conventional methods to determine the furfural concentration in the fluid of operating power transformers. ASTM D5387 method; (A1) HPLC chromatogram of 10, 20, 100, and 1000 ppb of furfural standards in acetonitrile 25%; (A2) HPLC chromatogram of direct injection of operating power transformer fluid. Aqueous extraction and HPLC analysis; (B1) HPLC chromatogram of aqueous extract samples obtained from 2 mL of 100, 500, and 1000 ppb furfural by extraction using 1 mL of deionized water; (B2) HPLC chromatogram of aqueous extract samples obtained from 2 mL of operating power transformer fluid by extraction using 1 mL of deionized water. Aqueous extraction and aniline-acetate colorimetric analysis; (C1) UV–Vis spectrum of reaction solutions of aniline-acetate reagent and aqueous extracts obtained from 2 mL of 100, 500, and 1000 ppb furfural by extraction using 1 mL of deionized water; (C2) UV–Vis spectrum of reaction solution of aniline-acetate and aqueous extract samples obtained from 2 mL of operating power transformer fluid by extraction using 1 mL of deionized water.
Separations 10 00381 g005
Figure 6. Comparison and validation of the developed method. (A) Furfural concentrations of fluid from three operating power transformers obtained by the ASTM D5387 (HPLC) method. (B) Aqueous extracts (A1a, A2a, and A3a) were analyzed by UV, the method developed in this study; by HPLC; and by aniline-acetate colorimetric analysis.
Separations 10 00381 g006
Table 1. Comparison of the furfural concentrations of aqueous extracts obtained from the fluid of three operating power transformers by the UV–Vis spectral analysis suggested in this study, the HPLC method, and the aniline-acetate colorimetric analysis.
UV–Vis Spectral AnalysisHPLC MethodAniline-Acetate Colorimetric Analysis
UV AbsorbanceFurfural Concentration (ppb)HPLC IntensityFurfural Concentration (ppb)UV AbsorbanceFurfural Concentration (ppb)
A1a0.00560.90.002267.70.08474.2
A2a0.060576.50.0164521.00.220566.8
A3a0.101951.50.0286929.50.3501039.8
Table 2. Furfural concentration of fluid from three operating power transformers obtained by the HPLC method (ASTM D5387).
Peak AreaFurfural Concentration (ppb)
A1404169.2
A231,107532.6
A355,497950.2
Disclaimer/Publisher’s Note: The statements, opinions and data contained in all publications are solely those of the individual author(s) and contributor(s) and not of MDPI and/or the editor(s). MDPI and/or the editor(s) disclaim responsibility for any injury to people or property resulting from any ideas, methods, instructions or products referred to in the content.

