Article

Preconcentration of Volatile Organic Compounds on Carbon Magnetic Sorbents in the Analysis of Air by Using the Configuration Change of the Sorbent Bed during the Transition from Sorption to Thermodesorption GC-FID

by
Oleg Rodinkov
1,
Victor Postnov
1,
Valery Spivakovskyi
1,
Ekaterina Znamenskaya
1,*,
Anastasia Zheludovskaya
1 and
Pavel Nesterenko
2,*
1
Institute of Chemistry, St. Petersburg State University, 198504 St. Petersburg, Russia
2
Chemistry Department, Lomonosov Moscow State University, 119991 Moscow, Russia
*
Authors to whom correspondence should be addressed.
Separations 2023, 10(7), 416; https://doi.org/10.3390/separations10070416
Submission received: 26 June 2023 / Revised: 18 July 2023 / Accepted: 20 July 2023 / Published: 23 July 2023

Abstract

:
The new scheme of the rapid preconcentration of volatile organic substances followed by the thermodesorption and gas chromatographic determination by using a flame ionization detector is proposed for the analysis of air. The scheme implies a change in the geometry of the adsorbent layer in a column during the transition from adsorption to thermal desorption steps. The extraction of analytes is carried out in a wide tube, allowing quantitative adsorption at higher flow rates of the analyzed air passed through the magnetic sorbent held in a thin layer retained by a permanent magnet without any supporting frits. Novel magnetic adsorbents composed of magnetite or a zirconia/magnetite core and pyrocarbon shell are developed for this application. At the end of the adsorption step, the magnet moved out of the system, and the adsorbent transferred under the gravity force into a narrow tube, which provides the more efficient heating of the adsorbent and minimal blurring of the analyte zones during the subsequent thermal desorption. The proposed scheme allows a significant reduction (approximately 10 times) of the time required for the preconcentration of analytes, which is illustrated by the GC determination of alcohols (butanol-1, pentanol-1), phenol, and o-cresol in the air.

Graphical Abstract

1. Introduction

The determination of volatile organic compounds (VOCs) in atmospheric air at the maximum permissible concentration level is often impossible without their preconcentration [1,2]. The adsorption preconcentration, also called solid phase extraction (SPE), is one of the most effective methods of concentration analytes used in air analysis [3,4]. The possibilities of SPE in its most common variant of solid phase microextraction (SPME) for GC are limited by the small mass of the active sorbing phase (0.2–2.0 mg), and, accordingly, the relatively low adsorption capacity of the concentrators, which is insufficient to achieve the low limits of detection (LOD) of the analytes [5,6,7]. Dynamic SPE is based on passing the analyzed gas through a tube with a sorbent, followed by the thermal desorption and the GC determination of the analytes [2,3,8]. Dynamic SPE is carried out using various porous polymer and carbonaceous adsorbents [9,10,11,12,13], including nanocarbon materials with a high specific surface area and hydrophobicity [14,15,16]. It should be noted that hydrophobic polymer adsorbents have a significantly lower sorption capacity as compared to carbon sorbents [13]. The latter, including graphitized carbon black and, especially, nanocarbon materials (nanographene, carbon nanotubes (CNTs), nanodiamonds, etc.), have one significant drawback. Particles of these materials that are too fine prevent their direct use for the preconcentration of trace impurities in the analysis of air due to the low permeability of the sorption layer in the tube [17]. The possible solution to this problem is using adsorbents in which the nanocarbon particles are immobilized on the surface of the solid phase carriers, such as porous polytetrafluoroethylene [18,19] or silica [20,21,22,23]. Another option is using aggregated or sintered nanocarbon particles such as microdispersed sintered nanodiamonds [24].
Regardless of the nature of the sorbents used, the actual problem of the preconcentration is the discrepancy between the optimal configurations of the sorbent layer (the ratio of its height to diameter) at the sorption and thermal desorption stages. On the one hand, during sorption, to achieve a high concentration of coefficients of analytes in a short time, it is necessary to pass the analyzed gas through the sorbent at a relatively high flow rate, which is practically impossible in the case of long narrow sorption tubes. On the other hand, during the thermal desorption of analytes, the velocity of the gas phase should be hundreds of times less, while the elongated configuration of the sorption layer is more rational, ensuring the minimal dispersion of the zones of the desorbed components. This requirement can be met by the modification of the configuration of the sorption layer during the transition from the sorption to thermal desorption steps. The corresponding change is achieved by pouring grains of the adsorbent after the sorption step from a wide short tube into a narrower and longer one [25].
The possible implementation of such a scheme of the preconcentration can be achieved by using adsorbents with magnetic properties [26,27]. The application of various advanced magnetic materials in SPE have been recently reported [28,29,30]. With magnetic adsorbents, the increase in the permeability of the sorption layer can be obtained by holding magnetic particles in a wide sorption tube without the supporting frit under the influence of a permanent magnet [31,32]. A similar principle has been recently reported [33].
The purpose of this work is to evaluate the analytical capabilities of the sorption concentration of VOCs in the analysis of air on carbon-containing magnetic sorbents by using a change in the configuration of the sorption layer during the transition from the sorption to desorption steps due to the transfer of the sorbent from a wide tube into one of a smaller diameter.

2. Materials and Methods

2.1. Preparation and Characterization of Adsorbents

Four magnetic carbon-containing adsorbents were synthesized in this work. Solely magnetite (Fe3O4) and mixed zirconium/magnetite nanoparticles (Fe3O4 × ZrO2) were used as a basis for the preparation of two types of adsorbents. The synthesis of Fe3O4 was carried out using a solution of iron (II) and iron (III) sulfates, as described in [34]. For the synthesis of Fe3O4 × ZrO2 nanoparticles, zirconium nitrate was added to the mixture. Precipitation was carried out by gradually changing the pH with the addition of a solution containing a mixture of ammonium hydroxide and ammonium citrate.
Carbon-containing adsorbents of the first type were obtained by the pyrolysis of ethanol vapors from a hydrogen flow onto the surface of magnetite (Fe3O4) at temperatures of 500 °C (adsorbent I) and 600 °C (adsorbent II). Adsorbents of the second type were obtained by the pyrolysis of vapors of propargyl alcohol at a temperature of 800 °C from a nitrogen flow onto the surface of Fe3O4 (adsorbent III) and Fe3O4 × ZrO2 (adsorbent IV). The duration of the pyrolysis for the first and second types of adsorbents was 30 min and 2 h, correspondingly. The pyrolysis was carried out in a quartz reactor in a vertical position by using the fluidized bed mode.
The morphology of the surface of the synthesized sorbents was checked by using scanning electron microscopy. The values of specific surface area (Ssp), carbon content (C, %), magnetic properties (saturation magnetization, Is), and hydrophilicity (G, %) were measured and used for the comparison of the prepared adsorbents. The specific surface area was measured by the low temperature adsorption of nitrogen (BET method) method [35]. The single point version of this method described by Klyachko-Gurvich [36] was used in this case. Before the measurements, all samples were carefully degassed in a vacuum at 300 °C for 10 h to remove the adsorbed gases and traces of water. The magnetic properties of the studied sorbents were evaluated by the magnitude of the saturation magnetization Is, which was measured using a highly sensitive vibration magnetometer. The carbon content in the adsorbents was measured by differential thermogravimetric analysis (TGA). To evaluate the hydrophilicity, which affects the accuracy of the wet gas analysis, the increase in the mass of the predegassed adsorbent at 190 °C was measured after its saturation with water by passing a flow of nitrogen with a relative humidity of 99% at (22 ± 1 °C). A flow of nitrogen having a specified humidity was obtained by bubbling through a 1% aqueous NaCl solution. The hydrophilicity (G) of the adsorbents was calculated by the formula:
G = m m 0 m 0
where m and m0 are the masses of the adsorbent before and after saturation with moistured air, respectively.

2.2. Processing Model Gas Mixtures

Model gaseous mixtures with a constant concentration of analytes of 50 mg/m3 were used for the evaluation of the adsorption properties of the prepared adsorbents. These mixtures were prepared by flowing air through aqueous solutions with a preset concentration of analytes according to procedure [37]. It was found that the equilibrium distribution of the model compounds between the aqueous and gaseous phases and the constancy of their concentrations in the saturated gaseous phase were attainable. One can infer these conditions from the constancy of the analyte’s concentration in the flow of the model gas mixtures formed at various air flow rates. Values of the analyte’s distribution coefficients between aqueous and gaseous phases were determined as previously described [38].
The concentration of the analyte in the resulting gas mixture (CG) is directly proportional to its concentration in the solution (CL) according to the following expression:
CG = CL/K
where K is the distribution coefficient in the liquid–gas system.

2.3. Evaluation of the Adsorption Efficacy

For the evaluation of the adsorption efficacy, the model gas mixtures of the analytes were passed at flow rate WG through tubes packed with known amounts of the adsorbents. The completeness of the adsorption process was monitored by the GC analysis of the gas effluent at the tube outlet. Then, the retention curves were plotted as dependencies of C/C0 from V, where C and C0 are concentrations of the test substances in the gas phase detected at the column outlet and inlet, correspondingly, and V is a volume of the model gas mixture passed through the column. From these curves, the breakthrough volume (VB) and the retention volume (VR) were determined for each test substance. The VB value was measured as the volume of the gas mixture passed through the column to condition C/C0 = 0.05. The VR value was equal to the gas mixture volume passed to C/C0 = 0.5 reached. The number of theoretical plates (N) can be calculated from these dependencies according to the formula valid for frontal chromatography [39]:
N = V R 2 ( V R V 0.16 ) 2
where VR—retention volume and V0.16—the volume of the gas phase passed through the column until the ratio C/C0 = 0.16. HETP values were calculated from the relationship:
H = l/N,
where l is column length. All sorption columns used for comparison had different lengths and diameters, but the same internal volume contained equal amounts of adsorbent. The parameters of the columns are presented in Table 1. Tube 1 is the standard one supplied with a thermal desorber TDS-1 [10]. The other tubes had the same volumes as tube 1, but 2, 6.5, and 12 times larger cross-sectional areas, respectively, than tube 1.

2.4. Instrumentation

The specific surface area was measured by a single-point method, as described by Klyachko-Gurvich [30]. The investigation of the surface morphology was performed by scanning electron microscopy (SEM) with the Zeiss Supra 40 VP instrument. A highly sensitive vibrating magnetometer, the Lake Shore 7410, was used for the measurement of the saturation magnetization of the adsorbents. The carbon content in the prepared sorbents was determined with the TGA analyzer SETSYS Evolution 16 (Setaram, Lion, France) by heating the adsorbents in the air at 900 °C. The GC chromatograph Crystal-5000.2 (Chromatec, Yoshkar-Ola, Russia), equipped with a flame ionization detector (FID) and a capillary column (10 m × 0.53 mm × 2.65 μm) with a 100% dimethylpolysiloxane coating, was used for the determination of the test substances. The fine-tuning of the airflow during the preparation of the model gas mixtures was performed with a regulator Chromatec-Crystal FPG. Gas sampling was carried out with an automatic heated six-port switching valve. The one-step thermal desorber NDS-1 (Chromatec, Yoshkar-Ola, Russia) was used for the thermodesorption of the preconcentrated samples, with the device rendering the thermodesorption viable in the interval 150–400 °C with steps of 50 °C.

3. Results and Discussion

3.1. Morphology of Synthesized Sorbents

According to the SEM images, the prepared magnetic adsorbents have different surface morphologies. The presence of globular formations, characteristic of magnetite nanoparticles, and a small number of stretched nanostructures, attributed to CNTs, is noted on the surface of adsorbent I (Figure 1, left). The surface of adsorbent II contained CNTs of different diameters (Figure 1, right). The increase in temperature from 500 to 600 °C promotes the formation of carbon nanotubes.
There are no globular formations characteristic of magnetite nanoparticles on the surface of adsorbent III, as well as no observed CNTs (Figure 2, left). It is assumed that the sintering of magnetite nanoparticles occurs at a temperature of 800 °C and leads to the formation of large aggregates covered with a layer of pyrocarbon. In the case of adsorbent IV, Fe3O4 × ZrO2 particles underwent sintering to a lesser degree during carbon deposition as compared to Fe3O4 particles (Figure 2, right). This is because zirconium dioxide is an effective textural promoter preventing the sintering of adsorbents [40].
It should be noted that carbon deposition enlarges magnetic nanoparticles. This allows the use of the prepared adsorbents for the preconcentration of VOCs at relatively high flow rates of the analyzed air. The characteristics of the adsorbents are given in Table 2, also showing the characteristics of graphitized thermal carbon black adsorbents (Carbopacks) having a comparable specific surface area.

3.2. Sorption, Magnetic, and Other Properties of the Studied Sorbents

As follows from Table 2, the prepared magnetic adsorbents have a high adsorption capacity to butanol-1 and phenol, which is comparable with that obtained for the Carbopacks. According to the van Deemter plots (see Figure 3), the prepared adsorbents demonstrated a better mass transfer ratio (lower slope, which is related to the C-term) at a high linear velocity of the mobile phase for phenol than common carbonaceous adsorbents. This makes possible an effective preconcentration in a shorter time with the composite adsorbents. It should be noted that van Deemter plots are obtained for adsorbents having the same particle size.
Based on the retention parameters obtained for butanol-1 and phenol (see Table 2), magnetic adsorbent II can be recommended for the preconcentration of alcohols. Magnetic adsorbent IV was selected for the preconcentration of phenols because of the incomplete thermal desorption of phenol from adsorbents I and II. The very low hydrophilicity is obtained for magnetic adsorbents III and IV, which is several times less than that of the other carbonaceous adsorbents used in this work.
The synthesized magnetic sorbents have a much higher saturation magnetization Is as compared to composite magnetic sorbents based on bare and octadecylsilica, organopolymer, and other composite sorbents, where magnetite was used as a magnetic additive, but not as a basis [41]. A typical magnetization curve for adsorbent I is shown in Figure 4. The high saturation magnetization value of this adsorbent indicates the presence of pure iron impurities in it.
Due to their sufficiently strong magnetic properties, the particles of all synthesized sorbents can be held under the influence of a permanent magnet in a vertical or horizontal position in glass sorption tubes of an internal diameter of up to 10 mm without any supporting frits (Figure 5). However, the magnet must provide a magnetic field strength of at least 103 Oersted. No loss of adsorbent from the adsorbent layer retained by a permanent magnet was noted during multiple experiments with sorption tubes of different diameters.

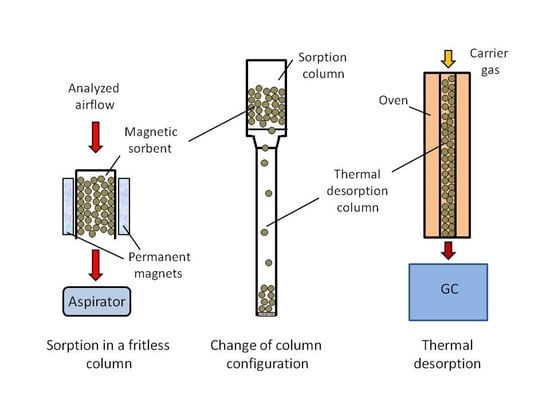
3.3. Preconcentration by Using the Configuration Change of the Magnetic Sorbent Bed

The absence of a frit resulted in a significant increase in the permeability of the sorption tubes at the preconcentration and simplified the configuration changes in the sorption layer during the transition from the sorption to thermal desorption steps (see Figure 5). At the sorption stage, the flow of analyzed air (1) created by the electric aspirator (4) passes through the wide sorption tube (2) where the magnetic adsorbent retained by the permanent magnet (3) (Figure 5).
The use of a wide tube without any frits allows the increase in the flow rate of the analyzed air up to 1 L/min and thereby dramatically decreases the time required for the quantitative preconcentration of analytes. For the tube with a relatively big inner diameter of 9 mm (tube 4 in Table 1), the linear velocity of the analyzed air can be as high as 30 cm/s. At the end of sorption, the sorption tube (2) is disconnected from the electric aspirator and connected to a narrow thermodesorption tube (6) via an adapter (5) (see Figure 5). Then, the magnet is moved out the tube (2), and the adsorbent particles drop from the wide tube through the adapter into the narrow thermodesorption tube under the gravity force. A frit (10) is initially placed at the bottom of a narrow tube to keep the adsorbent. Another frit is installed at the top of the tube after the transfer of all volumes of the adsorbent. After that, the narrow tube is immediately placed in a gastight container or in a thermal desorber to prevent the possible loss of analytes. The thermal desorption includes heating the tube to a temperature of 250 °C, keeping it for 1 min at this temperature, then the desorbed analytes are displaced into the evaporator (injector) of the GC instrument (9) and undergo analysis in a carrier gas flow (7).
To evaluate the analytical capabilities of the developed scheme, the efficiency of the sorption columns filled with the same volume of adsorbent, but of different internal diameters (ID) and lengths, was compared. Theoretically, an increase in the column ID should result in an elevated role of the “wall” effect in band-broadening for the separated components [42]. In this case [43], the effect of the tube radius r on the HETP value (H) can be expressed by the van Deemter equation, as follows:
H = A + B/u + (C1 + C2 + C3r2)u
where A is the eddy diffusion term; B is the longitudinal diffusion term; C1 and C2 are the internal and external resistance to mass transfer coefficients, respectively; C3 reflects the contribution of the wall effect; u is the linear velocity of the mobile phase.
The influence of r on the HETP value is not obvious, since an increase in the column diameter increases not only the wall effect contribution but also decreases the linear velocity uG of the mobile phase at a constant value of the flow rate (WG) according to the following formula:
uG = WG/(πr2αG)
where αG is the fraction of the mobile phase in the total volume of the column.
The positive effect of increasing the radius of the sorption tube should be more profound at high flow rates. Figure 6 shows the set of dependencies of the HETP from a flow rate of the model gas mixture (MGM) obtained for the sorption tubes of different diameters (see Table 1) filled with adsorbent IV.

3.4. Advantages of the Proposed Preconcentration Scheme

As expected, there was a significant decrease in the C-term values in the van Deemter Equation (5), meaning that the increase in the mass transfer ratio is noted for the wider columns at high flow rates (WG > 150 mL/min), which make their use favorable for the preconcentration. However, using the wider sorption tubes does not guarantee an increase in the NTT number (see Equation (5)), as the tube length (l) decreases with an increase in the internal diameter for the column of a constant volume.
The main concentration indicator is the concentration coefficient (Kcon), which is equal to the ratio of the analyte concentrations in the concentrate and the initial sample [44]. In the case of the dynamic sorption concentration, the sample volume is equal to the breakthrough volume (VB), and the volume of the adsorbent (VS) is accepted as the concentrate volume. Thus, the concentration coefficient can be expressed as follows:
K c o n = R V B V S
where R is the extraction degree of the extraction of the selected analyte (R ≈ 1). The breakthrough volume is proportional to the volume of the adsorbent in a column, but its exact value is a complex function of the NTT, and decreases with a decrease of N [45].
The preconcentration rate E is another important indicator of the preconcentration. The E value reflects not only the concentration coefficient Kcon, but also the time t required for the preconcentration:
E = Kcon/t.
Considering that VB = WG × t, and combining (7) and (8), the well-known [46] expression can be obtained:
E = R W G V S
Expression (9) shows the possibility of an increase in the preconcentration rate by increasing the flow rate of the analyzed air through the sorption tube. This possibility can be realized by using wider columns of shorter lengths at the sorption stage.
The main parameters for the preconcentration of butanol-1 and phenol using tubes of different geometric dimensions are in Table 3. The maximum possible flow rates (50–100 mL/min) of the analyzed air used for tubes 1 and 2 is limited by a pressure drop of 30 kPa (0.3 atm) provided by an electric aspirator. In the case of tube 4, the flow rate can be increased up to 1000 mL/min and, consequently, the concentration rate E can be increased 10–20 times as compared to tube 1. It has been shown earlier [25] that the transfer of adsorbent particles from the preconcentration tube to the thermodesorption tube does not affect the analysis. The volume of analyzed air passed through the sorption tube was 1.5–2 times less than the breakthrough volume of the least-retained analyte, so the results obtained with and without frits were practically the same.

3.5. Thermal Desorption

The performance of the developed scheme also depends on the efficiency of thermal desorption. The influence of temperature, time, and the flow rate of the carrier gas on the efficiency of thermal desorption was investigated. A relatively high affinity of the prepared adsorbents to analytes allowed the use of the simplest single-step thermal desorption scheme, shown in Figure 7. The flow of carrier gas (1) goes into the GC instrument through a three-way switch valve (2). In the first position of the metering valve (solid line in Figure 7), the carrier gas enters directly into the evaporator of the injector (3). The adsorption tube (4) is installed in a thermal desorber (5) and heated to the selected temperature. The outlet needle of the thermal desorber (6) is inserted into the evaporator of chromatograph (3), followed by the immediate switching of the valve (2) to the position indicated by the dotted line. In this case, the analytes are transferred by the carrier gas flow from the sorption tube (4) to the capillary column (8). For a more efficient GC separation, most of the carrier gas flow was split at a ratio of 1:3 by using a fine-tuning valve (7).
The quantitative (>97%) thermal desorption of butanol-1 and pentanol-1 from sorbent II can be achieved by heating the thermal desorption tube for 1 min at 200 °C and with a carrier gas flow of 10 mL/min. The use of lower temperatures or longer heating times and higher flow rates resulted in a broadening of the chromatographic peaks. Optimal conditions for the quantitative thermal desorption of phenol and cresol from adsorbent IV are the same except for using the higher temperature of 250 °C. The proposed thermal desorption scheme provides a good reproducibility of the results. The relative standard deviation (Sr) in a series of parallel definitions does not exceed 0.06 for the peak areas used as an analytical signal. Figure 8 shows a typical chromatogram obtained by the thermal desorption of phenols from magnetic adsorbent IV.
The proposed scheme with the change of the column configuration and novel magnetic adsorbents allows a 103–104 times preconcentration of the analytes in 5–20 min, which provides their GC determination at the level of several μg/m3. The advantages of the new approach over a traditional preconcentration scheme for the determination of analytes in model gas mixtures are summarized in Table 4.
The new magnetic adsorbents have a high adsorption capacity to alcohols and phenols, which is comparable with traditional adsorbents having similar specific surface areas. Due to the magnetic properties, the particles of the developed sorbents are retained in a wide tube without supporting frits under the action of a permanent magnet. A relatively large diameter of the sorption tube and the absence of frits make it possible to pass the analyzed air at a higher flow rate due to the decreased resistance to the flow. As a result, the reduction in the time required for the quantitative adsorption of analytes was decreased several times.
The achieved recovery of alcohols and phenols obtained with magnetic adsorbents and the proposed change in the configuration of the sorption and thermodesorption tubes was above 91%, except for phenol. A recovery of 83% obtained for phenol cannot be considered as very low due to the quite high uncertainty of the method. For example, the results obtained with classic sorption tubes packed with Carbopack B for the concentration. For the determination of hexane with three parallel measurements, the standard uncertainty documented by ISO is 16.8% [47]. The degree of extraction at the level of 80% is also common when magnetic sorbents are used for the preconcentration in the analysis of environmental objects, including atmospheric air [48].
The stability of the adsorbents recommended for the analysis of alcohols and phenols has been checked by their repetitive use. The adsorbent II can be used multiple times without losing adsorption properties during the thermodesorption of butanol-1 at 200 °C. However, a decrease in the sorption capacity by approximately 20–25 percent was found for adsorbent IV every time after the thermal desorption of phenol at 250 °C as compared to the previous preconcentration. Probably, it is connected with the contamination of this adsorbent by the oxidation products of phenol.

4. Conclusions

Thus, the adsorption properties of the new composite carbonaceous adsorbents based on magnetite nanoparticles (Fe3O4) and magnetite nanoparticles with a core of zirconium oxide (Fe3O4 × ZrO2) coated with a layer of pyrocarbon have been investigated. The efficiency of these adsorbents obtained for the dynamic preconcentration of alcohols and phenols from the airflow is not worse as compared with the Carbopacks. The magnetic properties of the prepared adsorbents allow their use in fritless columns of varied geometrical configurations with adsorbents retained by a permanent magnet. This advantage was used for the optimization of the preconcentration scheme when adsorption occurs in a wide tube with a thin layer of adsorbent at higher flow rates of the analyzed gas followed by a simple adsorbent transfer into a narrow tube, which is better suited for thermal desorption. The proposed scheme reduces the duration of the sorption preconcentration step by 10 times as compared to traditional methods. The preconcentration analytes of 103–104 times can be achieved in 5–20 min, allowing for the detection of analytes in gases at the ppb level.

Author Contributions

Conceptualization, O.R., V.P., and P.N.; methodology, V.P. and P.N.; validation, V.S.; formal analysis, E.Z. and A.Z.; investigation, E.Z. and V.S.; data curation, O.R.; writing—original draft preparation, O.R. and P.N.; writing—review and editing, O.R. and V.S.; supervision, P.N.; project administration, O.R. All authors have read and agreed to the published version of the manuscript.

Funding

This work was funded by RFBR (grants #20-03-00285a and #20-03-00584a).

Institutional Review Board Statement

Not applicable.

Informed Consent Statement

Not applicable.

Data Availability Statement

Not applicable.

Acknowledgments

The authors acknowledge the Centers “Methods of analyzing the content of substances”, “Innovative technologies of nanomaterials”, and “Nanotechnology” of St. Petersburg State University Techno-Park with regard to providing instrumentation and performing a set of measurements of the study. PN acknowledge partial support from M.V. Lomonosov Moscow State University Program of Development. The article is dedicated to the 300th anniversary of St. Petersburg State University.

Conflicts of Interest

The authors declare no conflict of interest.

References

  1. Verma, H.; Upadhyay, S.; Verma, S. Nanomaterials for air pollution control: A review. IJCRT 2022, 10, 2320–2882. [Google Scholar]
  2. Mauri-Aucejo, A.R.; Ponce-Catale, P.; Belenguer-Sapina, C. Determination of phenolic compounds in air by using cyclodextrin silica hybrid microporous composite samplers. Talanta 2015, 134, 560–567. [Google Scholar] [CrossRef] [PubMed]
  3. Poole, C.; Mester, Z.; Miró, M.; Pedersen-Bjergaard, S.; Pawliszyn, J. Extraction for analytical scale sample preparation (IUPAC Technical Report). Pure Appl. Chem. 2016, 88, 649–687. [Google Scholar] [CrossRef] [Green Version]
  4. Khajeh, M.; Laurent, S.; Dastafkan, K. Nanoadsorbents: Classification, preparation, and application (with emphasis on aqueous media). Chem. Rev. 2013, 113, 7728–7768. [Google Scholar] [CrossRef]
  5. Piri-Moghadam, H.; Ahmadi, F.; Pawliszyn, J. A critical review of solid phase microextraction for analysis of water samples. Trends Anal. Chem. 2016, 85, 133–143. [Google Scholar] [CrossRef] [Green Version]
  6. Siyuan, D.; Tao, N.; Jing, Y.; Pin, C.; Hao, Y.; Jiahao, W.; Hucheng, Y.; Shukui, Z. Recent advances and applications of magnetic nanomaterials in environmental sample analysis. Trends Anal. Chem. 2020, 126, 115864. [Google Scholar]
  7. Diwan, A.; Singh, B.; Roychowdhury, T.; Yan, D.D.; Tedone, L.; Nesterenko, P.N.; Paull, B.; Sevy, E.T.; Shellie, R.A.; Kaykhaii, M.; et al. Porous, High Capacity Coatings for Solid Phase Microextraction by Sputtering. Anal. Chem. 2016, 88, 1593–1600. [Google Scholar] [CrossRef]
  8. Andrade-Eiroa, A.; Canle, M.; Leroy-Cancellieri, V.; Cerdà, V. Solid-phase extraction of organic compounds: A critical review (Part I). Trends Anal. Chem. 2016, 80, 641–654. [Google Scholar] [CrossRef]
  9. Rodinkov, O.V.; Pisarev, A.Y.; Moskvin, L.N.; Bugaichenko, A.S.; Nesterenko, P.N. Sensitivity Increase in Headspace Analysis of Hydrocarbons in Water by Using Online Selective Elimination of Gas Extractant. Separations 2022, 9, 15. [Google Scholar] [CrossRef]
  10. Rodinkov, O.V.; Postnov, V.N.; Bugaychenko, A.S.; Valery, S. Comparison of the capabilities of carbon sorption-active materials for the express concentration of volatile organic compounds from the flow of analysed air. Sorbtsionnye I Khromatograficheskie Protsessy 2021, 21, 307–316. [Google Scholar]
  11. Maciel, E.V.S.; de Toffoli, A.L.; Neto, E.S.; Nazario, C.E.D.; Lanças, F.M. Trends in analytical chemistry new materials in sample preparation: Recent advances and future trends. Trends Anal. Chem. 2019, 119, 115633. [Google Scholar] [CrossRef]
  12. Postnov, V.N.; Rodinkov, O.V.; Moskvin, L.N.; Novikov, A.G.; Bugaichenko, A.S.; Krohina, O.A. From carbon nanostructures to high-performance sorbents for chromatographic separation and preconcentration. Russ. Chem. Rev. 2016, 85, 115–138. [Google Scholar] [CrossRef]
  13. Lanin, S.N.; Rychkova, S.A.; Vinogradov, A.E.; Lanina, K.S.; Obrezkov, O.N.; Nesterenko, P.N. Modification of the surface chemistry of microdispersed sintered detonation nanodiamonds and its effect on the adsorption properties. Adsorpt. J. Int. Adsorpt. Soc. 2017, 23, 639–650. [Google Scholar] [CrossRef]
  14. Li, W.-K.; Shi, Y.-P. Recent advances and applications of carbon nanotubes based composites in magnetic solid phase extraction. Trends Anal. Chem. 2019, 118, 652. [Google Scholar] [CrossRef]
  15. Abdelmonaim, A.; Kailasa, S.K.; Lee, S.S.; Rascón, A.J.; Ballesteros, E.; Zhang, M.; Kim, K.-H. Review of nanomaterials as sorbents in solid-phase extraction for environmental samples. Trends Anal. Chem. 2018, 108, 347. [Google Scholar]
  16. Koreshkova, A.N.; Gupta, V.; Peristyy, A.; Hasan, C.; Nesterenko, P.; Paull, B. Recent Advances and Applications of Synthetic Diamonds in Solid-Phase Extraction and High-Performance Liquid Chromatography. J. Chromatogr. A 2021, 1640, 461936. [Google Scholar] [CrossRef]
  17. Nesterenko, P.N.; Fedyanina, O.N. Properties of microdispersed sintered nanodiamonds as a stationary phase for normal-phase high performance liquid chromatography. J. Chromatogr. A 2010, 1217, 498–505. [Google Scholar] [CrossRef]
  18. Rodinkov, O.V.; Bugaichenko, A.S.; Vlasov, A.Y. Compositional surface-layered sorbents for pre-concentration of organic substances in the air analysis. Talanta 2014, 119, 407–411. [Google Scholar] [CrossRef]
  19. Rodinkov, O.V.; Vagner, E.A.; Bugaichenko, A.S.; Moskvin, L.N. Comparison of the Efficiencies of Carbon Sorbents for the Preconcentration of Highly Volatile Organic Substances from Wet Gas Atmospheres for the Subsequent Gas-Chromatographic Determination. J. Anal. Chem. 2019, 74, 877–882. [Google Scholar] [CrossRef]
  20. Postnov, V.N.; Rodinkov, O.V.; Kildiyarova, L.I.; Krokhina, O.A.; Yuriev, G.O.; Murin, I.V. Silica-based composite sorbents and multilayer carbon nanotubes. Russ. J. Gen. Chem. 2022, 92, 323–328. [Google Scholar] [CrossRef]
  21. Rodinkov, O.; Postnov, V.; Spivakovskyi, V.; Vlasov, A.; Bugaichenko, A.; Slastina, S.; Znamenskaya, E.; Shilov, R.; Lanin, S.; Nesterenko, P. Comparison of adsorbents containing carbon nanotubes for express pre-concentration of volatile organic compounds from the air flow. Separations 2021, 8, 50. [Google Scholar] [CrossRef]
  22. Rodinkov, O.V.; Moskvin, L.N. Surface-layer composite sorbents for the rapid preconcentration of volatile organic substances from aqueous solutions and gas atmospheres. J. Anal. Chem. 2012, 67, 814–822. [Google Scholar] [CrossRef]
  23. Nesterenko, E.P.; Nesterenko, P.N.; Connolly, D.; He, X.; Floris, P.; Duffy, E.; Paull, B. Nano-particle modified stationary phases for high-performance liquid chromatography. Analyst 2013, 138, 4229–4254. [Google Scholar] [CrossRef] [PubMed]
  24. Peristyy, A.A.; Fedyanina, O.N.; Paull, B.; Nesterenko, P.N. Diamond based adsorbents and their application in chromatography. J. Chromatogr. A 2014, 1357, 68–86. [Google Scholar] [CrossRef] [PubMed]
  25. Rodinkov, O.V.; Bugaichenko, A.S.; Spivakovskyi, V.; Postnov, V.N. Sorption pre-concentration of volatile organic compounds in air analysis with a change in the configuration of the sorption layer in a transition from sorption to thermal desorption. J. Anal. Chem. 2021, 76, 707–713. [Google Scholar] [CrossRef]
  26. UI-Islam, M.; Ullah, M.W.; Khan, S.; Manan, S.; Khattak, W.A.; Ahmad, W.; Shah, N.; Park, J.K. Current advances of magnetic nanoparticles and degradation of organic pollutants. Environ. Sci. Pollut. Res. 2017, 24, 12713–12722. [Google Scholar] [CrossRef]
  27. Yu, M.; Wang, L.; Hu, L.; Yaping, L.; Luo, D.; Mei, S. Recent applications of magnetic composites as extraction adsorbents for determination of environmental pollutants. Trends Anal. Chem. 2019, 119, 115611. [Google Scholar] [CrossRef]
  28. Wang, Q.; Gao, T.; Hao, L.; Guo, Y.; Liu, W.; Guo, L.; Wang, C.; Wang, Z.; Wu, Q. Advances in magnetic porous organic frameworks for analysis and adsorption applications. TrAC Trends Anal. Chem. 2020, 132, 116048. [Google Scholar] [CrossRef]
  29. Sargazi, M.; Kaykhaii, M. Magnetic Covalent Organic Frameworks—Fundamentals and Applications in Analytical Chemistry. Crit. Rev. Ana. Chem. 2022; Online ahead of print. [Google Scholar] [CrossRef]
  30. Gutierrez, A.M.; Dziubla, T.D.; Hilt, J.Z. Recent advances on iron oxide magnetic nanoparticles as sorbents of organic pollutants in water and wastewater treatment. Rev. Environ. Health 2017, 32, 111–117. [Google Scholar] [CrossRef] [Green Version]
  31. Tolmacheva, V.V.; Apyari, V.V.; Kochuk, E.V.; Dmitrienko, S.G. Magnetic adsorbents based on iron oxide nanoparticles for the extraction and preconcentration of organic compounds. J. Anal. Chem. 2016, 71, 321–338. [Google Scholar] [CrossRef]
  32. Lee, P.-L.; Chiu, Y.-K.; Sun, Y.-C.; Ling, Y.-C. Synthesis of a hybrid material consisting of magnetic ironoxide nanoparticles and carbon nanotubes as a gas adsorbent. Carbon 2010, 48, 1397–1404. [Google Scholar] [CrossRef]
  33. Timofeeva, I.; Alikina, M.; Osmolowsky, M.; Osmolowskaya, O.; Bulatov, A. Magnetic headspace adsorptive microextraction using Fe3O4@Cr(OH)3 nanoparticles for effective determination of volatile phenols. New J. Chem. 2020, 44, 8778–8783. [Google Scholar] [CrossRef]
  34. Korolev, D.V. Justification of the use of magnetic nanoparticles for targeted drug delivery to ischemic skeletal muscle. Biotechnosphere 2012, 1, 2–6. [Google Scholar]
  35. ISO 15901-3:2007; Pore Size Distribution and Porosity of Solid Materials by Mercury Porosimetry and Gas Adsorption—Part 3: Analysis of Micropores by Gas Adsorption. ISO: Geneva, Switzerland, 2007. Available online: http://www.iso.org/standard/40364.html (accessed on 28 February 2023).
  36. Klyachko-Gurvich, A.L. An improved method of determining surface area by the adsorption of air. Russ. Chem. Bull. 1961, 10, 756–758. [Google Scholar] [CrossRef]
  37. Platonov, I.A.; Rodinkov, O.V.; Gorbacheva, A.R.; Moskvin, L.N.; Kolesnichenko, I.N. Methods and devices for the preparation of standard gas mixtures. J. Anal. Chem. 2018, 73, 109–127. [Google Scholar] [CrossRef]
  38. Vitenberg, A.G.; Konopel’ko, L.A. Gas chromatographic headspace analysis: Metrological aspects. J. Anal. Chem. 2011, 66, 438–457. [Google Scholar] [CrossRef]
  39. Nemirovskiy, A.M. Calculations in frontal chromatography. Ind. Lab. 1996, 62, 13–18. [Google Scholar]
  40. Satterfield, C.N. Heterogeneous Catalysis in Practice; Mc-Hill Publ: New York, NY, USA, 1980; 416p. [Google Scholar]
  41. Melekhin, A.O.; Tolmacheva, V.V.; Shubina, E.G.; Dmitrienko, S.G.; Apyari, V.V.; Grudev, A.I. Determination of nitrofuran metabolites in honey using a new derivatization reagent, magnetic solid-phase extraction and LC–MS/MS. Talanta 2021, 230, 122310. [Google Scholar] [CrossRef]
  42. Tsysin, G.I.; Kovalev, I.A.; Nesterenko, P.N.; Penner, N.A.; Filippov, O.A. Application of linear model of sorption dynamics to the comparison of solid phase extraction systems of phenol. Sep. Purif. Technol. 2003, 33, 11–24. [Google Scholar] [CrossRef] [Green Version]
  43. Gritti, F.; Guiochon, G. The van Deemter equation: Assumptions, limits, and adjustment to modern high performance liquid chromatography. J. Chromatiogr. A 2013, 1302, 1–13. [Google Scholar] [CrossRef]
  44. Tsizin, G.I. Concerning the Concentration Factor. J. Anal. Chem. 2011, 11, 535. [Google Scholar] [CrossRef] [Green Version]
  45. Loevkvist, P.; Joensson, A. Capacity of sampling and pre-concentration columns with a low number of theoretical plates. Anal. Chem. 1987, 59, 818–821. [Google Scholar] [CrossRef]
  46. Tsizin, G.I.; Statkus, M.A. Sorbtsionnoe Kontsentrirovanie Mikrokomponentov v Dinamicheskikh Usloviyakh (Adsorption Preconcentration of Trace Components under Dynamic Conditions); LENAND: Moscow, Russia, 2016; p. 480. [Google Scholar]
  47. ISO 16017-1:2000; Indoor, Ambient and Workplace Air—Sampling and Analysis of Volatile Organic Compounds by Sorbents Tube/Thermal Desorption/Capillary Gas Chromatography—Part 1: Pumped Sampling Annex F. ISO: Geneva, Switzerland, 2002.
  48. Zhang, S.; Yao, W.; Ying, J.; Zhao, H. Polydopamine-reinforced magnetization of zeolitic imidazolate framework ZIF-7 for magnetic solid-phase extraction of polycyclic aromatic hydrocarbons from the air-water environment. J. Chromatogr. A 2016, 1452, 18–26. [Google Scholar] [CrossRef] [PubMed]
Figure 1. SEM images of adsorbent I (left) and adsorbent II (right).
Separations 10 00416 g001
Figure 2. Surface morphology of adsorbent III (left) and adsorbent IV (right).
Separations 10 00416 g002
Figure 3. The dependence of the HETP of phenol on the linear velocity of air (uG) through a tube filled with adsorbents of particle sizes of 0.18–0.25 mm. The concentration of phenol in the air is 50 mg/m3.
Separations 10 00416 g003
Figure 4. Sorbent magnetization curve obtained for adsorbent I. Hc—coercive force; Ir—residual magnetization; Is—saturation magnetization.
Separations 10 00416 g004
Figure 5. The preconcentration scheme with the configuration changes of the sorption layer geometry. 1—flow of analyzed air; 2—wide sorption tube with magnetically retained adsorbent; 3—magnet; 4—electric aspirator; 5—adapter; 6—narrow thermodesorption tube; 7—flow of carrier gas; 8—thermal desorber with autonomous tubular electric furnace; 9—chromatograph injector, 10—frit at the outlet of the thermodesorption tube.
Separations 10 00416 g005
Figure 6. Dependences of HETP for phenol on the flow rate (WG) of the model gas mixture through tubes with different radii. Adsorbent IV with particles 0.18–0.25 mm was used as packing.
Separations 10 00416 g006
Figure 7. A scheme of the single-step thermal desorption process. 1—carrier gas inlet; 2—rotary three-way switch valve; 3—evaporator of injector; 4—sorption tube; 5—thermal desorber; 6—thermal desorber needle; 7—fine-tuning valve; 8—capillary column inlet.
Separations 10 00416 g007
Figure 8. Chromatogram of phenols after preconcentration from model gas mixture containing 100 μg/m3 of analytes. The conditions of thermal desorption are indicated in the text. 1—phenol; 2—o-cresol. Fused-silica column BPX-1 (10 m × 0.53 mm × 2.65 μm) with a 100% dimethylpolysiloxane coating.
Separations 10 00416 g008
Table 1. Geometric parameters of the columns. (r—radius; S—cross-sectional area; V—internal volume).
Sorption Tube Numberr, cmS, cm2l, cmV, cm3
10.130.05310.20.54
20.180.1025.40.55
30.330.3421.60.55
40.450.6360.880.56
Table 2. Characteristics and sorption properties of the prepared magnetic adsorbents and Carbopacks. Ssp is the specific surface area and dp is the particle size. EMF is an electromagnetic unit (1 emu = 10−3 A∙m2).
Adsorbentdp, μmSsp,
m2/g
Carbon Content, %Hydrophilicity, %Is, emf/gSpecific Retention Volume, dm3/g
Butanol-1Phenol
I50–100201.31.717343230
II100–150266.21.46856420
III180–2509.61.4<0.1411.78.2
IV180–250173.3<0.1553.114
Carbopack C180–25012>980.3-4.329
Carbopack B180–250110>981.3-28340
Carbopack X180–250240>981.5-69730
Table 3. Preconcentration parameters of butanol-1 and phenol from the air flow achieved with tubes of different geometries. Concentrations of analytes—1 mg/m3.
Component, SorbentColumn (Number, Size)WG, mL/minuG,
cm/s
VB, LKcont, minE, min−1
Butanol-1, adsorbent II1; (10.2 × 0.26) cm5020.912.02.2 × 10424091.6
2; (5.4 × 0.36) cm10021.711.32.1 × 104112188
3; (1.6 × 0.66) cm30019.010.61.9 × 10435542
4; (0.88 × 0.9) cm50017.47.71.4 × 10415.4909
Phenol, adsorbent IV1; (10.2 × 0.26) cm5020.91.923.5 × 10338.490.6
2; (5.4 × 0.36) cm10021.72.013.6 × 10320.1.179
3; (1.6 × 0.66) cm30019.01.813.2 × 1036.0533
4; (0.88 × 0.9) cm50017.41.673.0 × 1033.34898
Table 4. Results of the determination of analytes (P = 0.95, n = 3) in the model gas mixtures (100 μg/m3) with a preconcentration on magnetic adsorbents. 1—a traditional scheme; 2—a scheme with a change in the configuration of the sorption layer.
AnalyteSorbentConcentration Time, minFlow Rate, mL/minDetermination Results μg/m3
121212
Butanol-1Adsorbent II202100100096 ± 691 ± 7
Pentanol-198 ± 594 ± 6
PhenolAdsorbent IV3037070089 ± 1083 ± 11
o-Cresol94 ± 895 ± 9
Disclaimer/Publisher’s Note: The statements, opinions and data contained in all publications are solely those of the individual author(s) and contributor(s) and not of MDPI and/or the editor(s). MDPI and/or the editor(s) disclaim responsibility for any injury to people or property resulting from any ideas, methods, instructions or products referred to in the content.

