Article

Solid–Liquid Extraction of Bioactive Molecules from White Grape Skin: Optimization and Near-Infrared Spectroscopy

by
Tea Sokač Cvetnić
,
Korina Krog
,
Maja Benković
,
Tamara Jurina
,
Davor Valinger
,
Jasenka Gajdoš Kljusurić
,
Ivana Radojčić Redovniković
and
Ana Jurinjak Tušek
*
Faculty of Food Technology and Biotechnology, University of Zagreb, Pierottijeva 6, 10000 Zagreb, Croatia
*
Author to whom correspondence should be addressed.
Separations 2023, 10(8), 452; https://doi.org/10.3390/separations10080452
Submission received: 21 July 2023 / Revised: 8 August 2023 / Accepted: 10 August 2023 / Published: 14 August 2023
(This article belongs to the Section Bioanalysis/Clinical Analysis)

Abstract

:
In this work, the solid–liquid extraction of bioactive molecules from grape skin was performed using water as the extraction solvent. The effects of extraction time (t = 60, 75, and 90 min), extraction temperature (T = 40, 60, and 80 °C), solid–liquid phase ratio (S/L = 10, 20, and 30 g/L), and mixing speed (rpm = 250, 500, and 750 1/min) on the total dissolved solids, extraction yield, concentration of total polyphenols, and antioxidant activity were determined using the 1,1-diphenyl-2-picrylhydrazyl (DPPH) and ferric reducing antioxidant power (FRAP) methods. According to response surface modeling, the optimal extraction conditions were t = 75 min, T = 80 °C, S/L = 30 g/L, and rpm = 750 1/min, and under optimal process conditions, 8.38 mgGAE/gd.m. was obtained. Furthermore, the potential of near-infrared (NIR) spectroscopy coupled with artificial neural network (ANN) modeling for prediction of the physical and chemical properties of prepared extracts was also analyzed. The use of ANN modeling demonstrated highly favorable correlations between the NIR spectra and all the variables tested, particularly the total dissolved solids (TDS) and antioxidant activity measured using the FRAP method. As a result, ANN modeling proved to be a valuable tool for predicting the concentration of total polyphenols, the antioxidant activity, and the extraction yield of a plant extract based on its NIR spectra.

1. Introduction

Grape pomace is the main by-product obtained during wine production. It is a good source of polyphenols, metals, and organic acids [1,2]. Studying its biological activity, as well as optimizing the extraction of bioactive components, is of great importance [3] because it can be used as a substrate for some other technological processes that produce new products. It represents 20–25% of the total mass of processed grapes, though this varies depending on the type of grape, the degree of maturity, and the type of press used during processing. According to Spinea and Oroian [4], 1 ton of grape pomace consists of 425 kg of grape skin, 225 kg of seeds, 249 kg of stalks, and other components that are present in a much smaller amount. Due to the increased demand for products of natural origin, pomace has found a wide range of possible uses, from the food industry (in the form of dietary fiber and polyphenols), through the cosmetic industry (where it is used as a biosurfactant), to the pharmaceutical industry (where it is used as a source for nutritional supplements) [5].
During the production of wine, grapes are crushed and pressed, but this has no effect on their chemical composition. The only exception is the fermentation of red wine, during which there are changes in the compositions of carbohydrates, but these are very small changes. It is believed that as much as 70% of the polyphenol content remains preserved in pomace [6]. Polyphenols are one of the most numerous, important, and widespread components in the plant world. They are credited with several properties which positively affect human health, such as anti-inflammatory, antimicrobial, antioxidant, antiplatelet, cardio protective, and vasodilating effects. The polyphenols found in grapes can be divided into three main groups: phenolic acids, flavonoids, and tannins [5,7]. Several preclinical and clinical studies have suggested that chemically synthesized or purified polyphenols do not provide the same biological activity as foods rich in the same compounds. Therefore, the extraction of polyphenols with water is studied in this paper with the aim of using grape pomace as a source of compounds. The polyphenols present in the aqueous extract are absorbed, metabolized, and excreted more quickly and show low bioavailability [8,9]. This constitutes another proof that this by-product can potentially be exploited and that a new production chain may possibly be proposed. However, investment costs for new food chain products are often high, and the use of valuable products in functional foods results in regulatory problems [3].
Extraction techniques and extraction conditions significantly influence the extraction yields, chemical structures, and bioactivities of natural biomolecules. According to the literature, grape skin represents a valuable source of bioactive polyphenols, and it would represent a valuable industrial source to satisfy growing demand [10]. However, the extraction of polyphenols from grape skin presents challenges. To ensure high extraction yields, the literature recommends the use of ethanol and methanol as extraction solvents in classical solid–liquid extractions [11,12] as well as non-conventional extraction methods such as ultrasound-assisted extraction and/or microwave-assisted extraction. Following the principles of green extraction, water can be used as the extraction solvent. Water is considered a low-cost, non-toxic polar solvent, and it has been successfully used to extract a wide spectrum of phenolic compounds with considerable antioxidant capabilities from a number of plant sources [13,14,15].
To obtain detailed insights into the variables affecting extraction efficacy and their interactions over the years, statistical and mathematical modeling methods have been effectively employed. The developed method, along with an analysis of the impacts of various crucial variables on the extraction of bioactive molecules from plant material, can determine the most favorable extraction conditions [16,17]. The traditional one-factor-at-a-time approach, though commonly used, is considered less reliable due to its failure to consider interacting effects among components. Additionally, this approach is time-consuming and costly [18]. To overcome these limitations, the response surface methodology (RSM) has been developed and widely adopted to optimize extraction conditions. The RSM is a sophisticated mathematical technique frequently applied in diverse sectors to optimize specific experimental settings in technical activities. It concurrently evaluates the effects of multiple factors and their interactions on one or more response variables, leading to a reduction in the number of experimental measures required during the extraction of bioactive molecules [16,17,18].
After obtaining plant extracts, it is necessary to identify and quantify their chemical composition. Spectrophotometry, gas chromatography, high-performance liquid chromatography, and capillary electrophoresis methods have been utilized for the identification and quantification of plant extracts [19,20,21]. However, these methods often involve complex sample preparation, leading to time-consuming processes that are not environmentally friendly. To address these challenges and ensure efficient product development and quality control, near-infrared (NIR) spectroscopy has emerged as an accepted approach for the qualitative and quantitative analyses of plant extracts. NIR spectroscopy is considered a non-invasive and rapid method that requires minimal sample preparation. It also enables on-/inline measurements and the simultaneous determination of physical and chemical parameters, and it can be applied to a wide range of samples [22,23,24]. The analysis of NIR spectra can be conducted through the implementation of mathematical models and multivariate analysis techniques, commonly referred to as chemometrics. Among these techniques, artificial neural networks (ANNs) stand out as self-adaptive and massively parallel machine-learning systems. ANNs consist of layers of processing elements (neurons) and are primarily utilized for addressing pattern recognition problems by constructing nonlinear models. These models have the capacity to generalize their findings and predict patterns that have not been encountered before [25,26,27,28].
The objective of this work is to analyze the potential of water as an extraction solvent for bioactive molecules extracted from grape skin and to define the optimal extraction conditions to ensure the highest extraction yield. Furthermore, the potential of NIR spectroscopy coupled with ANN modeling for the prediction of the physical and chemical properties of prepared extracts is also analyzed.

2. Materials and Methods

2.1. Materials

2.1.1. Grape Skin

In this work, the pomace skin of the white grape variety Vitis vinifera cv. Graševina, harvested in 2021 (Kutjevo, Croatia), was used for the analyses. The grape pomace was stored in a freezer at −18 °C before the experiments were conducted. Before carrying out the experiments, the seeds were separated from the skin. To reduce the effect of variations in grape pomace composition, all the pomace was mixed to ensure a homogenous sample. The grape skin dry matter was measured using the AOAC method [29].

2.1.2. Chemicals

Sigma-Aldrich Chemie (St. Louis, MO, USA) provided the TPTZ (2,4,6-tris(2-pyridyl)-s-triazine), gallic acid (98%), iron (II) sulphate heptahydrate, DPPH (1,1-diphenyl-2-picrylhydrazyl), and Trolox (6-hydroxy-2,5,7,8-tetramethylchromane-2 carboxylic acid) (Steinheim, Germany). Gram-Mol d.o.o. supplied the 30% hydrochloric acid, hexahydrate iron (III) chloride, and sodium carbonate (Zagreb, Croatia). J.T. Baker supplied the sodium acetate trihydrate (Deventer, The Netherlands). Kemika d.d. (Zagreb, Croatia) supplied the Folin–Ciocalteu reagent, T.T.T. d.o.o. (Sveta Nedjelja, Croatia) supplied the acetic acid, and Carlo Erba Reagents S.A.S. supplied the methanol (Peypin, France). The chemicals used were analytical reagent-grade.

2.2. Methods

2.2.1. Solid–Liquid Extraction

The prepared extraction mixture was thermostated at a defined temperature in an oil bath (IKA-Werk GmbH & Co. KG, Staufen, Germany) at a certain mixing speed for a given time [16,30]. The extraction experiments were performed according to the conditions defined by the Box–Behnken experimental plan (Table 1). The effects of extraction time (t = 60, 75, and 90 min), extraction temperature (T = 40, 60, and 80 °C), solid–liquid phase ratio (S/L = 10, 20, and 30 g/L), and mixing speed (rpm = 250, 500, and 750 1/min) on the proportion of polyphenols in the extracts was tested. The independent variable scales were selected based on data concerning bioactive extraction conditions for grape residues obtained from the available literature [31,32,33]. After extraction, the sample was filtered through a 100% cellulose paper filter (pore size 5–13 µm, LLG Labware, Meckenheim, Germany) to separate the aqueous extract from the solid phase. The physical and chemical properties of the extracts were then determined.

2.2.2. Physical Properties of the Extracts

The pH values of the prepared aqueous extracts were measured using a pH meter (pH meter, 914, Metrohm, Switzerland). The conductivities and total dissolved solids of the prepared extracts were measured using a conductometer (SevenCompact, MettlerToledo, Switzerland). The extraction yield was measured using the AOAC method [29].The color of each extract was determined using a PCE-CSM3 colorimeter (PCE Instruments, Meschede, Germany). According to Hunter’s color coordinates, L represents light, a represents the range from green to red, and b represents the range from blue to yellow. The measurements of the physical properties of the extracts were performed with three repetitions, and the results are presented as mean values ± standard deviations.

2.2.3. Total Phenolic Content and Antioxidant Activity of the Extracts

The total polyphenols were determined spectrophotometrically according to a method based on the colorimetric reaction of phenol with the Folin–Ciocalteu reagent [34], and the results are expressed as mg of gallic acid equivalents (GAE) per gram of dry matter in the sample. The antioxidant activity was measured using the DPPH and FRAP methods. The DPPH method involves the reduction of the 2,2-diphenyl-2-picrylhydrazyl (DPPH) radical in a methanol solution in accordance with the procedure described by Brand-Williams et al. [35]. The results are expressed as mmol equivalents of Trolox per gram of dry matter in the sample. The FRAP method involves the reduction of the colorless complex of iron (III) tripyridyltriazine (Fe3+-TPTZ) to the ferro form (Fe2+), which is an intense blue color, in accordance with the procedure described by Benzie and Strain [36]. The FRAP results are expressed as the mmol equivalent of FeSO4·7H2O per gram of dry matter in the sample. The chemical properties of the extracts were measured with three repetitions, and the results are presented as mean values ± standard deviations.

2.2.4. Near-Infrared Spectroscopy

A NIR spectrophotometer (NIR-128L-1.7-USB/6.25/50 μm, Control Development, South Bend, IN, USA) with a built-in halogen light source and Spec32 software Version 1.5 installed was used to measure the near-infrared spectra of the prepared extracts (a total of 30 samples). The cuvette was placed into a dark holder to prevent the light scattering. The instrument had a halogen light source and a built-in wavelength calibration module based on light and dark background scatter. The complete spectral range (904–1699 nm) was covered by performing three consecutive runs for each sample.

2.2.5. Data Analysis and Modelling

All the measurements of the physical and chemical properties of the prepared extracts in this work were performed in three parallel experiments, and a basic statistical analysis (mean and standard deviation) was performed using the Statistica 14.0 software package (TIBCO® Statistica, Palo Alto, CA, USA). Correlations or associations between the physical and chemical properties of the samples and the extraction conditions were analyzed using the correlation matrix in the Statistica 14.0 software package. In addition, the mean values of the physical and chemical characteristics of the samples prepared under different extraction conditions were compared via analysis of variance (ANOVA) in the Statistica 14.0 software package.

2.2.6. Design of Experiments and Extraction Optimization

The effects of four independent variables (extraction time (X1), extraction temperature (X2), solid–liquid ratio (X3), and mixing speed (X4)) were evaluated using a Box–Behnken design implemented in the Statistica 14.0 software package. The simultaneous optimization of two physical (TDS, Y) and three chemical properties (TPC, DPPH, FRAP) of the aqueous grape skin extracts was performed. The effect of each parameter was analyzed at three levels (−1, 0, 1), and, according to the experimental design, 30 experiments were performed randomly (Table 1). Second-order polynomial equations were used to fit the experimental data. Response surface modeling was performed using the Statistica 14.0 software package (TIBCO® Statistica, Palo Alto, CA, USA). The optimal extraction conditions were estimated based on the proposed RSM models.

2.2.7. Near-Infrared Red Data Analysis and Modeling

A principal component analysis (PCA) of raw NIR spectra in wave ranges from 904–997 nm to 1338–1699 nm was performed using Statistica 14.0 (TIBCO® Statistica, Palo Alto, CA, USA).
Artificial neural network (ANN) modeling was used to obtain the following: (i) predictions of the physical properties of the grape skin aqueous extracts (total dissolved solids and extraction yield); (ii) predictions of the chemical properties of the grape skin aqueous extracts (TPC, DPPH, and FRAP); and (iii) simultaneous predictions of the aforementioned physical and chemical properties of the grape skin aqueous extracts based on raw NIR spectra. Multiple layer perceptron (MLP) networks were developed using the Statistica 14.0 software (TIBCO® Statistica, Palo Alto, CA, USA). The ANNs consisted of three layers: input, hidden, and output. The developed ANNs included five neurons in the input layer which represented the coordinates of the first four factors obtained from the PCA analysis. To obtain robust and accurate ANN models, the selection of the input data set is very important. When using the PCA method for input data selection, the main problem that arises is how to determine which PCs—and how many of them—will constitute a good subset for predictive purposes [37]. In this work, top-down variable selection was used. The PC factors were ranked in order of decreasing eigenvalues. When the PCA was applied to a data set, 75 factors achieved 100% data presentation quality. The factors with the highest eigenvalues were considered the most significant ones, and, subsequently, these factors were introduced into the calibration model until no further improvement of the calibration model was obtained [38]. According to the PC analysis, 99.7% of the variances in the original data set were explained by the first five extracted PCs. These PCs were used in the feature analyses. PC1 had the most information about the original data set, PC2 had less information, and so on. The number of neurons in the hidden layer ranged from 4 to 13 and was randomly selected by the algorithm. Identity, logistic, hyperbolic tangent, and exponential functions were randomly selected as hidden activation functions and output activation functions. The data set used to construct the ANNs was 90 × 10, with 90 rows representing the aqueous grape skin extracts, 5 columns representing the 5 PCA coordinates (factors), and 5 columns representing the results for total dissolved solids, extraction yield, TPC, DPPH, and FRAP. Cross-validation in Statistica 14.0 (TIBCO® Statistica, Palo Alto, CA, USA) was used to ensure the development of the relabel models. A subsampling strategy was used. A total of 1000 seeds were used for 5 random subsamples. The back error propagation algorithm was used for model training, and the error function was the sum of squares. R2 and root mean squared error (RMSE) values for training, testing, and validation were used to evaluate the performance of the developed models. For the development of the ANN, data were randomly divided into three categories: network training (70%—63 data points), model testing (15%—14 data points), and model validation (15%—13 data points).

3. Results and Discussion

3.1. Physical and Chemical Properties of the Grape Skin Aqueous Extracts

In this work, classical solid–liquid extraction of biologically active components from grape skins was performed. Polyphenols are among the biological components in which there is great interest due to their numerous positive and beneficial effects, such as antioxidant, anti-inflammatory, and antibacterial effects. Water was used as the extraction solvent.
To ensure optimal conditions for carrying out the extraction procedure, 30 experiments were conducted under different conditions. The physicochemical properties of the prepared extracts were analyzed, and the results are presented in Table 1, Table 2 and Table 3. From analyzing the results presented in Table 1, it can be seen that the lowest pH (3.69) occurred in experiment number 26 (t = 75 min, T = 80 °C, S/L = 20 g/L, rpm = 750 1/min), and the highest (4.07) occurred in experiment number 14 (t = 75 min, T = 40 °C, S/L = 10 g/L, rpm = 500 1/min). In general, the pH of the extracts did not differ significantly under the various extraction conditions. Similar grape skin pH values, ranging from 3.3 to 3.54, were presented in the work of Yeler and Nas [39]. The lowest values for conductivity and total dissolved solids were observed in experiment No. 19 (t = 60 min, T = 60 °C, S/L = 10 g/L, rpm = 500 1/min), and the highest values were observed in experiment No. 8 (t = 75 min, T = 60 °C, S/L = 30 g/L, rpm = 750 1/min); it can therefore be inferred that increases in the solid–liquid ratio and mixing speed contribute to an increase in the percentage of total dissolved solids [40,41]. Moreover, the lowest extraction efficiency was obtained under the conditions of experiment No. 5 (t = 75 min, T = 60 °C, S/L = 10 g/L, rpm = 250 1/min), and the highest extraction efficiency was obtained under the conditions of experiment No. 17 (t = 75 min, T = 80 °C, S/L = 30 g/L, rpm = 500 1/min), again indicating that increases in the solid–liquid ratio and mixing speed contribute to an increase in the extraction efficiency [42].
Changing the extraction conditions also affects the color of the final extract. The CIELab colorimetric system was used for the colorimetric analysis. The L value describes the brightness of a single pixel and is expressed in numerical values from 0 (black, completely dark) to 100 (white, completely bright). The a value describes the position of the sample on the axis extending between green and red, and the b value describes the position of the sample on the axis extending between blue and yellow. Neither axis has a numerical limit; they are described by indicating a negative or positive sign. The smaller the a value, i.e., the more negative the number, the more the color moves toward green, while the b value moves the color toward blue. When the values do not have a negative sign, a tends toward red and b toward yellow [43]. From the results in Table 2, it can be concluded that all the prepared samples have very similar L coordinates; the minimum change in L coordinate value is 40.81 (experiment 3: t = 60 min, T = 80 °C, S/L = 20 g/L, rpm = 500 1/min) and the maximum is 47.79 (experiment 23: t = 75 min, T = 40 °C, S/L = 20 g/L, rpm = 250 1/min). The lowest a and b coordinate values were measured for the extract prepared according to the conditions of experiment 3, and this extract therefore had a yellow–green color.
The chemical properties were also studied under different conditions, such as temperature, mixing speed, extraction time, and solid–liquid ratio. The total amount of polyphenols and the antioxidant activity using the DPPH and FRAP methods of grape skin extracts were analysed. Table 3 shows that the highest amount of polyphenols (8.24 mgGAE/gd.m.) was extracted under the conditions of experiment No. 17 (t = 75 min, T = 80 °C, S/L = 30 g/L, rpm = 500 1/min), in which the mass fraction of dry matter was the highest. In contrast, under the conditions of experiment No. 14 (t = 75 min, T = 40 °C, S/L = 10 g/L, rpm = 500 1/min), the amount of extracted phenols was 7.6 times lower (1.09 mgGAE/gd.m.). The above experimental conditions differed in temperature and solid–liquid ratio, and the results show that increasing the temperature and solid–liquid ratio has a positive effect on the concentration of extracted polyphenols [32]. The extracted polyphenol concentrations we obtained were consistent with those found in the available literature. For example, Libran et al. [32] reported an extraction efficiency of 5 mgGAE/gd.m. from white grape skins, Yammine et al. [44] reported an extraction efficiency of 3.07 mgGAE/gd.m., and Gerardi et al. [3] reported a polyphenol extraction efficiency of 1.2–3.07 mgGAE/gd.m. However, it is important to mention that in all the above experiments, ethanol was used as the extracting agent. The lowest antioxidant activity obtained using the DPPH method (only 0.0003 mmolTrolox/gd.m.) came from extracts prepared according to the conditions of experiment No. 19 (t = 60 min, T = 60 °C, S/L = 10 g/L, rpm = 500 1/min). Significantly higher DPPH values were obtained after experiment No. 17 (t = 75 min, T = 80 °C, S/L = 30 g/L, rpm = 500 1/min). The highest results obtained using the FRAP method were also from experiment No. 17, but the lowest, in contrast to the DPPH method, were observed under the conditions of experiment No. 14 (t = 75 min, T = 40 °C, S/L = 10 g/L, rpm = 500 1/min).
Table 4 summarizes the results of experiments involving the water–solid–liquid extraction of polyphenols from different plant substrates published in the literature. Water has been shown to be an efficient solvent for the extraction of polyphenols.
To better illustrate the interdependence of these parameters and conditions, a correlation matrix between the physical and chemical properties of the grape skin extracts was prepared, and this is presented in Table 5, where significant correlations (p < 0.05) are marked in bold. As can be seen, there are no significant positive correlations for pH, but the solid–liquid ratio has the greatest negative effect on pH, followed by temperature and mixing speed. In contrast to pH, conductivity and total dissolved solids are positively correlated with solid–liquid ratio, temperature, and mixing speed, while conductivity and total dissolved solids decrease as pH increases. Consequently, an increase in conductivity leads to an increase in total dissolved solids. In addition, the L coordinate measured when determining the color of the sample is negatively affected by pH, conductivity, and total solutes. Coordinate a, on the other hand, changes positively as conductivity and total solutes increase, and negatively as coordinate L increases. Coordinate b increases with temperature and coordinate a increase, and it decreases as coordinate L increases. Chroma increases with temperature, coordinate L, and coordinate b, and it decreases as pH and coordinate a increase. The chroma angle depends on a number of parameters. Its value is negatively affected by pH, conductivity, total solute, and the a and b values; it is positively affected only by the L coordinate and the chroma value. The amount of extracted polyphenols was influenced by the solid–liquid ratio (an increase in the former leads to an increase in the latter), and positive correlations were observed between the amount of extracted polyphenols and the mass fraction of dry matter, conductivity, total solutes, temperature, and chroma value; the only significant negative correlation is with pH. The antioxidant activity, whether measured using the DPPH method or the FRAP method, was positively related to most of the parameters (i.e., temperature, solid–liquid ratio, conductivity, total solutes, mass fraction of dry matter, b coordinate, chroma value, and total polyphenols). The only difference in the correlations obtained using the two methods was observed in the mixing rate, which had no significant effect on antioxidant activity when determined using the DPPH method, but which had a significant positive correlation when determined using the FRAP method.
Table 6 shows the results of the one-way analysis of variance that was applied to the analysis of the physicochemical characteristics of the grape skin extract samples. It can be seen that extraction time caused a change in pH only at 75 min of extraction, and not at 60 or 90 min, while no other parameter had a significant effect. In addition, it was shown that temperatures of 40 and 60 °C had about the same effect on all the measured parameters, but when we increased the temperature to 80 °C, there were more significant changes in the measured values. Changing the solid–liquid ratio had a significant effect on every parameter except antioxidant activity when measured using the DPPH method, where ratios of 10 and 20 g/L had about the same effect, but a ratio of 30 g/L caused greater changes in the DPPH values. However, changes in the mixing rate proved to be insignificant for every chemical parameter, as did the mass fraction of dry matter, and for pH, conductivity, and total dissolved solids, the mixing rate caused significant changes only at 750 1/min.

3.2. Extraction Process Optimization

The aim of using the response surface method was to determine the optimal conditions for the solid–liquid extraction of bioactive components from white grape skin. The influences of four variables (extraction time, extraction temperature, solid–liquid phase ratio, and mixing speed) on total dissolved solids, extraction yield, total polyphenol concentration, and antioxidant activity (determined using the DPPH and FRAP methods) were analyzed at three levels (extraction time: t = 60, 75, and 90 min; extraction temperature: T = 40, 60, and 80 °C; solid–liquid phase ratio: S/L = 10, 20, and 30 g/L; and mixing speed: rpm = 250, 500, and 750 1/min).
Second-degree polynomials with interaction terms were used to describe the experimental data (Table 7). For the proposed models, high agreement was obtained between the experimental values and the values predicted by the model, expressed as R2 (Y) = 0.64, R2 (TDS) = 0.75, R2 (DPPH) = 0.75, and R2 (FRAP) = 0.95. According to Le Man et al. [49], a model can be considered applicable if the coefficient of determination describing the difference between the experimental values and the values predicted by the model exceeds 0.75. Based on this assumption, it can be concluded that the developed response surface model is suitable for describing all the analyzed physical and chemical properties of the prepared grape skin extracts, except extraction yield. The developed response surface models for extraction yield need improvement. It can be seen from Table 7 that the linear terms for extraction temperature (X2), solid–liquid phase ratio (X3), and mixing rate (X4), as well as their interaction coefficients, are highly significant (p < 0.05 for the initial variables analyzed). The results show that the extraction time was not significant (p > 0.05). This could be explained by the selection of the independent variable scale based on the available literature. To obtain a detailed understanding of the extraction mechanism, an analysis of the extraction kinetics should be performed via a dynamic experiment. The positive influence of the extraction temperature on the polyphenol yield has been previously described by several authors [10,50,51]. Antony et al. [52] reported that, when using traditional extraction methods, the highest yield of polyphenols is obtained at 60–80 °C, and that the yield of polyphenols decreases at temperatures above 80 °C. In addition, the solid–liquid ratio has a significant effect on polyphenol yield [53]. According to the mass transfer principle, the concentration gradient, which increases as the volume of the extraction solution increases, determines how fast the chemicals diffuse from the sample into the solvent at a given rate [54].
The optimization of the extraction conditions was performed simultaneously for the physical and chemical properties of the extracts based on the desirability profiles obtained from the RSM predicted values. A desirability scale ranging from 0 (undesirable) to 1 (highly desirable) was used, and the optimization matrix design showed that the conditions required to obtain the optimal physical and chemical properties of the grape skin extract were t = 75 min, T = 80 °C, S/L = 30 g/L, and rpm = 750 1/min. The model was validated using an independent experiment under optimal process conditions, and good agreement was obtained between the data predicted by the model and the experimental data, as is shown in Table 8.

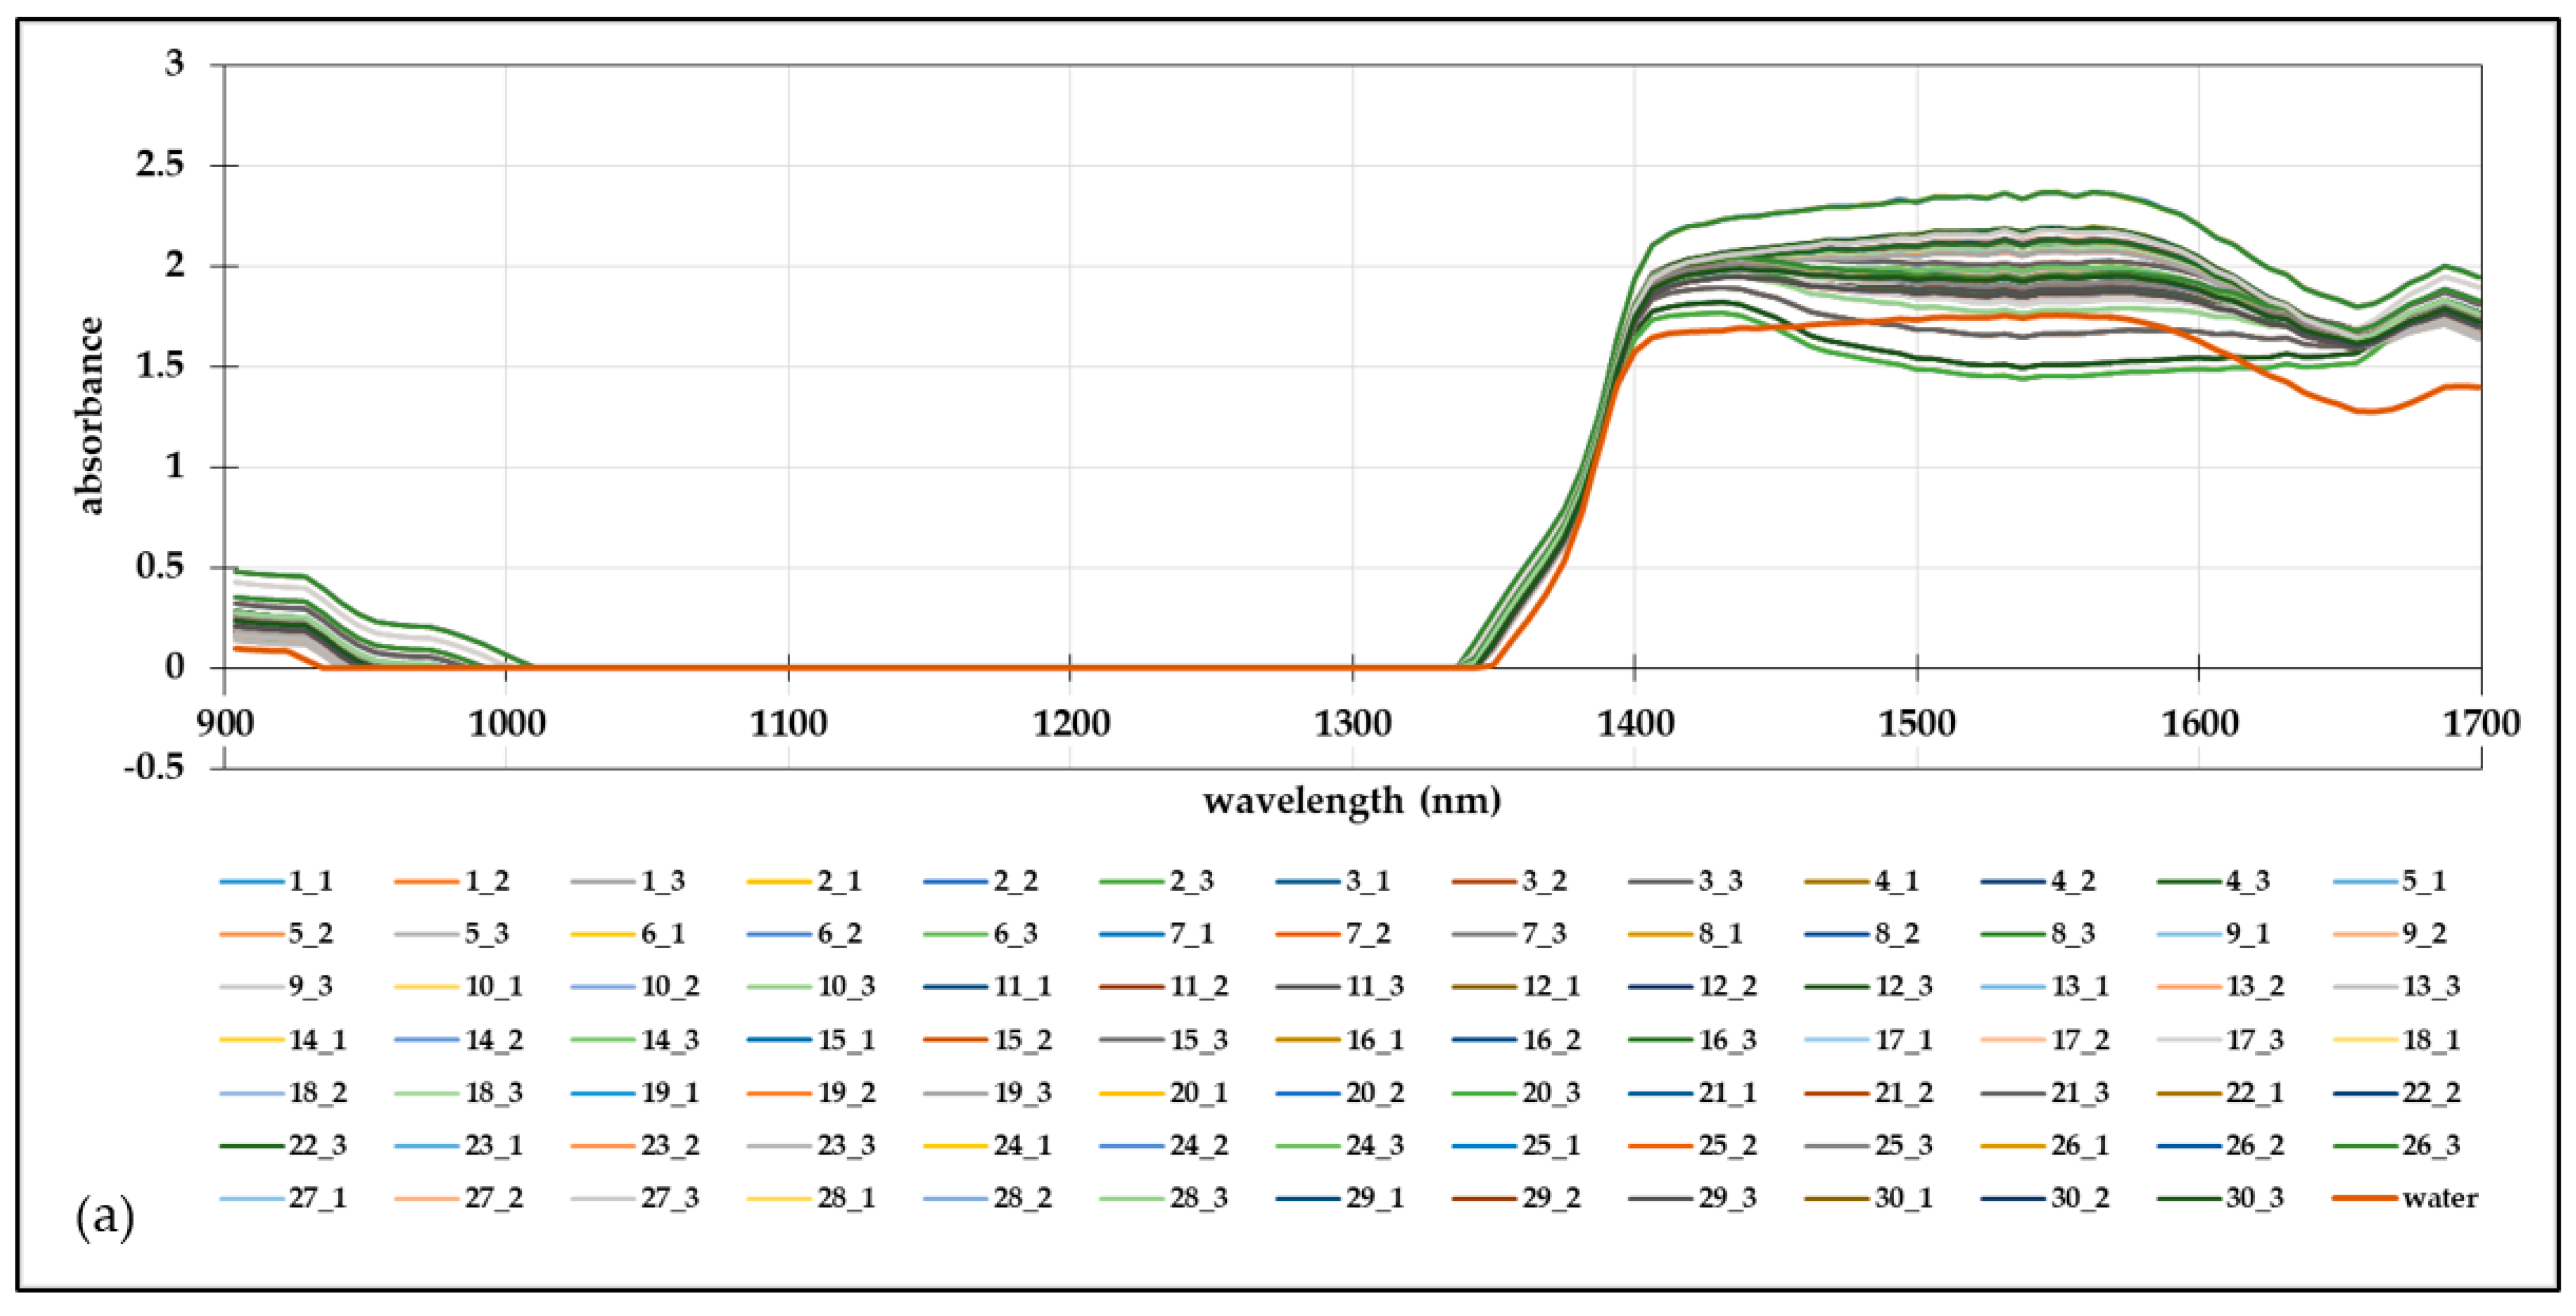
3.3. Near-Infrared Spectra Analysis and Modeling

In this work, an analysis of the NIR spectra of the grape skin extracts prepared according to the experimental design in 30 independent experiments was performed. The continuous NIR spectra were recorded in the wavelength range of 904–1699 nm. Figure 1a shows the raw spectra for all the prepared extracts and for pure water, thus providing valuable insights into the extracted components and their intensity. The accurate analysis of the NIR spectra of samples with potential antioxidant activity is very important for predicting the spectra of new components, understanding changes in the color of plant species, and understanding the ability of molecules to undergo chemical changes in the NIR range [55]. It was observed that in the NIR region there was a significant jump in absorption in the wavelength ranges of 900–950 nm and 1400–1600 nm. The reported wavelength ranges indicate that C-H and O-H bonds were detected in the samples, which, given the nature of their preparation, suggests that the samples contained water. The wavelength range of 1410–1600 nm indicates that C-H bonds were present in the sample, suggesting that the samples contained phenols and antioxidants [56]. It is also worth highlighting that a straight spectral line was observed in all 30 prepared extracts, extending in the wavelength range of 930–1350 nm and indicating the absence of N-H bonds, i.e., proteins [57]. It should also be noted that the spectra of the prepared extracts followed the trend of the spectrum of pure water, but the absorption maxima differed in the wavelength range of 1410–1700 nm. The grape skin extracts show a higher absorption maximum than pure water, as expected.
The principal component analysis method was used to visualize the relationships between the prepared grape skin extracts based on the NIR spectra since the extracts were prepared under different process conditions (extraction time, extraction temperature, solid–liquid phase ratio, and mixing speed). The goal of a PCA is to extract the maximum variance from the data set with each component. The first principal component is a linear combination of observables that maximally separates the data, while all subsequent components are linear combinations of observables that do not correlate with the first component. The first component extracts the greatest variance, and the last component extracts the least. The PCA analysis of the NIR spectra of the aqueous grape skin extracts was performed for the wavelength ranges of 904–997 nm and 1338–1699 nm. The results show that the first two PCA components accounted for 97.35% of the variability of the data and show the grouping of the samples according to the extraction temperature. These results confirm once again the importance of the impact of the extraction temperature on the physical and chemical properties of the extracts.
The coordinates of the first five factors of the PCA analysis were used as input variables for the prediction of selected physical and chemical properties of the aqueous grape skin extracts via neural network modeling. Table 9 shows the architectures of the networks selected for the predictions of the physical and chemical properties of the aqueous grape skin extracts. Table 9 shows the goodness of fit for the output variables of the ANN models. For the prediction of the physical properties of the prepared extracts, the MLP 5-8-2 network was selected; this network has the hidden activation function tanh and the logistic function as the output activation function. The learning, testing, and validation R2 values for this model were 0.9533, 0.9507, and 0.9189, respectively, and the respective RMSE values were 0.0083, 0.0059, and 0.0068. According to the results presented in Table 8, the selected ANN model described the total dissolved solids of the prepared extracts more accurately (R2validation = 0.9617) that it described the extraction yield (R2validation = 0.8749). To describe and predict the chemical properties of grape skin extracts, the MLP 5-9-3 network was chosen; this network has the hidden activation function tanh and the logistic function as the output activation function. The learning, testing, and validation accuracies for this network were 0.9862, 0.9521 and 0.9371, respectively. Based on the goodness of fit (Table 9), this network described all three of the analyzed chemical properties of the extracts with high accuracy (R2validation (FRAP) = 0.9841, R2validation (TPC) = 0.9604, and R2validation (DPPH) = 0.9841). Considering the nonlinear nature of the ANN model, an additional ANN model was developed for the simultaneous prediction of selected physical and chemical properties of the grape skin extracts. For the simultaneous prediction of the physical and chemical properties of the grape skin extracts, an MLP 5-7-5 network with the logistic function as the hidden activation function and the logistic function as the output activation function was chosen. The learning, testing, and validation accuracies for this network were 0.9035, 0.8901, and 0.8166, respectively. Compared with the two previously developed models, this model had slightly lower values for accuracy, but it can still be used for predictions. According to the results presented in Table 10, the most accurate predictions produced by the MLP 5-7-5 network were those for FRAP (R2validation = 0.9285), followed by those for TDS (R2validation = 0.9275) and extraction yield (R2validation = 0.7729). The results show that the highest discrepancy between the ANN model predictions and the experimental data was obtained for TPC (R2validation = 0.6909). The obtained results indicate the high potential of NIR spectroscopy coupled with ANN modeling for predicting the physical and chemical properties of plant aqueous extracts, as did the results obtained by Valinger et al. [58].

4. Conclusions

After response surface modeling, the following optimal extraction conditions were determined: extraction time (t): 75 min; temperature (T): 80 °C; solid–liquid ratio (S/L): 30 g/L; and rotations per minute (rpm): 750. It was found that the extraction temperature, solid–liquid ratio, and mixing speed significantly affected the extraction yield. These conditions resulted in a yield of 8.38 mgGAE/gd.m. under the optimal process settings. In addition, the potential of near-infrared spectroscopy (NIR) coupled with artificial neural network (ANN) modeling to predict the physical and chemical properties of the prepared extracts was investigated. The use of ANN modeling showed very favorable correlations between the NIR spectra and all the tested variants, especially in terms of total dissolved solids (TDS) and antioxidant activity measured using the FRAP method. Therefore, ANN modeling was shown to be a valuable tool for predicting the total concentration of polyphenols, the antioxidant activity, and the extraction yield of a plant extract based on its NIR spectra.

Author Contributions

Conceptualization, T.S.C. and A.J.T.; methodology, M.B.; formal analysis, T.S.C. and K.K.; writing—original draft preparation, T.S.C., K.K. and T.J.; writing—review and editing, A.J.T. and M.B.; visualization, D.V.; supervision, J.G.K.; project administration, I.R.R.; funding acquisition, I.R.R. All authors have read and agreed to the published version of the manuscript.

Funding

This work was supported by the European Union through the European Regional Development Fund, Competitiveness and Cohesion 2014–2020 (KK.01.1.1.07.0007.).

Data Availability Statement

Not applicable.

Acknowledgments

The authors warmly acknowledge the supported provided by the European Union through the European Regional Development Fund, Competitiveness and Cohesion 2014–2020 (KK.01.1.1.07.0007.).

Conflicts of Interest

The authors declare no conflict of interest.

References

  1. Perra, M.; Bacchetta, G.; Muntoni, A.; De Gioannis, G.; Castangia, I.; Rajha, H.N.; Manca, M.L.; Manconi, M. An Outlook on Modern and Sustainable Approaches to the Management of Grape Pomace by Integrating Green Processes, Biotechnologies and Advanced Biomedical Approaches. J. Funct. Foods 2022, 98, 105276. [Google Scholar] [CrossRef]
  2. Mendes, J.A.S.; Prozil, S.O.; Evtuguin, D.V.; Lopes, L.P.C. Towards Comprehensive Utilization of Winemaking Residues: Characterization of Grape Skins from Red Grape Pomaces of Variety Touriga Nacional. Ind. Crop. Prod. 2013, 43, 25–32. [Google Scholar] [CrossRef]
  3. Gerardi, C.; D’amico, L.; Migoni, D.; Santino, A.; Salomone, A.; Carluccio, M.A.; Giovinazzo, G. Strategies for Reuse of Skins Separated from Grape Pomace as Ingredient of Functional Beverages. Front. Bioeng. Biotechnol. 2020, 8, 645. [Google Scholar] [CrossRef] [PubMed]
  4. Spinei, M.; Oroian, M. The Potential of Grape Pomace Varieties as a Dietary Source of Pectic Substances. Foods 2021, 10, 867. [Google Scholar] [CrossRef] [PubMed]
  5. Beres, C.; Costa, G.N.S.; Cabezudo, I.; da Silva-James, N.K.; Teles, A.S.C.; Cruz, A.P.G.; Mellinger-Silva, C.; Tonon, R.V.; Cabral, L.M.C.; Freitas, S.P. Towards Integral Utilization of Grape Pomace from Winemaking Process: A Review. Waste Manag. 2017, 68, 581–594. [Google Scholar] [CrossRef] [PubMed]
  6. Gutiérrez-Escobar, R.; Aliaño-González, M.J.; Cantos-Villar, E. Wine Polyphenol Content and Its Influence on Wine Quality and Properties: A Review. Molecules 2021, 26, 718. [Google Scholar] [CrossRef]
  7. Fontana, A.R.; Antoniolli, A.; Bottini, R. Grape Pomace as a Sustainable Source of Bioactive Compounds: Extraction, Characterization, and Biotechnological Applications of Phenolics. J. Agric. Food Chem. 2013, 61, 8987–9003. [Google Scholar] [CrossRef]
  8. Vamanu, E.; Gatea, F.; Pelinescu, D.R. Bioavailability and Bioactivities of Polyphenols Eco Extracts from Coffee Grounds after in Vitro Digestion. Foods 2020, 9, 1281. [Google Scholar] [CrossRef]
  9. Brglez Mojzer, E.; Knez Hrnčič, M.; Škerget, M.; Knez, Ž.; Bren, U. Polyphenols: Extraction Methods, Antioxidative Action, Bioavailability and Anticarcinogenic Effects. Molecules 2016, 21, 901. [Google Scholar] [CrossRef]
  10. Giovanna, B.; Giulio, F.; Cristina, M.; Carini, M.; Paolo, M.; Aldini, G. Effect of Extraction Solvent and Temperature on Polyphenol. Molecules 2021, 26, 5454. [Google Scholar]
  11. Castellanos-Gallo, L.; Ballinas-Casarrubias, L.; Espinoza-Hicks, J.C.; Hernández-Ochoa, L.R.; Muñoz-Castellanos, L.N.; Zermeño-Ortega, M.R.; Borrego-Loya, A.; Salas, E. Grape Pomace Valorization by Extraction of Phenolic Polymeric Pigments: A Review. Processes 2022, 10, 469. [Google Scholar] [CrossRef]
  12. Amendola, D.; De Faveri, D.M.; Spigno, G. Grape Marc Phenolics: Extraction Kinetics, Quality and Stability of Extracts. J. Food Eng. 2010, 97, 384–392. [Google Scholar] [CrossRef]
  13. Goldsmith, C.D.; Vuong, Q.V.; Stathopoulos, C.E.; Roach, P.D.; Scarlett, C.J. Optimization of the Aqueous Extraction of Phenolic Compounds from Olive Leaves. Antioxidants 2014, 3, 700–712. [Google Scholar] [CrossRef] [PubMed] [Green Version]
  14. Martiny, T.R.; Dotto, G.L.; Raghavan, V.; de Moraes, C.C.; da Rosa, G.S. Freezing Effect on the Oleuropein Content of Olive Leaves Extracts Obtained from Microwave-Assisted Extraction. Int. J. Environ. Sci. Technol. 2021, 19, 10375–10380. [Google Scholar] [CrossRef]
  15. Valinger, D.; Kušen, M.; Benković, M.; Jurina, T.; Panić, M.; Redovniković, I.R.; Kljusurić, J.G.; Tušek, A.J. Enhancement of the Green Extraction of Bioactive Molecules from Olea Europaea Leaves. Separations 2022, 9, 33. [Google Scholar] [CrossRef]
  16. Jurinjak Tušek, A.; Benković, M.; Valinger, D.; Jurina, T.; Belščak-Cvitanović, A.; Gajdoš Kljusurić, J. Optimizing Bioactive Compounds Extraction from Different Medicinal Plants and Prediction through Nonlinear and Linear Models. Ind. Crop. Prod. 2018, 126, 449–458. [Google Scholar] [CrossRef]
  17. Valinger, D.; Jurina, T.; Benković, M.; Gajdoš Kljusurić, J.; Jurinjak Tušek, A. Mathematical Modelling and Optimisation in Solid-Liquid Extractions of Bioactives from Medicinal Plants. In Medicinal Plants; Semwal, D.K., Ed.; Nova Science Publishers, Inc.: New York, NY, USA, 2021; p. 63117. ISBN 9781624170713. [Google Scholar]
  18. Abu Bakar, F.I.; Abu Bakar, M.F.; Abdullah, N.; Endrini, S.; Fatmawati, S. Optimization of Extraction Conditions of Phytochemical Compounds and Anti-Gout Activity of Euphorbia hirta L. (Ara Tanah) Using Response Surface Methodology and Liquid Chromatography-Mass Spectrometry (LC-MS) Analysis. Evid. -Based Complement. Altern. Med. 2020, 2020, 4501261. [Google Scholar] [CrossRef] [Green Version]
  19. Cong-Cong, X.; Bing, W.; Yi-Qiong, P.; Jian-Sheng, T.; Tong, Z. Advances in Extraction and Analysis of Phenolic Compounds from Plant Materials. Chin. J. Nat. Med. 2017, 15, 721–731. [Google Scholar] [CrossRef]
  20. Tsibranska, I.; Tylkowski, B. Solid-Liquid Extraction of Bioactive Compounds: Effect of Polydispersity and Particle Size Evolution. J. Chem. Technol. Metall. 2016, 51, 489–499. [Google Scholar]
  21. Khoddami, A.; Wilkes, M.A.; Roberts, T.H. Techniques for Analysis of Plant Phenolic Compounds. Molecules 2013, 18, 2328–2375. [Google Scholar] [CrossRef] [Green Version]
  22. Yusnaini, R.; Ikhsan, I.; Idroes, R.; Munawar, A.A.; Arabia, T.; Saidi, N.; Nasution, R. Near-Infrared Spectroscopy (NIRS) as an Integrated Approach for Rapid Classification and Bioactive Quality Evaluation of Intact Feronia Limoni. IOP Conf. Ser. Earth Environ. Sci. 2021, 667, 012028. [Google Scholar] [CrossRef]
  23. Tadmor Shalev, N.; Ghermandi, A.; Tchernov, D.; Shemesh, E.; Israel, A.; Brook, A. NIR Spectroscopy and Artificial Neural Network for Seaweed Protein Content Assessment In-Situ. Comput. Electron. Agric. 2022, 201, 107304. [Google Scholar] [CrossRef]
  24. Wulandari, L.; Retnaningtyas, Y.; Nuri; Lukman, H. Analysis of Flavonoid in Medicinal Plant Extract Using Infrared Spectroscopy and Chemometrics. J. Anal. Methods Chem. 2016, 2016, 4696803. [Google Scholar] [CrossRef] [PubMed] [Green Version]
  25. Basile, T.; Marsico, A.D.; Perniola, R. Use of Artificial Neural Networks and NIR Spectroscopy for Non-Destructive Grape Texture Prediction. Foods 2022, 11, 281. [Google Scholar] [CrossRef] [PubMed]
  26. Daniels, A.J.; Poblete-Echeverría, C.; Nieuwoudt, H.H.; Botha, N.; Opara, U.L. Classification of Browning on Intact Table Grape Bunches Using Near-Infrared Spectroscopy Coupled with Partial Least Squares-Discriminant Analysis and Artificial Neural Networks. Front. Plant Sci. 2021, 12, 768046. [Google Scholar] [CrossRef] [PubMed]
  27. Curto, B.; Moreno, V.; García-Esteban, J.A.; Blanco, F.J.; González, I.; Vivar, A.; Revilla, I. Accurate Prediction of Sensory Attributes of Cheese Using Near-Infrared Spectroscopy Based on Artificial Neural Network. Sensors 2020, 20, 3566. [Google Scholar] [CrossRef]
  28. Ali, K.A.; Moses, W.J. Application of a PLS-Augmented ANN Model for Retrieving Chlorophyll-a from Hyperspectral Data in Case 2 Waters of the Western Basin of Lake Erie. Remote Sens. 2022, 14, 3729. [Google Scholar] [CrossRef]
  29. AOAC. Official Methods of Analysis, 16th ed.; Association of Official Analytical Chemists: Washington, DC, USA; Arlington, VA, USA, 1998. [Google Scholar]
  30. Jurinjak Tušek, A.; Benković, M.; Belščak Cvitanović, A.; Valinger, D.; Jurina, T.; Gajdoš Kljusurić, J. Kinetics and Thermodynamics of the Solid-Liquid Extraction Process of Total Polyphenols, Antioxidants and Extraction Yield from Asteraceae Plants. Ind. Crop. Prod. 2016, 91, 205–214. [Google Scholar] [CrossRef]
  31. Bucić-Kojić, A.; Planinić, M.; Tomas, S.; Bilić, M.; Velić, D. Study of Solid-Liquid Extraction Kinetics of Total Polyphenols from Grape Seeds. J. Food Eng. 2007, 81, 236–242. [Google Scholar] [CrossRef]
  32. Librán, C.M.; Mayor, L.; Garcia-Castello, E.M.; Vidal-Brotons, D. Polyphenol Extraction from Grape Wastes: Solvent and PH Effect. Agric. Sci. 2013, 04, 56–62. [Google Scholar] [CrossRef] [Green Version]
  33. Chañi-Paucar, L.O.; Silva, J.W.L.; Maciel, M.I.S.; de Lima, V.L.A.G. Simplified Process of Extraction of Polyphenols from Agroindustrial Grape Waste. Food Sci. Technol. 2021, 41, 723–731. [Google Scholar] [CrossRef]
  34. Pinelo, M.; Rubilar, M.; Jerez, M.; Sineiro, J.; Núñez, M.J. Effect of Solvent, Temperature, and Solvent-to-Solid Ratio on the Total Phenolic Content and Antiradical Activity of Extracts from Different Components of Grape Pomace. J. Agric. Food Chem. 2005, 53, 2111–2117. [Google Scholar] [CrossRef]
  35. Brand-Williams, W.; Cuvelier, M.E.; Berset, C. Use of a Free Radical Method to Evaluate Antioxidant Activity. LWT Food Sci. Technol. 1995, 28, 25–30. [Google Scholar] [CrossRef]
  36. Benzie, I.F.F.; Strain, J.J. The Ferric Reducing Ability of Plasma (FRAP) as a Measure of “Antioxidant Power”: The FRAP Assay. Anal. Biochem. 1996, 239, 70–76. [Google Scholar] [CrossRef] [PubMed] [Green Version]
  37. Bahrami, G.; Nabiyar, H.; Sadrjavadi, K.; Shahlaei, M. Combined Unfolded Principal Component Analysis and Artificial Neural Network for Determination of Ibuprofen in Human Serum by Three-Dimensional Excitation-Emission Matrix Fluorescence Spectroscopy. Iran. J. Pharm. Res. 2018, 17, 864–882. [Google Scholar]
  38. Hemmateenejad, B.; Safarpour, M.A.; Miri, R.; Nesari, N. Toward an Optimal Procedure for PC-ANN Model Building: Prediction of the Carcinogenic Activity of a Large Set of Drugs. J. Chem. Inf. Model. 2005, 45, 190–199. [Google Scholar] [CrossRef] [PubMed]
  39. Yeler, H.B.; Nas, S. Optimization of Extraction Time and Temperature for Natural Antioxidants of Öküzgözü Grape Pomace Using Various Solvent Ratios. Food Sci. Technol. 2021, 41, 127–135. [Google Scholar] [CrossRef]
  40. Beulah, G.; Divya, D.; Kumar, N.S.S.; Sravya, M.V.N.; Rao, K.G.; Chintagunta, A.D.; Divya, G.; Chandana, S.H.; Blessy, B.D.; Simhachalam, G. Purification and Characterization of Bioactive Compounds Extracted from Suaeda Maritima Leaf and Its Impact on Pathogenicity of Pseudomonas Aeruginosa in Catla Catla Fingerlings. AMB Express 2021, 11, 135. [Google Scholar] [CrossRef] [PubMed]
  41. Cvetković, A.M.; Jurina, T.; Valinger, D.; Jurinjak Tušek, A.; Benković, M.; Gajdoš Kljusurić, J. The Estimation of Kinetic Parameters of the Solid-Liquid Extraction Process of the Lavender Flower (Lavandula x Hybrida L.). Croat. J. Food Sci. Technol. 2018, 10, 64–72. [Google Scholar] [CrossRef] [Green Version]
  42. Jurinjak Tušek, A.; Benković, M.; Malešić, E.; Marić, L.; Jurina, T.; Gajdoš Kljusurić, J.; Valinger, D. Rapid Quantification of Dissolved Solids and Bioactives in Dried Root Vegetable Extracts Using near Infrared Spectroscopy. Spectrochim. Acta Part A Mol. Biomol. Spectrosc. 2021, 261, 120074. [Google Scholar] [CrossRef]
  43. Hernández, B.; Sáenz, C.; Alberdi, C.; Diñeiro, J.M. CIELAB Color Coordinates versus Relative Proportions of Myoglobin Redox Forms in the Description of Fresh Meat Appearance. J. Food Sci. Technol. 2016, 53, 4159–4167. [Google Scholar] [CrossRef] [PubMed] [Green Version]
  44. Yammine, S.; Delsart, C.; Vitrac, X.; Peuchot, M.M.; Ghidossi, R. Characterisation of Polyphenols and Antioxidant Potential of Red and White Pomace By-Product Extracts Using Subcritical Water Extraction. Oeno One 2020, 54, 263–278. [Google Scholar] [CrossRef]
  45. Guerrero, M.S.; Torres, J.S.; Nuñez, M.J. Extraction of Polyphenols from White Distilled Grape Pomace: Optimization and Modelling. Bioresour. Technol. 2008, 99, 1311–1318. [Google Scholar] [CrossRef] [PubMed]
  46. Çam, M.; Aaby, K. Optimization of Extraction of Apple Pomace Phenolics with Water by Response Surface Methodology. J. Agric. Food Chem. 2010, 58, 9103–9111. [Google Scholar] [CrossRef] [PubMed]
  47. Hernández-Carranza, P.; Ávila-Sosa, R.; Guerrero-Beltrán, J.A.; Navarro-Cruz, A.R.; Corona-Jiménez, E.; Ochoa-Velasco, C.E. Optimization of Antioxidant Compounds Extraction from Fruit By-Products: Apple Pomace, Orange and Banana Peel. J. Food Process. Preserv. 2016, 40, 103–115. [Google Scholar] [CrossRef]
  48. Flórez, M.; Cazón, P.; Vázquez, M. Antioxidant Extracts of Nettle (Urtica Dioica) Leaves: Evaluation of Extraction Techniques and Solvents. Molecules 2022, 27, 15. [Google Scholar] [CrossRef]
  49. Le Man, H.; Behera, S.K.; Park, H.S. Optimization of Operational Parameters for Ethanol Production from Korean Food Waste Leachate. Int. J. Environ. Sci. Technol. 2010, 7, 157–164. [Google Scholar] [CrossRef] [Green Version]
  50. Gironi, F.; Piemonte, V. Temperature and Solvent Effects on Polyphenol Extraction Process from Chestnut Tree Wood. Chem. Eng. Res. Des. 2011, 89, 857–862. [Google Scholar] [CrossRef]
  51. Che Sulaiman, I.S.; Basri, M.; Fard Masoumi, H.R.; Chee, W.J.; Ashari, S.E.; Ismail, M. Effects of Temperature, Time, and Solvent Ratio on the Extraction of Phenolic Compounds and the Anti-Radical Activity of Clinacanthus Nutans Lindau Leaves by Response Surface Methodology. Chem. Cent. J. 2017, 11, 54. [Google Scholar] [CrossRef] [Green Version]
  52. Antony, A.; Farid, M. Effect of Temperatures on Polyphenols during Extraction. Appl. Sci. 2022, 12, 2107. [Google Scholar] [CrossRef]
  53. Mazza, K.E.L.; Santiago, M.C.P.A.; do Nascimento, L.S.M.; Godoy, R.L.O.; Souza, E.F.; Brígida, A.I.S.; Borguini, R.G.; Tonon, R.V. Syrah Grape Skin Valorisation Using Ultrasound-Assisted Extraction: Phenolic Compounds Recovery, Antioxidant Capacity and Phenolic Profile. Int. J. Food Sci. Technol. 2019, 54, 641–650. [Google Scholar] [CrossRef]
  54. Al-Dhabi, N.A.; Ponmurugan, K.; Maran Jeganathan, P. Development and Validation of Ultrasound-Assisted Solid-Liquid Extraction of Phenolic Compounds from Waste Spent Coffee Grounds. Ultrason. Sonochem. 2017, 34, 206–213. [Google Scholar] [CrossRef] [PubMed]
  55. Grabska, J.; Beć, K.B.; Ueno, N.; Huck, C.W. Analyzing the Quality Parameters of Apples by Spectroscopy from Vis/NIR to NIR Region: A Comprehensive Review. Foods 2023, 12, 1946. [Google Scholar] [CrossRef] [PubMed]
  56. Shen, X.; Wang, T.; Wei, J.; Li, X.; Deng, F.; Niu, X.; Wang, Y.; Kan, J.; Zhang, W.; Yun, Y.-H.; et al. Potential of Near-Infrared Spectroscopy (NIRS) for Efficient Classification Based on Postharvest Storage Time, Cultivar and Maturity in Coconut Water. Foods 2023, 12, 2415. [Google Scholar] [CrossRef]
  57. Pasquini, C. Near Infrared Spectroscopy: Fundamentals, Practical Aspects and Analytical Applications. J. Braz. Chem. Soc. 2003, 14, 198–219. [Google Scholar] [CrossRef] [Green Version]
  58. Valinger, D.; Kušen, M.; Jurinjak Tušek, A.; Panić, M.; Jurina, T.; Benković, M.; Radojčić Redovniković, I.; Gajdoš Kljusurić, J. Development of near Infrared Spectroscopy Models for Quantitative Prediction of the Content of Bioactive Compounds in Olive Leaves. Chem. Biochem. Eng. Q. 2018, 32, 535–543. [Google Scholar] [CrossRef]
Figure 1. (a) NIR spectra of all prepared aqueous grape skin extracts and pure water; (b) PCA analysis of raw NIR spectra of all prepared aqueous grape skin extracts. The extracts in the green oval were prepared at T = 40 °C; those in the blue oval were prepared at T = 60 °C; and those in the red oval were prepared at T = 80 °C.
Separations 10 00452 g001aSeparations 10 00452 g001b
Table 1. Physical properties of the aqueous grape skin extracts.
Exp.t (min)T (°C)S/L (g/L)rpm
(1/min)
pHS (μS/cm)TDS (mg/L)Y (%)
1.6040205003.89 ± 0.01313.33 ± 2.08152.80 ± 2.520.2332 ± 0.03
2.9040205003.93 ± 0.01254.33 ± 1.53128.87 ± 1.710.2219 ± 0.04
3.6080205003.84 ± 0.01379.33 ± 5.13186.67 ± 0.900.4160 ± 0.07
4.9080205003.95 ± 0.01335.33 ± 1.53169.57 ± 1.100.3338 ± 0.02
5.7560102503.88 ± 0.02219.00 ± 2.65106.77 ± 1.620.1359 ± 0.03
6.7560302503.81 ± 0.01329.00 ± 1.00163.27 ± 0.910.4101 ± 0.04
7.7560107503.79 ± 0.01230.33 ± 7.64112.83 ± 2.630.2245 ± 0.01
8.7560307503.76 ± 0.01379.67 ± 3.21191.40 ± 0.260.5113 ± 0.01
9.7560205003.94 ± 0.01239.67 ± 0.58122.67 ± 3.760.2825 ± 0.04
10.6060202503.87 ± 0.00219.00 ± 1.73108.67 ± 0.230.1923 ± 0.00
11.9060202504.00 ± 0.01197.93 ± 0.2199.30 ± 0.440.2357 ± 0.04
12.6060207503.90 ± 0.02227.67 ± 0.58113.67 ± 0.060.2193 ± 0.05
13.9060207503.86 ± 0.01311.33 ± 0.58154.97 ± 0.510.4154 ± 0.01
14.7540105004.07 ± 0.01193.07 ± 9.4893.73 ± 5.610.1610 ± 0.01
15.7580105003.95 ± 0.00218.33 ± 0.58109.33 ± 0.210.2465 ± 0.08
16.7540305003.76 ± 0.00242.67 ± 1.15121.33 ± 0.580.2338 ± 0.00
17.7580305003.78 ± 0.01378.00 ± 1.00187.97 ± 2.660.4515 ± 0.01
18.7560205003.85 ± 0.01296.00 ± 3.61141.93 ± 3.880.3330 ± 0.04
19.6060105003.94 ± 0.03162.00 ± 1.0081.27 ± 0.930.1889 ± 0.00
20.9060105004.03 ± 0.01172.70 ± 0.1086.47 ± 0.060.1740 ± 0.01
21.6060305003.84 ± 0.02280.33 ± 0.58139.0. ± 1.000.2875 ± 0.08
22.9060305003.82 ± 0.00291.33 ± 0.58145.93 ± 0.210.2944 ± 0.01
23.7540202503.93 ± 0.01152.27 ± 8.9581.97 ± 0.700.2350 ± 0.17
24.7580202503.79 ± 0.01229.67 ± 0.58114.67 ± 0.580.3160 ± 0.04
25.7540207503.83 ± 0.01208.00 ± 1.00106.57 ± 1.800.2008 ± 0.04
26.7580207503.69 ± 0.01311.00 ± 5.57158.47 ± 0.580.4133 ± 0.04
27.7560205003.82 ± 0.01225.00 ± 1.73114.13 ± 0.810.1241 ± 0.05
28.7560205003.77 ± 0.01245.67 ± 0.58123.57 ± 0.060.2882 ± 0.02
29.7560205003.72 ± 0.00242.33 ± 0.58121.27 ± 0.640.2848 ± 0.02
30.7560205003.73 ± 0.01241.67 ± 0.58121.33 ± 0.580.2755 ± 0.04
Table 2. Color coordinates of the aqueous grape skin extracts.
Exp.t (min)T (°C)S/L (g/L)rpm
(1/min)
LabChromaHue
1.60402050042.77 ± 0.000.08 ± 0.010.70 ± 0.010.71 ± 0.0183.38 ± 1.00
2.90402050042.07 ± 0.010.03 ± 0.010.68 ± 0.010.68 ± 0.0187.77 ± 0.61
3.60802050040.81 ± 0.040.13 ± 0.010.58 ± 0.010.60 ± 0.0177.32 ± 0.70
4.90802050042.64 ± 0.810.02 ± 0.060.90 ± 0.310.90 ± 0.3187.63 ± 3.76
5.75601025044.13 ± 0.01−0.15 ± 0.001.02 ± 0.011.03 ± 0.0198.50 ± 0.05
6.75603025043.95 ± 8.70−0.13 ± 0.001.15 ± 0.011.16 ± 0.0196.46 ± 0.19
7.75601075043.75 ± 0.01−0.10 ± 0.011.11 ± 0.011.11 ± 0.0195.10 ± 0.38
8.75603075046.81 ± 0.02−0.82 ± 0.020.82 ± 0.011.16 ± 0.02134.81 ± 0.54
9.75602050043.80 ± 0.01−0.03 ± 0.011.13 ± 0.011.13 ± 0.0191.27 ± 0.55
10.60602025043.87 ± 0.01−0.12 ± 0.001.06 ± 0.011.07 ± 0.0196.61 ± 0.03
11.90602025044.28 ± 0.02−0.17 ± 0.010.95 ± 0.010.97 ± 0.01100.03 ± 0.52
12.60602075043.75 ± 0.07−0.09 ± 0.021.12 ± 0.011.13 ± 0.0194.63 ± 0.66
13.90602075043.86 ± 0.01−0.07 ± 0.011.13 ± 0.011.13 ± 0.0193.61 ± 0.37
14.75401050044.21 ± 0.01−0.17 ± 0.000.99 ± 0.011.01 ± 0.0199.54 ± 0.22
15.75801050043.98 ± 0.00−0.06 ± 0.011.16 ± 0.011.16 ± 0.0192.93 ± 0.59
16.75403050044.26 ± 0.03−0.13 ± 0.011.00 ± 0.011.01 ± 0.0197.33 ± 0.51
17.75803050043.38 ± 0.01−0.04 ± 0.011.27 ± 0.011.27 ± 0.0191.75 ± 0.21
18.75602050046.98 ± 0.01−0.78 ± 0.010.81 ± 0.011.12 ± 0.01133.64 ± 0.23
19.60601050047.15 ± 0.02−0.80 ± 0.010.66 ± 0.021.04 ± 0.02140.69 ± 0.37
20.90601050047.06 ± 0.01−0.81 ± 0.010.68 ± 0.001.06 ± 0.01140.06 ± 0.52
21.60603050047.00 ± 0.01−0.77 ± 0.010.82 ± 0.011.12 ± 0.00133.07 ± 0.68
22.90603050047.01 ± 0.01−0.82 ± 0.010.77 ± 0.011.12 ± 0.01136.77 ± 0.02
23.75402025047.27 ± 0.02−0.85 ± 0.010.63 ± 0.011.06 ± 0.01143.73 ± 0.32
24.75802025047.03 ± 0.02−0.77 ± 0.010.90 ± 0.011.19 ± 0.02130.53 ± 0.07
25.75402075047.20 ± 8.70−0.83 ± 0.010.63 ± 0.011.04 ± 0.01142.59 ± 0.50
26.75802075046.73 ± 0.00−0.63 ± 0.021.07 ± 0.011.24 ± 0.01120.61 ± 0.63
27.75602050046.55 ± 0.01−0.82 ± 0.010.74 ± 1.361.10 ± 0.01137.85 ± 0.31
28.75602050046.83 ± 0.02−0.71 ± 0.010.79 ± 0.021.05 ± 0.02131.98 ± 0.49
29.75602050046.76 ± 0.01−0.77 ± 0.000.83 ± 0.011.13 ± 0.01132.79 ± 0.36
30.75602050047.23 ± 0.01−0.25 ± 0.880.77 ± 0.011.09 ± 0.01134.65 ± 0.62
Table 3. Chemical properties of the grape skin aqueous extracts.
Exp.t (min)T (°C)S/L (g/L)rpm
(1/min)
TPC
(mgGAE/gd.m.)
DPPH (mmolTrolox/gd.m.) FRAP   ( m m o l F e S O 4 · 7 H 2 O / g d . m . )
1.6040205001.47 ± 0.000.0009 ± 0.00010.0082 ± 0.0002
2.9040205002.54 ± 0.320.0007 ± 0.00010.0098 ± 0.0021
3.6080205003.85 ± 0.060.0046 ± 0.00100.0295 ± 0.0002
4.9080205002.94 ± 0.160.0022 ± 0.00050.0287 ± 0.0006
5.7560102501.20 ± 0.060.0005 ± 0.00000.0059 ± 0.0002
6.7560302503.43 ± 0.060.0012 ± 0.00030.0192 ± 0.0005
7.7560107501.31 ± 0.010.0005 ± 0.00010.0050 ± 0.0001
8.7560307504.02 ± 0.060.0012 ± 0.00010.0431 ± 0.0013
9.7560205003.28 ± 0.160.0008 ± 0.00010.0088 ± 0.0006
10.6060202503.28 ± 0.040.0007 ± 0.00010.0155 ± 0.0012
11.9060202502.19 ± 0.060.0008 ± 0.00010.0133 ± 0.0026
12.6060207502.10 ± 0.020.0007 ± 0.00000.0200 ± 0.0005
13.9060207502.30 ± 0.340.0007 ± 0.00010.0264 ± 0.0001
14.7540105001.09 ± 0.040.0004 ± 0.00010.0028 ± 0.0002
15.7580105001.29 ± 0.030.0015 ± 0.00080.0129 ± 0.0004
16.7540305003.08 ± 0.030.0009 ± 0.00010.0253 ± 0.0014
17.7580305008.24 ± 0.210.0301 ± 0.00090.0483 ± 0.0001
18.7560205002.93 ± 0.240.0008 ± 0.00010.0105 ± 0.0001
19.6060105001.98 ± 0.050.0003 ± 0.00000.0030 ± 0.0003
20.9060105001.96 ± 0.140.0003 ± 0.00000.0037 ± 0.0002
21.6060305004.74 ± 0.060.0021 ± 0.00040.0297 ± 0.0016
22.9060305004.30 ± 0.030.0010 ± 0.00010.025 ± 0.0011
23.7540202504.04 ± 0.320.0007 ± 0.00000.0055 ± 0.0007
24.7580202505.05 ± 0.040.0046 ± 0.00240.0236 ± 0.0004
25.7540207504.00 ± 0.380.0010 ± 0.00000.0088 ± 0.0000
26.7580207505.96 ± 0.320.0273 ± 0.00150.0314 ± 0.0007
27.7560205002.47 ± 0.220.0012 ± 0.00050.0144 ± 0.0010
28.7560205002.20 ± 0.040.0008 ± 0.00030.0183 ± 0.0002
29.7560205002.67 ± 0.180.0008 ± 0.00000.0160 ± 0.0001
30.7560205002.57 ± 0.040.0008 ± 0.00000.0173 ± 0.0001
Table 4. Literature review: extracted polyphenols obtained via solid–liquid extraction using water as a solvent.
Extraction SubstrateExtraction SolventResultsReference
Distilled white grape
pomace
Ethanol, waterExtraction yield was higher using water as a solvent[45]
Olive leavesWaterOptimal conditions for water extraction: T = 90 °C; t = 70 min; S/L = 16 mg/mL[13]
Optimal conditions for water extraction: T = 80 °C; t = 15 min; rpm = 500 min−1[15]
Apple pomace WaterA broad range of apple pomace antioxidants were extracted using water[46]
Orange and banana peelWaterLonger time (12 h) and higher temperature (60 °C) resulted in higher polyphenol content[47]
Dried nettle leavesMethanol, ethanol, or waterThe extracts in water media produced higher concentrations of polyphenols[48]
Table 5. Correlation matrix between physical and chemical characteristics of prepared grape skin extracts. Significant correlations (p < 0.05) are marked in bold.
tTS/LrpmpHSTDSYLabChromaHueTPCDPPHFRAP
t1.00
T0.001.00
S/L0.000.00
rpm0.000.000.001.00
pH0.14−0.28−0.52−0.261.00
S0.010.420.620.28−0.501.00
TDS−0.020.420.600.27−0.481.001.00
Y0.070.450.540.23−0.460.780.771.00
L0.04−0.090.060.04−0.26−0.34−0.36−0.081.00
a−0.030.07−0.08−0.050.200.250.260.06−0.881.00
b0.050.340.060.04−0.080.160.170.20−0.320.441.00
Chroma0.070.290.140.11−0.31−0.07−0.080.170.56−0.390.581.00
Hue0.05−0.130.060.04−0.22−0.33−0.35−0.110.97−0.90−0.500.411.00
TPC−0.040.380.660.02−0.490.510.490.560.17−0.210.110.340.161.00
DPPH−0.030.490.280.17−0.400.470.450.46−0.040.040.350.32−0.100.781.00
FRAP0.010.520.730.24−0.580.810.790.74−0.080.040.260.23−0.100.730.601.00
Table 6. One-way analysis of variance (one-way ANOVA). a–c The same lowercase letters in the column indicate that there is no significant difference (p > 0.05) between the samples at the beginning and end of the composting process according to the analysis of variance and Tukey’s post hoc test.
pHS TDS YTPC DPPH FRAP
t603.87 ± 0.04 a263.61 ± 72.48 a130.35 ± 34.93 a0.256 ± 0.085 a2.905 ± 1.186 a0.0023 ± 0.0016 a0.0179 ± 0.0103 a
753.82 ± 0.09 a254.51 ± 59.89 a127.38 ± 29.49 a0.284 ± 0.116 a3.267 ± 1.789 a0.0049 ± 0.0009 a0.0179 ± 0.0126 a
903.92 ± 0.08 a260.49 ± 60.59 a130.85 ± 30.52 a0.279 ± 0.083 a2.705 ± 0.807 a0.0018 ± 0.0007 a0.0181 ± 0.0097 a
T403.89 ± 0.09 a227.28 ± 52.57 b114.21 ± 24.14 b0.214 ± 0.051 b2.700 ± 1.178 b0.0016 ± 0.0004 a0.0103 ± 0.0074 a
603.85 ± 0.08 a250.59 ± 54.12 b124.89 ± 29.93 b0.271 ± 0.101 b2.719 ± 0.957 b0.0017 ± 0.0006 a0.0168 ± 0.0101 b
803.82 ± 0.09 b308.61 ± 66.37 a154.44 ± 30.62 a0.363 ± 0.105 a4.555 ± 2.286 a0.0013 ± 0.0012 b0.0293 ± 0.0109 a
S/L103.94 ± 0.09 a199.24 ± 26.42 c98.40 ± 12.49 c0.188 ± 0.044 c1.472 ± 0.374 c0.0010 ± 0.0004 b0.0056 ± 0.0036 c
203.84 ± 0.08 b257.19 ± 55.08 b128.93 ± 26.22 b0.279 ± 0.086 b3.102 ± 1.108 b0.0036 ± 0.0061 b0.0173 ± 0.0079 b
303.79 ± 0.03 c316.83 ± 52.01 a158.16 ± 26.22 a0.364 ± 0.125 a4.634 ± 1.752 a0.0073 ± 0.0110 a0.0322 ± 0.0107 a
rpm2503.87 ± 0.07 a224.48 ± 54.76 b112.43 ± 25.68 b0.254 ± 0.101 a3.198 ± 1.279 a0.0022 ± 0.0016 a0.0141 ± 0.0068 a
5003.86 ± 0.09 a261.72 ± 60.98 b130.42 ± 29.88 b0.268 ± 0.093 a2.977 ± 1.606 a0.0036 ± 0.0068 a0.0176 ± 0.0117 a
7503.80 ± 0.07 b278.00 ± 62.75 a139.65 ± 31.89 a0.331 ± 0.125 a3.282 ± 1.606 a0.0060 ± 0.0110 a0.0227 ± 0.0134 a
Table 7. Response surface models describing the physical and chemical properties of aqueous grape skin extracts. Significant model coefficients (p < 0.05) are marked in bold.
Model OutputRSM EquationR2
TDS131.72 + 0.50·X1 + 40.23·X2 + 59.76·X3 + 27.21·X4 − 4.04·X129.69·X22 − 0.55·X32 + 2.79·X42 + 3.41·X1 X2 + 0.85·X1 X3 + 25.33·X1 X4 + 25.52·X2 X3 + 9.60·X2 X4 + 11.03·X3 X40.75
Y0.29 + 0.02·X1 + 0.15·X2 + 0.18·X3 + 0.08·X4 − 0.01·X12 − 0.02·X22 − 0.01·X32 − 0.03·X42 − 0.04·X1 X2 + 0.01·X1 X3 + 0.08·X1 X4 + 0.07·X2 X3 + 0.07·X2 X4 + 0.01·X3 X40.64
TPC3.34 − 0.20·X1 + 1.86·X2 + 3.16·X3 + 0.08·X4 − 0.32·X120.92·X22 − 0.05·X320.33·X420.99·X1 X2 − 0.22·X1 X3 + 0.64·X1 X4 + 2.48·X2 X3 + 0.47·X2 X4 + 0.24·X3 X40.87
DPPH0.005 − 0.001·X1 + 0.011·X2 + 0.006·X3 + 0.004·X4 + 0.002·X120.005·X22 − 0.001·X32 − 0.001·X42 − 0.001·X1 X2 − 0.001·X1 X3 − 0.001·X1 X4 + 0.014·X2 X3 + 0.011·X2 X4 + 0.001·X3 X40.75
FRAP0.020 − 0.002·X1 + 0.019·X2 + 0.027·X3 + 0.008·X4 − 0.001·X120.004·X220.002·X320.002·X42 − 0.001·X1 X2 − 0.002·X1 X30.004·X1 X4 + 0.006·X2 X3 + 0.002·X2 X4 + 0.012·X3 X40.95
Table 8. Optimal extraction conditions and comparison between experimental data and model-predicted data under optimal extraction conditions.
Model OutputOptimal Extraction Conditions RMSE-Predicted Value of Output VariableExperimental Value of Output Variable
TDSt = 75 min
T = 80 °C
S/L = 30 g/L
rpm = 750 1/min
218.16217.96 ± 2.65
Y0.580.46 ± 0.29
TPC8.148.38 ± 0.21
DPPH0.0320.029 ± 0.001
FRAP0.0590.055 ± 0.001
Table 9. Structure of ANN networks selected for prediction of physical and chemical properties of aqueous grape skin extracts based on NIR spectra.
Model OutputANN StructureR2training/
RMSEtraning
R2test/
RMSEtest
R2validation/
RMSEvalidation
Input Activation FunctionOutput Activation Function
Physical properties (TDS and Y)MLP 5-8-20.9533
0.0038
0.9507
0.0059
0.9189
0.0068
TanhLogistic
Chemical properties (TPC, DPPH, and FRAP)MLP 5-9-30.9862
0.0018
0.9521
0.0023
0.9371
0.0026
TanhLogistic
Simultaneously predicted physical and chemical propertiesMLP 5-7-50.9035
0.0150
0.8901
0.0222
0.8166
0.0246
LogisticLogistic
Table 10. Goodness of fit for the output variables of the ANN models.
ANN StructureModel OutputR2trainingR2testR2validation
MLP 5-8-2TDS0.99360.96280.9617
Y0.94510.90770.8749
MLP 5-9-3TPC0.97570.96870.9604
DPPH0.99570.90910.8588
FRAP0.98680.98670.9841
MLP 5-7-5TDS0.95060.93920.9275
Y0.95010.78970.7729
TPC0.88690.78530.6909
DPPH0.99180.83740.7488
FRAP0.93940.93160.9285
Disclaimer/Publisher’s Note: The statements, opinions and data contained in all publications are solely those of the individual author(s) and contributor(s) and not of MDPI and/or the editor(s). MDPI and/or the editor(s) disclaim responsibility for any injury to people or property resulting from any ideas, methods, instructions or products referred to in the content.

