


Advances in Hydrocarbon Speciation for Soil Gas Analysis
by
Maria Antonietta De Gregorio
1,*,
Laura Clerici
1,
Emma Marinone
1,
Valeria Frattini
2 and
Pierluisa Dellavedova
2 1
U.O.C. Laboratorio Regionale Area Ovest, Settore Laboratori, ARPA Lombardia, Via Juvara 22, 20129 Milano, Italy
2
Settore Laboratori, ARPA Lombardia, Via Rosellini 17, 20124 Milano, Italy
*
Author to whom correspondence should be addressed.
Separations 2023, 10(9), 489; https://doi.org/10.3390/separations10090489
Submission received: 28 June 2023
/
Revised: 28 August 2023
/
Accepted: 5 September 2023
/
Published: 7 September 2023
(This article belongs to the Special Issue Research on the Application of Mass Spectrometry in Environmental Analysis Integrated with Contributions from Italian 5th MS-Enviday)
Abstract
:In the field of contaminated site remediation, risk analyses can be carried out by the use of appropriate mathematical models, based on simplified hypotheses of real sites. The possibility to have shared and accurate analytical methods is an important challenge for both routine laboratories and supervisory institutions. Although official methods (e.g., APH2009) are already available, they are lacking in some aspects, such as applicability to all the different sampling and analysis media and ease of use in routine analysis. Here, we report our recent advances in the implementation of an empirical method for hydrocarbon speciation in an air matrix, previously developed by the authors and published in 2015. The validation results led to a coefficient of variation (CV%) between 10–15% for the hydrocarbon fractions investigated (C5-C8 aliphatic, C9-C12 aliphatic, C9-C10 aromatic and C11-C12 aromatic) and recovery of ≤20%, in agreement with the required characteristics for the analytical methods. Several real samples were analyzed by the proposed method and the results were compared to those obtained by the official approach. The comparison led to an average bias (that is, the difference between the results from the developed method and those from the conventional one) of about 10%, confirming that the innovative approach is robust, accurate and can be applied to all the analytical media used for air sampling, such as soil gas.
1. Introduction
Fossil fuels, such as petroleum, are still crucial energy resources and represent the basic raw materials of the chemical industry. However, their spill, transportation and refining can cause serious environmental problems, because of the risk of leaking underground and aboveground storage tanks, inappropriate disposal of petroleum wastes, and accidental spills [1,2]. When liquid petroleum is accidentally released into the ground, generally it is partially dissolved or modified into gas phases, whereas another portion remains liquid [3]. In particular, the gas phases can be spread out in the entire ecosystem with negative effects on human health and the environment [4].
Vapor inhalation is reported as a way by which a pollutant comes into contact with a target by a route known as a volatilization path in contaminated sites, for which the risk analysis approach has been recently introduced.
Risk analysis can be carried out by the use of proper mathematical models based on the values of concentration of contaminants present in the soil and groundwater. However, these models are based on simplified assumptions of real sites, often not site-specific, and they do not provide a fine contamination profile of the site.
In particular, concerning hydrocarbon contamination, these models are not able to accurately estimate natural biodegradation phenomena with consequences on the risk assessment.
To overcome the mathematical models’ approximation, the direct analysis of an air matrix (e.g., soil gas) can be performed, in order to reach a more accurate estimation of the contamination site [5].
Soil gas is defined as the gas and vapor present in the pore spaces of soils [6]. The pores can be subjected to important contamination when exposed to volatile pollutants, coming from different sources: contaminated soils and ground waters. Depending on the physico-chemical properties of the soil and its geological and hydrogeological characteristics, the organic contamination becomes site-specific.
The main aims of soil gas characterization are many, such as qualitative and quantitative determination of the compounds present in the unsaturated soil layer, evaluation of the spatial and temporal variability of the contamination, determination of the vertical and horizontal concentration distributions, localization of the more contaminated centres, realization of proper maps for groundwater contamination, spatial distribution of contaminants over the time, verification of soil gas contribution to the contamination of ambient, as well as indoor and/or outdoor air in the risk assessment and evaluation of the feasibility and effectiveness of the remediation procedures [6].
Therefore, soil gas characterization represents one of the main tools for the remediation of contaminated sites [5]. Among the different contaminants in soil gas, hydrocarbons (HCs) occupy a special place. They include different types of heterogeneous organic compounds that particularly differ for structures (linear, branched and cyclic) and level of saturation (saturated, unsaturated aliphatic and aromatic substances). More in detail, specific target molecules, such as polycyclic aromatic hydrocarbons (PAHs), benzene, etc., are properly identified and quantified for the evaluation of the carcinogenic effects, whereas for the determination of the toxic and non-carcinogenic effects it refers to specific hydrocarbon fractions (e.g., C5-C8 aliphatic, C9-C12 aliphatic and C9-C10 aromatic for the volatile petroleum hydrocarbons (VPH), C13-C18 aliphatic, C11-C22 aromatic and C19-C36 for the extractable petroleum hydrocarbons (EPH)) [7,8].
Despite the fine characterization of soil gas representing a crucial aspect, not only for environmental protection but also for human health, the scientific literature lacks robust procedures, and the official methods suffer from some limitations. In fact, although official analytical methods are available for HC speciation in contaminated soil and water matrices [9,10,11], in contrast, HC speciation in soil gases is still open, especially in regards to the possibility of employing different sampling and analysis media.
The official method for soil gas is based on the quantification of the hydrocarbon aromatic fraction by the integration of the peaks’ area of proper characteristic ions extracted from the total ion current from the chromatogram obtained by gas chromatographic mass spectrometry (GC/MS). Instead, the quantification of the hydrocarbon aliphatic fraction is based on the integration of the total ion area counts (TIAC) of each aliphatic fraction present in the chromatogram, followed by subtraction of internal standard and target compound peaks (e.g., benzene, toluene, etc.) that interfere with the chromatogram profile in these ranges [12]. However, it is specific for canisters in the absence of any extraction solvent. Therefore, to date, the supervisory institutions and analytical laboratories lack methods that can be employed with the different sampling media (thermal desorption tubes, solvent desorption sorbent tubes). The issue related to the identification of proper HC fractions is still open and requires the availability of accurate analytical methods. As a consequence, developing an analytical method for HC speciation suitable for the different sampling media represents a crucial aspect in this sector. In the last few years, the authors have worked on the fine tuning of an innovative empirical GC/MS method allowing to overcome the main critical issues of the official approach for the aliphatic fractions (presence of solvent peak, presence of interferences, hard integration, etc.) [13].
The innovative method provides for the use of the mass spectrometer as a mass filter able to separate the different HC fractions on the basis of diagnostic ions of both aliphatic and aromatic fractions and identify the chemical species present in all fractions. Unlike the official method that is specific for HCs sampled by canisters, this approach is suitable for the analysis of HCs sampled by the different sampling media including the most critical ones that are the solvent desorption sorbent tubes (coconut shell charcoal) from which the analytes are extracted by a common solvent (carbon disulfide, CS2). In fact, the diagnostic ion selection eliminates the presence of the solvent peak and removes any chromatographic interferences, enhancing the integration process.
On the basis of the correlation between data from real samples, analyzed by both the method proposed by the authors [13] and the official method [12], the validity of the new approach had been verified. These preliminary results were very promising and encouraging. However, over time, the analysis of very complex real samples led to a dramatic deviation. In order to understand the reasons of the observed bias, the GC/MS approach was properly revised and then optimized, as discussed in the present work.
Here, we propose the advances of the GC/MS method previously developed for the speciation of the different HC volatile fractions (VPH) in soil gas, overcoming the traditional limits of the official method. In addition, the rapidity, ease of execution and high reproducibility of this new procedure make it particularly useful for applications in routine laboratories and for the analysis of complex mixtures.
2. Materials and Methods
A standard solution (certified reference material, CRM) containing 20 analytes (n-pentane, n-hexane, cyclohexane, 2,3-dimethylpentane, n-heptane, n-octane, 2,3-dimethylheptane, n-nonane, n-decane, n-undecane, n-dodecane, butylcyclohexane, isopropylbenzene, m-ethyltoluene, 1,3,5-trimethylbenzene, 1,2,4-trimethylbenzene, 4-isopropyltoluene, naphthalene, pentylbenzene, biphenyl) in carbon disulfide (CS2) at a concentration of 1000 μg/mL for each analyte was purchased by CPAChem and used as received, as well as a standard solution (used as internal standard, IS) containing 1,4-difluorobenzene, chlorobenzene-d5 in CS2 at a concentration of 1000 μg/mL for each analyte.
CS2 (99.9% purity low benzene) was purchased by Honeywell. Sorbent tubes (coconut shell charcoal) for the solvent desorption process were purchased by SKC. Real samples (SAMPLE 1–25) were sampled in different contaminated sites in Lombardy, a region of Northern Italy.
2.1. Preparation of Calibration Standard Solutions
At first, a diluted internal standard solution (d-IS) at a concentration of 2 μg/mL in CS2 was prepared and then used for the preparation of the calibration standard solutions described in Table 1.
The STD solutions 1–8 reported above (Table 1) were used for the construction of the calibration curve.
2.2. Method Validation: Precision and Recovery Evaluation
In order to determine the precision and recovery of the method, proper fortified materials were prepared as follows (Table 2).
Diluted solutions of CRM in CS2 were prepared having concentration values of 5, 10, 25, 50, and 500 μg/mL for each HC (CRM-5, CRM-10, CRM-25, CRM-50, CRM-500).
For each level of concentration, ten independent fortified samples were prepared and analyzed. For each level of concentration, precision and recovery were evaluated. The precision was verified by the calculation of standard deviation and coefficient of variation (CV%), whereas the recovery was calculated by comparing the obtained result with the theoretical value (recovery).
2.3. Samples Extraction by Solvent Desorption and GC/MS Analysis
All the fortified samples, prepared as reported above, were extracted by 1 mL of d-IS (2 μg/mL of IS in CS2) for every 100 mg of carbon as well as real samples and analyzed by GC/MS technique, as reported elsewhere [13]. The analyses were carried out using an Agilent 7890A gas chromatography (GC) equipped with a 5975C inert mass spectrometer detector (MSD) with a triple axis detector. The Agilent 7890A GC was interfaced with an Agilent 7683B Series Injector—Automatic Liquid Sampler and equipped with a Mega-5MS (60 m × 0.25 mm × 1 μm) column.
The chromatographic conditions were: Oven Program: 40 °C for 8 min; then 4 °C/min to 100 °C for 0 min; then 15 °C/min to 320 °C for 9 min; then 40 °C/min to 330 °C for 1 min. Injection Volume: 1 μL. SS Inlet: Mode splitless. Heater: 250 °C. Flow: He 1.2 mL/min. MSD Parameters: MS Source 230 °C, MS Quadrupole 150 °C. SIM Parameter: characteristic ion Target and Qualifier for each volatile organic compound (VOC). Mass range 35–350 amu.
3. Results and Discussion
As expected by the guidance on the sampling of soil gas (ISO 18400-204), the latter can be sampled by different media [6]. Among them, sorbent tubes, canisters, and bags are the most used.
The selection of the proper sampling medium is related to many aspects, such as type and level of contamination, costs, availability of equipment by the laboratories, etc.
As a consequence, it is essential to have available versatile methods that can be employed for the analysis of soil gases sampled on the different media.
The GC/MS method previously developed by the authors [13] showed criticisms that are properly investigated in the present work. Moreover, important advances are also reported.
3.1. Method Improvement
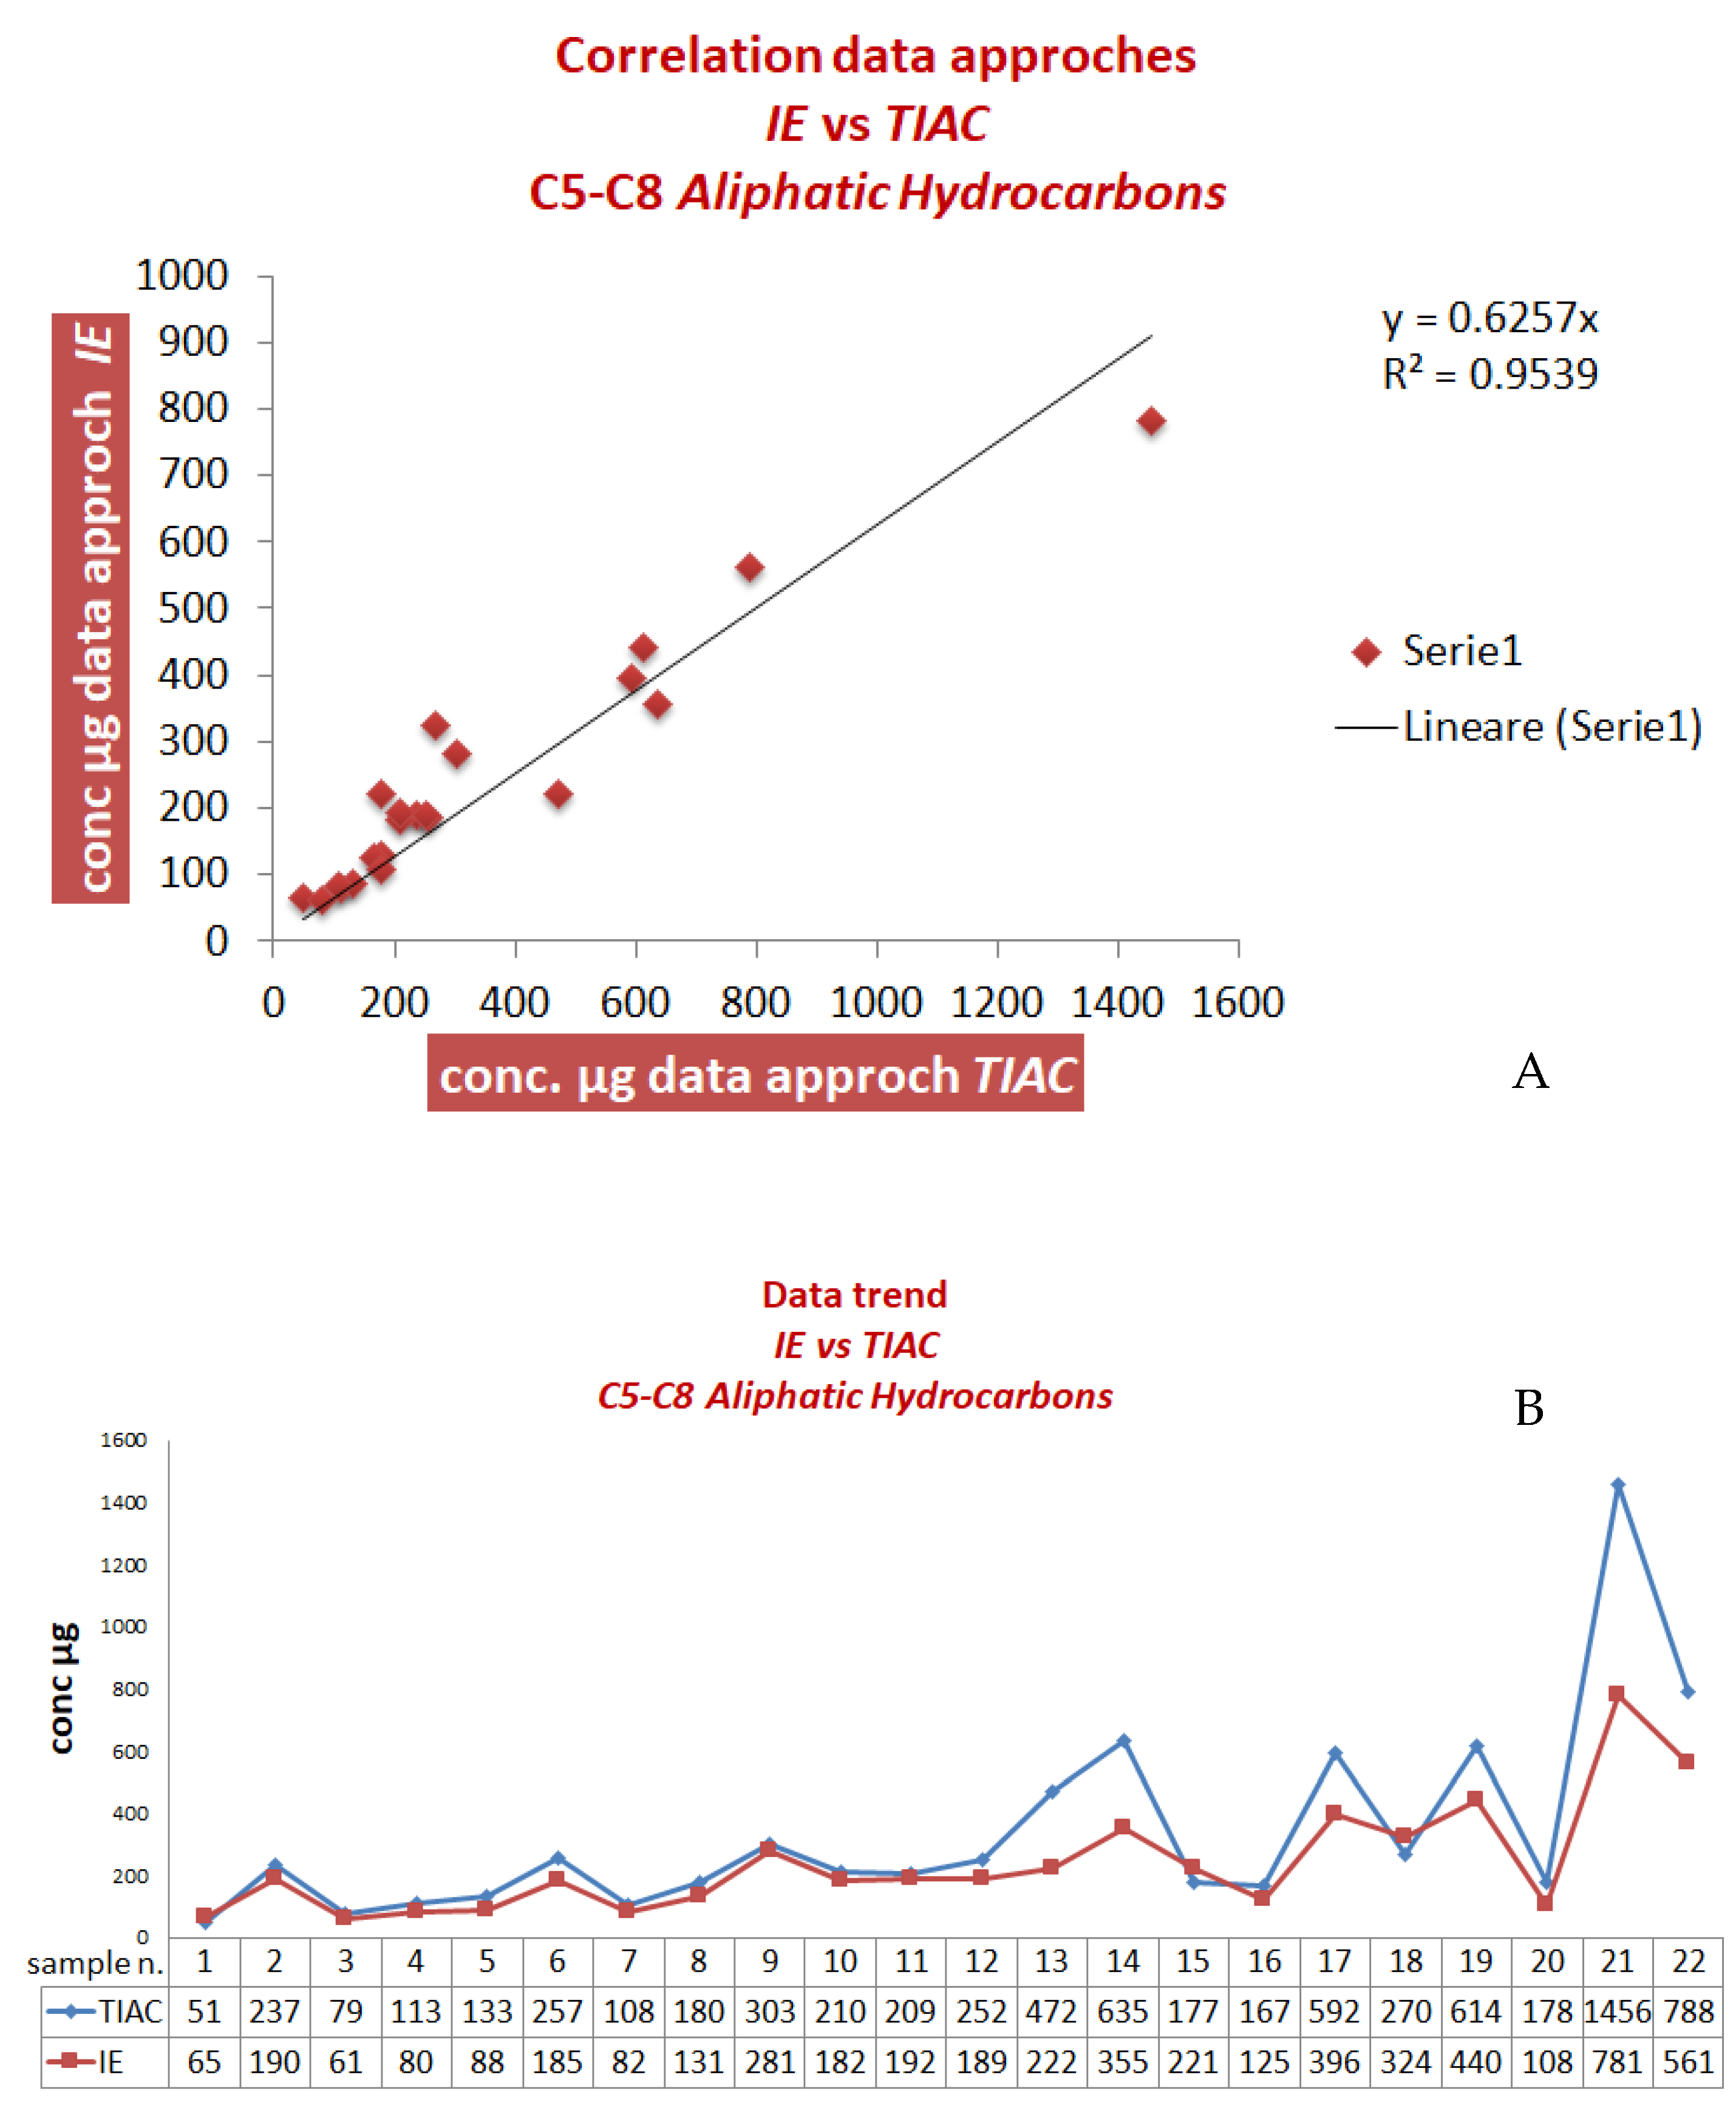
The previous GC/MS method developed by the authors showed promising perspectives for its wide application. It was applied on the analysis of HCs in soil gas sampled by solvent desorption sorbent tubes, because the latter represents the more critical type of media that makes the application of the official method difficult [12] because of the presence of a solvent peak that falls on the C5-C8 aliphatic fractions, causing strong interferences. In this regard, preliminary interesting results were obtained from the analyses of several real samples by the verification of data correlation between the new and the official approach (samples 1–12 in Table 3 and Figure 1).
The new method was based on the extraction of more representative ions (ions extraction, IE) of the aliphatic components from TIAC [13].
However, over the years, the investigation of more complex samples led to a poor correlation between the two methods, as shown in Figure 1 and Table 3 (samples 13–22).
It is worth noting that, for the C5-C8 aliphatic fraction, the bias achieves high values up to 53%, whereas the average bias was 28%.
In order to understand the reasons for this high deviation, some of the samples that showed the high bias were investigated in depth (here the results of sample 13 in Table 3 are reported).
Figure 2 shows an overlap of the GC/MS chromatograms obtained by the analysis of two real samples with different contaminations (samples 12 and 13 in Table 3).
In particular, the sample that caused a high deviation (sample 13 Table 3) showed a very intense peak at about 19 min, as compared to the less-contaminated sample (sample 12 Table 3). This peak was identified as methyl-cyclohexane, based on a match with the NIST library.
The high bias of sample 13 (Table 3), characterized by high complexity and contamination, was attributed to the poor representativeness of the cyclic components in the new analytical approach [13].
Therefore, the characteristic ions and target compounds selected in the previous method [13] were properly revised, modified and optimized on the basis of the investigation of the cluster peaks of the HCs mass spectra, as reported in Table 4.
Owing to the instability of the extracted samples over time, subsequently, the validity of this advanced procedure was evaluated by the analyses of other new real samples, comparing the results with those obtained by the official method (samples 1–25 in Table 5 and Table 6). The results obtained for the C5-C8 aliphatic fraction are displayed in Figure 3A,B and Table 5.
If compared to the previous results (Figure 1 and Table 3), the advanced method led to an enhanced correlation with an average bias of about 10%.
As observed, for this fraction an average bias of about 10% was calculated.
These results confirm the importance of the ion selection for the HC speciation when empiric methods are employed. In fact, as reported, if the HC classes are not properly represented, it may have low accuracy and poor comparability of the results.
The modified method permitted to overcome the poor performances of the previous version when applied to complex samples, returning results comparable to those of the official method.
3.2. Method Validation
The enhanced method was subjected to validation in terms of precision and recovery. The results are reported in Table 7, Table 8, Table 9 and Table 10.
As shown in the Tables above, the performances of the method, shown as precision (CV%) and recovery, are adequate for the purpose and in agreement with the required characteristics of the analytical methods. In fact, the CV% was always between 10–15% and the recovery was ≤20%.
3.3. Overcoming the Critical Issues of the Official Method
Concerning HC speciation by the official method, some critical drawbacks make their application difficult. Some of them include: (i) presence of solvent peak in the chromatogram, when solvent desorption sorbent tubes are used as the sampling medium, (ii) presence of peaks related to Internal Standard and other interferences (VOCs target) in aliphatic fractions that have to be removed by proper data adjustment, and (iii) poor integration process needing skilled operators.
As previously described [13], the alternative IE approach, whose application is extended to aliphatic fractions, permits to overcome all these criticisms. This is confirmed also when new ions (Table 4) are added to the mass quantification procedure (Figure 5).
Another usual critical issue is due to the presence of several interferences; in particular, in the aliphatic fractions, BTEX (benzene, toluene, ethylbenzene, xylenes), MTBE (methyl-ter-butyl-ether), ETBE (ethyl-ter-butyl-ether), halogenated VOCs (volatile organic compounds, such as tetrachloroethylene, trichloroethylene, and so on), etc., that can affect the speciation result.
By the official method, these interferences must be removed manually by a time-consuming and non-routine data adjustment process.
Figure 6A displays the TIAC chromatogram for a real sample. It is evident that the tetrachloroethylene peak falls into the chromatogram interfering with the C5-C8 aliphatic fraction.
Concerning the IE approach, as expected, the chromatograms obtained from the series CnH2n+1 and CnH2n−1 do not show interfering peaks (data not shown). Instead, a peak corresponding to tetrachloroethylene can be observed at 23.541 min in the CnH2n series for the ion 84 m/z (Figure 6B). The analyses of several real samples, characterized by different contaminations, confirm that the contribution of tetrachloroethylene to the C5-C8 aliphatic fraction is generally negligible or within the value of the uncertainty measurement.
Finally, the IE method permits to enhance the integration process, leading to a more linear baseline. In fact, if compared to a traditional chromatogram processed by the TIAC approach (Figure 7), that obtained by the IE method exhibits high linearity (Figure 5B and Figure 6B), positively affecting the integration process.
These results confirm that the advanced method maintains all the benefits of the previous one, demonstrating that the modification of the diagnostic ions does not affect the quality of this analytical approach.
4. Conclusions
In the present manuscript, an innovative GC/MS approach for HC speciation in the soil gas of contaminated sites is reported. A greater representativeness of all classes of compounds belonging to the aliphatic HC category (linear, branched, cyclic, saturated and unsaturated aliphatic substances) guaranteed a good correlation with the results obtained by the official method, maintaining all the benefits that the new approach provides. The validity of the improvements was confirmed by the analysis of real samples and by investigating the correlation between the data collected with the advanced method and those obtained by the official procedure, leading to a bias lower than 10% for both the HC aliphatic fractions investigated (C5-C8, C9-C12). Moreover, the enhanced approach can be applied to all the sampling and analysis media for air matrices (canisters, tubes of thermal desorption, tubes for solvent extraction), overcoming the limit of the presence of the solvent peak when activated carbon tubes are used. In addition, the innovative method permits to overcome the data adjustment process, required in the reference method to remove interferences related to the presence of VOCs target (e.g., BTEX, internal standard, etc.) from the aliphatic fractions. Finally, the enhancement in the integration process overcomes the need for skilled operators.
Thanks to its rapidity, ease of execution and high reproducibility, the proposed method paves the way to a new era in the field of HC speciation in soil gas.
In conclusion, in the field of soil gas characterization, this method could represent a valid tool in the risk assessment procedures applied to contaminated sites for the determination of toxic and non-carcinogenic effects of contamination.
Author Contributions
Conceptualization: M.A.D.G., L.C. and P.D.; methodology: M.A.D.G.; validation: M.A.D.G. and V.F.; formal analysis: M.A.D.G., L.C. and E.M.; investigation: M.A.D.G., L.C. and P.D.; resources: P.D.; data curation: M.A.D.G., L.C. and V.F.; writing—original draft preparation: M.A.D.G. and P.D.; writing—review and editing: M.A.D.G. and P.D.; supervision: P.D. All authors have read and agreed to the published version of the manuscript.
Funding
This research received no external funding.
Data Availability Statement
The data presented in this study are available on request from the corresponding author.
Conflicts of Interest
The authors declare no conflict of interest.
References
- Nadim, F.; Hoag, G.E.; Liu, S.; Carley, R.J.; Zack, P. Detection and remediation of soil and aquifer systems contaminated with petroleum products: An overview. J. Pet. Sci. Eng. 2000, 26, 169–178. [Google Scholar] [CrossRef]
- Ogidi, O.I.; Njoku, O.C. A Review on the Possibilities of the Application of Bioremediation Methods in the Oil Spill Clean-Up of Ogoni Land. Int. J. Biol. Sci. Technol. 2017, 9, 48–59. [Google Scholar]
- Anderson, M.A. Influence of Surfactants on Vapor-Liquid Partitioning. Environ. Sci. Technol. 1992, 26, 2186–2191. [Google Scholar] [CrossRef]
- Labianca, C.; De Gisi, S.; Picardi, F.; Todaro, F.; Notarnicola, M. Remediation of a Petroleum Hydrocarbon-Contaminated Site by Soil Vapor Extraction: A Full-Scale Case Study. Appl. Sci. 2020, 10, 4261. [Google Scholar] [CrossRef]
- SNPA. Progettazione del Monitoraggio di Vapori nei siti Contaminati. Delibera del Consiglio SNPA, Seduta del 03.10.18 Doc. n.41/18. Available online: https://www.snpambiente.it/wp-content/uploads/2018/10/Delibera-41-e-allegati.pdf (accessed on 27 June 2023).
- ISO 18400-204; Soil Quality-Sampling-Part 204: Guidance on Sampling of Soil Gas, 1st ed. International Standard: Geneva, Switzerland, January 2017.
- Commonwealth of Massachusetts Executive Office. Characterizing Risks Posed by Petroleum Contaminated Sites: Implementation of the MADEP VPH/EPH Approach-Final Policy—31 October 2002—Policy #wsc-02-411; 02108 617-292-5500; Commonwealth of Massachusetts Executive Office of Environmental Affairs Department of Environmental Protection One Winter Street: Boston, MA, USA, 2002; pp. 1–4. [Google Scholar]
- Cocârţă, D.M.; Stoian, M.A.; Karademir, A. Crude Oil Contaminated Sites: Evaluation by Using Risk Assessment Approach. Sustainability 2017, 9, 1365. [Google Scholar] [CrossRef]
- Department of Environmental Protection. Method for the Determination of Volatile Petroleum Hydrocarbons (VPH), Revision 1.1; Department of Environmental Protection: Boston, MA, USA, 2004. [Google Scholar]
- Department of Environmental Protection. Method for the Determination of Extractable Petroleum Hydrocarbons (EPH), Revision 1.1; Department of Environmental Protection: Boston, MA, USA, 2004. [Google Scholar]
- Department of Environmental Protection. Method for the Determination of Volatile Petroleum Hydrocarbons (VPH) by Gas Chromatography/Mass Spectrometry Revision 0; Department of Environmental Protection: Boston, MA, USA, 2017. [Google Scholar]
- Department of Environmental Protection. Method for Determination of Air-Phase Petroleum Hydrocarbon (APH), Final Revision 1; Department of Environmental Protection: Boston, MA, USA, 2009. [Google Scholar]
- Clerici, L.; Mongini, E.; Robles, P.; Dellavedova, P.; De Gregorio, M.A. GS/MS: A valid tool for soil gas hydrocarbons speciation. Int. J. Anal. Mass Spectrom. Chromatogr. 2015, 3, 54–62. [Google Scholar] [CrossRef]
Figure 1.
C5-C8 aliphatic fraction: data correlation (A) and data trend (B) between the method reported in [13] and the official approach.
Figure 1.
C5-C8 aliphatic fraction: data correlation (A) and data trend (B) between the method reported in [13] and the official approach.
Figure 2.
(A) Overlapping of two GC/MS chromatograms of two samples. Green line: sample 13 (Table 3), red line: sample 12 (Table 3). (B) Magnification of the overlapped GC/MS profiles between 16–27 min.

Figure 3.
C5-C8 aliphatic fraction: data correlation (A) and data trend (B) between the advanced method and the official approach.
Figure 3.
C5-C8 aliphatic fraction: data correlation (A) and data trend (B) between the advanced method and the official approach.

Figure 4.
C9-C12 aliphatic fraction: data correlation (A) and data trend (B) between the advanced method and official approach.
Figure 4.
C9-C12 aliphatic fraction: data correlation (A) and data trend (B) between the advanced method and official approach.


Figure 5.
GC/MS chromatogram of a real sample analyzed by (A) TIAC and (B) IE approach (as an example, the C5-C8 Aliphatics_CnH2n+1 series are reported).
Figure 5.
GC/MS chromatogram of a real sample analyzed by (A) TIAC and (B) IE approach (as an example, the C5-C8 Aliphatics_CnH2n+1 series are reported).

Figure 6.
GC/MS chromatogram of a real sample analyzed by (A) TIAC and (B) IE approach (the C5-C8 Aliphatics_CnH2n series are reported).
Figure 6.
GC/MS chromatogram of a real sample analyzed by (A) TIAC and (B) IE approach (the C5-C8 Aliphatics_CnH2n series are reported).

Figure 7.
GC/MS chromatogram of a real sample analyzed by TIAC, in which the poor linearity of the baseline is evident.
Figure 7.
GC/MS chromatogram of a real sample analyzed by TIAC, in which the poor linearity of the baseline is evident.


Table 1.
Preparation of the calibration standard solutions (STD) and concentration of each hydrocarbon.
Table 1.
Preparation of the calibration standard solutions (STD) and concentration of each hydrocarbon.
| STD | Preparation | Final STD Concentration for Each HC (μg/mL) |
|---|---|---|
| 8 | 100 μL of CRM to 1 mL of d-IS | 100 |
| 7 | 500 μL of STD 8 to 1 mL of d-IS | 50 |
| 6 | 200 μL of STD 8 to 1 mL of d-IS | 20 |
| 5 | 100 μL of STD 8 to 1 mL of d-IS | 10 |
| 4 | 500 μL of STD 5 to 1 mL of d-IS | 5 |
| 3 | 200 μL of STD 5 to 1 mL of d-IS | 2 |
| 2 | 100 μL of STD 5 to 1 mL of d-IS | 1 |
| 1 | 500 μL of STD 2 to 1 mL of d-IS | 0.5 |
Table 2.
Fortified samples preparation.
| Fortified Sample | Preparation by Spike on 100 mg Coconut Shell Charcoal |
|---|---|
| 1 | 100 μL of CRM-5 1 |
| 2 | 100 μL of CRM-10 |
| 3 | 100 μL of CRM-25 2 |
| 4 | 100 μL of CRM-50 |
| 5 | 100 μL of CRM-500 |
| 6 | 100 μL of CRM |
1 Only for aromatic C9-C10 fraction. 2 Only for aromatic C11-C12 fraction.
Table 3.
C5-C8 aliphatic fraction: concentration and bias% between the results of the method reported in [13] (IE) and those of the official approach (TIAC).
Table 3.
C5-C8 aliphatic fraction: concentration and bias% between the results of the method reported in [13] (IE) and those of the official approach (TIAC).
| Sample n. | Concentration (µg/mL) from TIAC | Concentration (µg/mL) from IE | Bias% |
|---|---|---|---|
| 1 | 51 | 65 | 28 |
| 2 | 237 | 190 | 20 |
| 3 | 79 | 61 | 23 |
| 4 | 113 | 80 | 29 |
| 5 | 133 | 88 | 34 |
| 6 | 257 | 185 | 28 |
| 7 | 108 | 82 | 24 |
| 8 | 180 | 131 | 27 |
| 9 | 303 | 281 | 7 |
| 10 | 210 | 182 | 13 |
| 11 | 209 | 192 | 8 |
| 12 | 252 | 189 | 25 |
| 13 | 472 | 222 | 53 |
| 14 | 635 | 355 | 44 |
| 15 | 177 | 221 | 25 |
| 16 | 167 | 125 | 25 |
| 17 | 592 | 396 | 33 |
| 18 | 270 | 324 | 20 |
| 19 | 614 | 440 | 28 |
| 20 | 178 | 108 | 39 |
| 21 | 1456 | 781 | 46 |
| 22 | 788 | 561 | 29 |
Table 4.
Target ions (m/z), standard markers, and retention time window for each HC fraction.
| VPH Fraction | m/z | Target Std | Retention Time Window |
|---|---|---|---|
| C5-C8 Aliphatics_CnH2n+1 C5-C8 Aliphatics_CnH2n−1 C5-C8 Aliphatics_CnH2n | 43-57-71-85 41-55-69-83 42-56-70-84 | n-Pentane n-Hexane Cyclohexane 2,3-Dimethylpentane n-Heptane n-Octane 2,3-Dimethylheptane | 0.1 min before n-pentane- 0.1 min before n-nonane |
| C9-C12 Aliphatics_CnH2n+1 C9-C12 Aliphatics_CnH2n−1 C9-C12 Aliphatics_CnH2n | 43-57-71-99 41-55-69-97 42-56-70-98 | 2,3-Dimethylheptane n-Nonane n-Decane n-Undecane n-Dodecane n-Butylcyclohexane | 0.1 min before n-nonane- 0.1 min before n-naphtalene |
| C9-C10 Aromatics | 120–134 1 | Isopropylbenzene 1-3-Methyl-3-ethylbenzene 1,3,5-Trimethylbenzene 1,2,4-Trimethylbenzene p-Isopropyltoluene | 0.1 min after o-xylene- 0.1 min before n-naphtalene |
| C11-C12 Aromatics | 148-162-115 | Pentylbenzene Biphenyl 2 | 0.1 min before pentylbenzene- 0.1 min after biphenyl- |
Table 5.
C5-C8 aliphatic fraction: concentration and bias% between the advanced method and the official approach.
Table 5.
C5-C8 aliphatic fraction: concentration and bias% between the advanced method and the official approach.
| Sample n. | Concentration (µg/mL) from TIAC | Concentration (µg/mL) from IE | Bias% |
|---|---|---|---|
| 1 | 270 | 248 | 8 |
| 2 | 614 | 611 | 1 |
| 3 | 178 | 186 | 4 |
| 4 | 728 | 836 | 15 |
| 5 | 788 | 981 | 24 |
| 6 | 610 | 849 | 39 |
| 7 | 285 | 271 | 5 |
| 8 | 137 | 135 | 2 |
| 9 | 321 | 282 | 12 |
| 10 | 502 | 431 | 14 |
| 11 | 402 | 425 | 6 |
| 12 | 220 | 241 | 9 |
| 13 | 314 | 248 | 21 |
| 14 | 179 | 124 | 31 |
| 15 | 319 | 341 | 7 |
| 16 | 302 | 300 | 1 |
| 17 | 194 | 182 | 6 |
| 18 | 335 | 352 | 5 |
| 19 | 237 | 218 | 8 |
| 20 | 558 | 551 | 1 |
| 21 | 142 | 144 | 1 |
| 22 | 254 | 269 | 6 |
| 23 | 143 | 119 | 17 |
| 24 | 370 | 278 | 25 |
| 25 | 319 | 303 | 5 |
Table 6.
C9-C12 aliphatic fraction: concentration and bias% between the advanced method and the official approach.
Table 6.
C9-C12 aliphatic fraction: concentration and bias% between the advanced method and the official approach.
| Sample n. | Concentration (µg/mL) from TIAC | Concentration (µg/mL) from IE | Bias% |
|---|---|---|---|
| 1 | - | - | - |
| 2 | 588 | 535 | 9 |
| 3 | 198 | 182 | 8 |
| 4 | - | - | - |
| 5 | 62 | 60 | 3 |
| 6 | 40 | 37 | 8 |
| 7 | 441 | 437 | 1 |
| 8 | 34 | 35 | 2 |
| 9 | - | - | - |
| 10 | - | - | - |
| 11 | 174 | 171 | 2 |
| 12 | - | - | - |
| 13 | 130 | 103 | 20 |
| 14 | 193 | 162 | 16 |
| 15 | 169 | 167 | 2 |
| 16 | 66 | 53 | 19 |
| 17 | - | - | - |
| 18 | - | - | - |
| 19 | 85 | 85 | 0 |
| 20 | 480 | 412 | 14 |
| 21 | 502 | 515 | 2 |
| 22 | 102 | 90 | 12 |
| 23 | 126 | 106 | 16 |
| 24 | - | - | - |
| 25 | 22 | 21 | 3 |
Table 7.
Precision and recovery data (fortified sample 1 for C9-C10 aromatic, fortified sample 2 for aliphatic fraction and fortified sample 3 for C11-C12 aromatic, prepared as described in Table 2).
Table 7.
Precision and recovery data (fortified sample 1 for C9-C10 aromatic, fortified sample 2 for aliphatic fraction and fortified sample 3 for C11-C12 aromatic, prepared as described in Table 2).
| VPH Fraction | Average Concentration (μg/mL) | Deviation Standard | CV% | Recovery% | Theoretical Concentration |
|---|---|---|---|---|---|
| C5-C8 Aliphatics | 8.08 | 0.82 | 10.13 | 15 | 7 |
| C9-C12 Aliphatics | 6.36 | 0.74 | 11.64 | 6 | 6 |
| C9-C10 Aromatics | 3.01 | 0.20 | 6.65 | 20 | 2.5 |
| C11-C12 Aromatics | 2.19 | 0.26 | 12.06 | 13 | 2.5 |
Table 8.
Precision and recovery data (fortified sample 4 for all fractions, prepared as described in Table 2).
Table 8.
Precision and recovery data (fortified sample 4 for all fractions, prepared as described in Table 2).
| VPH Fraction | Average Concentration (μg/mL) | Deviation Standard | CV% | Recovery% | Theoretical Concentration |
|---|---|---|---|---|---|
| C5-C8 Aliphatics | 39.78 | 3.67 | 9.22 | 14 | 35 |
| C9-C12 Aliphatics | 27.68 | 1.77 | 6.40 | −8 | 30 |
| C9-C10 Aromatics | 22.76 | 1.36 | 5.98 | −9 | 25 |
| C11-C12 Aromatics | 4.39 | 0.59 | 13.44 | −12 | 5 |
Table 9.
Precision and recovery data (fortified sample 5 for all fractions, prepared as described in Table 2).
Table 9.
Precision and recovery data (fortified sample 5 for all fractions, prepared as described in Table 2).
| VPH Fraction | Average Concentration (μg/mL) | Deviation Standard | CV% | Recovery% | Theoretical Concentration |
|---|---|---|---|---|---|
| C5-C8 Aliphatics | 346.65 | 22.29 | 6.43 | −1 | 350 |
| C9-C12 Aliphatics | 330.69 | 22.11 | 6.69 | 10 | 300 |
| C9-C10 Aromatics | 269.91 | 21.98 | 8.14 | 8 | 250 |
| C11-C12 Aromatics | 50.17 | 5.29 | 10.54 | 0.34 | 50 |
Table 10.
Precision and recovery data (fortified sample 6 for all fractions, prepared as described in Table 2).
Table 10.
Precision and recovery data (fortified sample 6 for all fractions, prepared as described in Table 2).
| VPH Fraction | Average Concentration (μg/mL) | Deviation Standard | CV% | Recovery% | Theoretical Concentration |
|---|---|---|---|---|---|
| C5-C8 Aliphatics | 630.55 | 29.59 | 4.69 | −10 | 700 |
| C9-C12 Aliphatics | 552.76 | 23.57 | 4.26 | −8 | 600 |
| C9-C10 Aromatics | 490.58 | 27.71 | 5.65 | −2 | 500 |
| C11-C12 Aromatics | 95.19 | 7.05 | 7.41 | −5 | 100 |
Disclaimer/Publisher’s Note: The statements, opinions and data contained in all publications are solely those of the individual author(s) and contributor(s) and not of MDPI and/or the editor(s). MDPI and/or the editor(s) disclaim responsibility for any injury to people or property resulting from any ideas, methods, instructions or products referred to in the content. |
© 2023 by the authors. Licensee MDPI, Basel, Switzerland. This article is an open access article distributed under the terms and conditions of the Creative Commons Attribution (CC BY) license (https://creativecommons.org/licenses/by/4.0/).
Share and Cite
MDPI and ACS Style
De Gregorio, M.A.; Clerici, L.; Marinone, E.; Frattini, V.; Dellavedova, P. Advances in Hydrocarbon Speciation for Soil Gas Analysis. Separations 2023, 10, 489. https://doi.org/10.3390/separations10090489
AMA Style
De Gregorio MA, Clerici L, Marinone E, Frattini V, Dellavedova P. Advances in Hydrocarbon Speciation for Soil Gas Analysis. Separations. 2023; 10(9):489. https://doi.org/10.3390/separations10090489
Chicago/Turabian StyleDe Gregorio, Maria Antonietta, Laura Clerici, Emma Marinone, Valeria Frattini, and Pierluisa Dellavedova. 2023. "Advances in Hydrocarbon Speciation for Soil Gas Analysis" Separations 10, no. 9: 489. https://doi.org/10.3390/separations10090489
Note that from the first issue of 2016, this journal uses article numbers instead of page numbers. See further details here.