
Extraction of Gallium from the Brown Corundum Dust with a One-Step Alkaline Leaching Process

1
The State Key Laboratory of Refractories and Metallurgy, Wuhan University of Science and Technology, Wuhan 430081, China
2
Key Laboratory for Ferrous Metallurgy and Resources Utilization of Ministry of Education, Wuhan University of Science and Technology, Wuhan 430081, China
3
Hubei Provincial Key Laboratory for New Processes of Ironmaking and Steelmaking, Wuhan University of Science and Technology, Wuhan 430081, China
*
Author to whom correspondence should be addressed.
Separations 2023, 10(9), 510; https://doi.org/10.3390/separations10090510
Submission received: 26 August 2023
/
Revised: 10 September 2023
/
Accepted: 14 September 2023
/
Published: 15 September 2023
Abstract
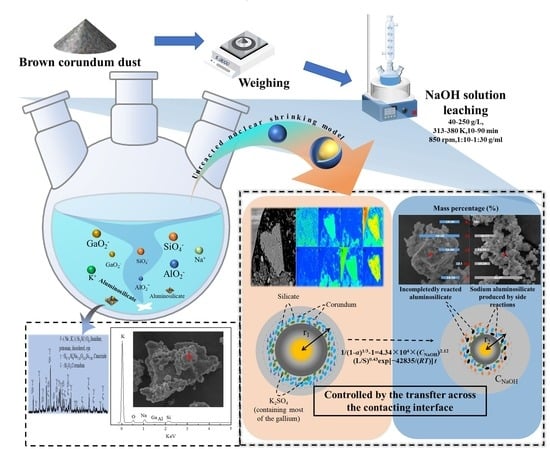
:Brown corundum dust, which is created during the manufacturing of brown corundum using bauxite as the raw material, is a vital carrier of gallium. To ascertain the presence of the contained gallium, the brown corundum dust was measured and characterized (XRF, XRD, ICP-OES, EPMA, SEM-EDS, etc.). Gallium was extracted from the brown corundum dust using a one-step alkali leaching process, and thermodynamic calculations were utilized to assess the viability of the leaching reactions. The effects of leaching parameters (NaOH solution concentration, leaching time, leaching temperature, solid–liquid ratio and stirring speed) on the recovery of gallium during the leaching process were investigated. A gallium recovery of 96.83% was discovered to be possible with the following parameters: 200 g/L of NaOH, 363 K for the leaching temperature, 60 min for the leaching time, 1:10 g/mL for the solid–liquid ratio, and 850 rpm for the stirring rate. Gallium extraction was negatively impacted by raising the leaching temperature above 363 K and the concentration of NaOH solution above 200 g/L due to the accelerated side reactions between Na+, K+, SiO44− and AlO2−, which led to the precipitation of aluminosilicates that absorbed gallium from the solution. The influences of leaching parameters such as the temperature, NaOH solution concentration, and solid–liquid ratio on the leaching kinetics were examined. It was demonstrated that the leaching process followed the unreacted shrinking core model, that the interfacial diffusion associated with the contacting surface area served as the controlling step, and that the apparent activation energy was 42.83 kJ/mol. It turned out that the final kinetic equation was 1/(1 − α)1/3 − 1 = 4.34 × 10⁴ × (CNaOH)2.12 (L/S)0.43exp[−42835/(RT)] t.
1. Introduction
Gallium is a key resource that is widely used in the electronics industry, atomic energy industry and other industries. It is known as “electronic metal” because of its excellent semiconductor properties, and it is an important material in the semiconductor and chip industries [1]. Gallium has an average abundance of 15–19 ppm in the Earth’s crust [2]. Gallium is typically found in the mineral lattice as isomorphism (substitution of Al), trapped in amorphous melt, or adsorbed on the surface of mineral particles [3]. It is extremely rare to form an independent or high-content mineral. Söhngeite (Ga(OH)3) and Gallite (CuGaS2) are the only two naturally occurring crystalline phases containing gallium [4,5]. The majority of gallium coexists with various minerals, the most important of which are bauxite, zinc ore and coal. Because it is uneconomical to extract gallium minerals alone, gallium is currently recovered primarily from secondary resources, such as solid or liquid waste from the Bayer process [6,7,8,9], coal fly ash [10,11], phosphorus dust [12], E-waste [13,14,15] and various tailings [16,17,18]. With the growth in global industries such as power electronics [19,20,21], semiconductors [22,23,24], medicine [25,26,27], aerospace [28,29], and so on, the use of gallium is becoming more and more widespread, and thus the market demand for gallium is expanding. As a result, gallium extraction and manufacturing have become research hotspots.
Brown corundum dust is a key carrier of gallium, which is created during the production of brown corundum using electric arc furnace high-temperature smelting technology [30]. The recovery of valuable components from brown corundum dust can improve resource utilization and generate revenues for the brown corundum industry. However, little research has been conducted on the recovery of gallium from this type of brown corundum dust yet. Wen et al. [31] employed CFD (corundum flue dust) as a raw material to investigate the behavior of gallium during mixed-acid leaching with sulfuric acid and hydrofluoric acid. In their study, the leaching rate of Ga could reach 91% under the leaching conditions of a solid–liquid ratio of 1:5 (g/mL), a temperature of 353 K, a duration of 4 h and a mixed acid solution of 1.5 mol/L H2SO4 and 6.4 mol/L HF. However, the high causticity of the hydrofluoric acid and the treatment of fluorine-containing wastewater must be taken into account in this process. A two-stage alkaline leaching, carbonation, acid leaching, and solvent extraction process was proposed in another paper to recover gallium from the CFD collected from a plant in Shanxi Province, China [32], and the overall gallium recovery was acceptable. However, the two-step alkali leaching procedure could be simplified and improved. Furthermore, the CFD contained far more Al and Si than Ga, resulting in significant alkali use and low economic benefits. Ding et al. [33] adopted ultrasonic-assisted sulfuric acid leaching to treat the CFD and found that the gallium leaching rate was up to 82.56% at a sulfuric acid concentration of 25 wt%, a leaching temperature of 363 K, and a leaching duration of 50 min.
A one-step alkaline leaching approach was employed in this work to directly extract gallium from the brown corundum dust. A number of analytical tools were used to characterize the morphology and composition of corundum dust. The effects of the leaching parameters, including NaOH solution concentration, leaching temperature, leaching time, solid–liquid ratio and stirring rate, on the recovery of Ga were studied. In addition, the shrinking core model was used to describe the leaching kinetics, and the rate-controlling step of the leaching reaction was determined. The correlations between the rate constant k and leaching parameters such as temperature, NaOH solution concentration, and solid-to-liquid ratio were explored, and a kinetic equation presenting the variation of gallium recovery with leaching parameters was constructed.
2. Experimental
2.1. Raw Materials
The brown corundum dust used in this study was provided by a brown corundum factory in Guizhou, China. X-ray fluorescence spectroscopy (XRF, 9900 Series, Thermo Scientific, Waltham, MA, USA) and inductively coupled plasma emission spectroscopy (ICP-OES, IRIS Advantage ER/S, Thermo Elemental, Waltham, MA, USA) were used to determine its chemical composition. Because XRF is a semi-quantitative method, Ga was confirmed using ICP-MS, and Si, K, Al and Fe were further determined using ICP-OES. Table 1 shows the findings of the chemical analysis. Brown corundum dust is reported to contain mostly SiO2 (42.90 wt%), K2O (20.50 wt%), Al2O3 (19.71 wt%), SO3 (5.01 wt%) and gallium (0.0992%), which is significantly higher than that found in bauxite. The overall amount of SiO2, K2O and Al2O3 is 83%, which will make subsequent purification of gallium-containing solution problematic. The overall Fe2O3 composition is 4.29%, with 0.2% metallic iron.
Figure 1 shows the phase compositions of this dust as determined by an X-ray diffractometer (XRD, XPert PRO MPD, PANalytical B.V., Almelo, The Netherlands). Scanning electron microscopy/energy dispersive spectroscopy (SEM-EDS) (SEM, EVO 010, Zeiss, EDS, X-MaxN 79416, Oxford, MS, USA) was used to characterize mineral and elemental distributions, as shown in Figure 2. Figure 3 shows pictures from an electron-probe microanalysis (EPMA-8050G, SHIMADZU, Carlsbad, CA, USA).
The major phases found in brown corundum dust are corundum (Al2O3) and potassium sulfate (K2SO4), as indicated in Figure 1. There were no identifiable Ga peaks discovered. This could be owing to the low gallium content. The silicon-containing phase was not discovered, indicating that silicon was present in amorphous form. The overall distributions of K and S are consistent, as shown in Figure 2, and this is in agreement with the XRD analysis results. Meanwhile, most of the K and S appear in the silicon-rich locations. The majority of Al elements exist as corundum, whereas others exist as aluminosilicate. Because the concentration of Ga is low, determining the enrichment zones for it is difficult. As a result, EPMA was used to investigated the occurrence of Ga. Figure 3 depicts the distribution of Ga in the potassium sulfate phase, which is surrounded by corundum and amorphous silicate. To sum up, the concentration of gallium in this kind of dust was low, and its dispersion was spread. There was no evidence of an independent gallium-containing phase. Ga was mainly enriched in the potassium-rich phase. However, the potassium-rich phase was enclosed by amorphous silicate and corundum, making the extraction of gallium difficult.
The particle size distribution of brown corundum dust was determined using a laser particle-size analyzer (Malvern Mastersizer 3000, Malvern Panalytical Ltd., Malvern, UK) and a 15 min ultrasonic dispersion in ethanol. The results are shown in Figure 4. We determined that the volume fraction of particles less than 28.6 m was greater than 50% after integrating using the origin software’s integration module, whereas particles larger than 200 m accounted for 39.63%. SEM-EDS was used to figure out the composition of the bigger particles, and the results are displayed in Figure 5. The bigger particles are mostly made up of Nb, Cr, Fe, Si and C, indicating that they are alloys and carbides. Before leaching, the brown corundum dust was not ground any more.
Deionized water with conductivity of 2–10 US/CM (Canshi CM-RO-C2, Cixi Canmei Environmental Production Technology Co., Ltd., Xinji, China) was used to prepare the solution in the experiments. All of the reagents used were of analytical grade. The leaching agent was sodium hydroxide from Sinopharm Chemical Reagent Company. An ultraviolet–visible spectrophotometer (UV-6100S, Shanghai Yuanyan Instrument Co., Ltd., Shanghai, China) was employed to evaluate the concentration of gallium in the leaching solution using toluene, hydrochloric acid, methyl isobutyl ketone, titanium trichloride, thiourea and rhodamine. Ncs Testing Technology provided the standard gallium solution (GSB G 6222026-90, 1000 μg/mL).
2.2. Procedure and Method
Figure 6 depicts a schematic diagram of the experimental procedures. A specific concentration of NaOH solution was put to a 250 mL three-necked flask before the condenser was turned on. When the temperature reached the set level, the precisely weighed brown corundum dust was added to the NaOH solution, and the magnetic stirring was activated. Experiments were conducted at temperatures above 380 K in an autoclave (GCF-2, Weihai Dingda Chemical Co., Ltd., Weihai, China), where NaOH solution and the dust were injected concurrently and the start time was recorded when the predetermined temperature was attained, as displayed by Figure 6b. Suction filtration was used to separate the leachate and tailings once the leaching reaction was completed. The leaching tailings were dried in a drying oven (DZF-6050, Gongyi Yuhua Instrument Co., Ltd., Gongyi, China) at 353 K for 6 h before being pulverized and kept for further detection and analysis. The volume of the leachate was measured and then collected for analyzing the amounts of Ga and impurity elements such as Al, Si and K.
An ultraviolet–visible spectrophotometer was used to determine the concentration of gallium. The leachate was first diluted, and then it was deposited in a separatory funnel. The sodium gallate was then converted into a chlorogallate complex anion using 6 mol/L hydrochloric acid. The chlorogallate complex anion was then extracted with toluene–methyl isobutyl ketone (Vtoluene:Vmethyl isobutyl ketone = 6:3.5), the resulting organic phase was washed with 50 g/L thiourea and titanium trichloride, and rhodamine B was added to produce a red complex with gallium. A small amount of the organic phase was taken out and transferred into a cuvette. Finally, the cuvette was placed in the UV-Vis spectrophotometer with a wavelength range of 190–1100 nm, and the absorbance was measured at the maximum absorption wavelength of 557 nm. To eliminate systematic errors caused by sample decomposition, the calibration method (Chinese GB/T 8208-2007) was utilized [34,35].
We used triplication to measure a single sample. The experiment was repeated if a single sample is aberrant.
3. Results and Discussion
3.1. Thermodynamics of the Leaching Reactions
To assess the feasibility of the leaching reactions between the brown corundum dust and the leaching agent, the thermodynamic software HSC Chemistry 6.0 (Outotec Corporation, Espoo, Finland) was utilized. Equations (1)–(7) depict the main reactions that may occur in the leaching process based on the phase and chemical compositions of the brown corundum dust. Figure 7 displays the standard Gibbs free energy change, ΔrGθ–T, diagram, the nonstandard Gibbs free energy change ΔrG–T diagram (ΔrG = ΔrGθ + RTlnQ, R-ideal gas constant, 8.314 J/(mol·K); T—Kelvin temperature, K; Q—reaction quotient, J) and the standard reaction enthalpy change, ΔrHθ–T, diagram.
Figure 7a shows the standard Gibbs free energy changes for reactions (1)–(7) over the range of 273–373 K. Reactions (1) and (2) were shown to be less likely to occur under the standard state. As demonstrated in Figure 7b, increasing the concentration of OH− can boost reaction (1) and make processes (2)–(4) more thermodynamically feasible. The Gibbs free energy shift is greater in reaction (3) than in reaction (4), indicating that the amorphous SiO2 is more reactive with sodium hydroxide. When high concentrations of and are present in the sodium hydroxide leaching solution system, precipitations of NaAlSiO4 and KAlSiO4 will form via reactions (5) and (6), which may absorb gallium ions and cause coprecipitation. As the temperature rises, the feasibility of reactions (1) and (4) decreases, whereas reactions (5) to (7) improve. Figure 7c shows that, with the exception of reactions (5) and (6), all other reactions are exothermic. This suggests that increasing the leaching temperature causes more dissolved and to precipitate, leading to a decrease in the concentration of Ga in the leaching system.
According to the thermodynamic calculations, dilute alkaline leaching is less reactive with amorphous silicate and corundum. In the case of brown corundum dust, this indicates that gallium is extracted ineffectively because the majority of gallium is surrounded by these two phases. To recover gallium efficiently, the concentration of sodium hydroxide solution must be increased. However, as more silicate and aluminate appear in the leaching solution system, the production of aluminosilicate precipitate is increased, which may absorb gallium ions and have a detrimental influence on gallium extraction.
Gallium and aluminum are both IIIA elements with similar chemical characteristics in aqueous solution as illustrated by the E–pH plot (Figure 8). Gallium and aluminum exist as trivalent cations in acidic conditions. Metal hydroxides of Ga(OH)3 and Al(OH)3 are the major species in the mildly acidic and neutral pH ranges [36]. Gallium and aluminum both exist stably in alkaline aqueous solution as GaO2− and AlO2−. When the temperature rises from 313 to 380 K, these two species’ stable existence areas are extended and shift to a lower pH direction, such as 7.12 for GaO2− and 8.80 for AlO2−. Additionally, silicon is found as SiO44− in the alkaline solution (pH > 13.0). As a result, gallium exists in the leachate of the brown corundum dust in the form of GaO2−, whereas impurities of Al and Si exist in the solution in ionic form as well, adding load to the subsequent separation and purification works.
3.2. Relationships between Gallium Recovery and Leaching Factors
3.2.1. The Effect of NaOH Solution Concentration
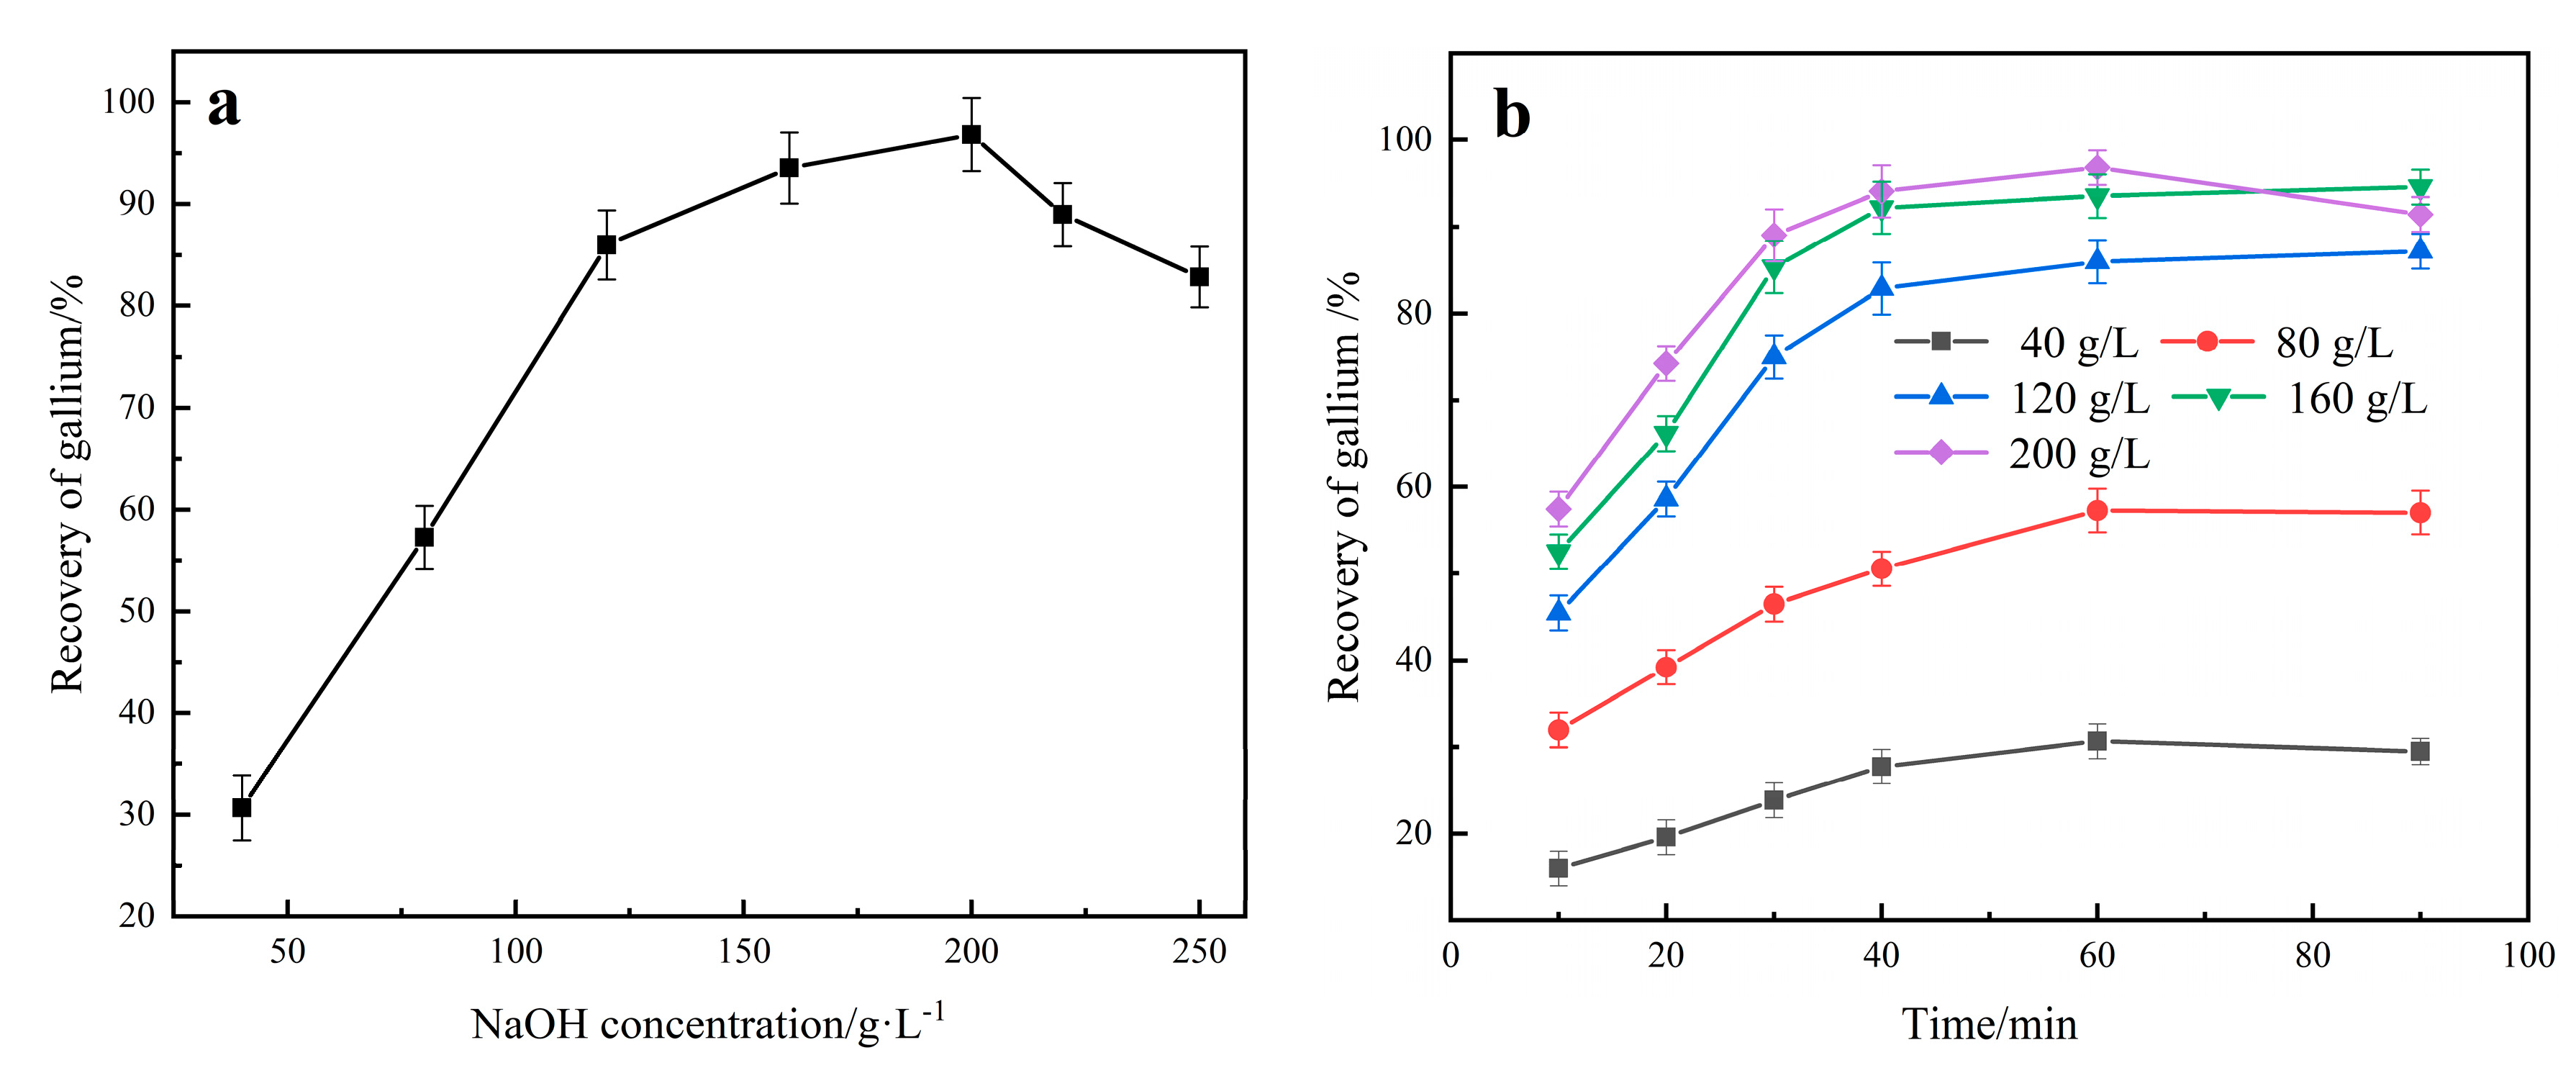
The concentration of NaOH solution has a significant impact on Ga recovery, as illustrated in Figure 9a,b. Its influence has two effects. On the one hand, when the concentration increases from 40 g/L to 200 g/L, the recovery of Ga increases dramatically, reaching a maximum of 96.83% at 200 g/L. More alkali can increase the leaching reactions involved in attacking and dissolving the aluminates and silicates that envelope the gallium-containing phase. The recovery of Ga, on the other hand, declines as the NaOH solution concentration reaches above 200 g/L. This differs from the experimental data obtained by K. Wen et al. [32], in which the leaching rate reached 82.6% at 353 K for 120 min as the mass ratio of alkali to ore was increased to 1.2:1, and then gradually increased until it reached a level when the ratio of alkali to ore was further improved. This could be because the NaOH solution concentration range they picked is lower than that used in this study, and the higher concentrations of sodium hydroxide solution increased the reactions between SiO4−, AlO2− and Na+, as shown in reaction (5).
As shown in Figure 10, when the concentration of NaOH solution is 100 g/L, the tailings are primarily constituted of corundum and quartz, with a trace of sodium aluminate (NaAlO2). Leucite is formed as the concentration is increased to 150 g/L. Increasing the concentration accelerates the reactions between Al2O3, SiO2 and NaOH, releasing more gallium into the solution. The peaks for quartz (SiO2) disappear in the XRD pattern of the tailings obtained at a NaOH solution concentration of 250 g/L, showing that more SiO2 has reacted with the leaching agent of NaOH. In fact, in the leaching experiments, we found that as the concentration of the NaOH solution grew, the slurry became more viscous, which was caused by the increasing silicic acid gel content in the slurry. Furthermore, as more SiO2 was introduced into the solution, the reactions between silicate, aluminate, potassium and sodium, as illustrated by reaction (5) and reaction (6), began. Consequently, when the concentration was higher than 200 g/L, sodium aluminosilicates were formed, as shown in the tailings XRD pattern. The aluminosilicate adsorbed Ga and coprecipitated, resulting in a decrease in the recovery of Ga.
To sum up, increasing the alkali concentration enhances the leaching reactions within a given concentration range. Side reactions take place and speed up when the concentration exceeds 200 g/L, and then precipitates of sodium aluminosilicate form, causing a decline in gallium recovery.
3.2.2. The Effect of Leaching Duration and Temperature
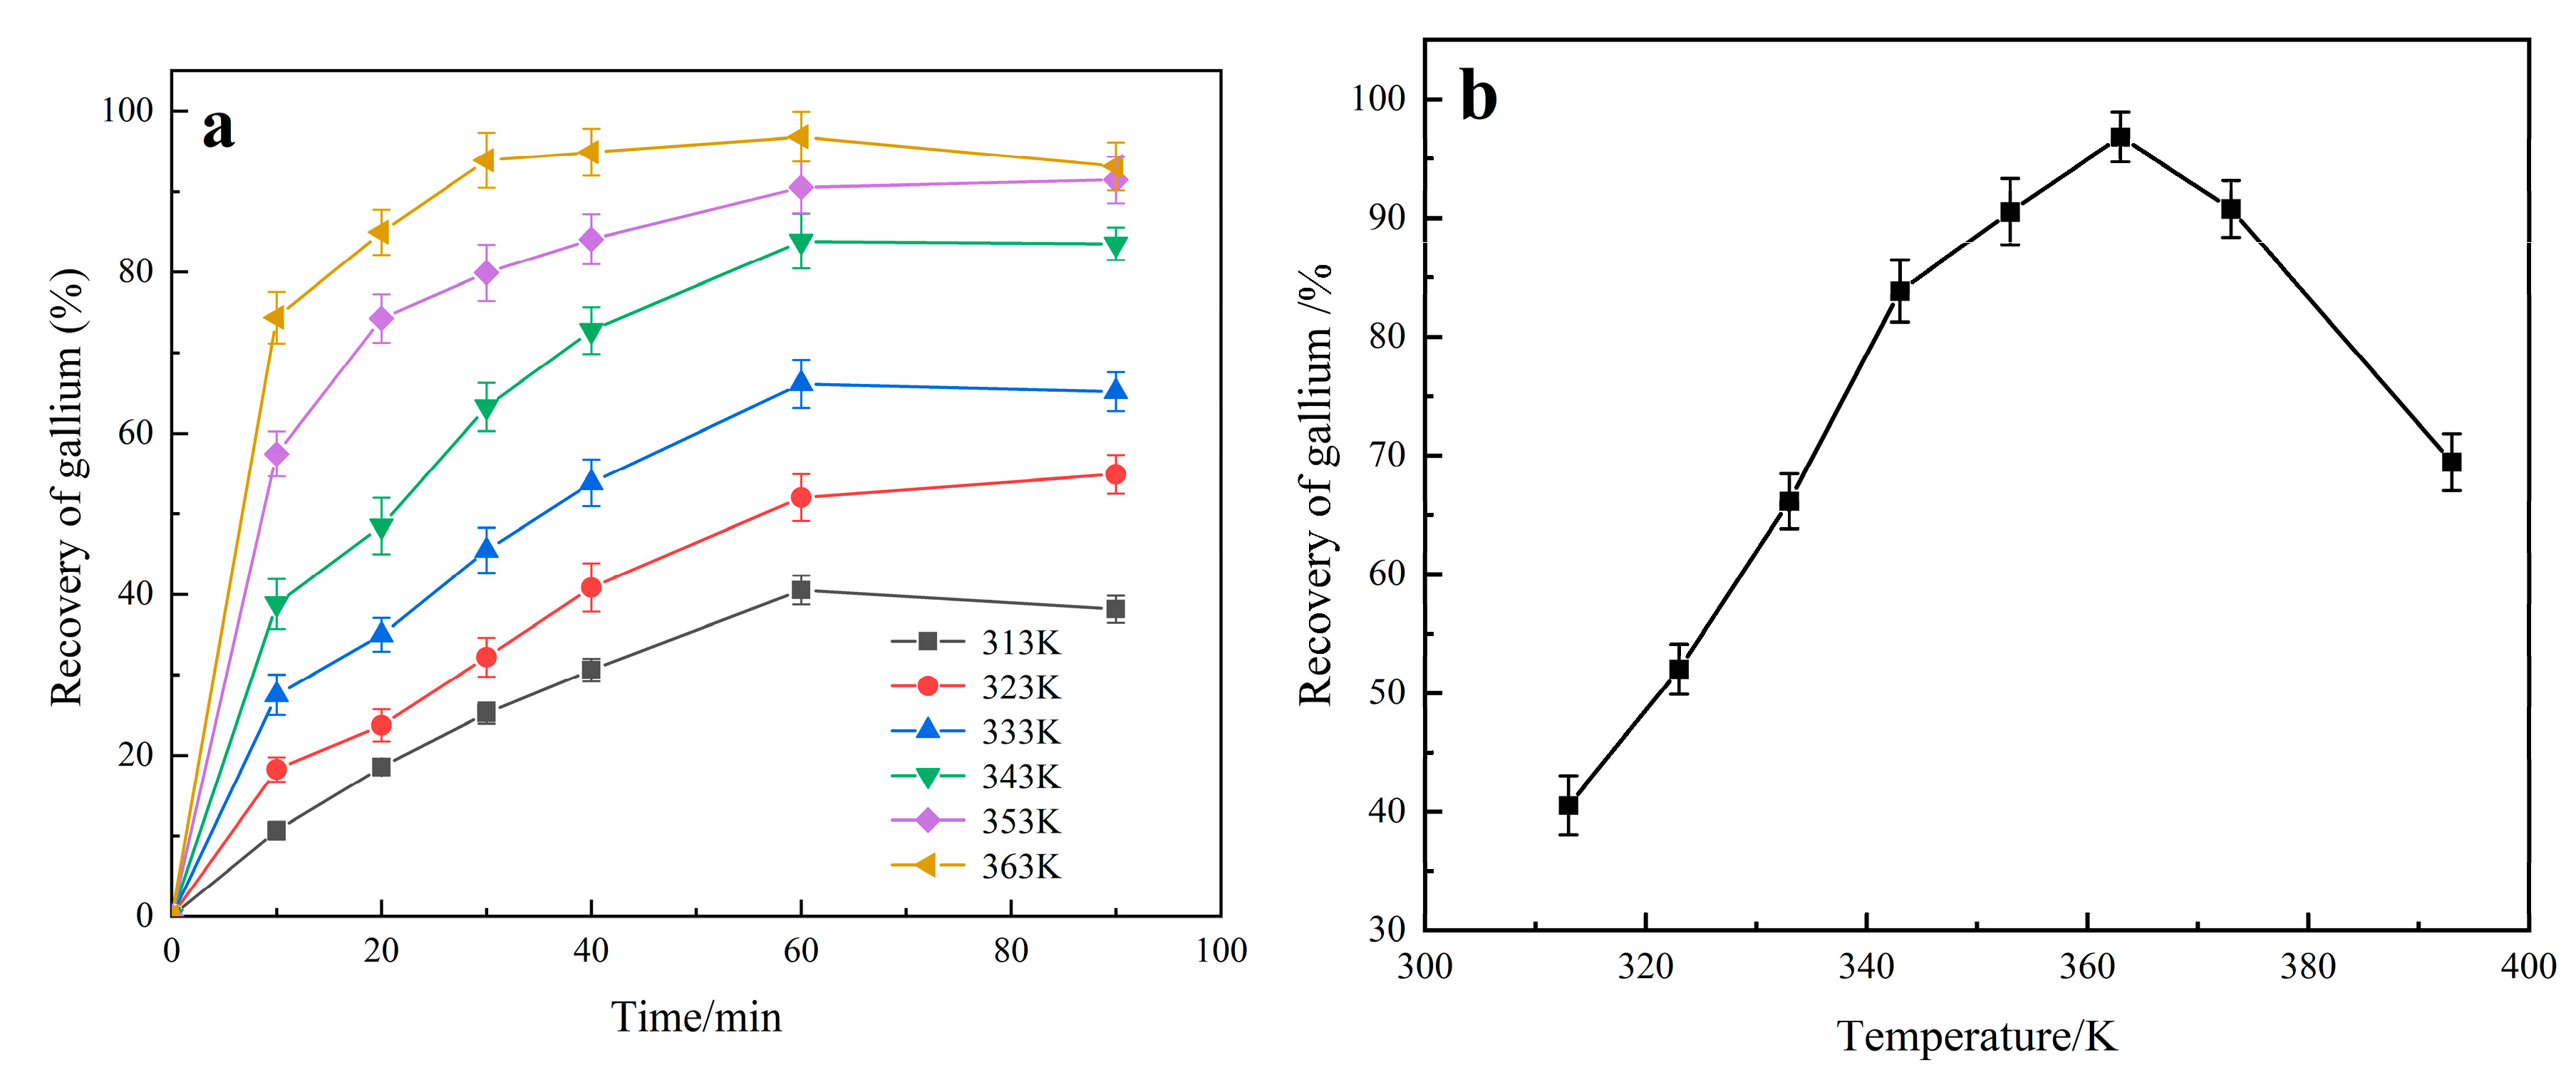
Figure 11a depicts the change in Ga recovery with leaching time at various leaching temperatures. The recoveries of Ga at temperatures ranging from 313 to 363 K all gradually increase with the progress of the leaching within the initial 60 min, indicating that sufficient time is required to completely react the Ga-containing phase with the NaOH solution. A maximum recovery of 96.83% appears at 363 K when the leaching time is 60 min. The recovery of gallium slows as the reaction time increases from 60 min to 90 min. The reason for this is that as the reaction time gets longer, side reactions (reactions (5)–(7)) occur in the leaching system, and sodium and potassium aluminosilicates are formed on the surface of the unreacted raw particles, causing the leaching reactions to slow down, especially the reactions occurring at higher temperatures over 363 K. As shown in Figure 11b, when the temperature rises from 363 to 393 K (because the boiling point of 200 g/L NaOH solution is about 380 K, the experiments above 380 K were implemented in an autoclave, and the other leaching parameters were the same as those of the atmospheric leaching experiments), the recovery of gallium decreases from 96.83% to 69.45%. This is because the rate of side reactions increases with increasing leaching temperature, and more gallium is absorbed and coprecipitates with the sodium aluminosilicates and potassium aluminosilicate.
Figure 12 demonstrates this point. The leaching rates of Ga and K follow the same trend and start to reduce at 60 min, whereas the leaching rates of Al and Si change consistently and begin to decline at 40 min, indicating that side reactions take place. Then, when more Ga is absorbed by the aluminosilicates and precipitates into the tailings, the recovery of Ga decreases.
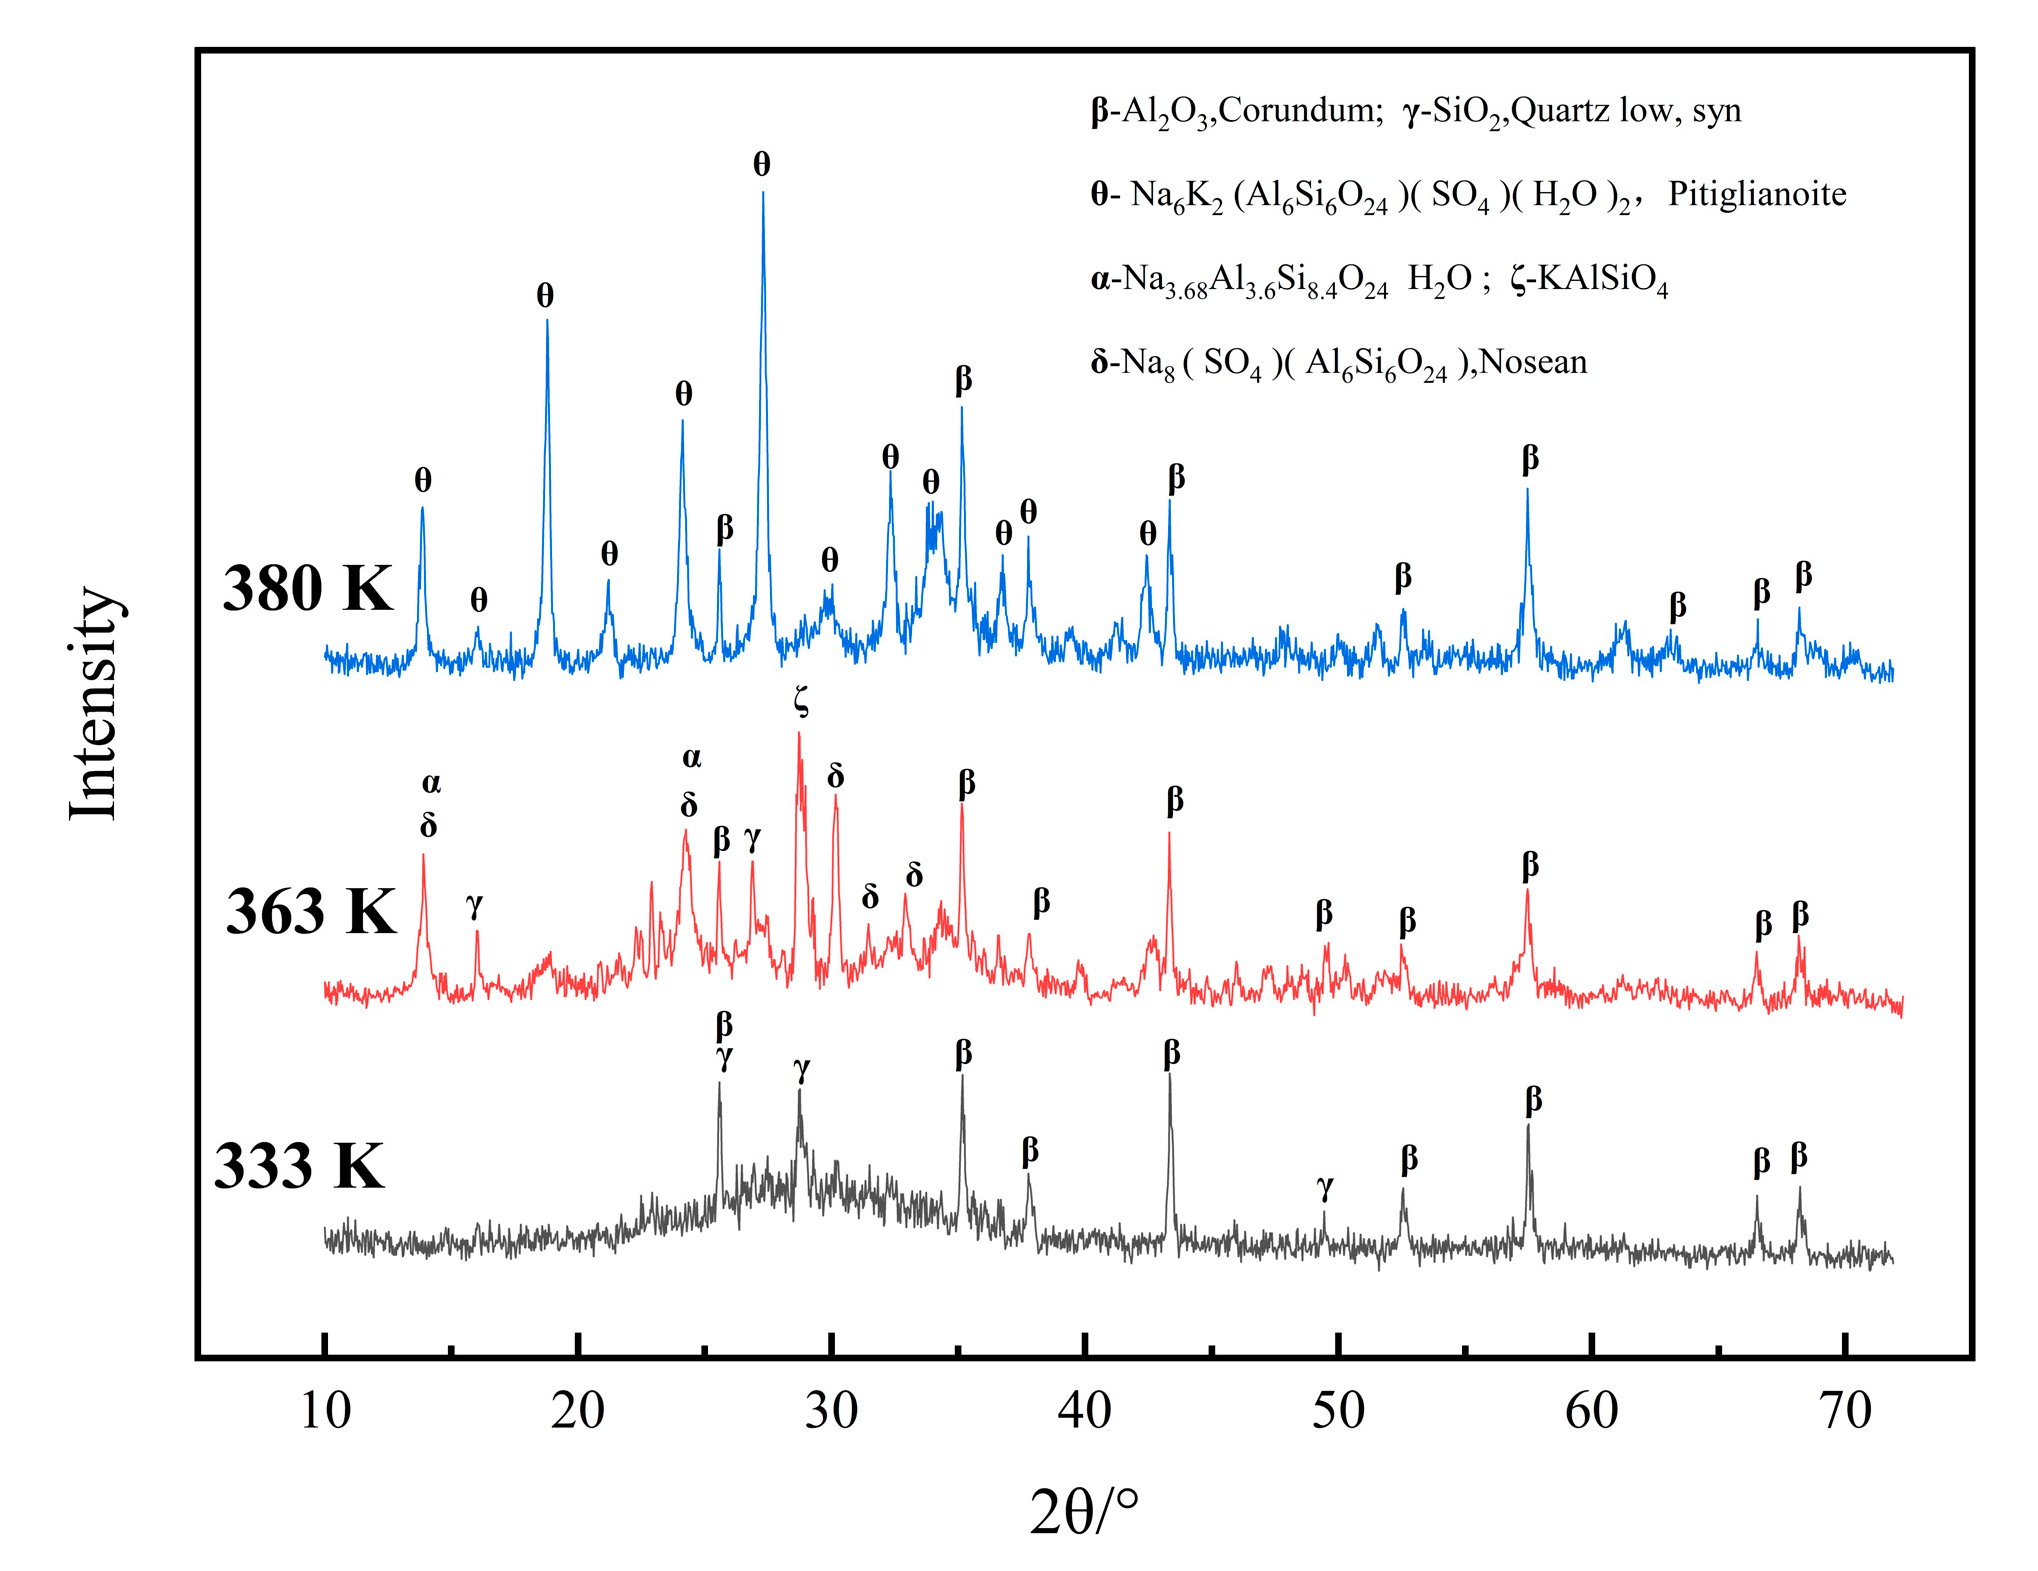
To better understand why gallium recovery decreased when the temperature reached above 363 K, the leaching tailings obtained at different leaching temperatures were characterized by XRD and SEM-EDS, as displayed by Figure 13 and Figure 14 and Table 2. It is found that as the temperature rises from 333 to 363 K, the content of corundum and quartz in the residues decreases, and sodium aluminosilicates (Na3.68Al3.6Si8.4O24∙H2O, Na8SO4Al6Si6O24) appear in the leaching tailings. As the temperature rises to 383 K, there are no peaks for the quarts, but pitiglianoite Na6K2 (Al6Si6O24)(SO4)(H2O)2 is generated as a result of side reactions driven by the greater silicon concentration in the leaching solution. This is also supported by Figure 14. Unreacted particles (points 2 and 3 in Figure 14a) with little or less solidum still persist in the tailings, showing that the leaching processes are incomplete. The side reactions generate additional sodium aluminosilicates (points 5, 6, 8) that absorb gallium ions (point 7), resulting in a drop in the concentrations of Ga, Si, Al and K in the leachate.
3.2.3. The Effect of Stirring Speed
Figure 15 shows that the recovery of gallium does not change substantially when the stirring speed is higher than 850 rpm, with the highest recovery (96.83%) occurring at this speed. However, within the 0–850 rpm rotation speed range, the recovery increases dramatically with the increase in stirring speed. This is because increasing the stirring speed aids the external diffusion of the leaching agent. Additionally, the shearing force of stirring could thin the solid product layer on the surface of the brown corundum dust particles, reducing the leaching agent’s internal diffusion resistance. The leaching speed increases with the thickness of the diffusion layer. As a result, 850 rpm is selected as the suitable stirring speed.
3.2.4. The Effect of Solid–Liquid Ratio
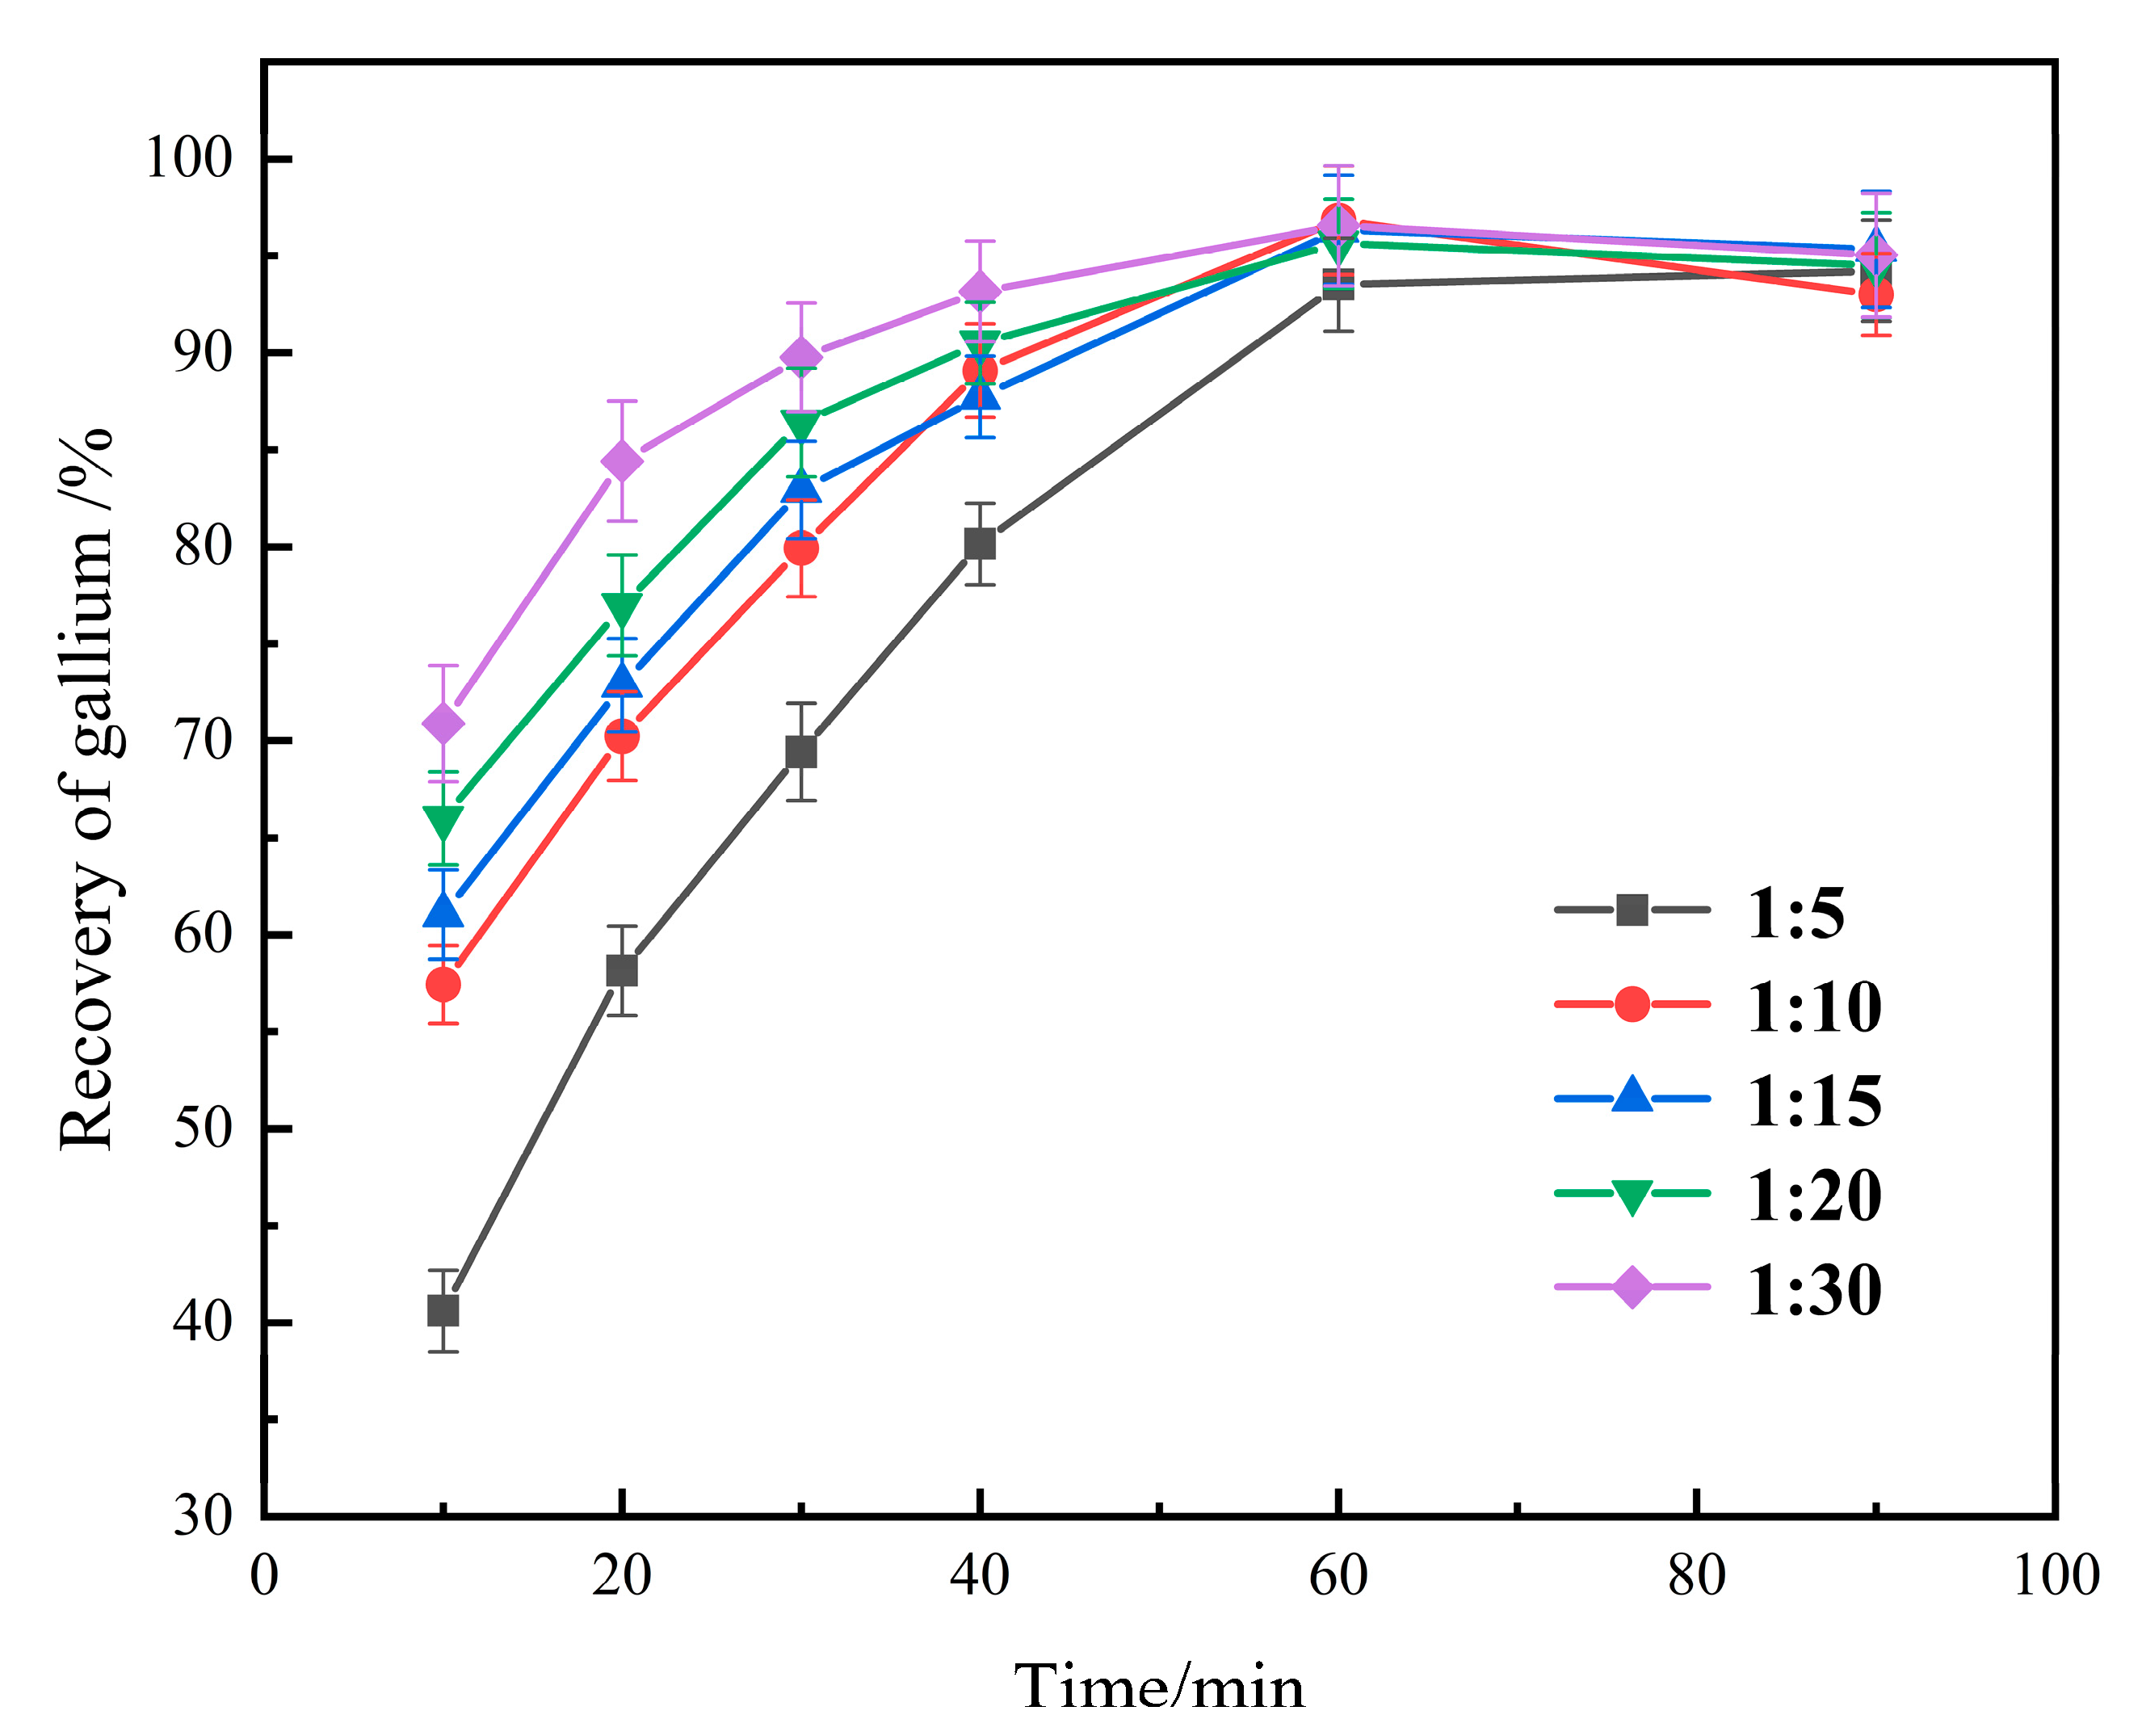
Figure 16 shows that when the solid–liquid ratio exceeds 1:10, the recovery is no longer significantly increased. This is due to a lack of leaching agent coming into contact with the brown corundum dust particles when the solid–liquid ratio is high. The viscosity of the slurry lowers as the solid–liquid ratio falls, making it more favorable to the diffusion of the leaching agent and the products. This positive effect will diminish as the solid–liquid ratio decreases; however, an excessively small solid–liquid ratio requires a considerable amount of NaOH consumption, adding burden to the solution’s treatment. Therefore, a solid–liquid ratio of 1:10 is more suited.
3.3. Kinetics Equation for the Leaching Process
Gallium extraction with NaOH solution is a complex solid–liquid multiphase process in which certain substances react with sodium hydroxide and transfer into the solution, while some non-reactive components and solid products remain on the unreacted core’s surface. As a result, the unreacted nuclear shrinkage model [33,37,38] is adopted to analyze the leaching process of brown corundum dust and to estimate the rate-controlling step [39,40].
Spheres are commonly used to represent reacting solid particles [41]. Following the selection of the kinetic equations related to the shrinking core model, the three kinetic equations shown below are used to analyze the leaching extraction of Ga from brown corundum dust, where α represents the leaching rate of Ga, %, k is the reaction rate constant, min−1, and t is the leaching time, min.
- (1)
- If the leaching process is regulated by an internal diffusion (Ginstling–Brounshtein), the kinetics should be as follows:
kt = 1 − 2α/3 − (1 − α)2/3
- (2)
- If the leaching process is regulated by chemical reactions (interface), the leaching kinetics should be as follows:
kt = 1 − (1 − α)1/3
- (3)
- If the leaching process is regulated by a transfer across the sphere’s contacting interface [42], the kinetics of the leaching process should be as follows:
kt = 1/(1 − α)1/3 − 1
The experimental data were fitted using the three equations listed above, and the fitting lines are depicted in Figure 17. To assess the reliability of the dynamic equations, the linear correlation coefficient (R2) values were used.
We found that the equation proposed by Dickinson et al. [30] (kt = 1/(1 − α)1/3 − 1) was the best fitting one by comparing the correlation coefficient values of the fitting lines. This means that, assuming the interacting solid particles are spherical, the leaching process is controlled by diffusion across the contacting interface, and the leaching rate is related to the surface area of the solid particles. As the reaction progresses, the solid particles shrink and the radius decreases, affecting the area of the interface directly.
The reaction rate constant, k, was calculated based on the slope of the straight lines in Figure 17c, and the lnk-1/T curve was plotted (Figure 18). The apparent activation energy, Ea = 42.83 kJ/mol, was determined, as well as the pre-exponential factor, lnA = 10.68. Although the apparent activation energy value is somewhat higher than 41.8 kJ/mol, which usually indicates that the chemical reaction controls the reaction process, additional studies have proved that the activation energy is not the only criterion for determining the reaction rate-controlling step [43,44,45,46,47].
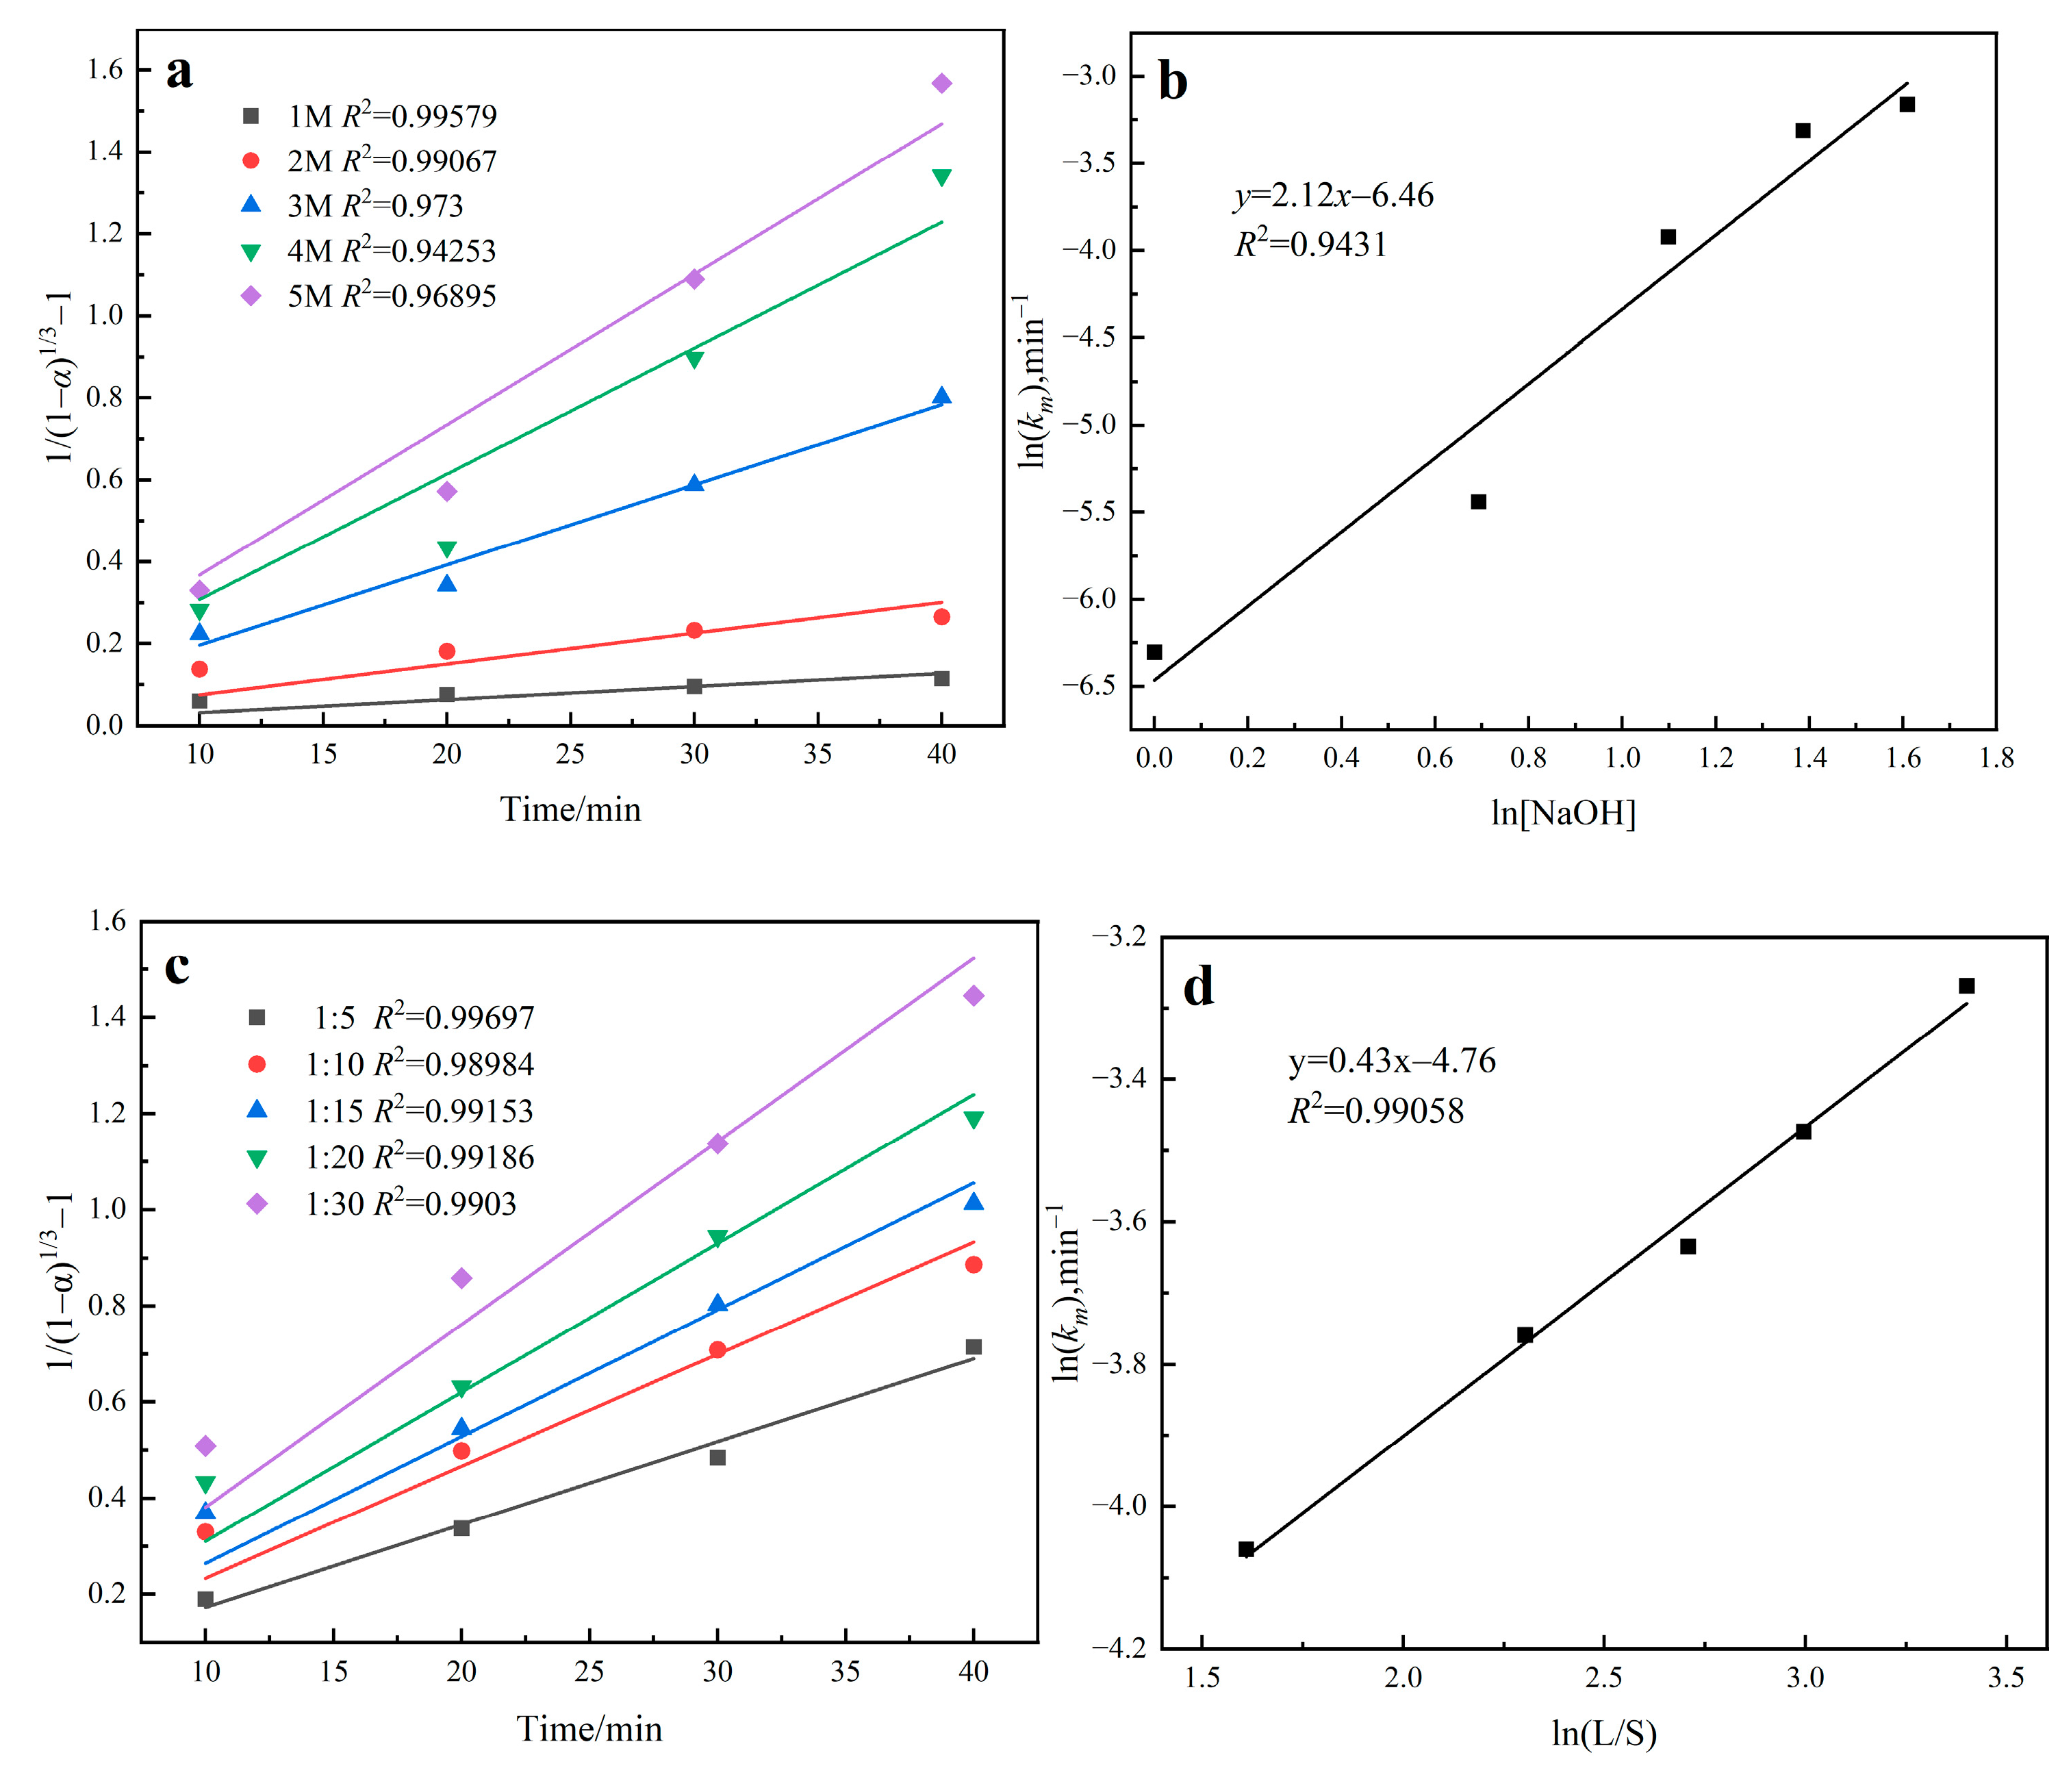
Considering that other factors, including the NaOH solution concentration and solid–liquid ratio, affect the apparent rate constant, k, the dynamic equation is expressed as Equation (11) [48]. The slope of the fitting straight lines (Figure 19a,c) can be used to calculate the apparent rate constant (km) value, and the ln(km) versus ln (CNaOH) and ln(km) versus ln(L/S) plots (Figure 19b,d) were established to determine the reaction orders of the NaOH solution concentration and solid–liquid ratio, respectively. Equation (12) describes the final kinetic equation.
where, km denotes the apparent rate constant; A denotes the Arrhenius constant, which was estimated to be 4.34 × 10⁴ based on the intercept of the straight line in Figure 18; a and b denote the reaction order as it relates to the NaOH solution concentration and solid–liquid ratio, respectively; Ea is the activation energy of the reaction; R is the gas constant; and T is the thermodynamic temperature.
km = A(CNaOH)a (L/S)bexp[−Ea/RT]
1/(1 − α)1/3 − 1= A(CNaOH)a (L/S)bexp[−Ea/(RT)]t
Figure 19a displays the linear fitting results for the data obtained at different concentrations (as indicated in Figure 9b), which were fitted with the equation 1/(1 − α)1/3 − 1 =kmt. The slopes of the straight lines were used to obtain the apparent rate constant, km, at different concentrations, and then a plot of ln(km) versus ln (CNaOH) was produced (Figure 19b) to determine the empirical reaction order a. It was equal to the slope of 2.12. In the same way, the empirical reaction order b related to the solid-to-liquid ratio was predicted to be 0.43 according to the slope of lines illustrated in Figure 19c,d. Substituting the derived values into Equation (12) yields Equation (13), which accurately represents the relationship of gallium recovery on the leaching temperature, solution concentration, and solid-to-liquid ratio during the leaching process of brown corundum dust with sodium hydroxide solution.
1/(1 − α)1/3 − 1 = 4.34 × 10⁴ × (CNaOH)2.12 (L/S)0.43exp[−42835/(RT)]t
4. Conclusions
Gallium was successfully extracted from brown corundum dust using the one-step direct alkaline leaching method, and the following conclusions were drawn.
Gallium is relatively concentrated in the potassium-rich phase, which is surrounded by corundum and silicates. Though the raw material contains up to 42% SiO2, silicon is mostly amorphous, which is beneficial in the reaction with sodium hydroxide. According to the thermodynamics of the aqueous solution, gallium and the main impurities, including potassium, silicon and aluminum, coexist stably in the leaching system in the forms of GaO2−, K+, SiO44− and AlO2−, respectively, complicating the subsequent leachate purification.
The NaOH solution concentration, leaching time and leaching temperature all have a significant impact on gallium recovery, while the solid-to-liquid ratio and stirring rate have a minor impact. The maximum recovery of 96.83% was obtained under the leaching conditions of 200 g/L of NaOH, a 363 K leaching temperature, a 60 min leaching time, a 1:10 (g/mL) solid-to-liquid ratio, and an 850 rpm stirring rate. Increasing the leaching temperature above 363 K or the NaOH solution concentration beyond 200 g/L has a negative effect on the gallium extraction, as side reactions between Na+, K+, SiO44− and AlO2− are accelerated and the precipitation of aluminosilicates absorb gallium from the solution and co-precipitate with gallium. Hence, it is critical to control the values of these two parameters in order to achieve a high extraction of gallium from this type of brown corundum dust, limiting the generation of sodium aluminosilicate and potassium aluminosilicate and reducing the impact of adverse reactions.
The process of extracting gallium from brown corundum dust particles via leaching with NaOH solution is a complex solid–liquid heterogeneous reaction that can be described through a typical unreacted nuclear shrinking model. The experimental kinetic data are best described by the kinetic equation kt = 1/(1 − α)1/3 − 1, which shows that the kinetic process is governed by diffusion in relation to the contact area of the unreacted core. The apparent activation energy was 42.83 kJ/mol, the reaction orders of the NaOH concentration and solid–liquid ratio were 2.12 and 0.43, respectively, and the final kinetic equation was 1/(1 − α)1/3 – 1 = 4.34 × 10⁴ × (CNaOH)2.12 (L/S)0.43exp[−42835/(RT)] t.
Based on the influence of the NaOH solution concentration and leaching temperature, we discovered that it is critical to control the values of these two parameters in order to achieve a high extraction of gallium from this type of brown corundum dust, limiting the generation of sodium aluminosilicate and potassium aluminosilicate and reducing the impact of adverse reactions.
Due to the poor selectivity of alkaline leaching over impurity elements such as Al and Si, which enter the leaching solution with Ga, leachate purification is critical to the overall process’s efficient recovery of gallium. We used a combination of chemical precipitation and solvent extraction to remove the impurity ions from Ga, with the goal of recovering Si and restarting the Na cycle. In the future, we will need to carry out an in-depth and systematic investigation of this purifying task.
Author Contributions
Conceptualization, J.Z.; methodology, X.H.; software, X.H.; validation, X.H.; formal analysis, Y.C.; investigation, C.G. and Y.C.; resources, J.Z.; data curation, C.G. and X.H.; writing—original draft preparation, C.G.; writing—review and editing, J.Z. and X.H.; visualization, C.G.; supervision, J.Z.; project administration, J.Z.; funding acquisition, J.Z. All authors have read and agreed to the published version of the manuscript.
Funding
This research was funded by the Hubei Provincial Key Technologies R & D Program: (2022BCA058), the China Scholarship Council (202008420104) and the National Natural Science Foundation of China (51804230).
Data Availability Statement
They will be available on request.
Acknowledgments
We would like to thank Guohong Zhang and Wei Yuan at the Analytical and Testing Center of Wuhan University of Science and Technology for the help on EPMA analysis.
Conflicts of Interest
The authors declare no conflict of interest.
References
- Moskalyk, R.R. Gallium: The backbone of the electronics industry. Miner. Eng. 2003, 16, 921–929. [Google Scholar] [CrossRef]
- Naumov, A.V. Status and prospects of world gallium production and the gallium market. Metallurgist 2013, 57, 367–371. [Google Scholar] [CrossRef]
- Font, O.; Querol, X.; Juan, R.; Casado, R.; Ruiz, C.R.; López-Soler, Á.; Coca, P.; Peña, F.G. Recovery of gallium and vanadium from gasification fly ash. J. Hazard. Mater. 2007, 139, 413–423. [Google Scholar] [CrossRef]
- Négrel, P.; Ladenberger, A.; Reimann, C.; Birke, M.; Sadeghi, M. Distribution of Rb, Ga and Cs in agricultural land soils at European continental scale (GEMAS): Implications for weathering conditions and provenance. Chem. Geol. 2018, 479, 188–203. [Google Scholar] [CrossRef]
- Strunz, H. Söhngeit, Ga(OH)3, Ein Neues Mineral. Die Naturwissenschaft. 1965, 52, 493. [Google Scholar] [CrossRef]
- Lu, F.; Xiao, T.; Lin, J.; Li, A.; Long, Q.; Huang, F.; Xiao, L.; Li, X.; Wang, J.; Xiao, Q.; et al. Recovery of gallium from Bayer red mud through acidic-leaching-ion-exchange process under normal atmospheric pressure. Hydrometallurgy 2018, 175, 124–132. [Google Scholar] [CrossRef]
- Zhao, Z.; Yang, Y.; Xiao, Y.; Fan, Y. Recovery of gallium from Bayer liquor: A review. Hydrometallurgy 2012, 125–126, 115–124. [Google Scholar] [CrossRef]
- Okudan, M.D.; Akcil, A.; Tuncuk, A.; Deveci, H. Recovery of gallium and aluminum from electrofilter dust of alumina calcination plant in Bayer process. Sep. Sci. Technol. 2015, 50, 2596–2605. [Google Scholar] [CrossRef]
- Gladyshev, S.V.; Akcil, A.; Abdulvaliyev, R.A.; Tastanov, E.A.; Beisembekova, K.O.; Temirova, S.S.; Deveci, H. Recovery of vanadium and gallium from solid waste by-products of Bayer process. Miner. Eng. 2015, 74, 91–98. [Google Scholar] [CrossRef]
- Huang, J.; Wang, Y.; Zhou, G.; Gu, Y. Exploring a promising technology for the extraction of gallium from coal fly ash. Int. J. Coal Prep. Util. 2022, 42, 1712–1723. [Google Scholar] [CrossRef]
- Zhao, Z.; Cui, L.; Guo, Y.; Gao, J.; Li, H.; Cheng, F. A stepwise separation process for selective recovery of gallium from hydrochloric acid leach liquor of coal fly ash. Sep. Purif. Technol. 2021, 265, 118455. [Google Scholar] [CrossRef]
- Xu, K.; Deng, T.; Liu, J.; Peng, W. Study on the recovery of gallium from phosphorus flue dust by leaching with spent sulfuric acid solution and precipitation. Hydrometallurgy 2007, 86, 172–177. [Google Scholar] [CrossRef]
- Zhou, J.; Zhu, N.; Liu, H.; Wu, P.; Zhang, X.; Zhong, Z. Recovery of gallium from waste light emitting diodes by oxalic acidic leaching. Resour. Conserv. Recycl. 2019, 146, 366–372. [Google Scholar] [CrossRef]
- Swain, B.; Mishra, C.; Kang, L.; Park, K.-S.; Lee, C.G.; Hong, H.S. Recycling process for recovery of gallium from GaN an e-waste of LED industry through ball milling, annealing and leaching. Environ. Res. 2015, 138, 401–408. [Google Scholar] [CrossRef] [PubMed]
- Flerus, B.; Friedrich, B. Recovery of Gallium from Smartphones—Part II: Oxidative Alkaline Pressure Leaching of Gallium from Pyrolysis Residue. Metals 2020, 10, 1565. [Google Scholar] [CrossRef]
- Macías-Macías, K.Y.; Ceniceros-Gómez, A.E.; Gutiérrez-Ruiz, M.E.; González-Chávez, J.L.; Martínez-Jardines, L.G. Extraction and recovery of the strategic element gallium from an iron mine tailing. J. Environ. Chem. Eng. 2019, 7, 102964. [Google Scholar] [CrossRef]
- Wu, X.L.; Qin, W.Q.; Wu, S.K.; Ma, X.H.; Niu, Y.J.; Yang, C.R. Recovery of gallium from zinc concentrate by pressure oxygen leaching. Rare Met. 2013, 32, 622–626. [Google Scholar] [CrossRef]
- Rao, S.; Liu, Z.; Wang, D.; Cao, H.; Zhu, W.; Zhang, K.; Tao, J. Hydrometallurgical process for recovery of Zn, Pb, Ga and Ge from Zn refinery residues. Trans. Nonferrous Met. Soc. China 2021, 31, 555–564. [Google Scholar] [CrossRef]
- Liu, S.; Sweatman, K.; McDonald, S.; Nogita, K. Ga-Based Alloys in Microelectronic Interconnects: A Review. Materials 2018, 11, 1384. [Google Scholar] [CrossRef] [PubMed]
- De Paula, W.J.; Tavares, P.L.; Pereira, D.D.C.; Tavares, G.M.; Silva, F.L.; Almeida, P.S.; Braga, H.A.C. A review on gallium nitride switching power devices and applications. In Proceedings of the 2017 Brazilian Power Electronics Conference (COBEP), Juiz de Fora, Brazil, 19–22 November 2017; IEEE: Piscataway, NJ, USA, 2017; pp. 1–7. [Google Scholar]
- Hasan, M.N.; Swinnich, E.; Seo, J.-H. Recent Progress in Gallium Oxide and Diamond Based High Power and High-Frequency Electronics. Int. J. High Speed Electron. Syst. 2019, 28, 1940004. [Google Scholar] [CrossRef]
- Tsao, J.Y.; Chowdhury, S.; Hollis, M.A.; Jena, D.; Johnson, N.M.; Jones, K.A.; Kaplar, R.J.; Rajan, S.; Van de Walle, C.G.; Bellotti, E.; et al. Ultrawide-Bandgap Semiconductors: Research Opportunities and Challenges. Adv. Electron. Mater. 2018, 4, 1600501. [Google Scholar] [CrossRef]
- Li, W.; Nomoto, K.; Hu, Z.; Jena, D.; Xing, H.G. Guiding principles for trench schottky barrier diodes based on ultrawide bandgap semiconductors: A case study in Ga2O3. IEEE Trans. Electron Devices 2020, 67, 3938–3947. [Google Scholar] [CrossRef]
- Dalla Vecchia, M.; Ravyts, S.; Van den Broeck, G.; Driesen, J. Gallium-nitride semiconductor technology and its practical design challenges in power electronics applications: An overview. Energies 2019, 12, 2663. [Google Scholar] [CrossRef]
- Breeman, W.A.P.; de Blois, E.; Sze Chan, H.; Konijnenberg, M.; Kwekkeboom, D.J.; Krenning, E.P. 68Ga-labeled dota-peptides and 68ga-labeled radiopharmaceuticals for positron emission tomography: Current status of research, clinical applications, and future perspectives. Semin. Nucl. Med. 2011, 41, 314–321. [Google Scholar] [CrossRef] [PubMed]
- De Assis, A.S.J.; Pegoraro, G.M.; Duarte, I.C.S. Evolution of gallium applications in medicine and microbiology: A timeline. BioMetals 2022, 35, 675–688. [Google Scholar] [CrossRef] [PubMed]
- Chitambar, C.R. Medical Applications and Toxicities of Gallium Compounds. Int. J. Environ. Res. Public Health 2010, 7, 2337–2361. [Google Scholar] [CrossRef]
- Cook, T.; Franconi, N.; Shea, B.; Wilson, C.; Grainger, B.; George, A.; Barchowsky, A. Radiation-tolerant, gan-based point of load converters for small spacecraft missions. In Proceedings of the Small Satellite Conference 2018, Logan, UT, UAS, 4–9 August 2018. [Google Scholar]
- Hall, C.; Pastra, C.L.; Burell, A.; Gladin, J.; Mavris, D. Projecting Power Converter Specific Power Through 2050 for Aerospace Applications. In Proceedings of the 2022 IEEE/AIAA Transportation Electrification Conference and Electric Aircraft Technologies Symposium, Anaheim, CA, USA, 15–17 June 2022. [Google Scholar]
- Zhao, P.; Zhang, H.; Gao, H.; Zhu, Y.; Yu, J.; Chen, Q.; Zhao, H. Separation and characterisation of fused alumina obtained from aluminium-chromium slag. Ceram. Int. 2018, 44, 3590–3595. [Google Scholar] [CrossRef]
- Wen, K.; Jiang, F.; Zhou, X.; Sun, Z. Leaching of gallium from corundum flue dust using mixed acid solution. Trans. Nonferrous Met. Soc. China 2018, 28, 1862–1868. [Google Scholar] [CrossRef]
- Wen, K.; Jiang, F.; Zhou, X.; Sun, Z. Recovery of gallium from corundum flue dust by two-stage alkali leaching, carbonation, acid leaching and solvent extraction process. Metals 2018, 8, 545. [Google Scholar] [CrossRef]
- Ding, W.; Bao, S.; Zhang, Y.; Xiao, J. Mechanism and kinetics study on ultrasound assisted leaching of gallium and zinc from corundum flue dust. Miner. Eng. 2022, 183, 107624. [Google Scholar] [CrossRef]
- Østergaard, J. UV/Vis Spectrophotometry and UV Imaging. In Analytical Techniques in the Pharmaceutical Sciences. Advances in Delivery Science and Technology; Müllertz, A., Perrie, Y., Rades, T., Eds.; Springer: New York, NY, USA, 2016; pp. 3–27. [Google Scholar] [CrossRef]
- General Administration of Quality Supervision, Inspection and Quarantine of the People’s Republic of China. Available online: https://openstd.samr.gov.cn/bzgk/gb/newGbInfo?hcno=565066AD4FE96E560C4CA0A3DC5EB220 (accessed on 1 October 2007).
- Brookins, D.G. Eh-pH Diagrams for Geochemistry; Springer: Berlin/Heidelberg, Germany, 1988; ISBN 978-3-642-73095-5. [Google Scholar]
- Hui, X.; Zhang, J.; Liang, Y.; Chang, Y.; Zhang, W.; Zhang, G. Comparison and evaluation of vanadium extraction from the calcification roasted vanadium slag with carbonation leaching and sulfuric acid leaching. Sep. Purif. Technol. 2022, 297, 121466. [Google Scholar] [CrossRef]
- Zhang, J.; Zhang, W.; Xue, Z. Oxidation kinetics of vanadium slag roasting in the presence of calcium oxide. Miner. Process. Extr. Metall. Rev. 2017, 38, 265–273. [Google Scholar] [CrossRef]
- Liang, Y.; Li, Y.; Xue, L.; Zou, Y. Extraction of rare earth elements from fluoride molten salt electrolytic slag by mineral phase reconstruction. J. Clean. Prod. 2018, 177, 567–572. [Google Scholar] [CrossRef]
- Meshram, P.; Pandey, B.D.; Mankhand, T.R. Process optimization and kinetics for leaching of rare earth metals from the spent Ni–metal hydride batteries. Waste Manag. 2016, 51, 196–203. [Google Scholar] [CrossRef] [PubMed]
- Schilm, J.; Herrmann, M.; Michael, G. Kinetic study of the corrosion of silicon nitride materials in acids. J. Eur. Ceram. Soc. 2003, 23, 577–584. [Google Scholar] [CrossRef]
- Dickinson, C.F.; Heal, G.R. Solid–liquid diffusion controlled rate equations. Thermochim. Acta 1999, 340–341, 89–103. [Google Scholar] [CrossRef]
- Dehghan, R.; Noaparast, M.; Kolahdoozan, M. Leaching and kinetic modelling of low-grade calcareous sphalerite in acidic ferric chloride solution. Hydrometallurgy 2009, 96, 275–282. [Google Scholar] [CrossRef]
- Rath, P.C.; Paramguru, R.K.; Jena, P.K. Kinetics of dissolution of zinc sulphide in aqueous ferric chloride solution. Hydrometallurgy 1981, 6, 219–225. [Google Scholar] [CrossRef]
- Li, M.T.; Wei, C.; Zhou, X.J.; Qiu, S.; Deng, Z.G.; Li, X.B. Kinetics of vanadium leaching from black shale in non-oxidative conditions. Miner. Process. Extr. Metall. 2012, 121, 40–47. [Google Scholar] [CrossRef]
- Nikiforova, A.; Kozhura, O.; Pasenko, O. Leaching of vanadium by sulfur dioxide from spent catalysts for sulfuric acid production. Hydrometallurgy 2016, 164, 31–37. [Google Scholar] [CrossRef]
- Li, K.; Chen, J.; Zou, D.; Liu, T.; Li, D. Kinetics of nitric acid leaching of cerium from oxidation roasted Baotou mixed rare earth concentrate. J. Rare Earths 2019, 37, 198–204. [Google Scholar] [CrossRef]
- Zhou, Y.; Liu, J.; Cheng, G.; Xue, X.; Yang, H. Kinetics and mechanism of hydrochloric acid leaching of rare earths from Bayan Obo slag and recovery of rare earth oxalate and high purity oxides. Hydrometallurgy 2022, 208, 105782. [Google Scholar] [CrossRef]
Figure 1.
XRD pattern of the brown corundum dust.

Figure 2.
EDS mapping images of the brown corundum dust.

Figure 3.
EPMA images of the brown corundum dust.

Figure 4.
Particle size distribution of the brown corundum dust.

Figure 5.
SEM-EDS analysis for the bigger particles of brown corundum dust (200–1000 μm).

Figure 6.
(a) Schematic diagram of the experimental procedures; (b) flow chart of leaching experiment at above 380 K.
Figure 6.
(a) Schematic diagram of the experimental procedures; (b) flow chart of leaching experiment at above 380 K.

Figure 7.
(a) ΔrGθ–T diagram for reactions (1)–(7) in leaching process; (b) ΔrG–T diagram for reactions (1)–(4) in leaching process (COH−: 3 mol/L, Cother ions: 1 mol/L); (c) ΔrHθ–T diagram for reactions (1)–(7) in leaching process.
Figure 7.
(a) ΔrGθ–T diagram for reactions (1)–(7) in leaching process; (b) ΔrG–T diagram for reactions (1)–(4) in leaching process (COH−: 3 mol/L, Cother ions: 1 mol/L); (c) ΔrHθ–T diagram for reactions (1)–(7) in leaching process.

Figure 8.
Potential vs. pH equilibrium plot of Ga-Al-Si-H2O system at 313 K, 363 K and 380 K.

Figure 9.
Relationships between gallium recovery and NaOH solution concentrations, (a) change in gallium recovery with NaOH solution concentration (leaching temperature: 363 K, S/L = 1:10 g/mL, stirring speed: 850 rpm, leaching time: 60 min); (b) change in gallium recovery with leaching time at different NaOH concentrations (leaching temperature: 363 K, S/L = 1:10 g/mL, stirring speed: 850 rpm).

Figure 10.
XRD patterns for leaching tailings of different concentrations of NaOH solution (leaching temperature: 363 K, S/L = 1:10 g/mL, stirring speed: 850 rpm, leaching time: 60 min).
Figure 10.
XRD patterns for leaching tailings of different concentrations of NaOH solution (leaching temperature: 363 K, S/L = 1:10 g/mL, stirring speed: 850 rpm, leaching time: 60 min).

Figure 11.
(a) Relationships between gallium recovery and leaching temperature from 0 to 90 min (NaOH solution concentration: 200 g/L, S/L = 1:10 g/mL, stirring speed: 850 rpm); (b) effect of leaching temperature within 60 min (NaOH solution concentration: 200 g/L, S/L = 1:10 g/mL, stirring speed: 850 rpm).

Figure 12.
Variation of impurity elements’ (K, Al, Si) leaching yield with leaching time (leaching temperature: 363 K, NaOH solution concentration: 200 g/L, S/L = 1:10 g/mL, stirring speed: 850 rpm).
Figure 12.
Variation of impurity elements’ (K, Al, Si) leaching yield with leaching time (leaching temperature: 363 K, NaOH solution concentration: 200 g/L, S/L = 1:10 g/mL, stirring speed: 850 rpm).

Figure 13.
XRD patterns produced from leaching tailings at various leaching temperatures (NaOH solution concentration: 200 g/L, S/L = 1:10 g/mL, stirring speed: 850 rpm, leaching time: 60 min).
Figure 13.
XRD patterns produced from leaching tailings at various leaching temperatures (NaOH solution concentration: 200 g/L, S/L = 1:10 g/mL, stirring speed: 850 rpm, leaching time: 60 min).

Figure 14.
SEM images of leaching tailings at various leaching temperatures (NaOH solution concentration: 200 g/L, S/L = 1:10 g/mL, stirring speed: 850 rpm, leaching time: 60 min, leaching temperature: (a) 333 K; (b) 363 K; (c) 380 K).
Figure 14.
SEM images of leaching tailings at various leaching temperatures (NaOH solution concentration: 200 g/L, S/L = 1:10 g/mL, stirring speed: 850 rpm, leaching time: 60 min, leaching temperature: (a) 333 K; (b) 363 K; (c) 380 K).

Figure 15.
Effect of stirring speed on gallium recovery (leaching temperature: 363 K, S/L = 1:10 g/mL, NaOH solution concentration: 200 g/L, leaching time: 60 min).
Figure 15.
Effect of stirring speed on gallium recovery (leaching temperature: 363 K, S/L = 1:10 g/mL, NaOH solution concentration: 200 g/L, leaching time: 60 min).

Figure 16.
Effect of solid–liquid ratios on gallium recovery (leaching temperature: 363 K, NaOH solution concentration: 200 g/L, stirring speed: 850 rpm).
Figure 16.
Effect of solid–liquid ratios on gallium recovery (leaching temperature: 363 K, NaOH solution concentration: 200 g/L, stirring speed: 850 rpm).

Figure 17.
Linear fitting results of different kinetic equations, (a) kt = 1 − 2α/3 − (1 − α)2/3; (b) kt =1 − (1 − α)1/3; (c) kt =1/(1 − α)1/3 − 1.
Figure 17.
Linear fitting results of different kinetic equations, (a) kt = 1 − 2α/3 − (1 − α)2/3; (b) kt =1 − (1 − α)1/3; (c) kt =1/(1 − α)1/3 − 1.

Figure 18.
Relationship between lnk and 1/T.

Figure 19.
(a) Linear fitting results for different NaOH solution concentrations; (b) relationship between ln(CNaOH) and ln(km); (c) linear fitting results for different solid–liquid ratios; (d) relationship between ln(L/S) and ln(km).
Figure 19.
(a) Linear fitting results for different NaOH solution concentrations; (b) relationship between ln(CNaOH) and ln(km); (c) linear fitting results for different solid–liquid ratios; (d) relationship between ln(L/S) and ln(km).


Table 1.
Chemical composition of the brown corundum dust (wt., %).
| SiO2 | K2O | Al2O3 | SO3 | Fe2O3 | P2O5 | MnO | MgO | Na2O | PbO | F |
| 42.90 | 20.50 | 19.71 | 5.01 | 4.29 | 1.26 | 1.08 | 0.947 | 0.881 | 0.681 | 0.624 |
| ZnO | CuO | Ga2O3 | CaO | Cl | SnO2 | Cr2O3 | ZrO2 | Rb2O | As2O3 | SrO |
| 0.254 | 0.227 | 0.133 | 0.211 | 0.135 | 0.0507 | 0.0497 | 0.0446 | 0.0397 | 0.0298 | 0.0178 |
| CeO2 | Bi2O3 | NiO | V2O5 | Nb2O5 | La2O3 | GeO2 | Co3O4 | MFe | ||
| 0.0177 | 0.0152 | 0.0089 | 0.0085 | 0.0072 | 0.0056 | 0.0034 | 0.0031 | 0.2 |
Note: In the above table, the content of iron is calculated in the form of iron oxide. MFe represents the content of metallic iron and was determined using chemical titration.
Table 2.
EDS analysis of the corresponding points marked in Figure 14 (wt., %).
Table 2.
EDS analysis of the corresponding points marked in Figure 14 (wt., %).
| Point | O | Na | Al | Si | K | Ga |
|---|---|---|---|---|---|---|
| 1 | 40.62 | 12.49 | 13.70 | 24.07 | 9.12 | - |
| 2 | 34.56 | 3.41 | 8.35 | 41.63 | 12.06 | - |
| 3 | 18.83 | - | 20.72 | 40.38 | 20.07 | - |
| 4 | 45.30 | 7.87 | 25.60 | 14.91 | 6.33 | - |
| 5 | 14.75 | 13.11 | 22.42 | 23.00 | 26.72 | - |
| 6 | 41.74 | 17.89 | 14.43 | 21.82 | 4.12 | - |
| 7 | 39.44 | 34.99 | 6.37 | 11.12 | - | 8.08 |
| 8 | 46.92 | 12.38 | 15.48 | 20.39 | 4.83 | - |
Disclaimer/Publisher’s Note: The statements, opinions and data contained in all publications are solely those of the individual author(s) and contributor(s) and not of MDPI and/or the editor(s). MDPI and/or the editor(s) disclaim responsibility for any injury to people or property resulting from any ideas, methods, instructions or products referred to in the content. |
© 2023 by the authors. Licensee MDPI, Basel, Switzerland. This article is an open access article distributed under the terms and conditions of the Creative Commons Attribution (CC BY) license (https://creativecommons.org/licenses/by/4.0/).
Share and Cite
MDPI and ACS Style
Zhang, J.; Gao, C.; Hui, X.; Chang, Y. Extraction of Gallium from the Brown Corundum Dust with a One-Step Alkaline Leaching Process. Separations 2023, 10, 510. https://doi.org/10.3390/separations10090510
AMA Style
Zhang J, Gao C, Hui X, Chang Y. Extraction of Gallium from the Brown Corundum Dust with a One-Step Alkaline Leaching Process. Separations. 2023; 10(9):510. https://doi.org/10.3390/separations10090510
Chicago/Turabian StyleZhang, Juhua, Cong Gao, Xujie Hui, and Yuwei Chang. 2023. "Extraction of Gallium from the Brown Corundum Dust with a One-Step Alkaline Leaching Process" Separations 10, no. 9: 510. https://doi.org/10.3390/separations10090510
Note that from the first issue of 2016, this journal uses article numbers instead of page numbers. See further details here.