Article

HPLC-MS/MS Analysis for Sphingosine 1-Phosphate after the Dephosphorylation by Hydrogen Fluoride

College of Pharmacy, Chungbuk National University, Cheongju 28160, Republic of Korea
*
Author to whom correspondence should be addressed.
These authors contributed equally to this work.
Separations 2024, 11(1), 34; https://doi.org/10.3390/separations11010034
Submission received: 17 December 2023 / Revised: 15 January 2024 / Accepted: 16 January 2024 / Published: 18 January 2024

Abstract

:
Sphingosine 1-phosphate (S1P) is a signaling lipid molecule involved in various cellular processes. It is important to develop a quantitative method for S1P to determine endogenous levels and to investigate its functions. As S1P is a tiny lipid component of most biological samples, highly sensitive analysis by LC-MS/MS is required. The main challenge in S1P analysis by chromatography is peak-broadening due to the presence of a polar phosphate and the fact that S1P is indeed a zwitterion itself. In this study, we used hydrogen fluoride (HF) to efficiently remove a phosphate and then analyzed the surrogate, sphingosine, as a sharp peak by LC-ESI-MS/MS. We optimized the dephosphorylation reaction in terms of temperature and reaction time. Multiple reaction monitoring (MRM) for a dephosphorylated form of S1P and C17-S1P as an internal standard at m/z transition 300.4 > 282.4 (quantification ion), 300.4 > 262.4 (qualification ion), 286.3 > 268.2 (internal standard) was conducted. This method was validated by essential parameters such as specificity, linearity, range, LOQ, LOD, accuracy, precision, and repeatability. To confirm this new method, we quantified S1P levels in various serum products (100.0~284.4 nM). In the sample pretreatment conditions for extracting S1P, the concern about potential sphingosine contamination in serum was negligible. The dephosphorylation efficiency by this method was about two-fold higher than that of alkaline phosphatase (APase). To apply the method in vivo, we analyzed S1P in plasma and kidney tissues obtained from a chronic kidney disease (CKD) mouse model. S1P levels were increased only in CKD kidney tissue but not in plasma. In conclusion, by applying the dephosphorylation step with HF, we established a new, sensitive LC-MS/MS quantitative method for S1P that can be applied to biological samples.

1. Introduction

One of the sphingolipid metabolites, sphingosine-1-phosphate (S1P), is endogenously synthesized by two sphingosine kinases (SphK1 and SphK2). Sphk1 is predominantly localized in the cytosol and cell membrane, whereas Sphk2 is mainly present in the nucleus, mitochondria, and endoplasmic reticulum [1].
S1P act intracellularly as a second messenger, regulating calcium release, cell death, and cell proliferation. It can also be translocated extracellularly by transporter and then act as a ligand of S1P receptors (S1PRs). S1PRs, with five subtypes (S1P1-5), are high-affinity G protein-coupled receptors, coupling to G proteins to activate a downstream cascade [2].
S1P is a minor lipid component in most biological samples. To determine the endogenous S1P level and investigate its functions, it is essential to develop a reliable, highly sensitive method for S1P. Recently, liquid chromatography-tandem mass chromatography (LC-MS/MS) with electrospray ionization (ESI) has been widely used for S1P analysis because of its high specificity and sensitivity [3,4,5].
The main challenges to the development of an S1P quantitative method are peak-broadening due to the presence of a polar phosphate head group, and zwitterion formation in S1P [6]. The negatively charged phosphate in S1P can also interact with the column metal ion, resulting in severe peak-tailing and decreased detectability. To improve this peak-broadening problem, modified methods using a highly acidic mobile phase [7,8] or specific metal-free column have been applied [9]. However, these conventional methods cannot completely solve the problem and require a specially designed column. An alternative breakthrough was the elimination of the phosphate group in S1P, which releases stable sphingosine free from the peak-broadening problem. The use of specific enzyme alkaline phosphatase (APase) of bovine intestine origin for S1P dephosphorylation was successful [10]. However, this APase in animal origin is limited for use by critical problems on the activity changes, expensive and has an infection issue of bovine spongiform encephalopathy (BSE).
The hydrogen fluoride (HF), both in organic and aqueous solution, can selectively cleave phosphorus-oxygen chemical bond. The first report of dephosphorylation reaction on nucleotides and alkyl phosphates by HF was published [11,12]. Similarly, LC-MS/MS analysis after dephosphorylation of phosphoryl peptides showed the efficiency of HF in eliminating a phosphate group [13]. In this regard, we investigated the utility of HF on the dephosphorylation of the sphingolipid S1P.
In this study, we established a new method by using HF to easily remove a phosphate from S1P and overcame the peak-broadening problem by analyzing the surrogate sphingosine by LC-MS/MS. In addition, this method was successfully used to analyze S1P levels in serum and kidney tissues in an animal model of chronic kidney disease (CKD) induced by adenosine.

2. Materials and Methods

2.1. Materials and Reagents

D-erythro-sphingosine-1-phosphate (S1P) and C17-sphingosine-1-phosphate (C17-S1P) were purchased from Avanti Polar Lipids, Inc. (Alabaster, AL, USA). Both were dissolved in methanol for stock solution. Hydrogen fluoride in pyridine (~70% HF) was purchased from Sigma Aldrich (Catalog No. 184225; St. Louis, MO, USA). Serum was purchased from Cytiva (Marlborough, MA, USA). All organic solvents were purchased from Honeywell Burdick & Jackson (Charlotte, NC, USA). Male Wistar rats were provided by Samtako Bio Korea (Osan, Republic of Korea). Animals were maintained under a controlled temperature at 21–22 °C, and optimized humidity conditions with 12/12-h cycles. They were provided with standard chow and access to water. All animal experiments in this study were performed in accordance with the institutional animal care and use committees of Chungbuk National University.

2.2. CKD Animal Model
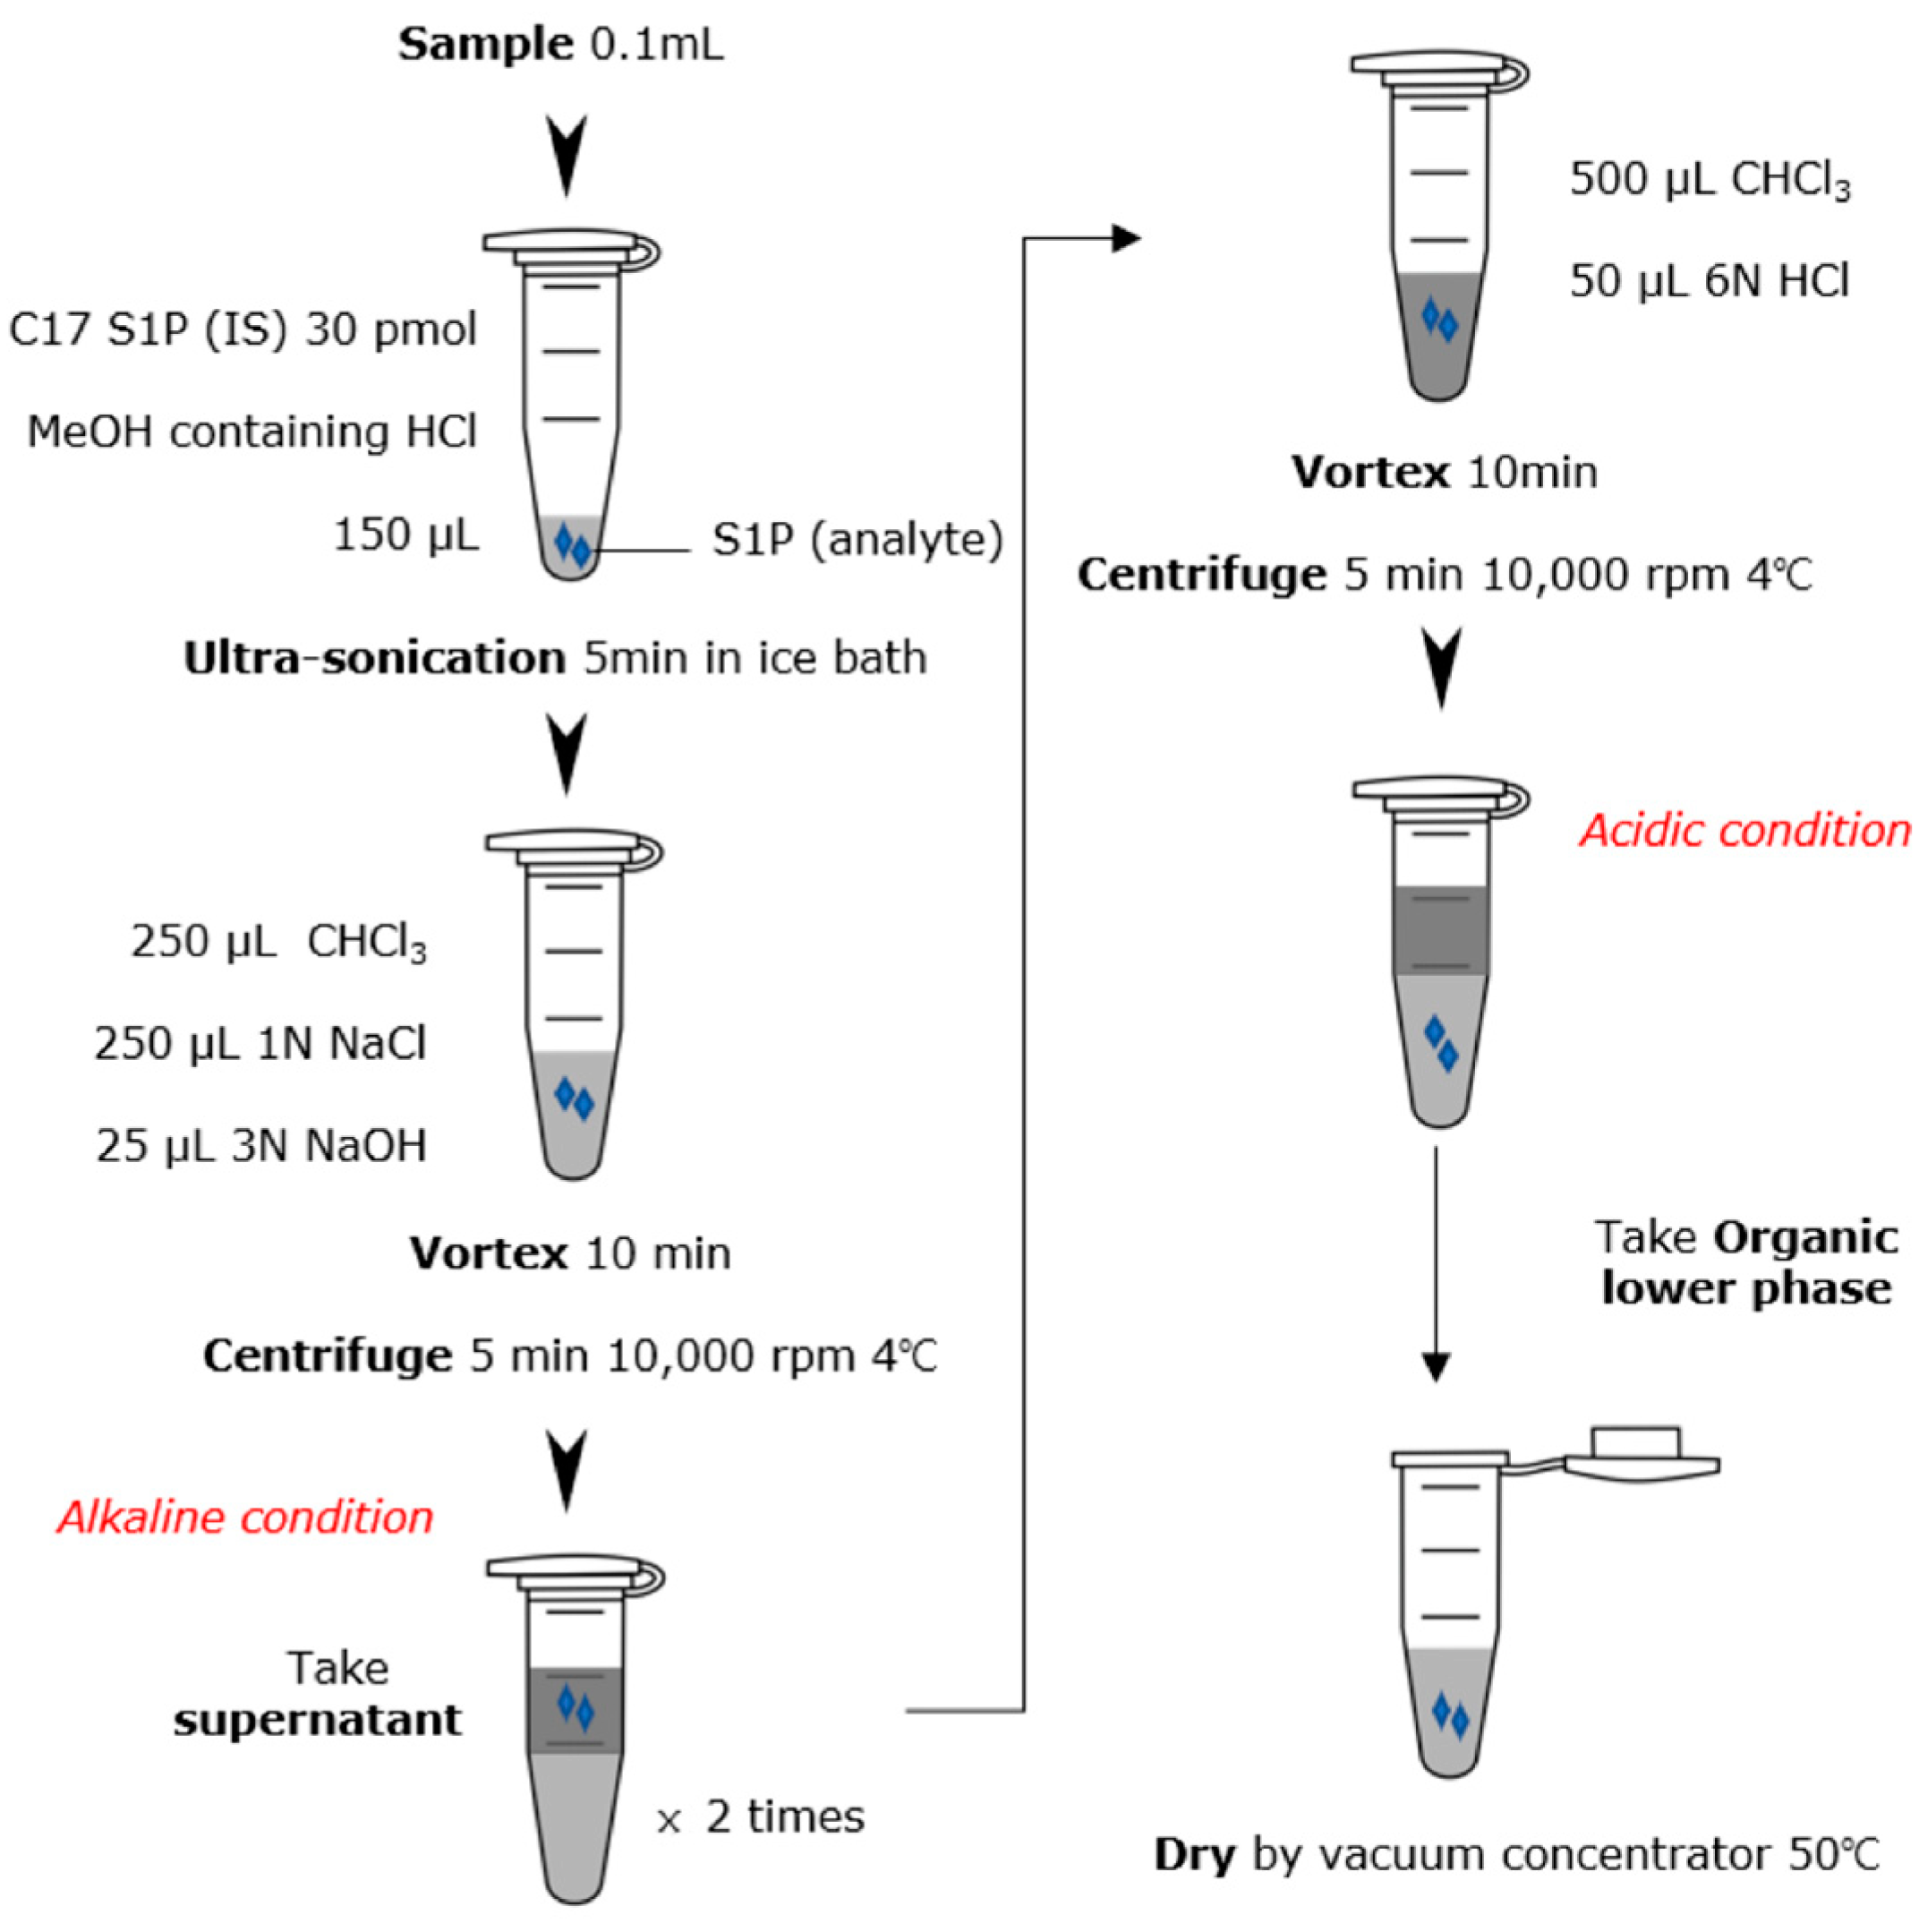
Rats were divided into 2 groups after 1 week of acclimatization. For CKD group (n = 6), 600 mg/kg body weight adenine in 0.5% CMC was applied by oral gavage for 10 days. On the other hand, 0.5% CMC (2 mL/200 g body weight) was applied to the control group (n = 6). On the 11th day, the rats were sacrificed. Blood samples were collected immediately and transferred to Eppendorf tubes containing anticoagulant. The tubes were centrifuged at 3000 rpm for 3 min and the supernatant was transferred to new tubes. Kidney tissues were obtained by surgery and rinsed with PBS. All kidney tissues were stored at −80 °C until further analysis.
Plasma samples collected from control and CKD group rats were analyzed for creatinine, tryptophan, and kynurenine, which are widely accepted biomarkers for CKD diagnosis. The change in plasma creatinine levels was determined by the Jaffé method using LabAssayTM. Creatinine Kit (Fujifilm Wako Pure Chemical Corporation, Osaka, Japan). An aliquot of 50 µL of plasma proteins were deproteinized with 300 µL of deproteinization reagent. 100 µL of the supernatant was transferred to a 96-well plate and mixed with 50 µL of picric acid reagent and 50 µL of 0.75 M sodium hydroxide solution. The mixture was kept at an ambient temperature for 20 min before measurement using a microplate reader at a wavelength of 520 nm. For plasma tryptophan and kynurenine, 33 µL of 2M perchloric acid was added to 100 µL of rat plasma. Samples were vortexed vigorously for 1 min and centrifuged at 14,000 rpm for 30 min at 4 °C. The supernatant was transferred to an HPLC vial and 20 µL of the supernatant was injected into the HPLC system. The Agilent Technologies 1100 series LC system with DAD detector was used to detect tryptophan and kynurenine. Compounds were eluted with 92% acetonitrile (ACN) containing 5mM sodium acetate (pH = 7.15) at a flow rate of 1.0 mL/min in a Waters C18 column (250 × 4.6 mm I.D., 5 µm particle size) at 25 °C. Tryptophan and kynurenine were detected at 365 and 267 nm, respectively.

2.3. S1P Extraction

Kidney samples were homogenized by ultra-sonication in RIPA lysis buffer (10 mM Tris-HCl, pH 8.0, 1 mM EDTA, 0.5 mM EGTA, 1% Triton X-100, 0.1% sodium deoxycholate, 0.1% SDS, 140 mM NaCl) containing protease inhibitors. After complete homogenization, the tubes were centrifuged at 14,000 rpm, 4 °C for 10 min. The supernatant was collected for protein assay and S1P extraction. Protein assay was performed according to the instructions of the Thermo protein assay kit (Pierce, IL, USA). Plasma samples were thawed at 37 °C. An aliquot of 100 μL of each sample was placed in an Eppendorf tube, and then 250 μL of methanol containing 0.6 μL of concentrated HCl and 30 pmol of C17-S1P as an internal standard was added. The tube was ultrasonicated in an ice-cold water bath for 5 min. After sonication, 250 μL CHCl3, 250 μL 1 M NaCl and 25 μL 3 N NaOH were added. The tube was vortexed vigorously for 10 min and centrifuged at 14,000 rpm for 5 min. The alkaline aqueous phase containing S1P was transferred to a new tube. The remaining lower layer was re-extracted with 125 μL methanol, 125 μL 1 M NaCl, and 13 μL 3 N NaOH. The combined aqueous fraction of the s1p extract was then mixed with 600 μL CHCl3 and 50 μL 6 N HCl. The tube was vortexed and centrifuged again. The CHCl3 phase was transferred to a new tube and dried with a vacuum concentrator. The entire extraction scheme is described in Figure 1.

2.4. S1P Dephosphorylation

The dried residue was reconstituted with 80 μL methanol. The tube was vortexed and then sonicated in a water bath for 10 min. Hydrogen fluoride (~70% HF in pyridine) 100 μL was added to each sample and sealed with parafilm in an ice bath. The tube was vortexed and incubated at 25 °C. After 1 h, HF was evaporated under a nitrogen stream. The reaction was quenched by adding 300 μL of 10 N NaOH. This was followed by 300 μL of dichloromethane (DCM) for the organic fraction and the tube was vortexed vigorously. The tube became cloudy due to precipitation of sodium fluoride. The tube was centrifuged at 14,000 rpm for 5 min, and the dephosphorylated S1P in the DCM layer was extracted twice. The combined DCM fraction was washed with alkaline water and evaporated through vacuum concentrators. Methanol was added to the dried residue prior to mass spectrometry injection.

2.5. LC-MS/MS Analysis

To determine S1P levels, liquid chromatography-tandem mass spectrometry (LC-MS/MS) was performed on an AB Sciex QTRAP 3200 mass spectrometer coupled to a Shiseido Nanospace SI-2 HPLC system. Electrospray ionization (ESI) with a positive ion mode was used as the ionization source. According to the manual tuning of direct infusion, the transition from precursor to product ions was found at optimized collision energies. The optimized ESI parameters are listed in Table 1. The analytes were separated on an Inertsil ODS-3 column (100 × 3.0 mm, 3 μm) maintained at 40 °C. The mobile phase consisted of (A) 0.1% formic acid in water containing 10 mM ammonium acetate, (B) 0.1% formic acid in acetonitrile:2-propanol (4:3, v/v). A gradient elution condition at a flow rate of 0.3 mL/min was as follows: 0–1 min, 30% B; 1–3 min, 95% B; 3–7 min, 100% B; 7–9 min, hold 100% B; 9–10 min. 30% B, 10–14 min, hold 30% B for re-equilibration. The injection volume was 20 μL.

2.6. Method Validation

The method was validated for specificity, linearity, precision, accuracy, reproducibility, limit of quantitation (LOQ), limit of detection (LOD) in line with the ICH Q2(R1) guidelines. A standard solution diluted with stock solution by methanol was used to determine specificity, linearity, LOQ, LOD. Specificity was evaluated by the presence of interference at the same retention time of the analyte. The correlation coefficient (R2) value of the calibration curve with a standard solution for 3 different days was used to determine linearity. The signal-to-noise ratio (S/N ratio) was calculated to confirm LOQ and LOD. For LOQ, an S/N ratio of 10 was accepted and for LOD, an S/N ratio of 3. 2% BSA solution spiked with S1P and C17-S1P was used as the precision, accuracy, and reproducibility samples. Precision and accuracy were evaluated by relative standard deviation (RSD, %) and recovery (%) at 3 different concentrations with 3 individuals. A low concentration spiked sample was injected 6 times and the RSD % was calculated for reproducibility.

3. Results

3.1. S1P Extraction

A two-step extraction procedure was used to determine S1P levels in biological samples. The extraction procedure was modified according to the previous report [14]. In a mixture of aqueous alkaline solution, methanol, and chloroform, S1P with polarity exists in the upper aqueous layer after centrifugation, while sphingosine and other major lipid components move to the organic solvent layer. After transfer of the aqueous phase, an acidic aqueous solution was added to decrease the polarity of the phosphate group of S1P. Under acidic conditions, S1P was followed in the lower chloroform phase and then injected into LC-MS/MS. Because the mass transitions of HF-derived dephosphorylated S1P are the same as those of sphingosine, it is important to separate S1P and sphingosine in the first extraction step. Without separation, S1P levels could be overestimated due to the sphingosine background. To confirm sphingosine contamination, fetal bovine serum (FBS), kidney tissue extracts with, and without, HF treatment were prepared. The S1P peak area of each group was compared in the same injection batch (n = 3). The results are summarized in Table 2. It was confirmed that the background was very low compared to the S1P peak area contained in the biological sample.

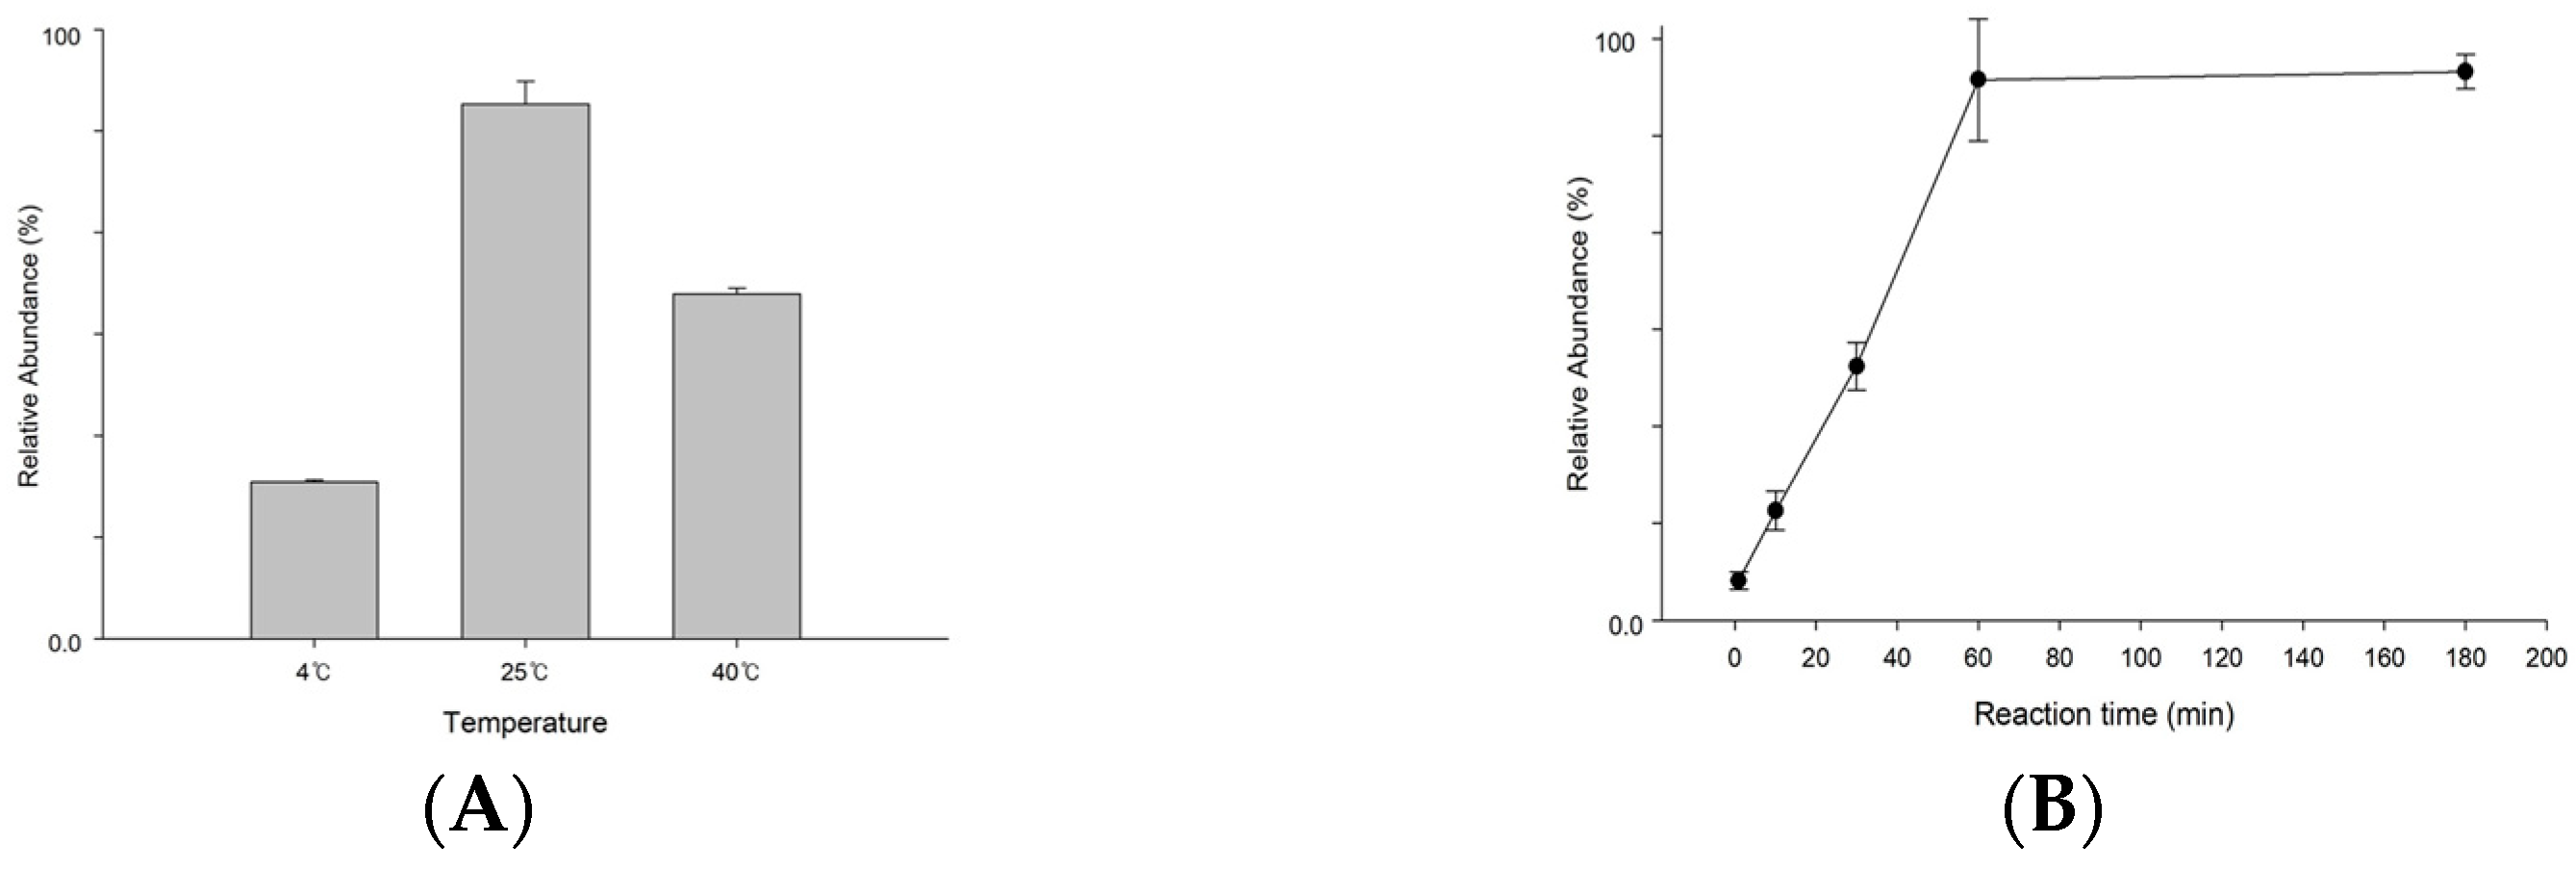
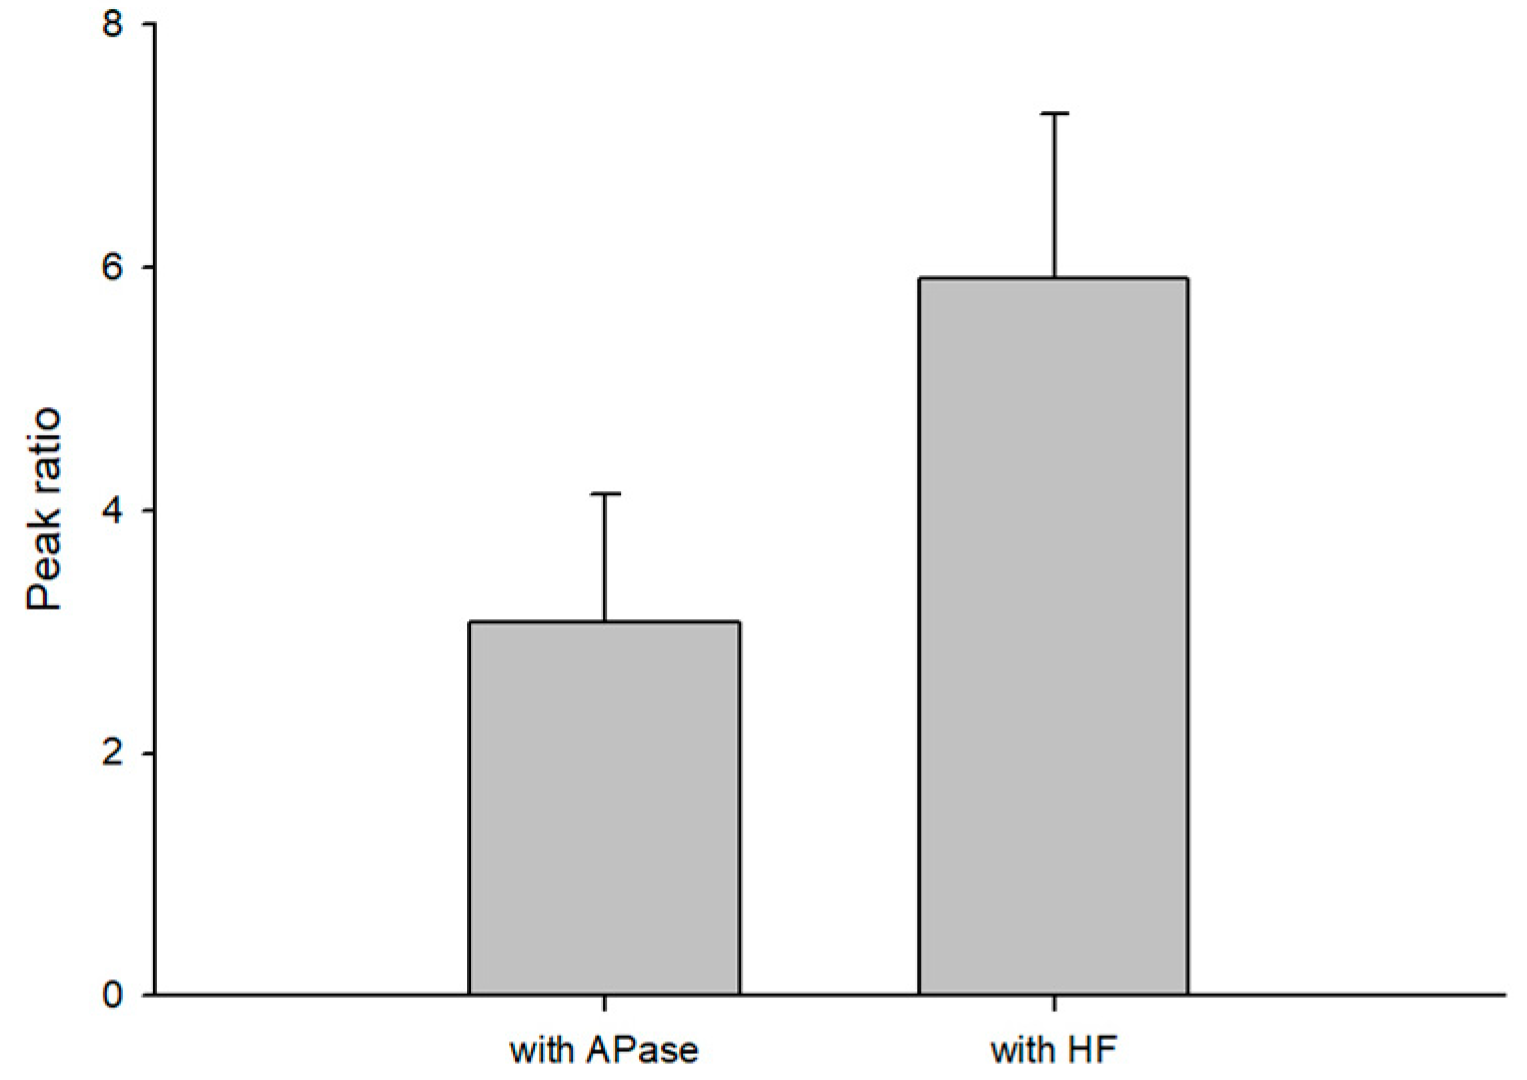
3.2. Optimization for S1P Dephosphorylation

The reaction condition of hydrogen fluoride (HF) dephosphorylation was optimized by considering the reaction temperature and time. The HF was treated with S1P standard solution dissolved in methanol, and then tubes were kept overnight at 4 °C, 25 °C, 40 °C to determine the optimal temperature. After being kept overnight, the HF was evaporated, and the remaining solution was prepared for mass spectrometry as described above. As shown in Figure 2A, reaction at 25 °C was optimal to eliminate the phosphate group at S1P. The optimal reaction time for dephosphorylation was examined by varying the reaction time of the S1P standard solution with HF at 25 °C. The dephosphorylation yield increased and then became stable after 60 min, as shown in Figure 2B. Thus, a 60 min incubation time was sufficient for the reaction with S1P and hydrogen fluoride.

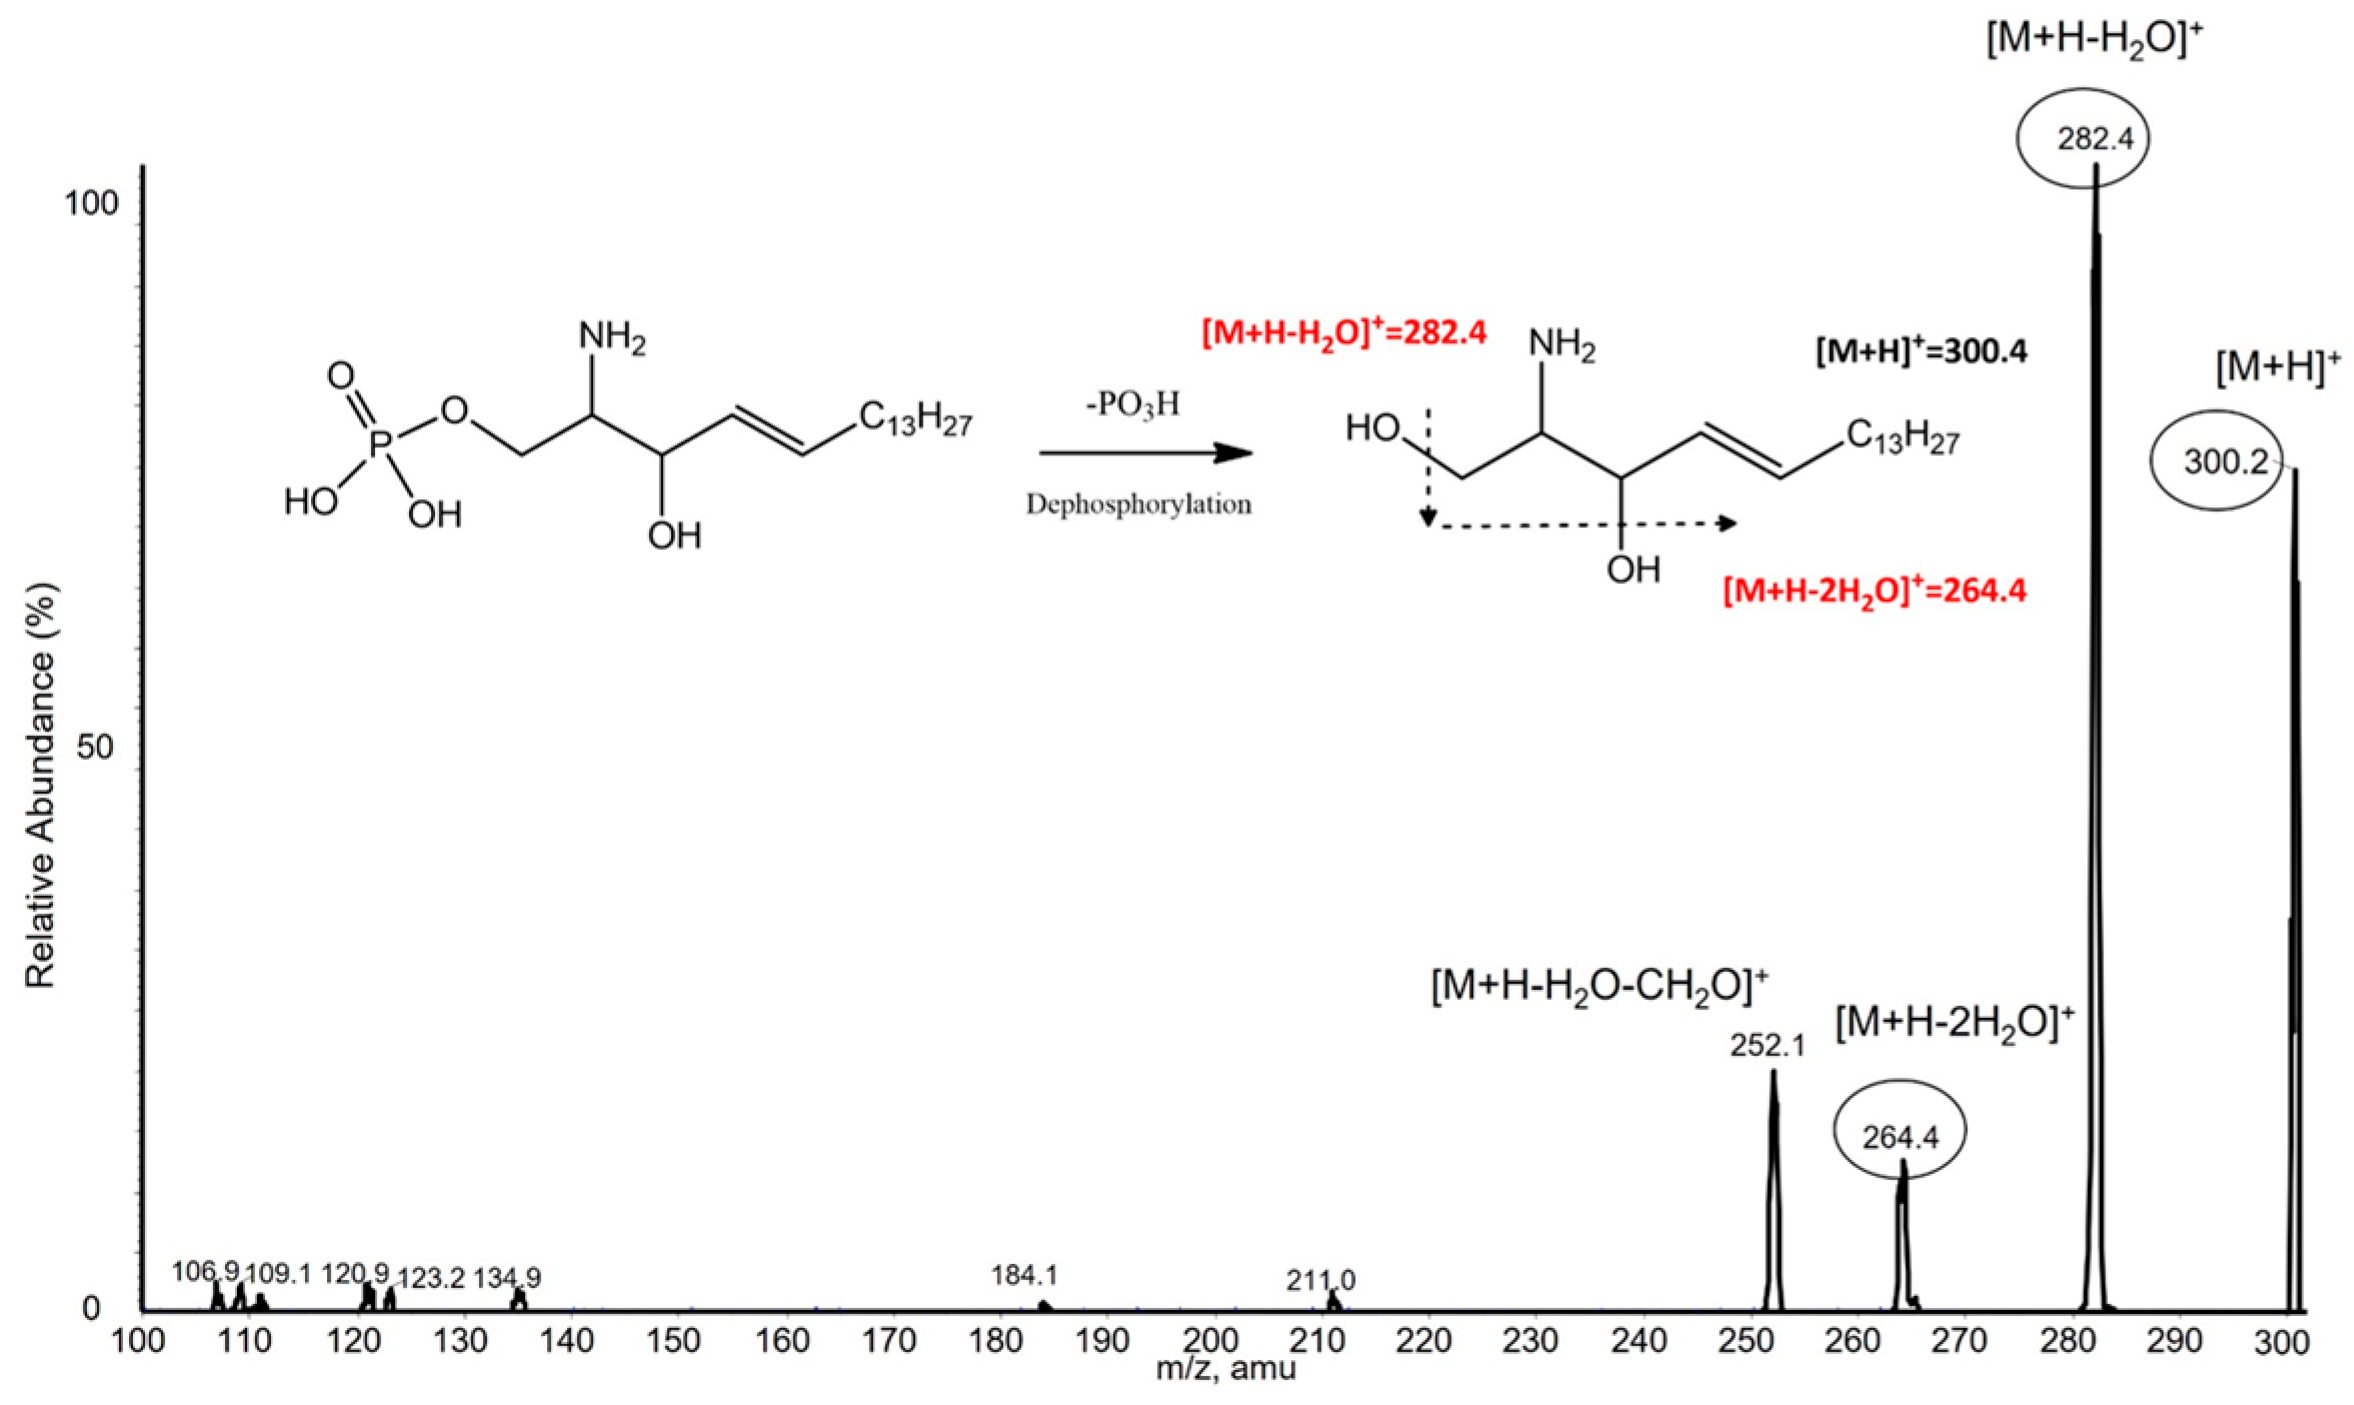
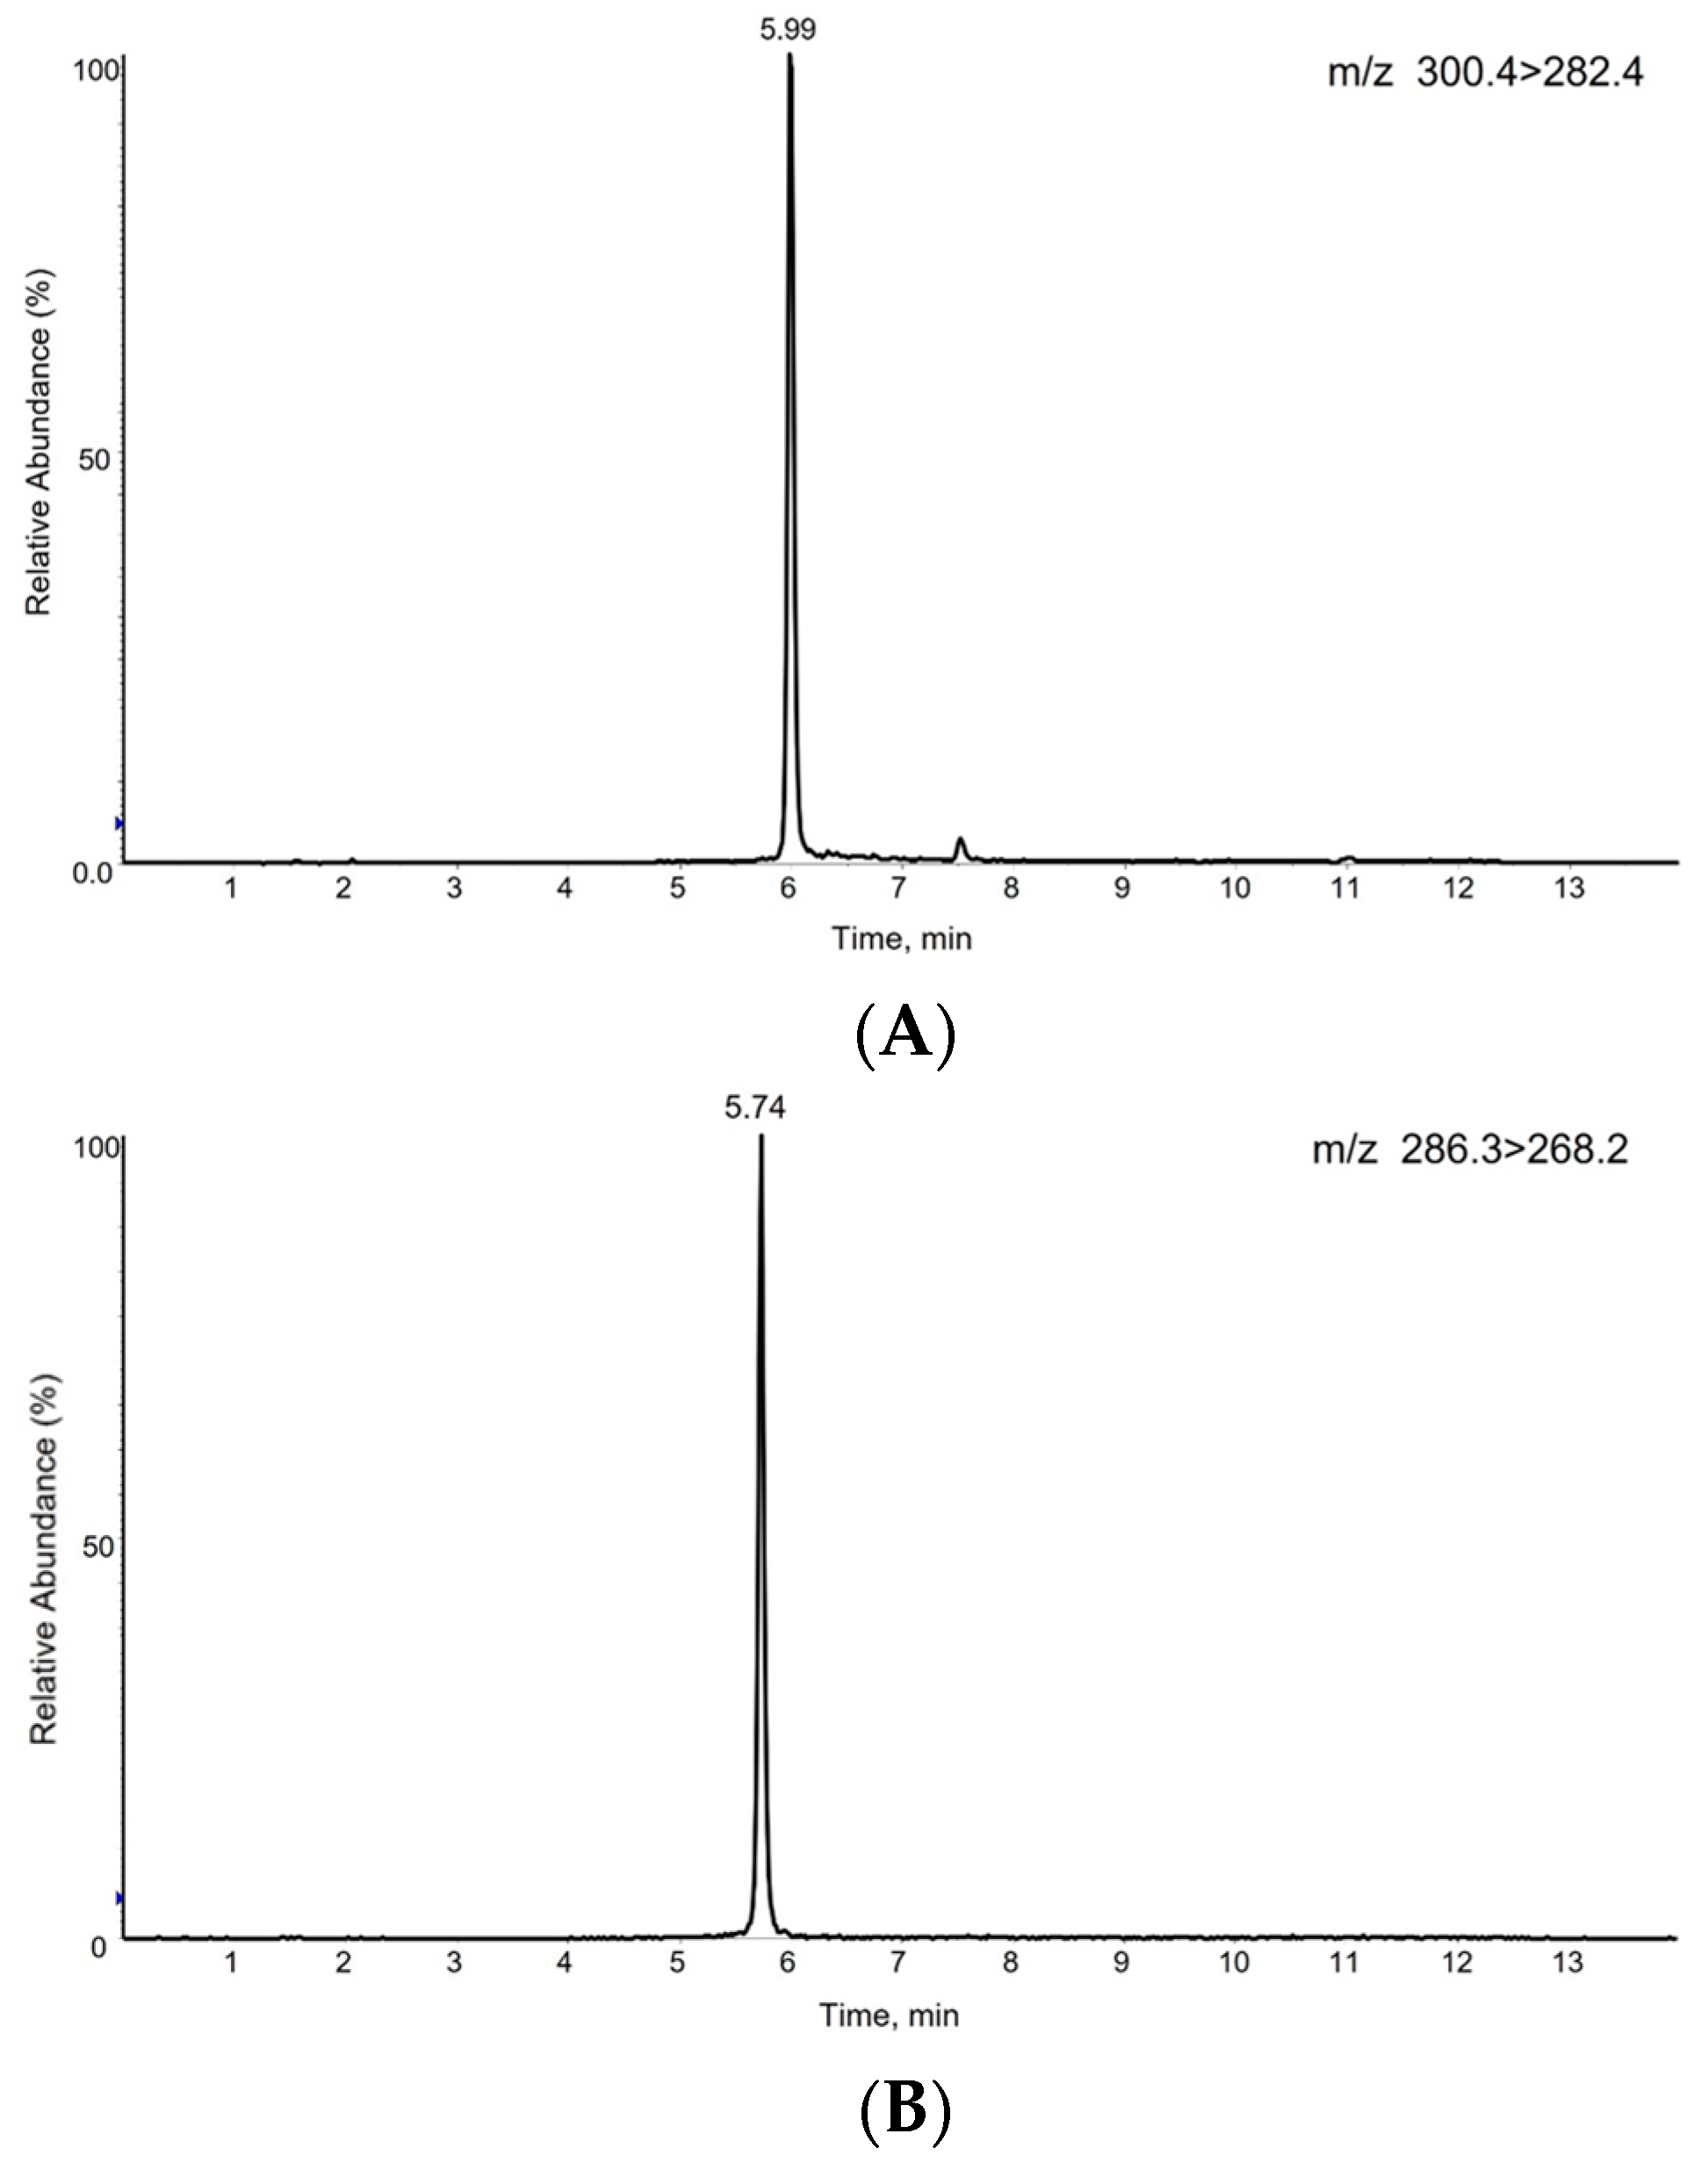
3.3. S1P Analysis by LC-MS/MS

To confirm the MRM transition, S1P and C17-S1P (IS) standard solutions were injected directly into the mass spectrometer after dephosphorylation. Both compounds predominantly generated [M + H]+ form at m/z 300.4 (S1P) and m/z 286.3 (C17-S1P) as precursor ions in the positive ion mode. The precursor ions then produced fragment ions in the collision energy product ion scan mode. The product ion mass spectra obtained by selecting these precursor ions are shown in Figure 3. For S1P, m/z 282.4 was the abundant product ion corresponding to [M + H-H2O]+, the minor fragment ion m/z 264.4 corresponding to [M + H-2H2O]+. C17-S1P, which was used as an internal standard in our study, had the same pattern, thus m/z 268.2 was obtained for the major product ion. This result showed that HF selectively eliminated the phosphate group from S1P, since the fragmentation pattern was consistent with that of sphingosine. Therefore, MRM transitions of m/z 300.4 → 282.4 were selected for S1P quantification, m/z 300.4 → 264.4 for S1P qualification, and m/z 286.3 → 268.2 for C17-S1P (IS).
For high ionization yield, 10 mM ammonium acetate and 0.1% formic acid were added. The addition of formic acid also has the advantage of peak separation. For high resolution, isopropanol was used in combination with acetonitrile. With optimized gradient conditions, the retention time of S1P in our chromatography system was 5.99 min (Figure 4A) and C17-S1P was 5.74 min (Figure 4B).

3.4. Method Validation

The peak of the analyte and internal standard were well separated and had no interference, as shown in Figure 4. A calibration curve was drawn by peak ratio using C17-S1P as an internal standard and had good linearity with standard samples, as described in the material and methods. The calibration equation was y = 0.0074x + 0.0516 (n = 3) and the correlation coefficient (R2) value was 0.9996 (n = 3) in a range of 10~1000 nM (pmol/mL). Linearity data are shown in Table 3. The limit of quantification was 10 nM (signal-to-noise ratio > 10), and the limit of detection (signal-to-noise ratio > 3) was 5 nM. The relative standard deviation (RSD) in three different concentrations for precision ranged from 0.0~2.7%. For accuracy, the recovery rate was 98.5~106.0% at 30, 250, 800 nM (pmol/mL) spiking samples with three individuals. The RSD at 30 nM spiking sample with six replicates for reproducibility was 4.7%. Detailed results are summarized in Table 4.

3.5. S1P Levels in CKD Animal Model

To apply our method to biological samples, we first determined S1P in commercial serum, fetal bovine serum (FBS), fetal calf serum (FCS), and horse serum. The S1P level in FBS was determined to be 100.0 ± 5.3 pmol/mL, FCS 106.5 ± 4.5 pmol/mL, and horse serum 284.4 ± 11.3 pmol/mL (mean ± SD) (Figure 5).
Second, we analyzed endogenous S1P in the CKD rat model (Figure 6). To confirm that the CKD rat model treated with adenine for 10 days successfully induced CKD, we examined several biomarkers representing renal functions (Table 5). Plasma creatinine was increased from 0.3 dm/mL to 1.4 dm/mL in the CKD group, expressing the deterioration of glomerular filtration. The kynurenine level was doubled in the plasma of CKD rats, while tryptophan was reduced by 1.7-fold. The body mass of CKD rats remained unchanged, while control group rats gained about 50 g during the experiment. Conversely, the kidneys of CKD rats were enlarged and weighed almost 2.8 times more than those of the controls.
As shown in Figure 6, the plasma S1P level of the control group was 540.3 ± 53.1 pmol/mL, and that of the CKD group was 615.0 ± 159.2 pmol/mL. Figure 6A showed slightly increased but not significant (p value > 0.05) levels. As shown in Figure 6B, a significant increase in the S1P level in kidney tissue was observed in the CKD group (p value < 0.05). The S1P concentrations in the control and CKD group showed 0.336 ± 0.05 and 0.477 ± 0.07 pmol/mg protein (mean ± SD), respectively. The reported plasma concentration is about 100~700 pmol/mL and the tissue concentration are about 1~10 pmol/mL [15], which correlate with the results of our study.

4. Discussion

In this study, we developed a new method for the quantification of S1P by LC-MS/MS. The method described here has high sensitivity with the use of an HF dephosphorylation process. The dephosphorylation mechanism in S1P involves the removal of the phosphate group through a hydration reaction by the addition of HF and regeneration of the hydroxyl group in the sphingoid backbone. The specific affinity of the fluoride anion to the oxygen–phosphorus bond is a very important factor in effecting this cleavage [13]. In addition, the analysis can be performed on the general C18 column, which is the most popular and widely used reverse-phase column, without any peak-tailing problem. Using C17-S1P as the internal standard, we can obtain reproducible S1P quantification results. When internal standard substances with very different structures are used in biological sample analysis, errors in quantification may be severe, due to differences in ionization rates. To minimize these concerns, C17-S1P, which is structurally similar to S1P, was used, and the quantitative value of S1P among biological samples analyzed by this method was found to be not significantly different to conventional method results. Therefore, C17-S1P is often used as an internal standard in papers quantifying S1P with LC-MS/MS. There was no problem with the quantification of S1P in plasma, cultured cells, and kidney tissue analyzed within a limited biological sample. Method validation was performed on several parameters and showed good specificity, linearity, precision, and accuracy. The LOD of this method was 5 pmol/mL, with which it was possible to detect low levels of endogenous S1P in tissues similar to other recently reported methods.
In this study, we compared the dephosphorylation reaction efficiency of HF and APase with an S1P standard solution and a C17 sphingosine standard solution as the internal standard (Figure 7). The dephosphorylation ability of HF exhibited clearly better efficiency than APase. HF is easier to obtain in the laboratory and the cost is much lower than APase.
HF was an effective reagent for the analysis of S1P by dephosphorylation, but careful handling was required. In addition, HF produces corrosive fumes that can easily penetrate the skin and cause severe burns [16]. Researchers should use appropriate safety equipment and always work in a fume hood. HF can dissolve glass containers; thus for transfer, the use of tightly sealed plastic bottles or tubes is required [17].
We analyzed serum S1P levels in three different sera. As shown in Figure 5, fetal bovine serum and fetal calf serum have similar concentrations. However, horse serum has a higher level of S1P. We thought this was due to the difference in erythrocyte levels between different species. The reference interval of bovine erythrocytes is 4.9–7.5 × 10⁶/μL [18] and that of horse erythrocytes is 6.10–11.0 × 10⁶/μL [19]. Since S1P is highly abundant in mature erythrocytes with high activity of Sphk1, higher levels of erythrocyte species seem to produce higher levels of S1P in serum [20,21].
The role of S1P in CKD has not been fully established, although the protective role of S1P has been suggested in renal fibrosis, which is a clinical manifestation of CKD [22]. Several studies have reported upregulation of renal Sphk1 in various kidney disease models [23,24]. In addition, S1P2 is highly expressed in renal ischemia and reperfusion injury, which may lead to renal fibrosis [25,26]. According to our experimental results, kidney tissues of CKD group showed increased S1P levels, while there was no significant increase in plasma. During the progression of CKD, inflammatory cytokines, including transforming growth factor-β (TGF-β), are secreted, which cause renal fibrosis. Since TGF-β is known to stimulate Sphk1, we can correlate elevated S1P levels with CKD kidney tissue [27]. Further research will be necessary to elucidate plasma S1P levels in CKD models, as well as to determine the S1P function and therapeutic target in CKD.

5. Conclusions

In conclusion, we established a new S1P analysis method with HF dephosphorylation by LC-MS/MS, which was highly sensitive and effective in quantifying an S1P level with comparable sensitivity levels [15]. Since S1P is zwitterion, this method solved the problem of S1P peak-broadening when analyzing directly by conventional methods. The pretreatment method using HF was very simple, and a one-hour reaction at room temperature was sufficient for quantitative dephosphorylation of S1P. With this new method, we compared S1P level in the plasma and kidney tissue of a chronic kidney disease model. The method can also be used in various biological samples and determine the therapeutic role of S1P in various diseases, including CKD.

Author Contributions

Conceptualization, Y.-M.L.; methodology, S.G., H.-J.K. and S.-H.J.; validation, H.-J.K.; formal analysis, H.-J.K., S.G. and H.-G.L.; investigation, H.-G.L.; data curation, H.-J.K., S.-H.J. and O.B.; writing—original draft preparation, H.-J.K., S.-H.J. and Y.-M.L.; writing—review and editing, O.B. and Y.-M.L. All authors have read and agreed to the published version of the manuscript.

Funding

This work was supported by a funding for the academic research program of Chungbuk National University in 2022.

Institutional Review Board Statement

The animal study was approved by the Institutional Animal Care and Use Committees of Chungbuk National University (protocol code CBNU-2165-23-02 and date of approval is on 31 July 2023).

Data Availability Statement

The data presented in this study are available within the article.

Conflicts of Interest

The authors declare no conflict of interest.

References

  1. Nguyen, T.Q.; Vu, T.M.; Tukijan, F.; Muralidharan, S.; Foo, J.C.; Li Chin, J.F.; Hasan, Z.; Torta, F.; Nguyen, L.N. Erythrocytes efficiently utilize exogenous sphingosines for S1P synthesis and export via Mfsd2b. J. Biol. Chem. 2021, 296, 100201. [Google Scholar] [CrossRef] [PubMed]
  2. Constantinescu, V.; Haase, R.; Akgun, K.; Ziemssen, T. S1P receptor modulators and the cardiovascular autonomic nervous system in multiple sclerosis: A narrative review. Ther. Adv. Neurol. Disord. 2022, 15, 17562864221133163. [Google Scholar] [CrossRef]
  3. Luth, A.; Neuber, C.; Kleuser, B. Novel methods for the quantification of (2E)-hexadecenal by liquid chromatography with detection by either ESI QTOF tandem mass spectrometry or fluorescence measurement. Anal. Chim. Acta 2012, 722, 70–79. [Google Scholar] [CrossRef] [PubMed]
  4. Bielawski, J.; Pierce, J.S.; Snider, J.; Rembiesa, B.; Szulc, Z.M.; Bielawska, A. Sphingolipid analysis by high performance liquid chromatography-tandem mass spectrometry (HPLC-MS/MS). Adv. Exp. Med. Biol. 2010, 688, 46–59. [Google Scholar] [CrossRef] [PubMed]
  5. Oizumi, H.; Sugimura, Y.; Totsune, T.; Kawasaki, I.; Ohshiro, S.; Baba, T.; Kimpara, T.; Sakuma, H.; Hasegawa, T.; Kawahata, I.; et al. Plasma sphingolipid abnormalities in neurodegenerative diseases. PLoS ONE 2022, 17, e0279315. [Google Scholar] [CrossRef]
  6. Demont, E.H.; Arpino, S.; Bit, R.A.; Campbell, C.A.; Deeks, N.; Desai, S.; Dowell, S.J.; Gaskin, P.; Gray, J.R.; Harrison, L.A.; et al. Discovery of a brain-penetrant S1P(3)-sparing direct agonist of the S1P(1) and S1P(5) receptors efficacious at low oral dose. J. Med. Chem. 2011, 54, 6724–6733. [Google Scholar] [CrossRef]
  7. Saigusa, D.; Shiba, K.; Inoue, A.; Hama, K.; Okutani, M.; Iida, N.; Saito, M.; Suzuki, K.; Kaneko, T.; Suzuki, N.; et al. Simultaneous quantitation of sphingoid bases and their phosphates in biological samples by liquid chromatography/electrospray ionization tandem mass spectrometry. Anal. Bioanal. Chem. 2012, 403, 1897–1905. [Google Scholar] [CrossRef]
  8. Frej, C.; Andersson, A.; Larsson, B.; Guo, L.J.; Norstrom, E.; Happonen, K.E.; Dahlback, B. Quantification of sphingosine 1-phosphate by validated LC-MS/MS method revealing strong correlation with apolipoprotein M in plasma but not in serum due to platelet activation during blood coagulation. Anal. Bioanal. Chem. 2015, 407, 8533–8542. [Google Scholar] [CrossRef]
  9. Gowda, S.G.B.; Nakahashi, A.; Yamane, K.; Nakahashi, S.; Murai, Y.; Siddegowda, A.K.C.; Hammam, M.A.S.; Monde, K. Facile Chemoselective Strategy toward Capturing Sphingoid Bases by a Unique Glutaraldehyde-Functionalized Resin. ACS Omega 2018, 3, 753–759. [Google Scholar] [CrossRef]
  10. Min, J.K.; Yoo, H.S.; Lee, E.Y.; Lee, W.J.; Lee, Y.M. Simultaneous quantitative analysis of sphingoid base 1-phosphates in biological samples by o-phthalaldehyde precolumn derivatization after dephosphorylation with alkaline phosphatase. Anal. Biochem. 2002, 303, 167–175. [Google Scholar] [CrossRef]
  11. Lenard, J. Reactions of proteins, carbohydrates, and related substances in liquid hydrogen fluoride. Chem. Rev. 1969, 69, 625–638. [Google Scholar] [CrossRef] [PubMed]
  12. Adler, M.; Bobrow, E. Hydrolysis of purine and pyrimidine ribosides and 2-deoxyribosides with liquid hydrogen fluoride. Mt. Sinai J. Med. 1970, 37, 206–212. [Google Scholar] [PubMed]
  13. Kuyama, H.; Toda, C.; Watanabe, M.; Tanaka, K.; Nishimura, O. An efficient chemical method for dephosphorylation of phosphopeptides. Rapid Commun. Mass. Spectrom. 2003, 17, 1493–1496. [Google Scholar] [CrossRef]
  14. Ruwisch, L.; Schafer-Korting, M.; Kleuser, B. An improved high-performance liquid chromatographic method for the determination of sphingosine-1-phosphate in complex biological materials. Naunyn-Schmiedeberg’s Arch. Pharmacol. 2001, 363, 358–363. [Google Scholar] [CrossRef] [PubMed]
  15. Berdyshev, E.V.; Gorshkova, I.A.; Garcia, J.G.; Natarajan, V.; Hubbard, W.C. Quantitative analysis of sphingoid base-1-phosphates as bisacetylated derivatives by liquid chromatography-tandem mass spectrometry. Anal. Biochem. 2005, 339, 129–136. [Google Scholar] [CrossRef]
  16. Schwerin, D.L.; Hatcher, J.D. Hydrofluoric Acid Burns. In StatPearls; StatPearls Publishing LLC.: Treasure Island, FL, USA, 2023. [Google Scholar]
  17. Ghoreishi, S.M.; Beiggy, M.; Mazloum Ardekani, M. Optimization of gas chromatography using short glass capillary column with mass spectrometry for identification and evaluation of commercial heavy alkylbenzene structures. Anal. Bioanal. Chem. 2003, 375, 1212–1220. [Google Scholar] [CrossRef]
  18. Roland, L.; Drillich, M.; Iwersen, M. Hematology as a diagnostic tool in bovine medicine. J. Vet. Diagn. Investig. 2014, 26, 592–598. [Google Scholar] [CrossRef]
  19. Mauricio, C.R.; Schneider, F.K.; Dos Santos, L.C. Image-based red cell counting for wild animals blood. Annu. Int. Conf. IEEE Eng. Med. Biol. Soc. 2010, 2010, 438–441. [Google Scholar] [CrossRef]
  20. Hanel, P.; Andreani, P.; Graler, M.H. Erythrocytes store and release sphingosine 1-phosphate in blood. FASEB J. 2007, 21, 1202–1209. [Google Scholar] [CrossRef]
  21. Selim, S.; Sunkara, M.; Salous, A.K.; Leung, S.W.; Berdyshev, E.V.; Bailey, A.; Campbell, C.L.; Charnigo, R.; Morris, A.J.; Smyth, S.S. Plasma levels of sphingosine 1-phosphate are strongly correlated with haematocrit, but variably restored by red blood cell transfusions. Clin. Sci. 2011, 121, 565–572. [Google Scholar] [CrossRef]
  22. Du, C.; Ren, Y.; Yao, F.; Duan, J.; Zhao, H.; Du, Y.; Xiao, X.; Duan, H.; Shi, Y. Sphingosine kinase 1 protects renal tubular epithelial cells from renal fibrosis via induction of autophagy. Int. J. Biochem. Cell Biol. 2017, 90, 17–28. [Google Scholar] [CrossRef]
  23. Lee, S.Y.; Kim, D.H.; Sung, S.A.; Kim, M.G.; Cho, W.Y.; Kim, H.K.; Jo, S.K. Sphingosine-1-phosphate reduces hepatic ischaemia/reperfusion-induced acute kidney injury through attenuation of endothelial injury in mice. Nephrology 2011, 16, 163–173. [Google Scholar] [CrossRef] [PubMed]
  24. Koch, A.; Pfeilschifter, J.; Huwiler, A. Sphingosine 1-phosphate in renal diseases. Cell Physiol. Biochem. 2013, 31, 745–760. [Google Scholar] [CrossRef] [PubMed]
  25. Romero, D.J.; Pescio, L.G.; Santacreu, B.J.; Mosca, J.M.; Sterin-Speziale, N.B.; Favale, N.O. Sphingosine-1-phosphate receptor 2 plays a dual role depending on the stage of cell differentiation in renal epithelial cells. Life Sci. 2023, 316, 121404. [Google Scholar] [CrossRef] [PubMed]
  26. Matsuyama, M.; Funao, K.; Kuratsukuri, K.; Tanaka, T.; Kawahito, Y.; Sano, H.; Chargui, J.; Touraine, J.L.; Yoshimura, N.; Yoshimura, R. Expression of sphingosine-1 phosphate receptor in rat renal ischemia-reperfusion injury. Mol. Med. Rep. 2010, 3, 233–236. [Google Scholar]
  27. Wang, T.N.; Chen, X.; Li, R.; Gao, B.; Mohammed-Ali, Z.; Lu, C.; Yum, V.; Dickhout, J.G.; Krepinsky, J.C. SREBP-1 Mediates Angiotensin II-Induced TGF-beta1 Upregulation and Glomerular Fibrosis. J. Am. Soc. Nephrol. 2015, 26, 1839–1854. [Google Scholar] [CrossRef]
Figure 1. Extraction scheme.
Separations 11 00034 g001
Figure 2. Optimization for S1P dephosphorylation: (A) reaction temperature; and (B) reaction time at 25 °C.
Separations 11 00034 g002
Figure 3. MS fragmentation pattern of S1P.
Separations 11 00034 g003
Figure 4. Typical LC-MS/MS elution profile of S1P (A); and C17-S1P (B).
Separations 11 00034 g004
Figure 5. Measured S1P levels in serum products.
Separations 11 00034 g005
Figure 6. Measured S1P levels in plasma (A); and kidney tissue (B) (* p < 0.05) in CKD animals. (C) Morphological changes in the kidney: Control (left); CKD (right).
Separations 11 00034 g006
Figure 7. Dephosphorylation reaction efficiency of HF.
Separations 11 00034 g007
Table 1. (A). HPLC separation condition. (B). MS/MS detection condition.
(A) Liquid Chromatography Conditions
ColumnInertsil ODS-3 100 × 3.0 mm, 3 μm
Column Temp40 °C
Mobile phase A0.1% Formic acid and 10 mM CH3COONH4 in water
Mobile phase B0.1% Formic acid + 10 mM CH3COONH4 in
Acetonitrile: 2-PrPanol (4:3, v/v)
Injection volume20 μL
flow rate0.3 mL/min
Gradient conditiontime (min)A (vol %)B (vol %)
0.0~1.07030
1.0~3.070→530→95
3.0~7.05→095→100
7.0~9.00100
9.0~10.00→70100→30
10.0~14.07030
14.01Controller stop
(B) Mass Spectrometer Condition
Ionization modeESI (+) MRM
Ion Source Gas 140
Temperature300
Ion Source Gas 250
Ion Spray Voltage5500
Curtain Gas (CUR)20
Collision Gas (CAD)5
ComponentMRM condition
m/zDP (V)CE (eV)CXP (eV)
S1P300.4 > 282.4 (quantifier)40155
300.4 > 264.4 (qualifier)40284
C17 S1P286.3 > 268.280205
Table 2. Contaminated sphingosine levels during the S1P analysis in biological samples.
Sample
(n = 3)
Peak AreaRelative Amount (%)
Without HFWith HF
FBS65727,7742.4
Kidney tissue34172574.5
Table 3. Standard curve for S1P analysis.
No.SlopeInterceptR2
10.00750.07600.9996
20.00740.01610.9997
30.00730.06260.9987
Average0.00740.05160.9996
S.D.0.00010.03140.0006
Table 4. Precision, Accuracy and Reproducibility.
Nominal Concentration (pmol/mL)Mean (pmol/mL)S.D.
(pmol/mL)
Precision
(RSD, %)
Accuracy
(Recovery, %)
Precision & Accuracy
(n = 3)
3029.80.50.099.5
250246.22.72.798.5
800848.146.70.1106.0
Reproducibility
(n = 6)
3031.41.54.7104.5
Table 5. Changes in typical CKD biomarkers.
CKD Biomarkers Control Group
(n = 6)
CKD Group
(n = 6)
Creatinine
(mg/dL)
0.31 ± 0.031.38 ± 0.55
Kynurenine
(μg/mL)
0.60 ± 0.181.01 ± 0.55
Tryptophan
(μg/mL)
12.25 ± 1.427.39 ± 1.01
Disclaimer/Publisher’s Note: The statements, opinions and data contained in all publications are solely those of the individual author(s) and contributor(s) and not of MDPI and/or the editor(s). MDPI and/or the editor(s) disclaim responsibility for any injury to people or property resulting from any ideas, methods, instructions or products referred to in the content.

