Article

Optimization of the Reaction between 5-O-Caffeoylquinic Acid (5-CQA) and Tryptophan—Isolation of the Product and Its Evaluation as a Food Dye

by
Patroklos Vareltzis
1,*,
Panagiota Karatsioli
1,
Ioannis Kazakos
1,
Anna-Maria Menelaou
1,
Konstantina Parmaxi
1 and
Vangelis Economou
2
1
Laboratory of Food Industry Technology and Agricultural Industries, Department of Chemical Engineering, Aristotle University of Thessaloniki, 54124 Thessaloniki, Greece
2
Department of Hygiene and Technology of Food of Animal Origin, School of Veterinary Medicine, Aristotle University of Thessaloniki, 54124 Thessaloniki, Greece
*
Author to whom correspondence should be addressed.
Separations 2024, 11(2), 60; https://doi.org/10.3390/separations11020060
Submission received: 28 January 2024 / Revised: 10 February 2024 / Accepted: 12 February 2024 / Published: 16 February 2024
(This article belongs to the Special Issue Bioactive Compounds in Foods: Separation, Extraction and Application)

Abstract

:
The food industry is seeking a stable, non-toxic red dye as a substitute for synthetic pigments. This can result from the reaction between 5-O-Caffeoylquinic acid (5-CQA) and tryptophan (TRP). This study explores the reaction kinetics under ultrasound conditions and investigates reaction parameters, such as pH, temperature, and reactants’ concentrations, to accelerate the reaction. At the end of the reaction, the solution was either spray-dried or acidified to isolate the pigment, which was evaluated for its potential as a food dye. Using ultrasound at 40 °C led to a significant acceleration of the reaction that was completed in 8.5 h, marking a 300% improvement compared to literature. The caffeic acid, and not the quinic acid, moiety of 5-CQA seems to be partly responsible for the formation of the red pigment. The pH had a profound impact on the reaction rate, with an optimal value of pH = 9.5. Increased TRP concentrations led to increased reaction rates, while higher 5-CQA concentrations led to significant deviations from redness (a* value). The pigment, lacking significant antimicrobial activity, exhibited remarkable thermal stability (pH 3–9), delaying food oxidation and color deterioration. The results indicate that the reaction can be significantly accelerated by ultrasound, which will be useful for the scale-up of the process and giving the produced pigment the potential for use as an alternative to artificial coloring.

1. Introduction

Color is an important food quality characteristic that often dictates consumers’ preference. There is an abundance of cost-effective synthetic colorants available with excellent technological characteristics, such as heat and light stability over a wide range of pH, and attractive hues [1]. Due to health concerns, however, and the trend of consumers’ growing preference for natural products, the food industry is constantly seeking alternative colorants. Many countries have banned the consumption of various dyes, such as Blue FCF, and Blue No. 1 and No. 2, due to their toxicity [2]. Another common compound added mainly to meat products is nitrite, which is used for the curing process. Nitrite is employed as a preservative primarily for microbial safety, inhibiting the growth of Clostridium botulinum, and to impart the desired bright red color in meat products such as sausage, ham, and salami [3] However, the formation of cancer-causing nitrosamines occurs when nitrite reacts with secondary or tertiary amines. Notably, the International Agency for Research on Cancer (IARC) has classified processed meat as carcinogenic based on substantial epidemiological data [4]. In pursuit of stable and non-toxic pigments, researchers have been exploring alternative solutions, preferably derived from plants, due to dietary habits and/or restrictions that do not allow consumption of animal and/or animal-derived products [5,6]. Among these alternatives, anthocyanins, betalains, and carotenoids have shown promise. However, their practical application encounters challenges, due to their susceptibility to heat and oxidation during processing [7,8] and their limited commercial availability caused by difficulties in extraction and purification [9,10,11].
Phenolic compounds have been shown to interact with dietary proteins, forming soluble or insoluble complexes with altered physicochemical properties of the two reacting molecules [12,13,14]. These interactions can be covalent and non-covalent in nature, often leading to the greening or browning of the food during processing [15,16,17]. Bongartz et al. (2016) observed that incubating CQA with various amino acids at pH 9 led to the development of color, consisting of various hues such as green, brown, and, specifically with tryptophan, red [18]. Therefore, such interactions are the focus of food-related research. Chlorogenic acids (CGAs) are the esters of caffeic acid and quinic acid. They are plant-derived bioactive compounds and mostly found in medicinal plants, in green coffee extracts, and tea, as well as in vegetables such as eggplant, etc. [19,20,21]. The CGA compounds reportedly exhibit many beneficial health effects that include, but are not limited to, antioxidant, antiviral, antibacterial, anticancer, and anti-inflammatory properties, as well as protection against cardiovascular and Alzheimer’s disease [22,23].
The 5-caffeoylquinic acid (5-CQA) and amino acids readily react and lead to the formation of benzacridine dye [15,18,24]. It was theorized that the green color formation between 5-CQA and amino acids may indicate the attachment of CQA dimers to the α-NH2 group, except for proline and cysteine [18]. Interestingly, a red color was developed when 5-CQA reacted with tryptophan (TRP) [25,26]. It was postulated that the indole moiety of TRP was responsible for the formation of this red pigment (Scheme 1a,b) [17,18]. Recently, it was proposed that a complex compound consisting of two TRP and one caffeic acid moieties is formed, and a tentative pathway of its formation was suggested [25]. Moccia et al. (2021) suggested a similar mechanism, where a relatively complex sequence of events triggered by the oxidation of CGA in the presence of excess TRP led, eventually, to the loss of the side chain of one TRP moiety, as well as the partial loss of the propenoate moiety of chlorogenic acid (Scheme 1c) [26].
The 5-CQA can react with tryptophan under various conditions, as has been reported by different researchers [17,25,26]. However, there are two common characteristics in all methods: the need for 5-CQA to be oxidized at the start of the reaction, and long reaction times (>24 h). Vercruysse (2019) suggested that a reaction between 5-CQA and TRP at a ratio of 1 mM to 7 mM, respectively, in the presence of Na2CO3 can be completed within 24 h at 37 °C [17]. Moccia et al. (2021) performed the reaction at pH 9, which was checked and re-adjusted to 9 after 10 and 30 min under vigorous stirring for 64 h [26]. These conditions were similar to the ones described by Iacomino et al. (2017) for the reaction of CGA with lysine and glycine leading to the formation of green coloring at ambient temperature [24]. No cytotoxicity was observed when human hepatic cells (HepG2) and colonic cells (Caco-2 and CCD-18Co) were exposed to a range of concentrations of the pigment for 24 h [26].
Xue et al., 2020 suggested another potential route involving the production of conjugates between proteins and anthocyanins through a free radical mechanism induced by ultrasound [29]. In recent years, sonochemistry has been increasingly utilized to decrease chemical reaction times. Ultrasonic treatment has gained popularity due to its numerous benefits, such as reduced energy consumption, waste reduction, and improved mass transfer, which ultimately accelerates chemical reactions [30]. These benefits are attributed to the phenomenon of cavitation that occurs during the process, where a huge amount of energy is released locally into the medium by the collapse of bubbles [31].
To intensify the production process of this promising dye, more research is needed, especially regarding reaction kinetics, where there is a lack of data. This research work aimed to study the effect of ultrasound on the 5-CQA and TRP reaction rate and investigate the parameters affecting it. The effects of time, pH, temperature, and reactant molar ratio on reaction kinetics were investigated. Furthermore, the reaction product was either isolated by a pH adjustment or spray-dried and some of its physicochemical properties determined. The spray-dried red pigment was evaluated for its thermal stability and antimicrobial properties, and was compared to nitrites in a real food system regarding color and oxidative stability. This study reports, for the first time, the successful acceleration of the reaction between 5-CQA and TRP, reaction kinetic data, and some of the physicochemical characteristics of the spray-dried dye.

2. Materials and Methods

2.1. Materials

Analytical grade 5-CQA (98% purity), L-tryptophan, Caffeic acid (98% purity), quinic acid, indole, acetic acid, sodium acetate, and sodium carbonate were purchased from Merck KGaA (Darmstadt, Germany). Methanol and acetonitrile of HPLC grade were also purchased from Merck KGaA. Food-grade potassium nitrite was purchased from Manis Chemicals (Manis PC, Thessaloniki, Greece).

2.2. 5-CQA and Red Pigment Determination

The 5-CQA concentration was determined at 280 nm wavelength by HPLC/UV–Vis (KNAUER Wissenschaftliche Geräte GmbH, Berlin, Germany). For chromatographic separation, a 150 × 4 mm Eurospher II 100-5 C18P column, equipped with precolumn, was used. A gradient (Table S1, Supplementary Materials) consisting of aqueous acetic acid solution (2%, v/v) and acetonitrile HPLC grade was applied, with a constant flowrate at 1.0 mL/min.
Red pigment solutions were scanned from 400 to 700 nm (spectrometer Helios-γ, Thermo Scientific, Boston, MA, USA) and the wavelength 540 nm, where maximum peak was observed, was chosen to follow the evolution of color during the reaction. At regular intervals, aliquots of the samples were removed, immediately cooled down under running tap water, and measured at 540 nm.
Instrumental colorimetric measurements were made with a ColourLite sph870 (ColourLite GmbH, Katlenburg-Lindau, Germany) equipped with the proper attachment for measuring liquid samples. L*, a*, and b* values were measured and the color difference (ΔΕ) with a control sample (1 mM:7 mM; 5-CQA:TRP) was calculated according to the following equation:
Δ E = Δ L 2 + Δ a 2 + Δ b 2
where ΔL is the L* (lightness) difference between the control sample and the treated one, Δa is the corresponding difference in a* value (redness), and Δb the difference in b* value (yellowness).

2.3. Reaction of 5-CQA with TRP; Effect of Reactant Concentrations, pH, and Temperature

Tryptophan solutions (7–28 mM) in 50 mM Na2CO3 and 5-CQA solutions (2–14 mM) in acetate buffer 100 mM (pH = 6.5) were prepared according to previously described procedures [17,26]. The two solutions were mixed at a ratio of 1:1 (v/v) to prepare the desired molar ratios. The final reaction volume ranged from 10 mL to 50 mL. For the effect of ultrasound on the reaction’s rate, the standard molar ratio, according to literature, of 1 mM 5-CQA to 7 mM TRP was used.
Ultrasound (FALC LBS1, 200 W, 50 kHz) and high temperatures were investigated as means for accelerating the reaction. For the ultrasound experiments, reaction mixtures were placed in Erlenmeyer flasks covered with punctured aluminum foil (40 °C). Ultrasound was used for the investigation of reaction kinetics, the effect of reactant concentrations, and the effect of pH on the reaction rate and color of the product. For the temperature effect, reaction mixtures in closed-cap glass tubes were placed in an incubator equipped with orbital shaker and the temperature was set at 40 °C, 63 °C, or 73 °C. The 5-CQA concentration in the reaction mixture was followed by HPLC and color development by UV–Vis. Separate reaction vessels were used for each measurement throughout the reaction. In addition, the reaction was carried out in a pH range of 6–10.5 to study the effects on the reaction rate. Each pH was controlled by adjusting the pH of the buffer used for the reaction and checking it at regular intervals. Finally, different molar ratios of TRP and 5-CQA were also tested to investigate their effects on the reaction rate at 40 °C and on the color of the final product.

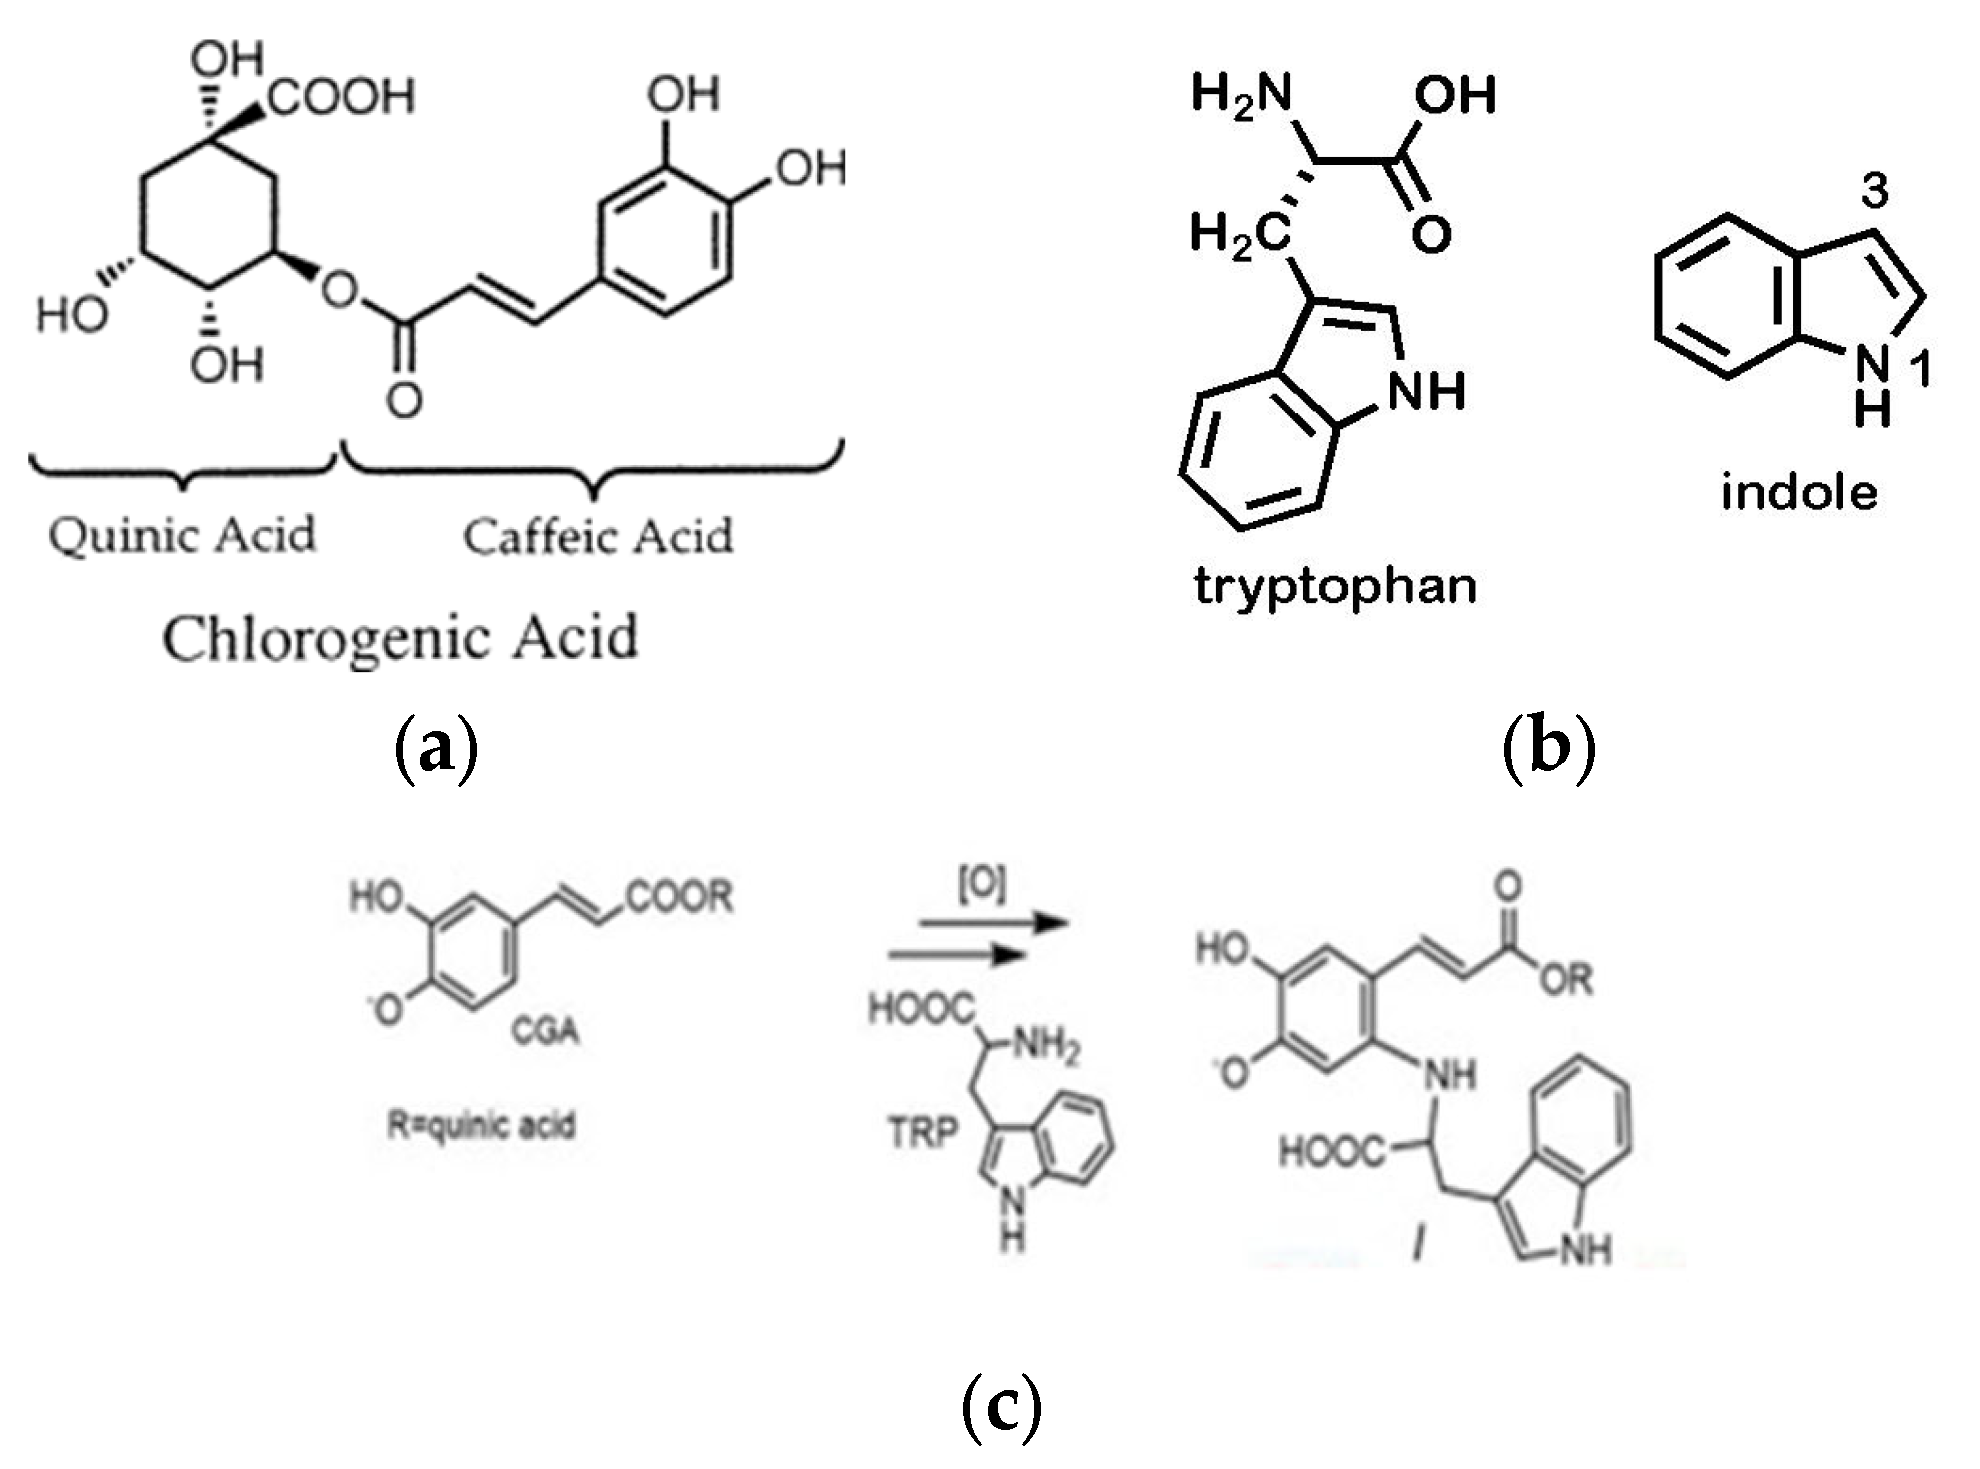
2.4. Order of the Reaction and Investigation of Reaction Mechanism

A first-order reaction is described by Equation (2), while a second-order reaction is described by Equation (3). A linear relationship between ln(Ca) vs. time or between 1/Ca vs. time would indicate the order and provide the value of the rate constant k [32]:
ln C a C a o = k t
1 / C a = 1 / C a o + k t
where Ca is the concentration of 5-CQA at any time t (min), Cao is the concentration of 5-CQA at t = 0 min, and k is the rate constant.
To conduct a more in-depth analysis of the reaction order, a series of reactions were performed with varying initial concentrations of 5-CQA and TRP. Using Equation (4), the reaction orders for both reactants were calculated:
r 1 r 2 = k A 1 n B 1 m k A 2 n B 2 m
To determine the chemical groups responsible for the reaction, substitution of the initial reactants was performed with some of their characteristic groups. These groups are caffeic acid and quinic acid for the 5-CQA and indole for TRP. Therefore, two separate reaction mixtures were prepared as described in Section 2.2, where 5-CQA was substituted by equimolar quantity of caffeic acid or quinic acid and TRP. A third mixture was prepared, where TRP was substituted by equimolar quantity of indole and reacted with 5-CQA. Reaction conditions were the same as previously described in Section 2.2 (pH 9, ultrasound, 40 °C) and was followed by HPLC analysis and UV–Vis absorbance at 540 nm.

2.5. Recovery of the Red Pigment

The final solution of the reaction was either acidified to recover the red pigment or spray-dried to obtain a red powder. For the acidification procedure, a few drops of HCl solution (37 % w/w) are added to the samples at the end of the reaction, with simultaneous stirring, in order to adjust the pH to approximately 1. Concentrated HCl solution was used to avoid dilution of the sample. This pH value was chosen based on literature findings and is the one at which precipitation of the red pigment is observed [26]. Then, all samples were weighed and their Brix values were measured. Samples were then centrifuged at 2220× g for 10 min, 20 min, and 40 min in order to improve the process efficiency. After the centrifugation process, the solution was filtered to isolate the precipitate. The amount of sediment in each sample was then weighed and its moisture content measured. Yield was calculated as follows:
Y % = 100 × w e i g h t   o f   s e d i m e n t   ( g ) m o i s t u r e   c o n t e n t   ( g ) w e i g h t   o f   s o l i d s   i n   i n i t i a l   s o l u t i o n   ( g )
It is worth noting that the resulting sediment did not have the desired red color. Therefore, in order to determine whether the product had deteriorated in color, or whether its color is restored by reconstitution, the pH was increased to its original value.
For the spray-drying procedure, the reaction product solution was first concentrated to 8%TDS with a rotary evaporator (Laborota 4003, Heidolph Instruments GmbH & Co. KG, Schwabach, Germany), and then fed into the spray dryer equipped with a 0.4 mm two-way nozzle (Yamato ADL311S, Yamato Scientific Inc., Tokyo, Japan). The pump rate was adjusted to 5.2 mL/min, and the air inlet temperature was set at 190 ± 1 °C, while the outlet temperature ranged from 62 to 65 °C. The air flow rate was constant at 0.14 m3/min and the spray air pressure was regulated at 0.1 MPa according to preliminary experiments. The dried powder was collected from the cyclone and the product collection vessel, was sealed under vacuum in a plastic bag, and was stored at −20 °C for further analysis. The solids yield of the process was calculated according to the following equation:
Y % = 100 × w e i g h t   o f   p o w d e r   ( g ) w e i g h t   o f   s o l i d s   i n   t h e   f e e d   ( g )
Moisture content, water activity, bulk density, and hygroscopicity were determined using standard methods, as described in literature [33].

2.6. Thermal Stability of the Red Pigment

The pH stability was investigated by dissolving 1 g of the spray-dried powder in 10 mL of (a) HCl solution (pH = 3), (b) HCl solution (pH = 4), (c) ultra-pure water (pH = 7), and (d) NaOH solution (pH = 9), followed by vortexing for 1 min.
The above prepared samples were subjected to different thermal treatments to establish their heat stability: (a) boiling water for 20 min, (b) −20 °C for 18 h, (c) ultrasound at 40 °C for 15 min, and (d) microwave at 700 W for 2 min. Color differences were determined instrumentally.

2.7. Antimicrobial Activity of the Red Pigment

The antimicrobial activity of the reaction product was examined with a well diffusion method and a miniaturized minimum inhibitory concentration method (microMIC) against two Gram-negative and three Gram-positive bacterial species. The Gram-negative strains belonged to Salmonella spp. (two strains; S. Typhimurium DT120 and S. Typhimurium ATCC 14028) and Escherichia coli (two strains; ATCC 11303 and ATCC 16628). The Gram-positive strains used were Listeria monocytogenes (two strains; ATCC 7644 and CIP103575), Staphylococcus aureus (two strains; ATCC 25629 and DSM102262) and Enterococcus faecalis (two strains; Ν39 and Ν54, Laboratory of Hygiene of Mammalian Food Products and Veterinary Public Health collection). The well diffusion method was used for the preliminary investigation of possible antimicrobial activity of the extracts following the method described by Chachlioutaki et al. (2022) [34]. Zones larger than 1 mm were considered to exhibit antimicrobial activity against the examined strain. Three repetitions were performed for each strain. The microMIC method according to CLSI (2023) was used for the quantification of the antimicrobial activity [35].

2.8. The Red Pigment as a Food Dye in Sausages: Antioxidant Ability and Color Stability

Three cooked pork Frankfurt-type sausages were prepared based on Herrmann et al. (2015)’s recipe with some modifications [36]. Initially, freshly purchased minced pork loin was combined with additives using Primo Kitchen Equipment (550 W, MVP Group, Fort Lauderdale, FL, USA). Common ingredients in all preparations were ground meat (70% w/w), tap water/ice (28% w/w), sodium chloride (2% w/w), and 100 ppm nisin as an antimicrobial agent. Separate mixtures received additional components: potassium nitrite (150 ppm) or the dried product of the 5-CQA-TRP reaction (400 ppm). These mixtures were blended thoroughly under cold conditions to ensure even distribution of ingredients and minimal oxidation. Each sample was prepared in triplicate, packed in cylindrical plastic cases, and cooked at 90 °C for 50 min to guarantee the thermal center of the sausage reached 63 °C for 5 min. After cooking, the sausages were rapidly cooled in an ice water bath, resulting in a final weight of 40 g per sausage. Subsequently, the sausages were stored at 5 °C, and daily measurements were taken during a 10-day refrigerated storage period to determine the lipid oxidation level using TBARS [37].
Oxymyoglobin content in muscle tissues is a good indicator of both the color and oxidative stability of the tissue [38,39]. The concentration of oxymyoglobin (oxyMb) in the samples was determined following previously described procedure [40]. For each measurement, 2 g of the Frankfurt-type sausage was weighed and mixed with 20 mL of phosphate buffer (0.04 M and pH = 6.8) in a test tube. The mixture was homogenized, followed by centrifugation at 2900× g (Unicen 21, Álvarez Redondo S.A. Madrid, Spain) for 30 min. The supernatant was collected and its absorption at specific wavelengths (503, 525, 557, and 582 nm) was measured. The equations of Tang et al. (2001) were used to calculate the percentage content of oxyMb [40].

2.9. Statistical Analysis

Differences were considered significant at p < 0.05. A one-way ANOVA with Tukey’s test for comparison was carried out by the Minitab 21 Statistical Software (Minitab LLC, State College, PA, USA). Experiments were performed in triplicates (n = 3, unless otherwise stated).

3. Results and Discussion

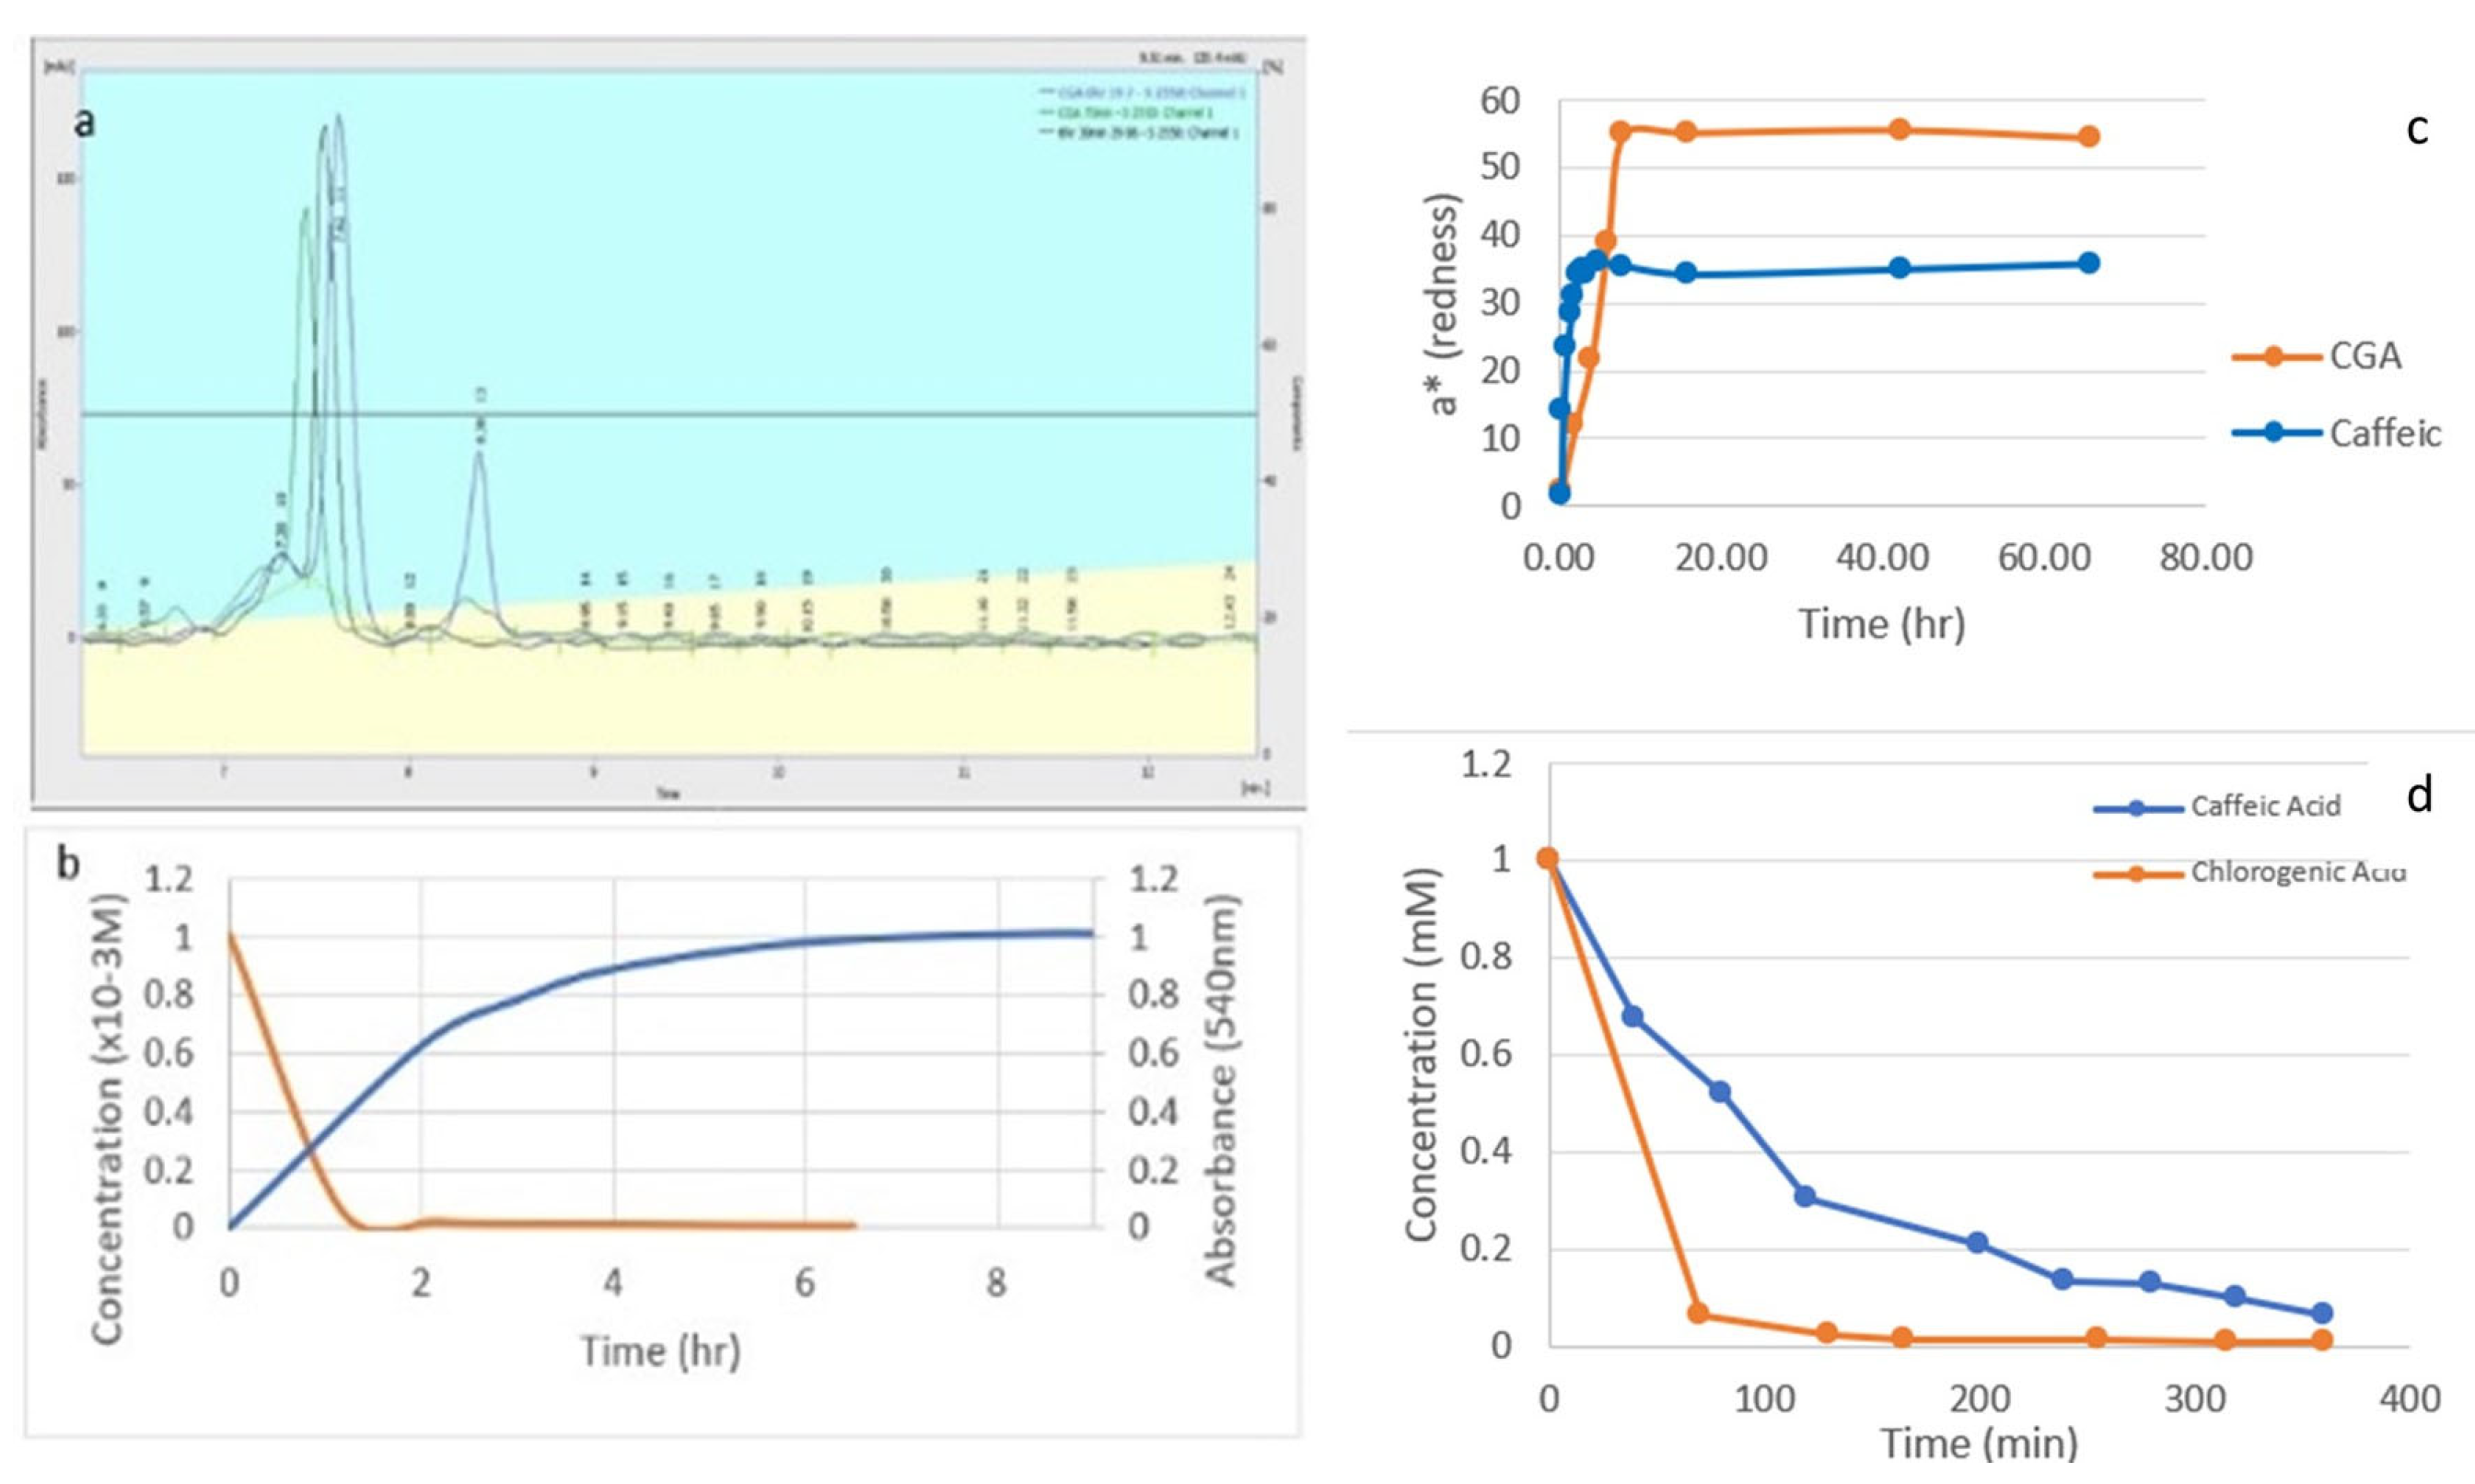
3.1. Reaction Kinetics

The reaction mixture (1 mM 5-CQA and 7 mM TRP) was placed in an ultrasound water bath at 40 °C. The progress of the reaction was monitored by the HPLC determination of the 5-CQA concentration and by measuring the absorbance of the reaction mixture at 540 nm. Two main peaks could be observed in the acquired chromatograms. Indicatively, Figure 1a depicts the chromatograms of the reactant mixtures at the beginning of the reaction (t = 0 min), at t = 70 min, and at t = 390 min. TRP is represented by the first peak (Figure S1, Supplementary Materials) while the second peak corresponds to 5-CQA (Figure S2, Supplementary Materials). Figure 1b depicts the evolution of the red color measured at 540 nm, which is the product of the reaction.
Upon observing Figure 1b, it is evident that absorption rapidly increased during the first three hours. However, the rate of increase progressively slowed down and eventually stabilized. It can be concluded that the reaction reached its endpoint at approximately 8.5 h, when the absorbance of the red solution reached a plateau. This represents at least a 300% reduction in reaction time compared to what has been reported in the literature, i.e., 24, 64, or even 72 h [17,25,26]. The enhanced local transfer phenomena (mass and heat) due to the cavitation that occurs during ultrasound application can explain the reduction in reaction time [41].
Additionally, it appears that the concentration of 5-CQA decreased sharply in the first 70 min of the reaction. Meanwhile, the absorption of the product increased rapidly. After approximately 6.5 h, the concentration of 5-CQA was 1.7 × 10⁵ mol/L and, thereafter, remained constant, achieving a 98% conversion considering the initial concentration (Co) of 0.001 mol/L.
In a similar manner, there is a rapid evolution of the red pigment during the reaction between caffeic acid and TRP (Figure 1c), reaching a plateau at 8.5 h, which remained unchanged for the duration of this experiment (70 h). However, caffeic acid was consumed at a lower rate compared to 5-CQA (Figure 1d).
The other two tested combinations, i.e., quinic acid with TRP and 5-CQA with indole, did not yield any pigment, and it was assumed that no reaction took place. The reaction mechanism and the parameters that affect its rate are still under investigation with contradictory results. The oxidative conversion of plant phenols with an o-dihydroxy structure may lead to the formation of colored compounds. After the oxidation of caffeic acid with polyphenol oxidase, a red reaction product was obtained [42]. On the other hand, it has been reported that, when caffeic acid was oxidized, no red pigment was formed and no peak was detected during the analysis. However, when the reaction was performed in dilute solution (1:10 v/v), a slight red hue was observed and a small peak was detected with m/z 561 [M + H]+ [25]. On the contrary, no red pigment formation was observed when the reaction with TRP was run on caffeic acid, likely due to different oxidation pathways of the hydroxycinnamic system being operative when the ester moiety is lacking [26]. The indole part of TRP does not seem to be responsible for the reaction, as shown here. Santarcangelo et al. (2023) suggested that an unsubstituted α-amino group of TRP is a prerequisite for the reaction to occur [25].

3.2. Reaction Order

According to Equation (2), if the reaction was first-order, the graphical representation of ln(Ca) vs. t should be a straight line. That is not the case, since, in Figure 2a, it is clearly observed that there is no linear relationship between ln(Ca) and time. Instead, there is a linear relationship between 1/Ca and time (R2 = 0.9866), which, according to Equation (3), is indicative of a second-order reaction for 5-CQA (Figure 2b). The calculated reaction rate constant is 322.62 M 1 m i n 1 or 5.38 M 1 s 1 .
The above results were verified by running extra reactions with varying concentrations of 5-CQA and TRP (Table S2, Supplementary Materials). Applying Equation (4), the order of the reaction for 5-CQA is 2 and 0 for TRP, which indicates that TRP is in excess. This is verified by the fact that, after 6.5 h of the reaction, the TRP peak is only slightly decreased, as well as by other researchers stating that, in order for the reaction to take place, TRP needs to be in excess [17,26]. When the rate constant was calculated as a first-order reaction, there was a steady decrease in the calculated value over time. On the other hand, when the rate constant was calculated as a second-order reaction, the values were randomly arranged around an average, which is equal to 315.68 M1min1, similar to the previously calculated k (322.62 M1min1) (Table S3, Supplementary Materials). The oxidation of CGA and caffeic acid has also been found to follow a second-order reaction kinetic [43]. The calculated rate constants were 5×10⁴ and 2.3×10⁴ M−1 s−1 for CGA and caffeic acid, respectively. These constants are four magnitudes of order higher than the one calculated in this study for 5-CQA, suggesting that the rate-limiting step for the reaction is not the oxidation step of 5-CQA, but the reaction of the oxidized products with TRP to form the red pigment. This phenomenon would also explain the observation that 5-CQA and caffeic acid (Figure 1b,d) seem to be consumed rapidly, while the red pigment develops over the course of 8.5 h.

3.3. Effect of Molar Ratios

Various molar ratios of 5-CQA-to-TRP have been investigated in literature. Moccia et al. (2021) concluded that a minimum ratio of 1:5 is necessary for the final product to be red [26]. Observing Figure S3 (Supplementary Materials), the sample produced with a concentration of 3.5 mM TRP and 1 mM 5-CGA can form a red product. Different molar ratios of 5-CQA to TRP gave different intensities of the red color, as evidenced in Table 1, from dark red (very high a* value) to light red (1:3.5 5-CQA-to-TRP ratio). When the 5-CQA-to-TRP ratio was equal to or higher than 1, the final product had lost its redness (a*) and even gave a green color at a 5-CQA-to-TRP ratio = 7:3.5.
Different reactant molar ratios also affected the rate of product formation (Figure 3).
Observing Figure 3a, it is noticeable that a decrease in tryptophan concentration to 5 mM results in a slight decrease in the rate of product formation compared to the standard 1/7 ratio (p > 0.05). By further reducing tryptophan to 3.5 mM, a significantly lower rate of red pigment formation (p < 0.05) and a negligible effect on the completion time of the reaction are observed. With an increase in the TRP concentration to 14 mM, the reduction of the initial reaction rate is evident, always in comparison to the ratio of 1:7; however, the reaction continues even after the 9 h. Interpreting the results of Figure 3b, increasing the molar ratio from 1:7 to 7:7 (5-CQA-to-TRP), the product’s formation rates also increase.

3.4. Temperature Effect on the Reaction

There was a significant decrease in reaction time with increasing temperature. A 35% decrease in time (from 8.5 h to 5.5 h) was recorded, when the reaction temperature was 63 °C instead of 40 °C, and a 65% decrease, when the temperature was 73 °C (from 8.5 h to 3 h). However, as shown in Figure S4 (Supplementary Materials), the increased temperature led to a gradual loss of the red color. The differentiation in the color at higher temperatures can be attributed to structural changes of the two reactants. It has been calculated that the activation energy of thermal destruction for temperatures above 90 °C of free TRP at physiological pH is 79 kJ/mol [44]. This energy barrier can be overcome at lower temperatures if ultrasound is applied. Furthermore, increased isomerization and transformation of 5-CQA to caffeic acid, quinic acid, and cis-caffeic acid has been observed by increasing the heating time and temperature [45].

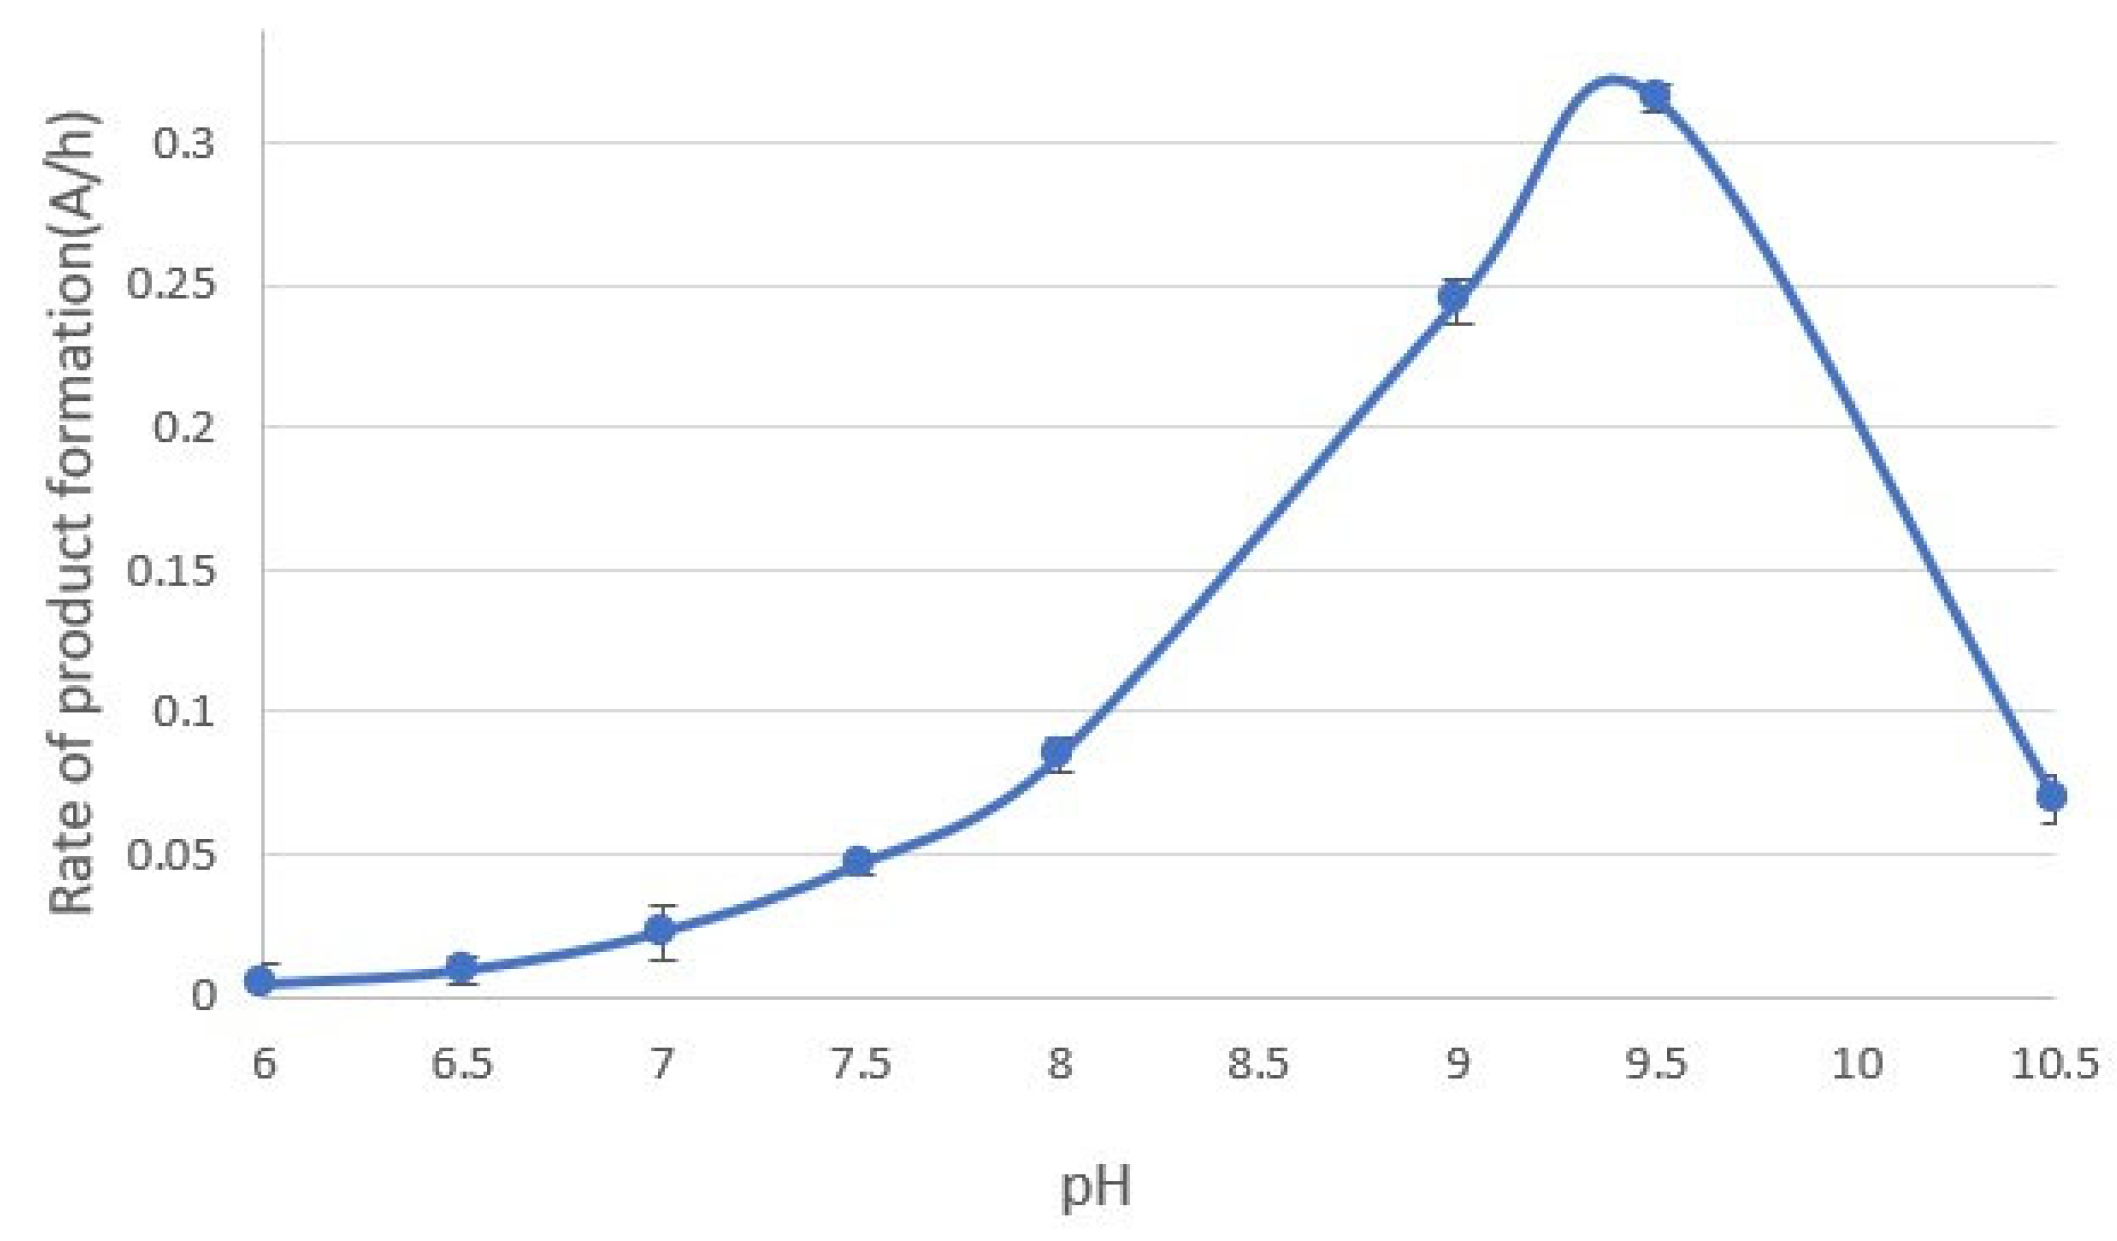
3.5. Effect of pH on the Reaction Rate

The reaction mixtures (1 mM 5-CQA and 7 mM TRP, 40 °C) were prepared at different pH values and the average rate of product formation was monitored using UV–Vis at 540 nm (Figure 4). The average rate was calculated as the difference in absorbance of the solution at 540 nm at the end and beginning of the reaction divided by time (8.5 h). A significant dependence of the reaction rate on pH was observed. At a pH of <6.5, the reaction rate is very close to zero. A small change in pH leads to a significant increase in the rate of product formation up to a value of pH = 9.5. A further increase in pH led to a sharp decrease in the rate of formation of the red pigment. The difference in product formation rates was also easily seen by visual monitoring. At pH = 10.5, it was observed that the reaction was significantly delayed, its extent drastically reduced, and the product finally no longer exhibited the desired red color. With regard to the duration of the reaction, it is interesting to note that the reaction required 8.5 h at a pH of 9, about 73 h at a pH of 8, more than 158 h at a pH of 7, and more than 190 h at a pH of 6.5. Regardless of the time required to complete the reaction, the final product had the desired red color (Figure S5, Table S4, Supplementary Materials). The crucial role of the pH can be explained by the fact that polyphenols easily oxidize under alkaline conditions to form half-quinone radicals that rearrange to quinones [46]. The irreversibility and stability of the new polyphenol–amino-acid complex can be attributed to the formation of covalent bonds [47]. The presence of oxygen further facilitates this process, and, at pH values above 7, non-enzymatic oxidation occurs, leading to covalent interactions between proteins and polyphenols [48]. Similarly, alkaline conditions favored the development of a green color when CGA reacted with sunflower proteins [15].

3.6. Recovery and Isolation of the Reaction Product

At the end of the reaction, the solution was either acidified at pH = 1 to isolate the red pigment or spray-dried. Table 2 summarizes the corresponding recovery yields calculated by Equations (5) and (6).
It is observed that increasing the centrifugation time led to increased recovery yields for the red pigment. Moccia et al. (2021) reported a 37% w/w yield with respect to CGA following a similar procedure [26]. Spray drying led to a significantly higher yield in terms of solids recovery. A preliminary LC/MS analysis (Supplementary Materials, Figures S6 and S7) revealed a peak at 30 min elution time, with a characteristic mass (m/z) of 376.13, and confirmed that the main reaction responsible for the red color is the reaction between the caffeic acid moiety of CGA and TRP. The mass of 376.13 is visible at t = 15 min of the reaction; its signal is increased by the end of the reaction and is also present in the dried powder. A more comprehensive analysis including purification of the sample is needed to determine the exact mass(es) of the red pigment, as well as the purity of the final powder.

3.7. Physicochemical and Antimicrobial Properties of the Spray-Dried Pigment

The spray-drying process had a yield of 62% as calculated by Equation (6). The dried pigment had a moisture content of 6%, water activity of 0.25, bulk density of 0.66 g/mL, and hygroscopicity of 0.73. The well diffusion method and the miniaturized minimum inhibitory concentration method (microMIC) showed no significant activity of the red pigment against the tested micro-organisms.
The dried red pigment showed remarkable thermal stability at a wide range of pH (3–9). Negligible color differences (ΔΕ) were recorded between the control (no thermal treatment) and treated samples (Table 3). These results are consistent with the results from literature [26].

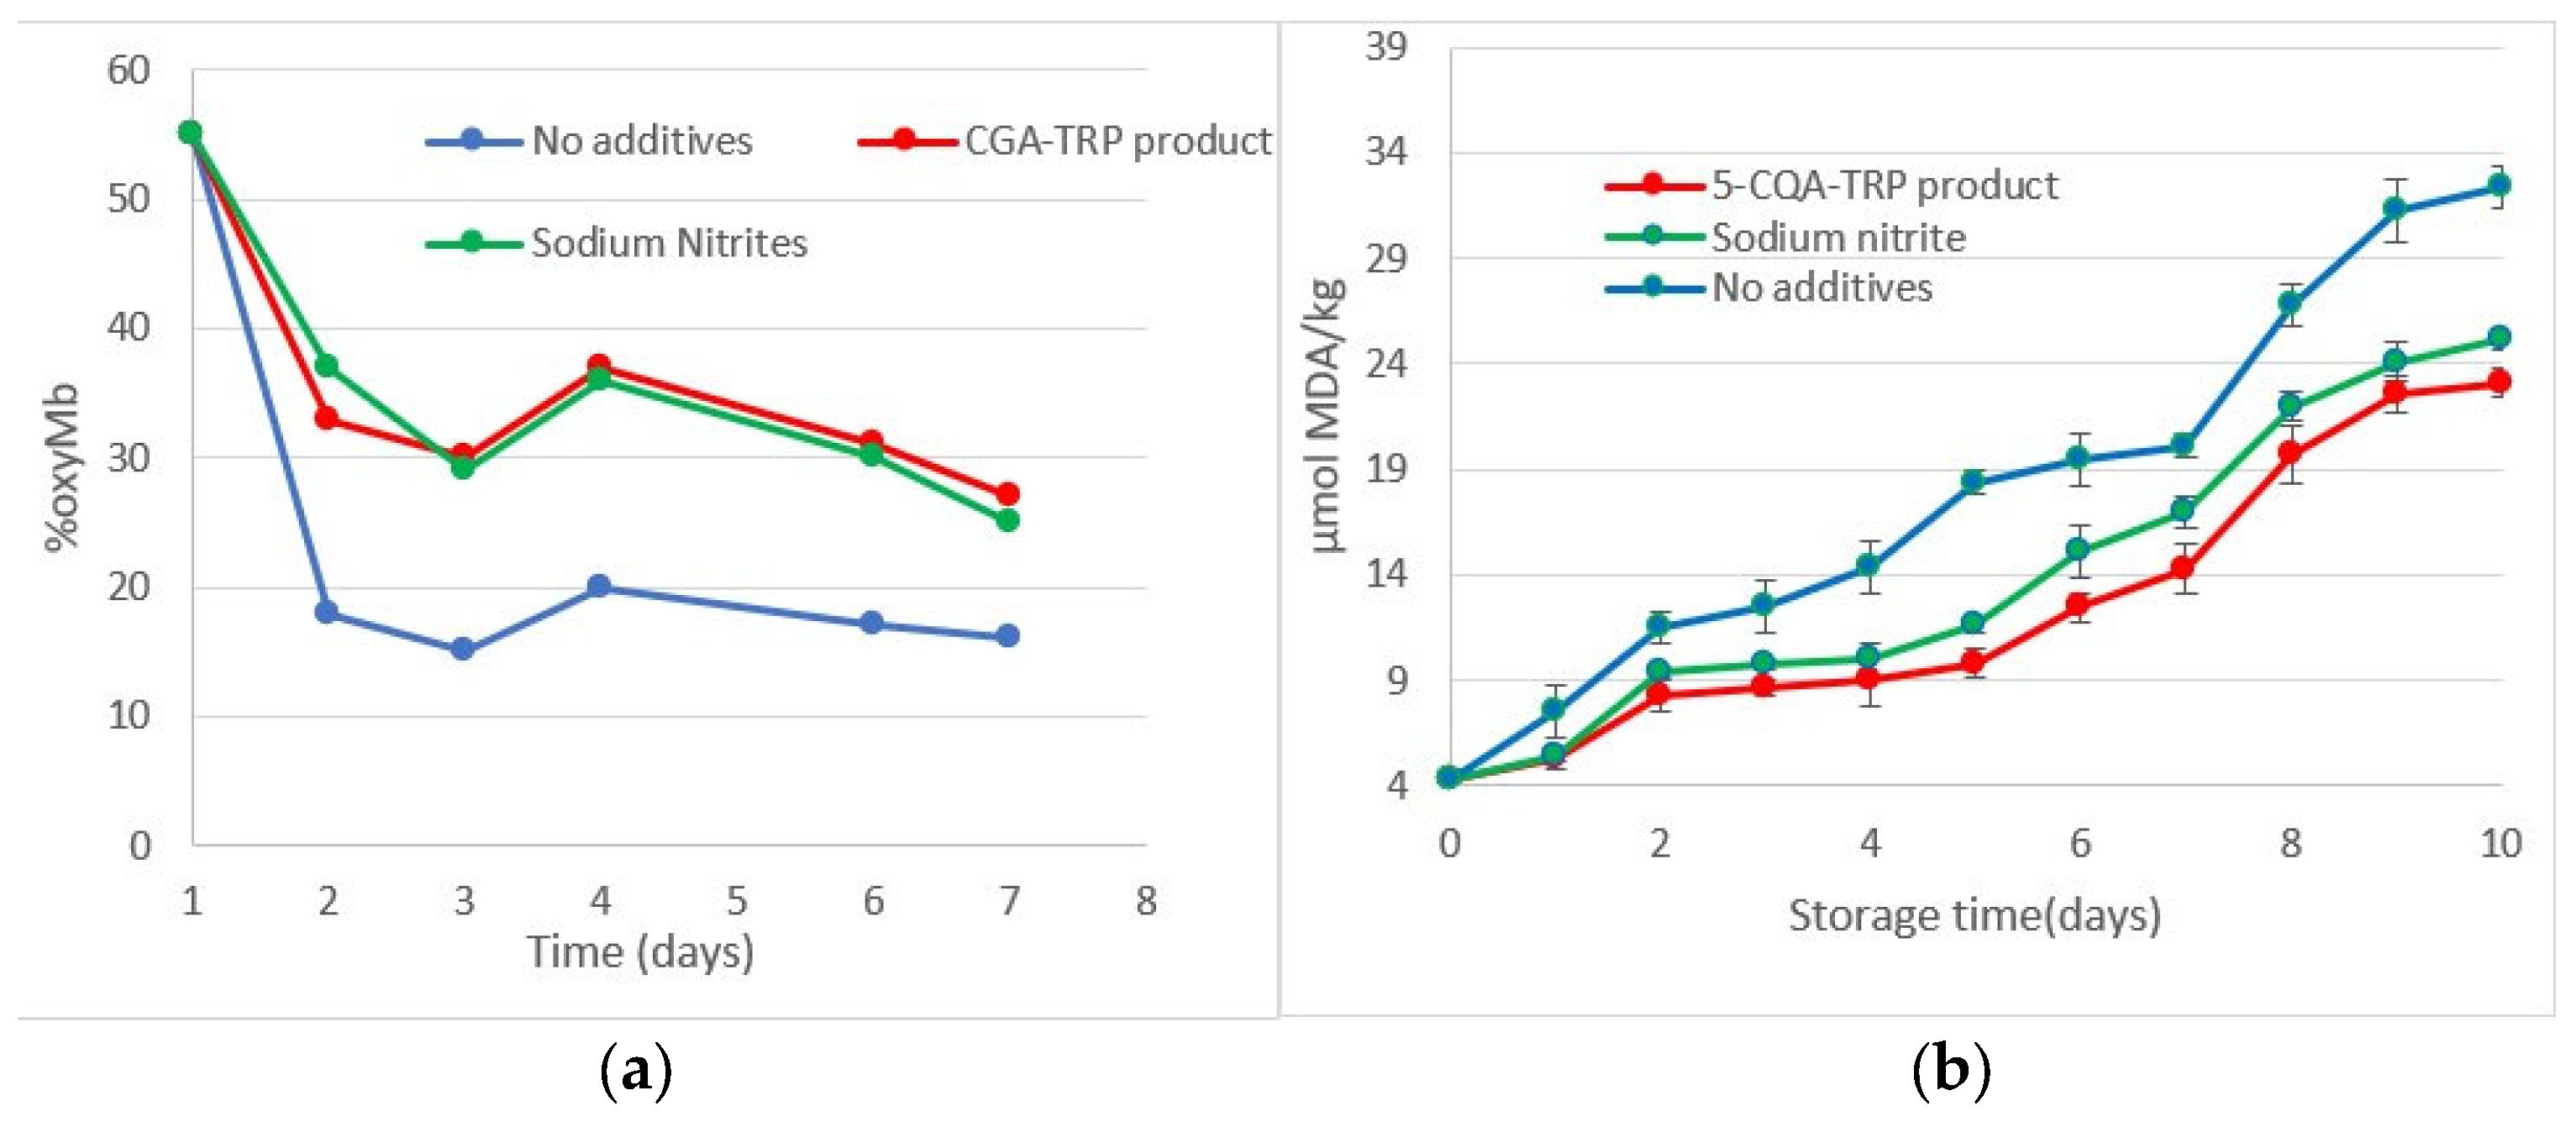
3.8. The Red Pigment as a Food Dye in Frankfurt-Type Sausages

Three Frankfurt-type sausages (in triplicate) were stored at 5 ± 1 °C for 10 days. Samples with no additives, with sodium nitrite, or with red pigment were analyzed for color stability and lipid oxidation (Figure 5). In Figure 5a, there is a rapid decrease in oxyMb content on the first day of storage, especially for the control sample (no additives) which lost 67% of its initial oxyMb. There was no significant difference between the red pigment and sodium nitrite samples, which both maintained, to a large extent, their original color.
Regarding the lipid oxidation of the Frankfurt-type pork sausages, the control sample (without additives) showed a higher rate of secondary lipid oxidation product formation compared to the other two samples (Figure 5b). This higher rate was also visually verified by the discoloration of the sample as early as on the first day of storage. This observation coincided and agreed with the steep decrease of %oxyMb content as mentioned earlier (Figure 5a). The red pigment and the sodium nitrite retarded the lipid oxidation in samples to a similar degree and were both significantly less oxidized compared to the control from the third day until the end of the storage period (p < 0.05).
Both nitrates and phenolic compounds are known for their antioxidant activity. The addition of nitrates to meat products slows down lipid oxidation, while polyphenols, including 5-CQA, have been shown to inhibit oxidative degradation, preserving the odor and improving the color stability in meat [49,50,51]. However, no specific studies have been conducted on the inhibitory effect of the 5-CQA-TRP product on lipid oxidation. It has to be noted, however, that the anti-oxidative activity could also be partially attributed to the residual TRP in the red pigment powder [52,53].

4. Conclusions

In this study, a substantial reduction in reaction time was achieved, from 24–72 h to just 8.5 h, by employing ultrasonication for the first time. The overall reaction order was determined to be 2, with the order of 5-CQA being equal to 2, while that of tryptophan equal being to 0. Notably, it was found that the caffeic acid component of 5-CQA plays a significant role in the formation of the red pigment. This red pigment, however, did not show significant antimicrobial properties. On the other hand, it demonstrated antioxidant properties similar to sodium nitrite and was able to stabilize the color of the samples. Most importantly, the red pigment displayed remarkable thermal stability, which is a crucial factor in expanding its potential applications within the food industry.

Supplementary Materials

The following supporting information can be downloaded at: https://www.mdpi.com/article/10.3390/separations11020060/s1, Table S1. Gradient for 5-CQA determination; Figure S1: Comparative chromatogram of TRP at different concentrations; Figure S2: 5-CQA chromatogram; Table S2: Initial rate method results; Table S3: Rate constant calculation; Figure S3. Color development of different molar ratios: from left to right: 5-CQA:TRP 1mM-5mM, 1mM-3, 5mM, 3, 5-7mM, 7mM-7mM and 7mM-3, 5mM; Figure S4. Color of the product pigment at different reaction temperatures; Figure S5. Color of samples at the end of each reaction at different pH (7, 7.5, 8, and 9.5); Table S4: Color determination of final product after completion of the reaction at each different pH.; Figure S6. Spectrum of the red pigment solution at 30 min; Figure S7. Peak 376,13 m/z in the spectra of: (a) t = 15 min of the reaction of CGA-TRP, (b) final product of the reaction, (c) spray-dried powder, and (d) final reaction of caffeic acid-TRP.

Author Contributions

P.V.: Conceptualization, methodology, writing—review and editing, supervision, and project administration; K.P.: Investigation, data curation, methodology, formal analysis, visualization, and original draft preparation; I.K.: Investigation, methodology, data curation, and formal analysis; A.-M.M.: Formal analysis, writing—original draft preparation, and investigation; P.K.: Conceptualization, methodology, and data curation; V.E.: Investigation, formal analysis, and writing—original draft preparation. All authors have read and agreed to the published version of the manuscript.

Funding

This research received no external funding.

Data Availability Statement

The data are available upon request.

Conflicts of Interest

The authors declare no conflicts of interest.

References

  1. Silva, M.M.; Reboredo, F.H.; Lidon, F.C. Food Colour Additives: A Synoptical Overview on Their Chemical Properties, Applications in Food Products and Health Side Effects. Foods 2022, 11, 379. [Google Scholar] [CrossRef]
  2. Di Salvo, E.; Lo Vecchio, G.; De Pasquale, R.; De Maria, L.; Tardugno, R.; Vadalà, R.; Cicero, N. Natural Pigments Production and Their Application in Food, Health and Other Industries. Nutrients 2023, 15, 1923. [Google Scholar] [CrossRef]
  3. Shakil, M.H.; Trisha, A.T.; Rahman, M.; Talukdar, S.; Kobun, R.; Huda, N.; Zzaman, W. Nitrites in Cured Meats, Health Risk Issues, Alternatives to Nitrites: A Review. Foods 2022, 11, 3355. [Google Scholar] [CrossRef]
  4. Bouvard, V.; Loomis, D.; Guyton, K.Z.; Grosse, Y.; El Ghissassi, F.; Benbrahim-Tallaa, L.; Guha, N.; Mattock, H.; Straif, K.; Stewart, B.W.; et al. Carcinogenicity of Consumption of Red and Processed Meat. Lancet Oncol. 2015, 26, 1599–1600. [Google Scholar] [CrossRef]
  5. Kumar, G.; Upadhyay, S.; Yadav, D.K.; Malakar, S.; Dhurve, P.; Suri, S. Application of Ultrasound Technology for Extraction of Color Pigments from Plant Sources and Their Potential Bio-Functional Properties: A Review. J. Food Process. Eng. 2023, 46, e14238. [Google Scholar] [CrossRef]
  6. Meléndez-Martínez, A.J.; Mandić, A.I.; Bantis, F.; Böhm, V.; Borge, G.I.A.; Brnčić, M.; Bysted, A.; Cano, M.P.; Dias, M.G.; Elgersma, A.; et al. A Comprehensive Review on Carotenoids in Foods and Feeds: Status Quo, Applications, Patents, and Research Needs. Crit. Rev. Food Sci. Nutr. 2021, 62, 1999–2049. [Google Scholar] [CrossRef]
  7. Zang, Z.; Tang, S.; Li, Z.; Chou, S.; Shu, C.; Chen, Y.; Chen, W.; Yang, S.; Yang, Y.; Tian, J.; et al. An Updated Review on the Stability of Anthocyanins Regarding the Interaction with Food Proteins and Polysaccharides. Compr. Rev. Food Sci. Food Saf. 2022, 21, 4378–4401. [Google Scholar] [CrossRef]
  8. Calva-Estrada, S.J.; Jiménez-Fernández, M.; Lugo-Cervantes, E. Betalains and Their Applications in Food: The Current State of Processing, Stability and Future Opportunities in the Industry. Food Chem. Mol. Sci. 2022, 4, 100089. [Google Scholar] [CrossRef] [PubMed]
  9. Neelwarne, B.; Halagur, S.B. Red Beet: An Overview. Red Beet Biotechnology: Food and Pharmaceutical Applications; Springer: Berlin/Heidelberg, Germany, 2012; pp. 1–43. [Google Scholar] [CrossRef]
  10. Chhikara, N.; Kushwaha, K.; Sharma, P.; Gat, Y.; Panghal, A. Bioactive Compounds of Beetroot and Utilization in Food Processing Industry: A Critical Review. Food Chem. 2019, 272, 192–200. [Google Scholar] [CrossRef] [PubMed]
  11. Jurić, S.; Jurić, M.; Król-Kilińska, Ż.; Vlahoviček-Kahlina, K.; Vinceković, M.; Dragović-Uzelac, V.; Donsì, F. Sources, Stability, Encapsulation and Application of Natural Pigments in Foods. Food Rev. Int. 2020, 38, 1735–1790. [Google Scholar] [CrossRef]
  12. Zhang, Q.; Cheng, Z.; Wang, Y.; Fu, L. Dietary Protein-Phenolic Interactions: Characterization, Biochemical-Physiological Consequences, and Potential Food Applications. Crit. Rev. Food Sci. Nutr. 2020, 61, 3589–3615. [Google Scholar] [CrossRef]
  13. Ozdal, T.; Capanoglu, E.; Altay, F. A Review on Protein-Phenolic Interactions and Associated Changes. Food Res. Int. 2013, 51, 954–970. [Google Scholar] [CrossRef]
  14. Perez-Gregorio, M.R.; Simal-Gandara, J. A Critical Review of the Characterization of Polyphenol–Protein Interactions and of Their Potential Use for Improving Food Quality. Curr. Pharm. Des. 2017, 23, 2742–2753. [Google Scholar] [CrossRef]
  15. Wildermuth, S.R.; Young, E.E.; Were, L.M. Chlorogenic Acid Oxidation and Its Reaction with Sunflower Proteins to Form Green-Colored Complexes. Compr. Rev. Food Sci. Food Saf. 2016, 15, 829–843. [Google Scholar] [CrossRef]
  16. Prigent, S.V.E.; Voragen, A.G.J.; Visser, A.J.W.G.; Van Koningsveld, G.A.; Gruppen, H. Covalent Interactions between Proteins and Oxidation Products of Caffeoylquinic Acid (Chlorogenic Acid). J. Sci. Food Agric. 2007, 87, 2502–2510. [Google Scholar] [CrossRef]
  17. Vercruysse, K.P. Preliminary Observations on the Interactions between Chlorogenic Acid and Select Amino Acids. ChemRxiv 2019. [Google Scholar] [CrossRef]
  18. Bongartz, V.; Brandt, L.; Gehrmann, M.L.; Zimmermann, B.F.; Schulze-Kaysers, N.; Schieber, A. Evidence for the Formation of Benzacridine Derivatives in Alkaline-Treated Sunflower Meal and Model Solutions. Molecules 2016, 21, 91. [Google Scholar] [CrossRef]
  19. Gil, M.; Wianowska, D. Chlorogenic Acids—Their Properties, Occurrence and Analysis. Ann. Univ. Mariae Curie-Sklodowska Sect. AA Chem. 2017, 72, 61. [Google Scholar] [CrossRef]
  20. Bagdas, D.; Gul, Z.; Meade, J.A.; Cam, B.; Cinkilic, N.; Gurun, M.S. Pharmacologic Overview of Chlorogenic Acid and Its Metabolites in Chronic Pain and Inflammation. Curr. Neuropharmacol. 2020, 18, 216. [Google Scholar] [CrossRef]
  21. Šilarová, P.; Boulekbache-Makhlouf, L.; Pellati, F.; Česlová, L. Monitoring of Chlorogenic Acid and Antioxidant Capacity of Solanum melongena L. (Eggplant) under Different Heat and Storage Treatments. Antioxidants 2019, 8, 234. [Google Scholar] [CrossRef] [PubMed]
  22. Naveed, M.; Hejazi, V.; Abbas, M.; Kamboh, A.A.; Khan, G.J.; Shumzaid, M.; Ahmad, F.; Babazadeh, D.; FangFang, X.; Modarresi-Ghazani, F.; et al. Chlorogenic Acid (CGA): A Pharmacological Review and Call for Further Research. Biomed. Pharmacother. 2018, 97, 67–74. [Google Scholar] [CrossRef] [PubMed]
  23. Tajik, N.; Tajik, M.; Mack, I.; Enck, P. The Potential Effects of Chlorogenic Acid, the Main Phenolic Components in Coffee, on Health: A Comprehensive Review of the Literature. Eur. J. Nutr. 2017, 56, 2215–2244. [Google Scholar] [CrossRef] [PubMed]
  24. Iacomino, M.; Weber, F.; Gleichenhagen, M.; Pistorio, V.; Panzella, L.; Pizzo, E.; Schieber, A.; D’Ischia, M.; Napolitano, A. Stable Benzacridine Pigments by Oxidative Coupling of Chlorogenic Acid with Amino Acids and Proteins: Toward Natural Product-Based Green Food Coloring. J. Agric. Food Chem. 2017, 65, 6519–6528. [Google Scholar] [CrossRef] [PubMed]
  25. Santarcangelo, A.; Weber, F.; Kehraus, S.; Dickschat, J.S.; Schieber, A. Generation and Structure Elucidation of a Red Colorant Formed by Oxidative Coupling of Chlorogenic Acid and Tryptophan. Food Chem. 2023, 425, 136473. [Google Scholar] [CrossRef]
  26. Moccia, F.; Martín, M.Á.; Ramos, S.; Goya, L.; Marzorati, S.; DellaGreca, M.; Panzella, L.; Napolitano, A. A New Cyanine from Oxidative Coupling of Chlorogenic Acid with Tryptophan: Assessment of the Potential as Red Dye for Food Coloring. Food Chem. 2021, 348, 129152. [Google Scholar] [CrossRef]
  27. Wang, G.F.; Shi, L.P.; Ren, Y.D.; Liu, Q.F.; Liu, H.F.; Zhang, R.J.; Li, Z.; Zhu, F.H.; He, P.L.; Tang, W.; et al. Anti-Hepatitis B Virus Activity of Chlorogenic Acid, Quinic Acid and Caffeic Acid in Vivo and in Vitro. Antiviral. Res. 2009, 83, 186–190. [Google Scholar] [CrossRef]
  28. Meisel, J.; Patel, M.; Negin, S.; Gokel, M.; Cantwell, R.; Gokel, G. Tryptophan in Membrane-Active Synthetic Antimicrobials. J. Explor. Res. Pharmacol. 2017, 2, 7–15. [Google Scholar] [CrossRef]
  29. Xue, F.; Li, C.; Adhikari, B. Physicochemical Properties of Soy Protein Isolates-Cyanidin-3-Galactoside Conjugates Produced Using Free Radicals Induced by Ultrasound. Ultrason. Sonochem. 2020, 64, 104990. [Google Scholar] [CrossRef]
  30. Majid, I.; Nayik, G.A.; Nanda, V. Ultrasonication and Food Technology: A Review. Cogent Food Agric. 2015, 1, 1071022. [Google Scholar] [CrossRef]
  31. Gogate, P.R.; Tayal, R.K.; Pandit, A.B. Cavitation: A Technology on the Horizon. Curr. Sci. 2006, 91, 35–46. [Google Scholar]
  32. Ancheyta, J. Chemical Reaction Kinetics: Concepts, Methods and Case Studies; John Wiley & Sons: Hoboken, NJ, USA, 2017; pp. 1–287. [Google Scholar] [CrossRef]
  33. Kaderides, K.; Mourtzinos, I.; Goula, A.M. Stability of Pomegranate Peel Polyphenols Encapsulated in Orange Juice Industry By-Product and Their Incorporation in Cookies. Food Chem. 2020, 310, 125849. [Google Scholar] [CrossRef]
  34. Chachlioutaki, K.; Karavasili, C.; Adamoudi, E.; Tsitsos, A.; Economou, V.; Beltes, C.; Bouropoulos, N.; Katsamenis, O.L.; Doherty, R.; Bakopoulou, A.; et al. Electrospun Nanofiber Films Suppress Inflammation in Vitro and Eradicate Endodontic Bacterial Infection in an E. Faecalis-Infected Ex Vivo Human Tooth Culture Model. ACS Biomater. Sci. Eng. 2022, 8, 2096–2110. [Google Scholar] [CrossRef]
  35. CLSI. Performance Standards for Antimicrobial Susceptibility Testing, 33rd ed.; Clinical and Laboratory Standards Institute: Pittsburgh, PA, USA, 2023. [Google Scholar]
  36. Herrmann, S.S.; Granby, K.; Duedahl-Olesen, L. Formation and Mitigation of N-Nitrosamines in Nitrite Preserved Cooked Sausages. Food Chem. 2015, 174, 516–526. [Google Scholar] [CrossRef]
  37. Floros, S.; Toskas, A.; Pasidi, E.; Vareltzis, P. Bioaccessibility and Oxidative Stability of Omega-3 Fatty Acids in Supplements, Sardines and Enriched Eggs Studied Using a Static In Vitro Gastrointestinal Model. Molecules 2022, 27, 415. [Google Scholar] [CrossRef]
  38. Ribeiro, J.S.; Silva, L.K.R.; da Silva, M.V. Natural Antioxidants Used in Meat Products. In Plant Antioxidants Health; Springer: Berlin/Heidelberg, Germany, 2021; pp. 1–29. [Google Scholar] [CrossRef]
  39. Yu, Q.P.; Feng, D.Y.; Xiao, J.; Wu, F.; He, X.J.; Xia, M.H.; Dong, T.; Liu, Y.H.; Tan, H.Z.; Zou, S.G.; et al. Studies on Meat Color, Myoglobin Content, Enzyme Activities, and Genes Associated with Oxidative Potential of Pigs Slaughtered at Different Growth Stages. Asian-Australas. J. Anim. Sci. 2017, 30, 1739. [Google Scholar] [CrossRef]
  40. Tang, S.; Kerry, J.P.; Shehan, D.; Bucklry, J.D.; Morrissey, P.A. Antioxidant Effect of Added Tea Catechin on Susceptibility of Cooked Red Meat, Poultry and Fish Parties to Lipid Oxidation. Food Res. Int. 2001, 34, 651–657. [Google Scholar] [CrossRef]
  41. Paniwnyk, L. Applications of Ultrasound in Processing of Liquid Foods: A Review. Ultrason. Sonochem. 2017, 38, 794–806. [Google Scholar] [CrossRef] [PubMed]
  42. Weber, F.; Engelke, G.H.; Schieber, A. Structure Elucidation and Tentative Formation Pathway of a Red Colored Enzymatic Oxidation Product of Caffeic Acid. Food Chem. 2019, 297, 124932. [Google Scholar] [CrossRef]
  43. Kono, Y.; Kobayashi, K.; Tagawa, S.; Adachi, K.; Ueda, A.; Sawa, Y.; Shibata, H. Antioxidant Activity of Polyphenolics in Diets: Rate Constants of Reactions of Chlorogenic Acid and Caffeic Acid with Reactive Species of Oxygen and Nitrogen. Biochim. Biophys. Acta (BBA) Gen. Subj. 1997, 1335, 335–342. [Google Scholar] [CrossRef]
  44. Cuq, J.C.; Cheftel, J.C. Tryptophan Degradation during Heat Treatments: Part 1—The Degradation of Free Tryptophan. Food Chem. 1983, 12, 1–14. [Google Scholar] [CrossRef]
  45. Dawidowicz, A.L.; Typek, R. The Influence of PH on the Thermal Stability of 5-O-Caffeoylquinic Acids in Aqueous Solutions. Eur. Food Res. Technol. 2011, 233, 223–232. [Google Scholar] [CrossRef]
  46. Rawel, H.M.; Czajka, D.; Rohn, S.; Kroll, J. Interactions of Different Phenolic Acids and Flavonoids with Soy Proteins. Int. J. Biol. Macromol. 2002, 30, 137–150. [Google Scholar] [CrossRef]
  47. Li, M.; Ritzoulis, C.; Du, Q.; Liu, Y.; Ding, Y.; Liu, W.; Liu, J. Recent Progress on Protein-Polyphenol Complexes: Effect on Stability and Nutrients Delivery of Oil-in-Water Emulsion System. Front. Nutr. 2021, 8, 765589. [Google Scholar] [CrossRef]
  48. Quan, T.H.; Benjakul, S.; Sae-leaw, T.; Balange, A.K.; Maqsood, S. Protein–Polyphenol Conjugates: Antioxidant Property, Functionalities and Their Applications. Trends Food Sci. Technol. 2019, 91, 507–517. [Google Scholar] [CrossRef]
  49. Karwowska, M.; Kononiuk, A.; Wójciak, K.M. Impact of Sodium Nitrite Reduction on Lipid Oxidation and Antioxidant Properties of Cooked Meat Products. Antioxidants 2020, 9, 9. [Google Scholar] [CrossRef]
  50. Herrera-Balandrano, D.D.; Beta, T.; Cai, Z.; Zhang, X.; Li, Y.; Huang, W. Effect of in Vitro Gastro-Intestinal Digestion on the Phenolic Composition and Antioxidant Capacity of Burdock Roots at Different Harvest Time. Food Chem. 2021, 358, 129897. [Google Scholar] [CrossRef] [PubMed]
  51. Ahangarpour, A.; Sayahi, M.; Sayahi, M. The Antidiabetic and Antioxidant Properties of Some Phenolic Phytochemicals: A Review Study. Diabetes Metab. Syndr. Clin. Res. Rev. 2019, 13, 854–857. [Google Scholar] [CrossRef] [PubMed]
  52. Matsui, R.; Honda, R.; Kanome, M.; Hagiwara, A.; Matsuda, Y.; Togitani, T.; Ikemoto, N.; Terashima, M. Designing Antioxidant Peptides Based on the Antioxidant Properties of the Amino Acid Side-Chains. Food Chem. 2018, 245, 750–755. [Google Scholar] [CrossRef] [PubMed]
  53. Nayak, B.N.; Buttar, H.S. Evaluation of the Antioxidant Properties of Tryptophan and Its Metabolites in in Vitro Assay. J. Complement. Integr. Med. 2016, 13, 129–136. [Google Scholar] [CrossRef]
Scheme 1. (a) Quinic acid and caffeic acid moieties of chlorogenic acid [27], (b) tryptophan and indole moiety [28], and (c) proposed basic reaction scheme of chlorogenic acid with tryptophan.
Separations 11 00060 sch001
Figure 1. (a) HPLC analysis of the reaction mixture at different times: 0 min (purple), 70 min (green), and 390 min (black); (b) red color development and 5-CQA consumption during the reaction; (c) redness (a*) evolution during the reaction of caffeic acid with TRP and 5-CQA with TRP; and (d) caffeic acid and 5-CQA concentrations during the reaction with TRP.
Separations 11 00060 g001
Figure 2. Calculation of rate constant for (a) first-order kinetics and (b) second-order kinetics.
Separations 11 00060 g002
Figure 3. Plot of red pigment formation rate versus reaction time for different (a) TRP concentrations and (b) 5-CQA concentrations (M.O. ± SD, n = 3, temperature 40 °C).
Separations 11 00060 g003
Figure 4. Average rate of product formation for the first 9 h of the reaction as a function of pH (avg. ± SD, n = 3, 40 °C).
Separations 11 00060 g004
Figure 5. Lipid oxidation and color stability of cooked pork sausages with nitrites or red pigment followed by (a) %oxyMb and (b) TBARS (μmol MDA/kg of tissue).
Separations 11 00060 g005
Table 1. Colorimetric results of samples for different ratios of reactants (avg, n = 9).
5-CGA (mM)TRP (mM)L*a*b*ΔΕ
1722.6346.09 a30.44-
73.53.000.51 b2.8056.87 a
3.5710.9327.09 c16.0326.80 b
1536.6854.78 d50.8126.10 b
13.545.4935.24 e29.0725,21 b
773.180.31 b0.0558.43 a
11454.1757.63 d30.8131.29 b
Values with different superscript letters (a–e) are significant different (p < 0.05).
Table 2. Recovery yields of the red pigment.
Isolation MethodYield%
Acidification + 10 min centrifugation9.1 ± 0.1
Acidification + 20 min centrifugation11.1 ± 0.2
Acidification + 45 min centrifugation15.2 ± 0.1
Spray drying62.1 ± 1.1
Table 3. Results of the sample’s color change in different thermal processes and pH.
pH3479
Thermal processColour difference (ΔΕ)
Ultrasounds1.502.683.203.06
Microwave5.545.886.547.37
Water bath3.375.032.273.95
Freezing3.634.424.935.03
Disclaimer/Publisher’s Note: The statements, opinions and data contained in all publications are solely those of the individual author(s) and contributor(s) and not of MDPI and/or the editor(s). MDPI and/or the editor(s) disclaim responsibility for any injury to people or property resulting from any ideas, methods, instructions or products referred to in the content.

