Article

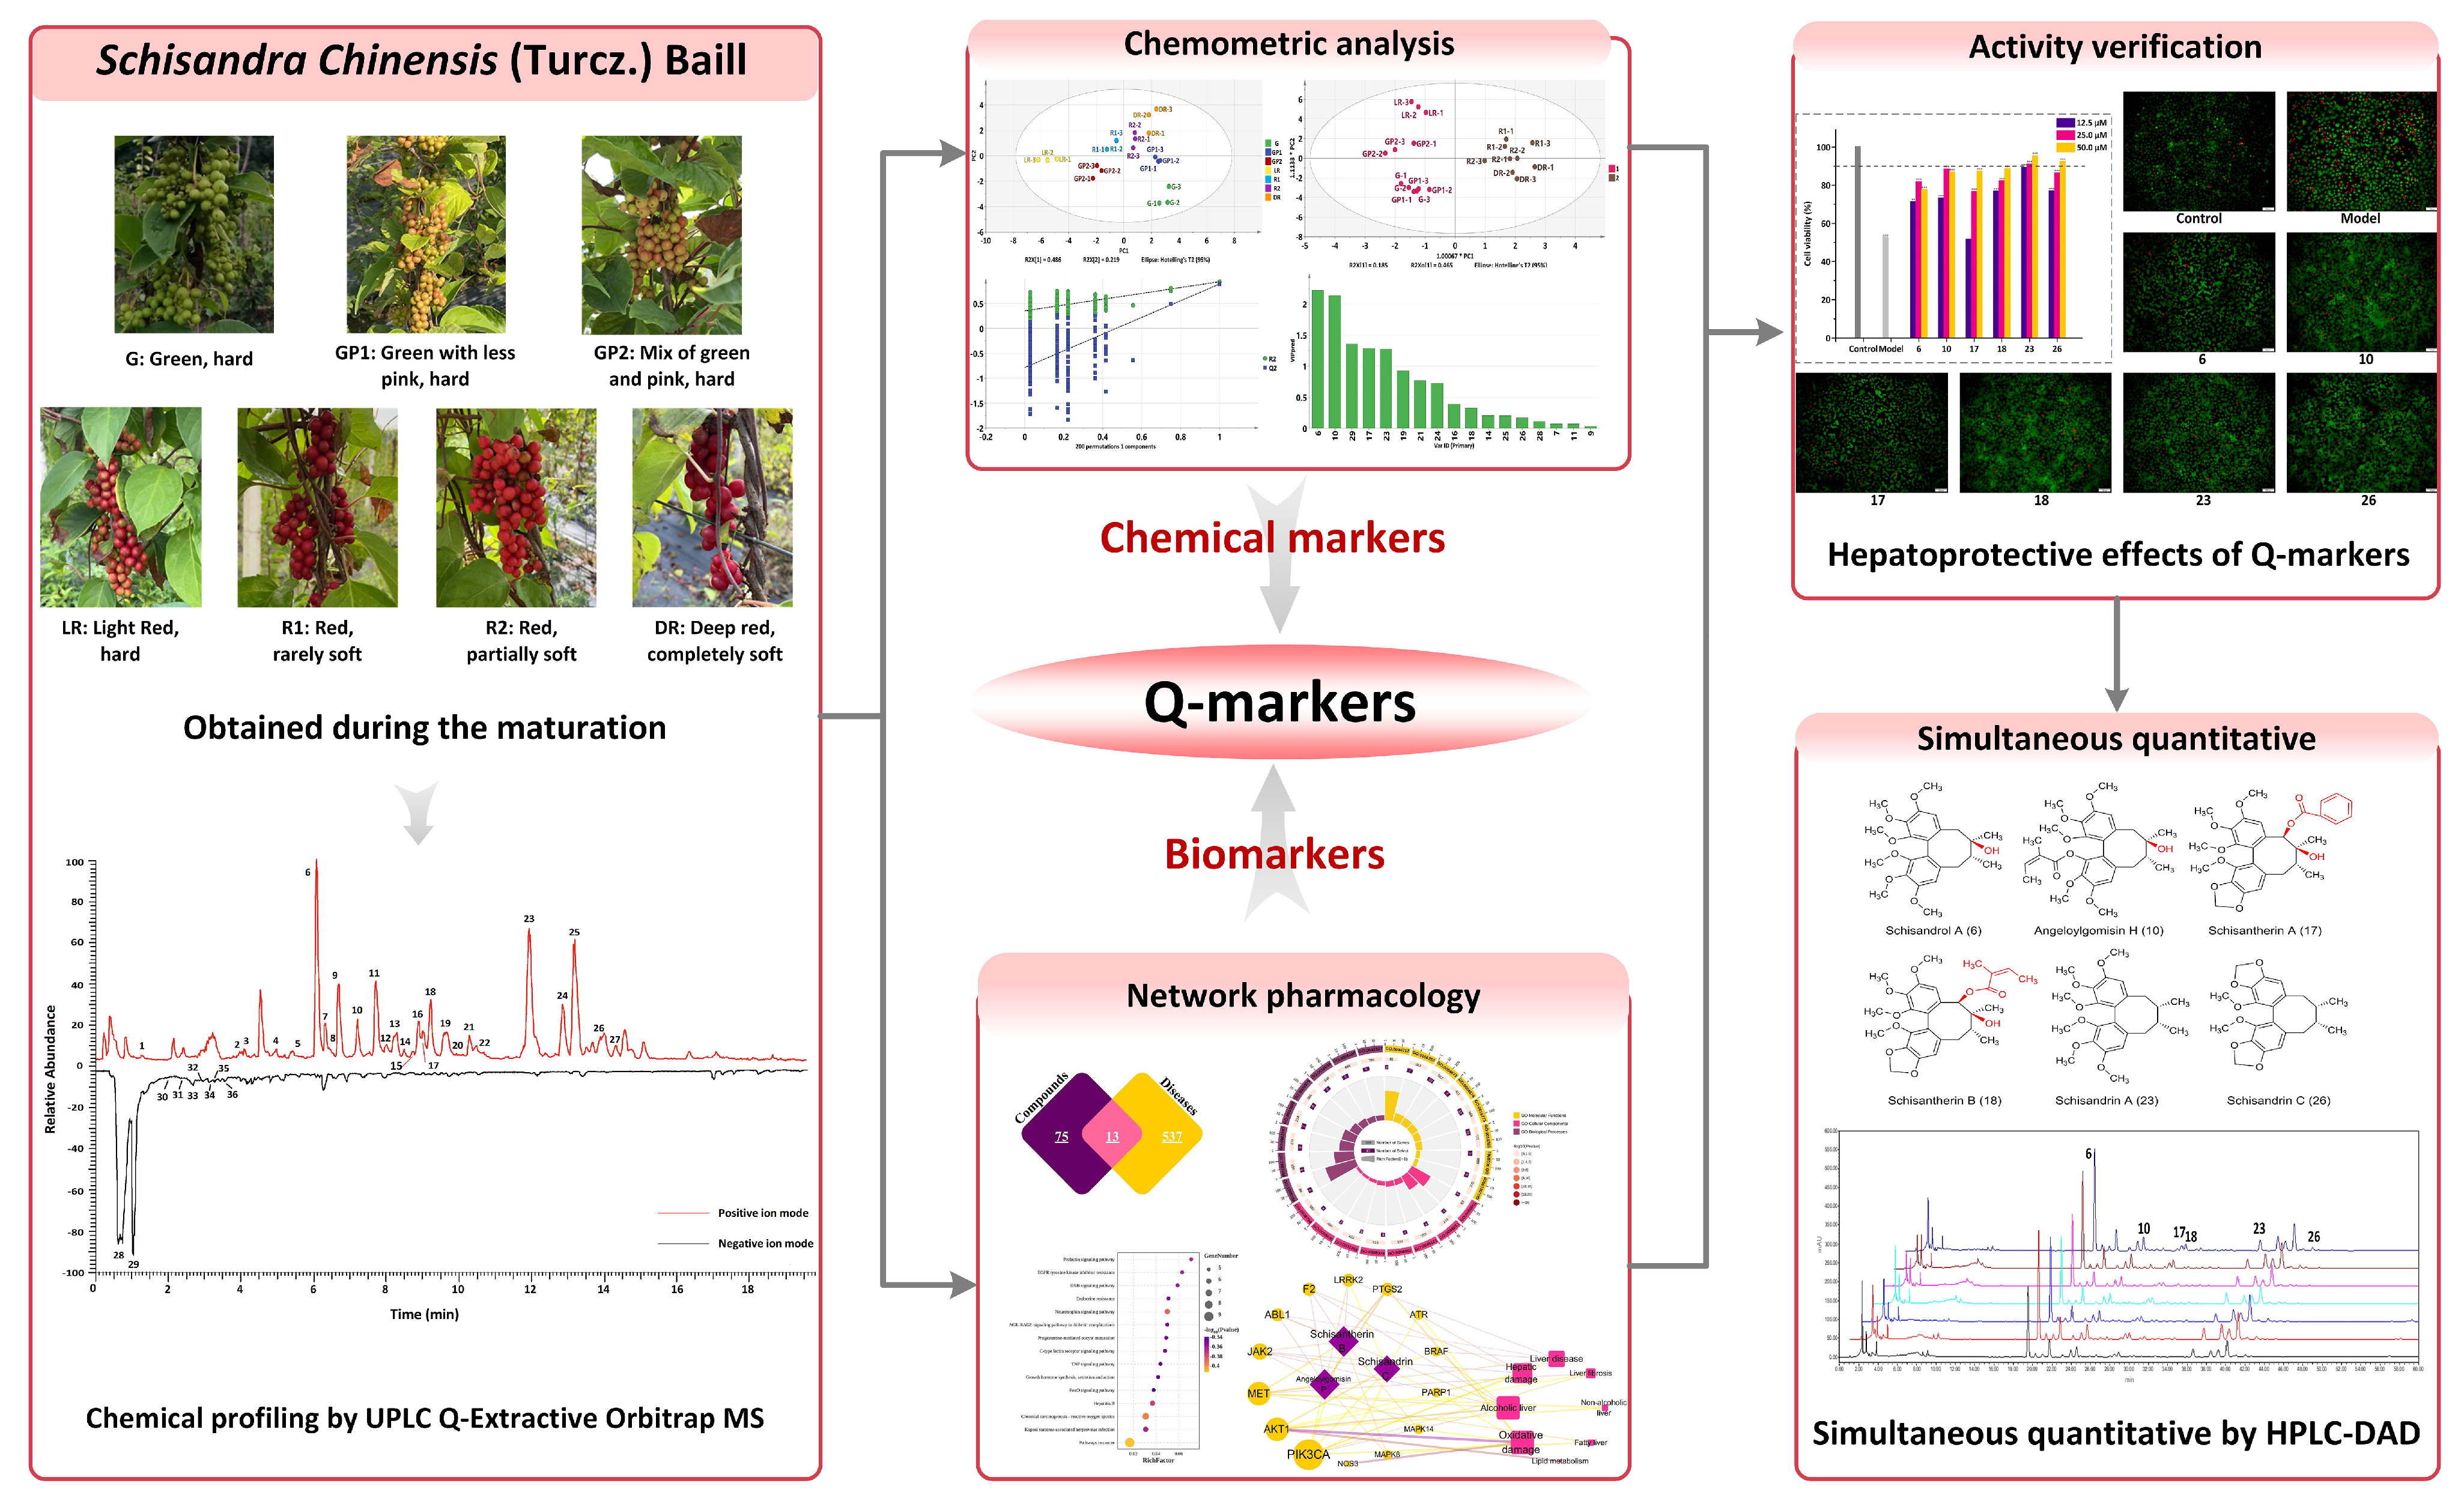
Identification of Quality Markers in Schisandra chinensis (Turcz.) Baill. Using UPLC-Q-Extractive Orbitrap/MS, Chemometric Analysis, and Network Pharmacology

1
School of Food Science and Technology, Dalian Polytechnic University, Dalian 116034, China
2
Department of Clinical Pharmacy and Traditional Chinese Medicine Pharmacology, School of Pharmaceutical Sciences, Changchun University of Chinese Medicine, Changchun 130117, China
*
Author to whom correspondence should be addressed.
Separations 2024, 11(3), 88; https://doi.org/10.3390/separations11030088
Submission received: 17 February 2024 / Revised: 7 March 2024 / Accepted: 14 March 2024 / Published: 18 March 2024
(This article belongs to the Section Analysis of Natural Products and Pharmaceuticals)

Abstract

:
Chemical composition is a critical factor for determining the efficacy of any traditional Chinese medicine (TCM) and can be used as an indicator of commercial quality. To develop a new strategy for discovering potential quality markers (Q-markers) of TCM by integrating ultra-performance liquid chromatography-Q-extractive orbitrap/mass spectrometry (UPLC-Q-Extractive Orbitrap/MS), chemometric analysis, and network pharmacology, using Schisandra chinensis (Turcz.) Baill. (S. chinensis) as an example. The chemical profiling of S. chinensis was performed using UPLC-Q-Extractive Orbitrap/MS, followed by identification of hepatoprotective Q-markers through a comprehensive understanding of chemometric analysis and virtual target prediction of network pharmacology. Six compounds were considered potent candidates for Q-markers, which were identified as schisandrol A (6), angeloylgomisin H (10), schisantherin A (17), schisantherin B (18), schisandrin A (23), and schisandrin C (26). All Q-markers exhibited significant hepatoprotective activity, as evidenced by in vitro experiments. Subsequently, a method for simultaneous quantification was established and employed to analyse seven batches of S. chinensis. Therefore, the integrated approach of UPLC-Q-Extractive Orbitrap/MS, chemometrics, and network pharmacology proved to be an effective strategy for the discovery of Q-markers that can assist in assessing the overall chemical consistency of samples and provide a basis for quality evaluation of the material basis of S. chinensis.

1. Introduction

Schisandra chinensis (Turcz.) Baill. (S. chinensis) is a member of the Schisandraceae family. Its fruits are typically harvested in autumn and have been wildly used in traditional Chinese medicine (TCM) for the treatment of liver and neurological disorders, as well as for immune regulation [1,2,3]. S. chinensis is mainly distributed in northeastern China, including Liaoning, Heilongjiang, Jilin, and Inner Mongolia, and is cultivated in Russia, Japan, and Korea [4,5]. Modern phytochemical and pharmacological studies have revealed that S. chinensis is abundant in lignans with diverse therapeutic properties, such as anti-oxidative, anti-inflammatory, and anti-fibrotic activities [4,6,7]. According to the Chinese Pharmacopoeia (2020), schisandrol A has been defined as a quantitative component of S. chinensis [8]. However, TCM is a natural “combinatorial chemical sample library”, and relying on one or two detection indicators may not adequately reflect the complexity of the chemical profiles [9,10]. The issue of adulteration with non-medicinal ingredients remains a severe concern in ensuring the current quality of TCM [11]. Moreover, biosynthetic processes occur throughout plant growth, and the different stages of the life cycle affect the composition and content of any active constituent [12,13,14]. Therefore, it became imperative to devise a more comprehensive strategy to access the holistic chemical features of samples collected across various batches.
To date, a variety of analytical methods have been developed for determining the components of S. chinensis, including high-performance liquid chromatography (HPLC), ultra-high-performance liquid chromatography-mass spectrometry (UPLC-MS), gas chromatography-mass spectrometry, and supercritical fluid chromatography [13,15,16,17]. However, conventional analytical strategies merely provide information on components and fail to objectively express the correlation between efficacy and quality [4,18]. Furthermore, the limited research on the material basis of S. chinensis efficacy has led to a weak correlation between quality control markers and clinical effectiveness. Therefore, it is imperative to develop a method to identify the markers of S. chinensis and find a correlation between its chemical features and efficacy.
The concept of quality markers (Q-markers) has been proposed to improve the quality control of TCM. In contrast to conventional markers, Q-markers are chemical substances intricately linked to the functional properties of raw materials and plant-derived products, including effectiveness, specificity, and measurability, which reflect not only the correlation of components and efficacy but also the difference and specificity of ingredients in TCM [19]. The targeted selection of Q-markers, the main factors influencing material quality, is crucial for any qualitative and quantitative analysis. Chemometric analyses based on chromatographic and spectroscopic data may employ various statistical methods to screen candidate Q-markers and have proven effective in assessing the authenticity of natural products and commercial herbal medicines [20,21]. Additionally, network pharmacology is increasingly utilised to reveal the mechanisms of action between active compounds and disease treatment targets [22,23]. Therefore, this study was aimed at evaluating the overall chemical consistency of S. chinensis and identifying potential Q-markers through a combination of ultra-performance liquid chromatography-Q-extractive orbitrap/mass spectrometry (UPLC-Q-Extractive Orbitrap/MS), chemometric analysis, and network pharmacology studies (Figure 1).

2. Materials and Methods

2.1. Chemicals, Reagents, and Materials

S. chinensis, identified by Prof. Jingbo Zhu (Dalian Polytechnic University, Dalian, China) using the Chinese Pharmacopoeia (2020) [8], was collected from Baoshan Town (Liaoning Province, China), located at latitudes between 40.37° N and 123.87° E. Certified specimens of S. chinensis were deposited in the herbarium of the Institute of Plant Resources and Chemical Applications, Dalian Polytechnic University, and numbered as listed in Table S1. Seven batches were harvested from 21 July to 26 September 2021, with collections made every 10 days. After harvesting, the fruits of S. chinensis were freeze-dried, crushed into powder, and stored at −40 °C. Three independent biological replicates were analysed at each time point for various indices.
Schisandrin A was procured from the National Institutes for Food and Drug Control (Beijing, China). Schisandrol A, angeloylgomisin H, schisantherin A, schisantherin B, schisandrin C, and citric acid were purchased from Push Biotechnology (Chengdu, China). The purity of all analytes was >98%. Ultrapure water was processed using a Milli-Q system (Bedford, MA, USA). HPLC-grade acetonitrile and methanol were purchased from Concord (Tianjin, China). All other chemicals were of analytical reagent grade and were provided by Kermel (Tianjin, China). The BRA-3L cell line was purchased from iCell Bioscience (Shanghai, China). Fetal bovine serum (FBS), phosphate-buffered saline (PBS), and minimum essential medium (MEM) were purchased from SolarBio (Beijing, China). Cell counting kit-8 (CCK-8), calcein-AM, propidium iodide (PI), 4′,6-diamidino-2′-phenylindole (DAPI), and tetramethylrhodamine (TRITC)-phalloidin were obtained from Yeasen (Shanghai, China).

2.2. Analysis of UPLC-Q-Extractive Orbitrap/MS

2.2.1. Sample Preparation

For sample preparation, 30 mg of S. chinensis powder was mixed with 1 mL methanol and vortexed for 1 min. The mixture was extracted using ultrasonication for 30 min. After centrifugation at 13,000 rpm for 5 min at 4 °C, 2 μL of the supernatant was injected into the UPLC-Q-Extractive Orbitrap/MS (Thermo Fisher Scientific, Waltham, MA, USA). An equal amount of solution from each sample was combined to create a quality control (QC) sample.

2.2.2. Data Acquisition

UPLC Q-Extractive Orbitrap MS analysis was conducted using the Ultimate 3000 ultra-performance liquid chromatography (UPLC) system coupled with a Q Extractive™ Orbitrap mass spectrometer equipped with an electrospray ionisation source interface. Separation of the samples occurred on a HSS T3 column (100 × 2.1 mm, 1.8 μm, Waters, Milford, MA, USA) maintained at 35 °C and an injection volume of 2 μL. The mobile phase consisted of acetonitrile with 0.1% formic acid (solvent A) and pure water with 0.1% formic acid (solvent B) at a 0.3 mL/min flow rate. The gradient elution profile was as follows: initial, 10% A; 0–3 min, 10–55% A; 3–15 min, 55–80% A; 15–16 min, 80–95% A; and 16–20 min, 95% A. The mass spectrometer operated in both positive and negative modes, and the acquisition range was m/z 100–1500. The sheath gas flow rate was set to 40 arb. Capillary and auxiliary gas heater temperatures were 300 and 350 °C, respectively. The scan mode was full MS/dd-MS2 with resolutions of 70,000 and 17,500 FWHM. The spray voltages were set to 3.8 (positive ion mode) and 3.2 kV (negative ion mode), and the S-lens RF level was set to 50 V. The measured masses were within 5 ppm of the theoretical values. Data acquisition and processing were performed using Xcalibur version 4.1 (Thermo Fisher Scientific, Waltham, MA, USA).

2.2.3. Data Analysis

All samples were analysed in triplicate, and the UPLC-Q-Extractive Orbitrap/MS data were processed with SIMCA 14.1 (Umetrics, Umeå, Sweden) with principal component analysis (PCA) and orthogonal partial least squares-discriminant analysis (OPLS-DA). PCA was performed to estimate the preliminary correlations of the data matrices. Subsequently, differences in the compounds present in S. chinensis at different time points were identified using OPLS-DA based on the value of variable importance in the projection (VIP) in the test mode.

2.3. Network Pharmacology

Given the costs, length, and complexity of pharmacophore discovery, it is critical to recognise the bioavailability of the ingredients and their potential to be drugs. While bioavailability is highly multifactorial, it is primarily determined by gastrointestinal (GI) absorption [24]. In the present study, using the SwissADME database (http://www.swissadme.ch/; accessed on 1 April 2023), gastrointestinal absorption parameters for the compounds from S. chinensis were predicted [25]. Furthermore, oral bioavailability (OB) determines the speed at which a drug becomes available to the body and the eventually absorbed extent of the oral dose. Drug-likeness (DL) is also a valuable parameter in drug discovery to evaluate whether or not a compound functions as a drug. Therefore, two predictive methods, the OBioavail 1.1 system (predicted oral bioavailability) and the Tanimoto coefficient (computed drug-likeness properties), were used to screen for potential active components in S. chinensis [26].
For target network analysis, the targets were searched for on the target prediction platform TCMSP (https://old.tcmsp-e.com/tcmsp.php; accessed on 9 April 2023) and the SwissTargetPrediction (http:// www.swisstargetprediction.ch/; accessed on 9 April 2023) databases [27,28]. The disease-related targets were explored in the Therapeutic Target Database (TTD; http://db.idrblab.net/ttd/; accessed on 10 April 2023) and Genecards Database (https://www.genecards.org/; accessed on 10 April 2023) [29,30]. The repeat targets in the two sets of target information were compared and removed using Venn diagrams (http://jvenn.toulouse. inra.fr/; accessed on 16 April 2023) [31]. Intersection targets were selected as targets of S. chinensis for preventing and treating liver injury. To facilitate biological interpretation, Gene Ontology (GO) and Kyoto Encyclopedia of Genes and Genomes (KEGG) signaling pathway enrichment analyses were performed using Metascape (http://metascape.org; accessed on 22 April 2023) [32]. As networks provide a global view of the relationships between nodes, a compound–target–disease (C-T-D) network of S. chinensis was generated to describe the active mechanism using Cytoscape 3.7.1 [33].

2.4. Molecular Docking

The top targets and compounds in the C-T-D network served as receptors and ligands, respectively. Dimethyl dicarboxylate biphenyl (DDB) was used as a positive control for ligands, which was a hepatoprotector and has been clinically found to be effective in improving liver function [34,35]. The crystal structure of the targets was downloaded from the PDB protein database (https://www.rcsb.org/; accessed on 30 December 2023), and molecular docking between the ligand and the receptor was performed using AutoDock vian 1.1.2 (Scripps Research, La Jolla, CA, USA) [36]. The possibility and stability of docking were assessed based on the space site and binding ability following the standard operations of dehydrogenation and water addition of the compound.

2.5. Impact of Predicted Compounds on Hepatoprotective Activity

The rat liver BRL-3A cell line was chosen as a model to measure the hepatoprotective effect. BRL-3A cells were cultured in MEM supplemented with 10% FBS and 1% penicillin–streptomycin solution at 37 °C under a humidified atmosphere of 5% CO2. The CCK-8 assay was used for the determination of cell viability. BRL-3A cells (5 × 10⁴ cells/well) were incubated for 24 h in a 40 μM CCl4 solution, and samples with different compound concentrations were added to 96-well plates and incubated for 24 h. After that, the culture medium was replaced by 100 μL of MEM and 10 μL of CCK-8 reagent, and absorbance was measured at 450 nm using a microplate reader (BIO-RAD, Hercules, CA, USA) after incubation for 1 h. Culture plates were mixed with 100 μL of the staining solution of calcein-AM/PI and incubated at 37 °C for 1 min. Under a fluorescence microscope (OLYMPUS, Tokyo, Japan), an excitation filter was used to detect live (green fluorescence) and dead (red fluorescence) cells.
The morphology of the cells after treatment with the reference standard solutions was observed through cell staining [37]. Briefly, cells were fixed with 4% paraformaldehyde, and 100 μL of TRITC-phalloidin solution was added to each well for 30 min at 37 °C in the dark. After washing the cells three times with PBS, the nuclei were stained with DAPI for 30 s and identified using fluorescence microscopy.

2.6. Quantitative Analysis of Q-Markers

Samples for quantitative analysis were prepared: 100 mg of the powder was ultrasonicated in 10 mL of methanol for 30 min. All extracts were brought to a constant volume (10 mL) and then filtered using a 0.22 μm filter for analysis with a ACChrom S6000 high-performance liquid chromatography-diode array detector (HPLC-DAD; ACChrom Tech, Beijing, China). The analysis was performed using a C18 column (250 × 4.6 mm, 5 μm, Bomex, China) at 30 °C. The mobile phase consisted of acetonitrile (solvent A) and pure water (solvent B). The following gradient programme was used: 10–50% A at 0–10 min and 50–100% A at 10–60 min. The samples (20 μL) were eluted at 1 mL/min at a detection wavelength of 250 nm. The EmpowerTM 3 software (Waters, Milford, MA, USA) was used for data collection, integration, and analysis.

3. Results

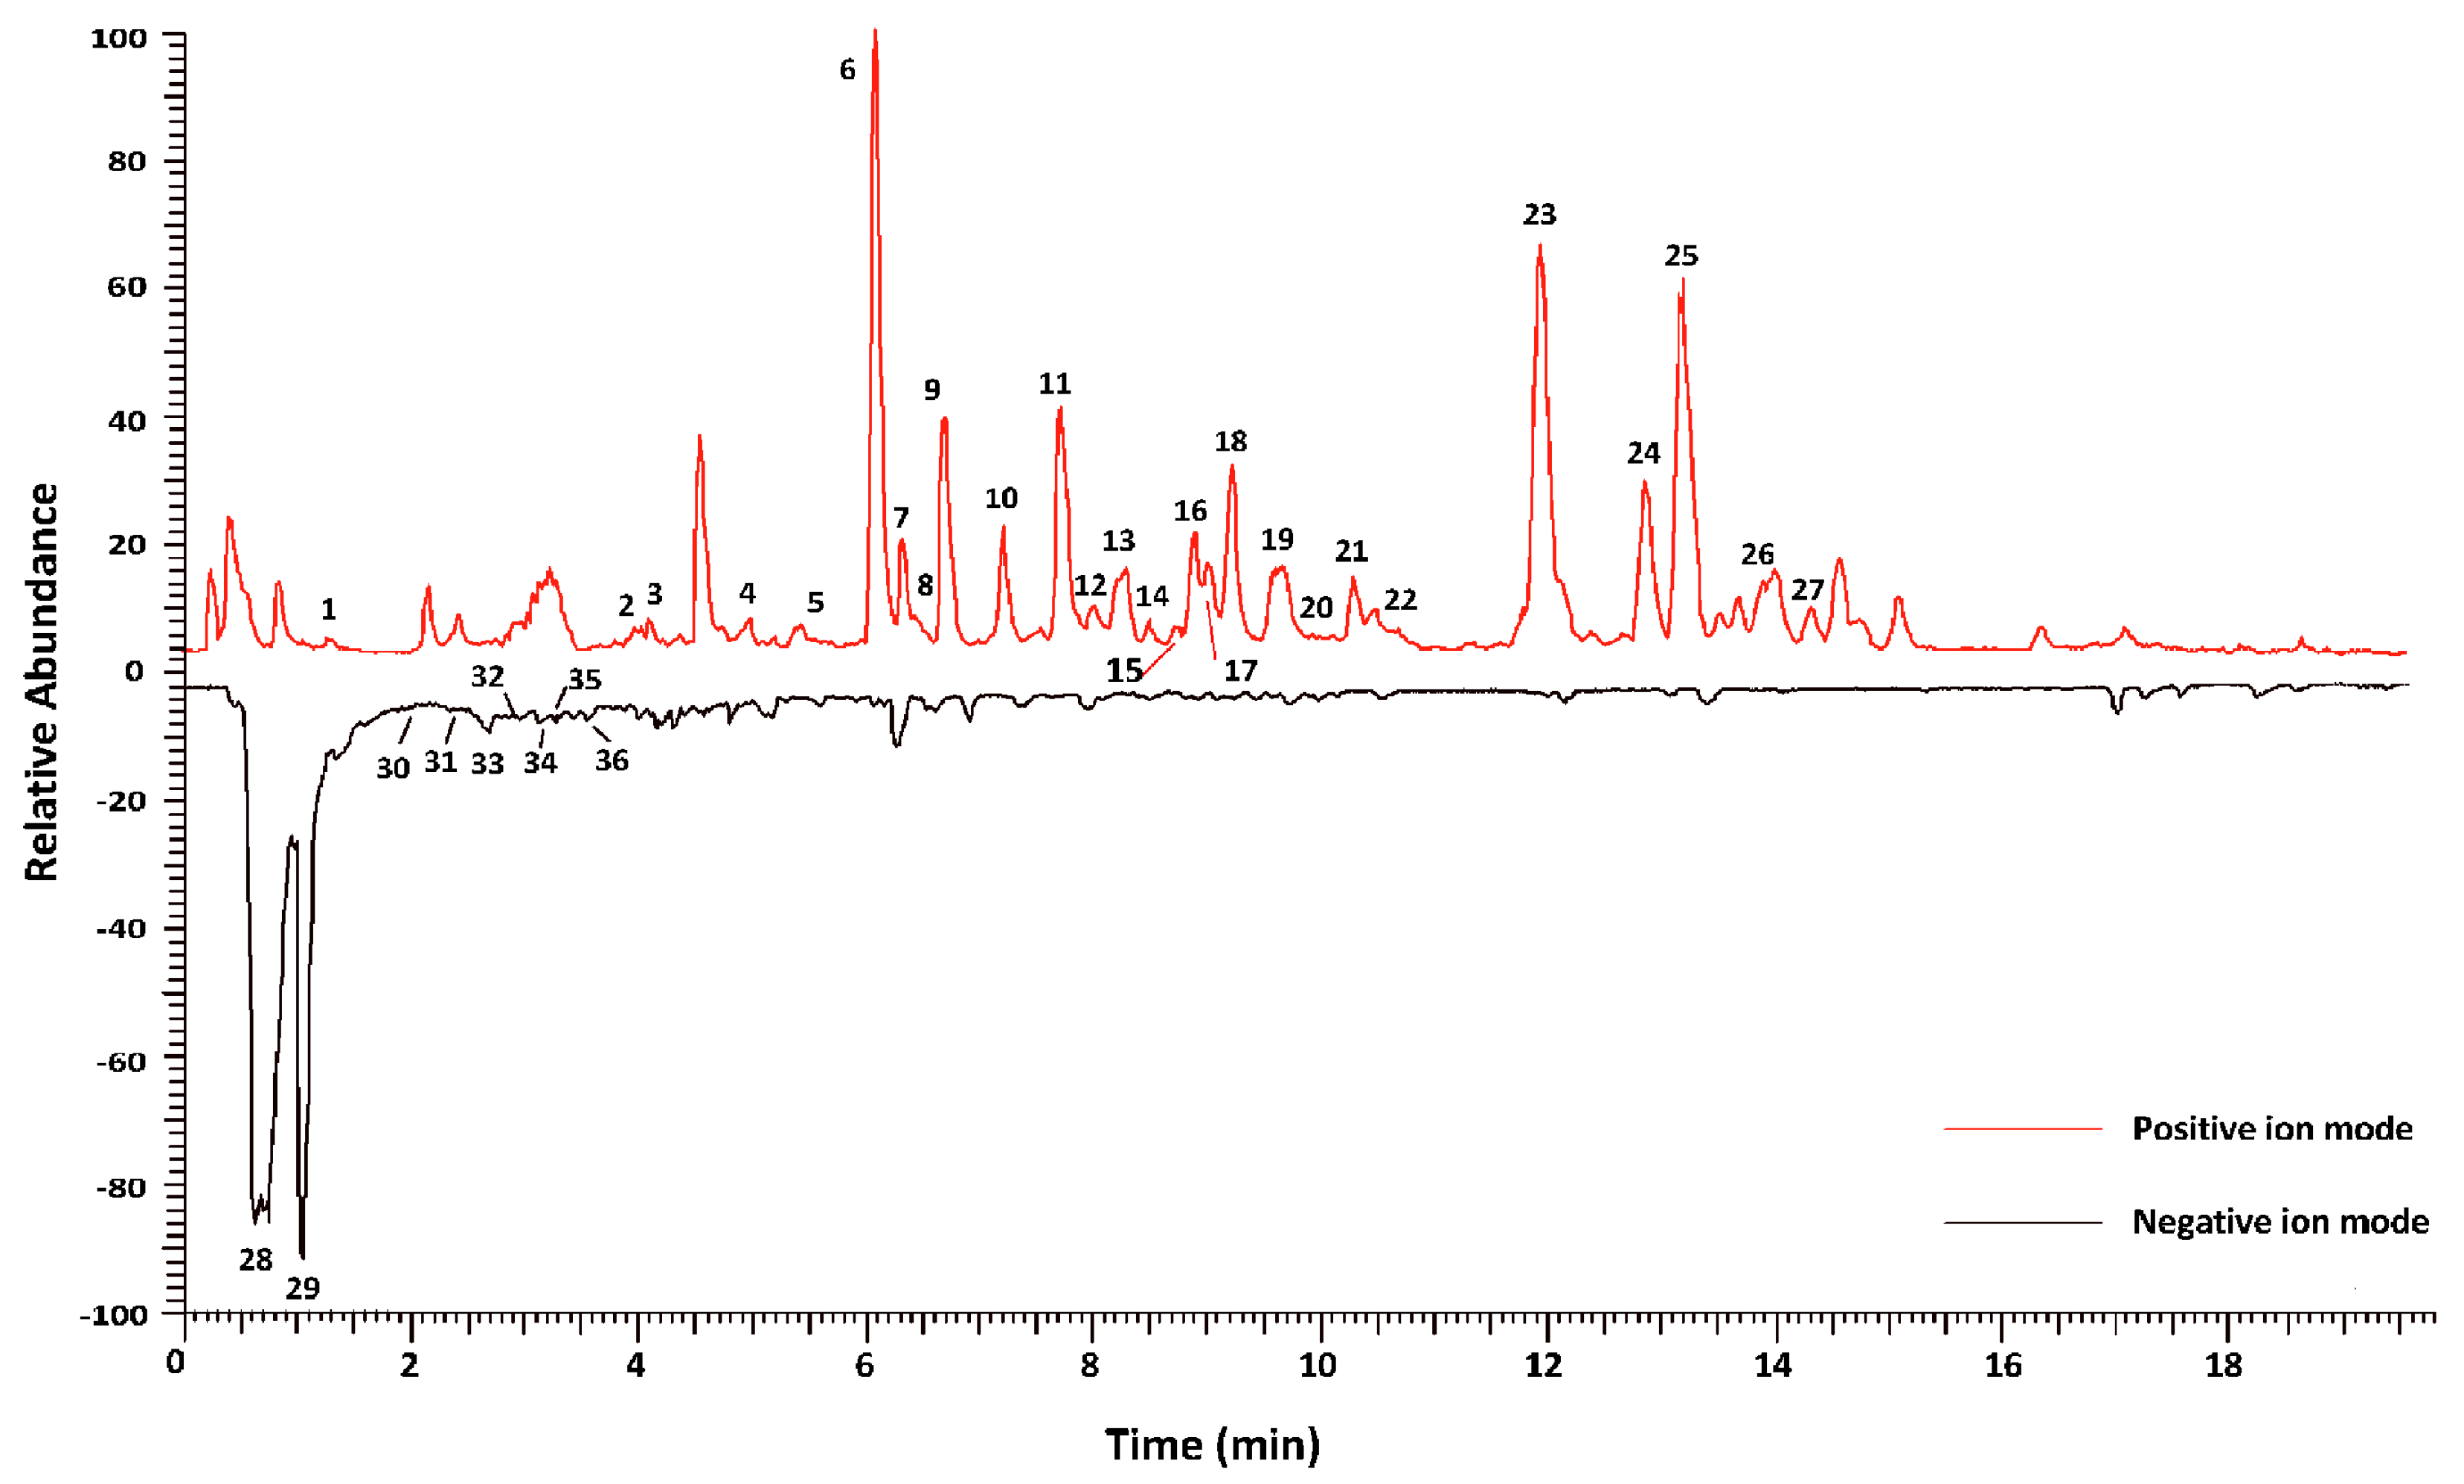
3.1. Potential Chemical Markers of S. chinensis Fruit Maturation

3.1.1. Characterization of Chemical Components in S. chinensis

The fruits of S. chinensis are formed in July and harvested from late August until after the frost, which falls at the end of September (Figure 2). However, whether the chemical composition of fruits can help distinguish those harvested at different times remains unclear. In this study, UPLC Q-Extractive Orbitrap MS combined with multivariate data analysis was used to evaluate the content of seven batches of S. chinensis obtained at different maturation stages. The total ion current (TIC) curves of different QC samples had a high overlap ratio, suggesting that the obtained results were reproducible and reliable (Figure S1). Moreover, 36 compounds were detected: 23 lignans, 4 flavonoids, 3 triterpenoids, 3 phenolic acids, 2 organic acids, and 1 nitrogenous compound, which were categorized into six classes. The detailed information is presented in Figure 3 and Table 1.

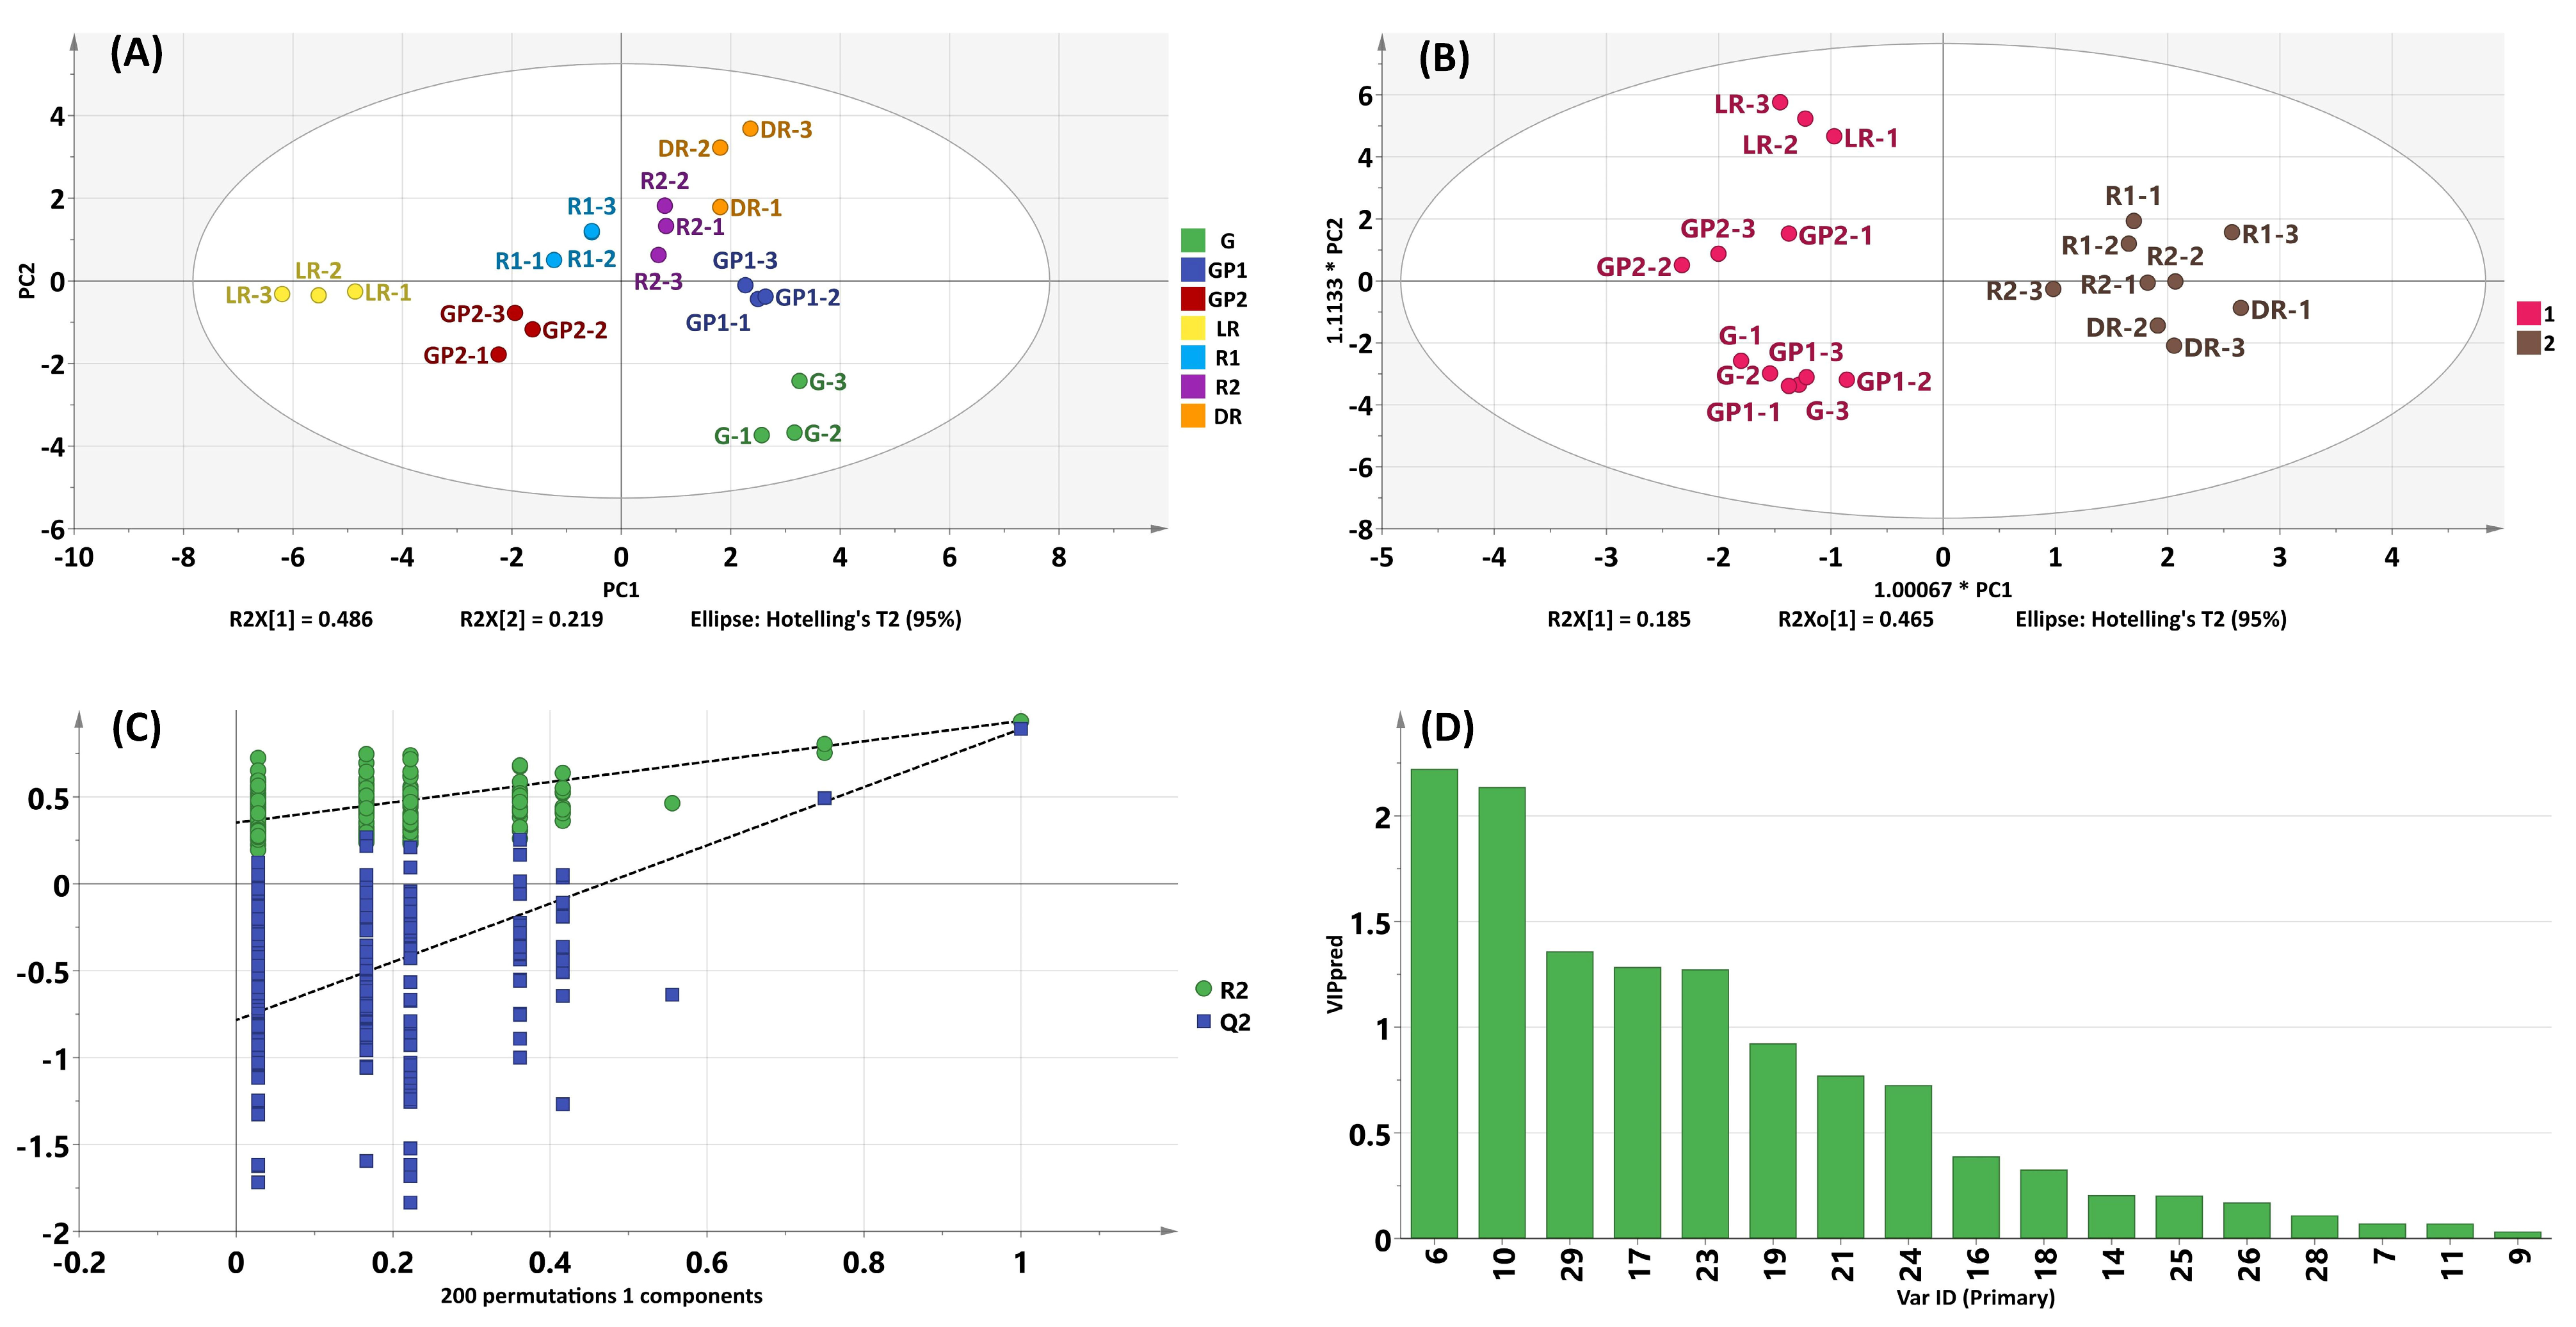
3.1.2. Chemometric Analysis of S. chinensis

PCA was employed to investigate differences in the chemical constituents of S. chinensis fruit samples during maturation. The samples within the same groups clustered together and separated from those in other groups, indicating significant differences among the groups (Figure 4A). The contributions of PC1 and PC2 were 48.6% and 21.9%, respectively, with a cumulative contribution of 70.5%. Notably, on the PC2 axis, the R1, R2, and DR groups were distributed in the positive direction, while the other groups were primarily distributed in the negative direction, suggesting that the R1 group represented the key time node for the compositional changes in S. chinensis. The OPLS-DA model maximised the differentiation of groups and facilitated the screening for differentiated compounds. Based on PCA results, the samples of S. chinensis were categorised into group one (G, GP1, LR, and GP2) and group two (R1, R2, and DR). These groups were further subjected to OPLS-DA analysis to identify the core ingredients responsible for these differences. In the OPLS-DA model score plot (Figure 4B), the chemical profiles of groups one and two exhibited clear distinctions, indicating remarkable differences in the components of S. chinensis obtained at different times. Two hundred rounds of random permutations were performed to validate the established OPLS-DA model (Figure 4C), confirming its reliability (R2Y = 0.937, Q2 = 0.891). Subsequently, differential compounds were screened according to the combination of the VIP value (≥1). As shown in Figure 4D, the contents of five compounds (6, 10, 17, 23, and 29) contributed to distinguishing herbs harvested at different times. As the extensively studied ingredient in S. chinensis, lignans were confirmed to have exciting hepatoprotective activity. Specifically, compounds 6 (schisandrol A), 17 (schisantherin A), and 23 (schisandrin A) exhibited significant protective effects against acetaminophen-induced liver injury, partly attributed to their inhibition of cytochrome P 450-mediated bioactivation of acetaminophen [1]. Compound 10 (angeloylgomisin H) was found to induce quinone reductase activity in murine hepatoma cells and exhibited a relatively high chemoprevention index [48]. Consequently, four compounds (6, 10, 17, and 23) could potentially serve as chemical markers to identify samples of S. chinensis harvested at various times.

3.2. Hepatoprotective Biomarkers of S. chinensis

3.2.1. Target Network Analysis

The 36 compounds identified in S. chinensis extract (Table 1) were submitted to compute GI absorption parameters (Table S2). Initially, 26 compounds (23 lignans, 2 triterpenoids, and 1 nitrogenous compound) with well-absorbed GI absorption were screened and further analysed by network pharmacology. With the systematic literature search, OB ≥ 30% and DL ≥ 0.18 have been used as generic parameters for network pharmacology to screen the active compounds capable of exerting strong pharmacodynamic effects at low doses [22,49]. In this study, four compounds (13, 14, 18, and 26) meeting the criteria of OB and DL were identified as potential active compounds. A total of 88 targets for the four active compounds were screened from the TCMSP and SwissTargetPrediction databases, and 550 disease targets associated with hepatoprotection were extracted from the TTD and Genecards databases. Through Venn mapping (Figure 5A), 13 overlapping targets were identified between the constituent-related targets and those associated with liver diseases (Table S3). Furthermore, GO and KEGG pathway enrichment analyses were performed on 13 potential targets with a p-value < 0.01. A total of 346 GO items were screened, of which the ones with the highest correlation are shown in Figure 5B. In addition, 101 KEGG pathways were obtained through the annotation analysis, and the top 15 pathways are displayed in Figure 5C. The results showed that the chemical carcinogenesis-reactive oxygen pathway and the hepatitis B pathway may be the primary pathways for S. chinensis to treat liver injury.
To further analyse the relationships among the compounds, potential targets, and liver diseases, a C-T-D network was constructed. As shown in Figure 5D, 13 target proteins were validated from four active compounds (13, 14, 18, and 26), with only compound, compound 13, hitting no target. Phosphatidylinositol 4, 5-bisphosphate 3-kinase catalytic subunit alpha isoform (PIK3CA) was identified in three connected components and was associated with five diseases. PIK3CA expression activates the PI3K/AKT pathway, which is closely related to oxidative stress and promotes apoptosis induced by drug injury [50,51]. The network also showed that diseases related to these constituents and potential targets were concentrated in oxidative and alcoholic livers. Furthermore, in vitro and in vivo studies have confirmed the significant biological activity of lignans from S. chinensis in liver injury protection and cellular oxidative damage protection. Compound 18 (schisantherin B) has been proven to inhibit cytochrome P450 3A4 efficiently, which can improve the bioavailability of compounds [52]. Compound 26 (schisandrin C) could alleviate acetaminophen-induced liver injury in mouse models by improving the inflammatory response and activating the nuclear factor erythroid 2-related factor 2 to inhibit oxidative stress [53]. In particular, compounds 18 (schisantherin B) and 26 (schisandrin C) exerted hepatoprotective effects against lithocholic acid-induced cholestasis through the activation of the pregnane X receptor [54]. Therefore, compounds 18 and 26 with hepatoprotective activity were selected as biomarkers.

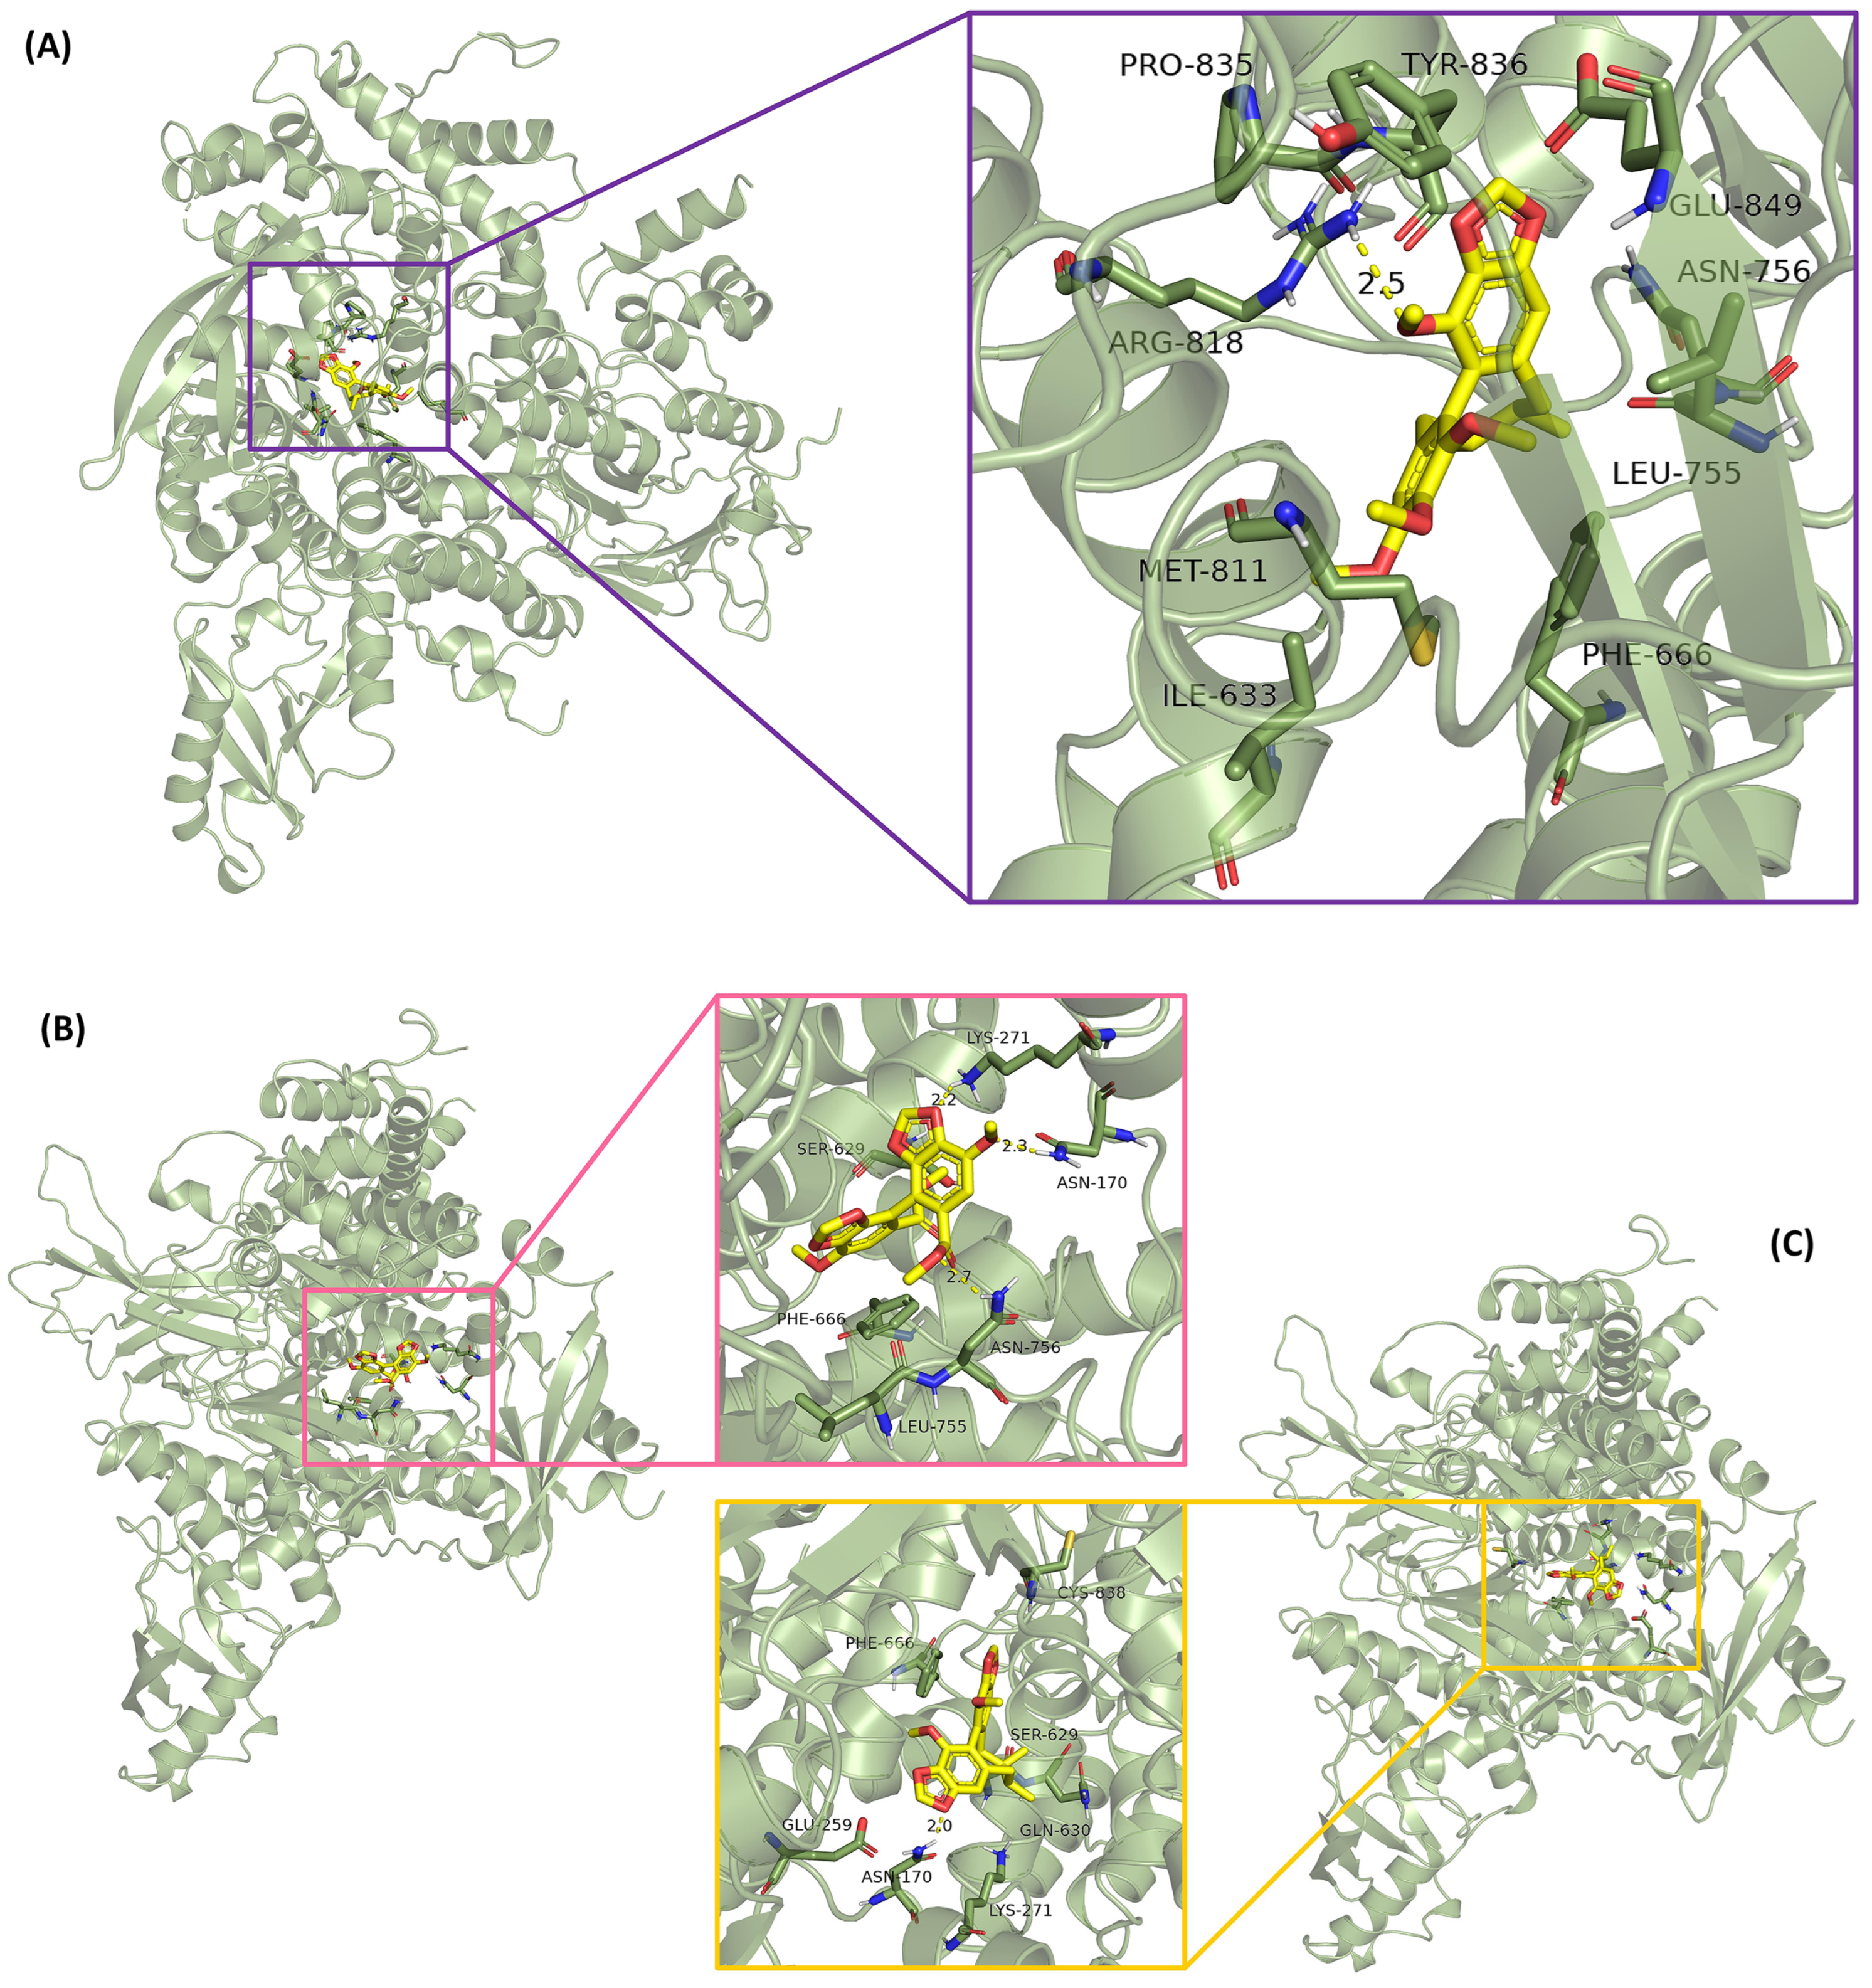
3.2.2. Molecular Docking Verification

Molecular docking was performed on the top target (PIK3CA) and correlated compounds (18 and 26). The lower the molecular docking energy, the higher the binding rate between ligand and receptor. The lignans, as a typical example of TCM, exhibited good affinity modes with PIK3CA, some even better than the positive control (Table S4). Moreover, due to the conformational homology of the lignan compounds, the binding effects between the lignans and proteins were similar. For instance (Figure 6A), compound 18 combined with PIK3CA showed an oxygen bond in the methoxy group, forming hydrogen bonds with residues of ARG-818, while the compound also exhibited hydrophobic interactions with MET811, ILE633, PHE666, LEU755, ASN756, GLU849, TYR836, and PRO835. The interactions between PIK3CA and the other compounds are depicted in Figure 6B,C. These relationships enhanced the stable binding of lignan molecules to their active sites, which inhibited protein activity.

3.3. Hepatoprotective Effects of Predicted Q-Markers

In contrast to traditional chemical analysis, Q-markers used to evaluate the quality of TCM not only reflect the specificity and difference of chemical components but also their pharmacodynamic activity. Therefore, in the present study, the hepatoprotective effects of six compounds, including four chemical markers (6, 10, 17, and 23), together with two biomarkers (18 and 26), were validated using CCl4-induced injury in BRL-3A cells. Compared to the normal control group, the cell viability rate (%) in the model group treated with CCl4 was 52.77%, indicating the successful establishment of the cell model (Figure 7A). All compounds, except for compound 17 at a concentration of 12.5 μM, promoted cell viability within a concentration range of 12.5 to 50 μM (p < 0.05). Among them, compounds 23 and 26 exhibited potent cell viability (>90%) at a concentration of 50 μM. Additionally, BRL-3A cells were stained with calcein-AM/PI and observed using fluorescence microscopy. Compared to the normal control group, more dead cells (red fluorescent cells) appeared in the model group (Figure 7B). In contrast, after the compound treatment, the number of live (green fluorescent cells) and dead cells increased and decreased significantly. Our microscopic results were consistent with those obtained using the CCK-8 assay. Next, the morphology of cells treated with various compounds was observed using TRITC-phalloidin staining and scanning electron microscopy, in which the nucleus and actin cytoskeleton were stained with DAPI (blue fluorescence) and TRITC-phalloidin (red fluorescence), respectively. The model group exhibited a significant decrease in red fluorescence staining, indicating that CCl4 caused damage to the cells, including a reduced skeleton, with some cells not showing a visible cytoskeleton (Figure 8). Cells incubated with the compound solutions showed a significant increase in red fluorescence compared to the model group, suggesting that all six compounds promoted cell proliferation and improved cell morphology. In summary, the results of CCK-8, calcein-AM/PI, and TRITC-phalloidin staining demonstrated that the six compounds strengthened cell viability and played a crucial role in the hepatoprotective effects of S. chinensis.

3.4. Simultaneous Quantitative Analysis of Q-Markers in S. chinensis

A simultaneous quantification method was established using HPLC-DAD (Table S5). The calibration curves of the six standards with wide dynamic ranges showed acceptable linear correlation coefficients (R2), which were more than 0.9980 in the test range. The lower limit of detection (LOD) and limit of quantitation (LOQ) ranged from 0.14 to 0.45 μg/mL and 0.70 to 1.35 μg/mL, respectively. The precision and repeatability were evaluated using the relative standard deviation (RSD) value. The RSD values were less than 0.84% for intra-day precision, whereas the inter-day variations were less than 2.30% for the six standard solutions. The repeatability of the method was assessed by taking the same batch of samples and extracting them five times in parallel. The RSD (%) of the six analytes was less than 2.74%, suggesting satisfactory repeatability of the procedure. All these results were acceptable, indicating that the HPLC-DAD method was suitable for the simultaneous quantitative determination of the six Q-markers in S. chinensis.
The concentrations of the six Q-markers in seven batches of S. chinensis obtained at different fruit harvest times are presented in Figure 9 and Table 2. The total amount of the six Q-markers ranged from 8.71 to 11.99 mg/g, exhibiting a decreasing and then an increasing tendency with fruit harvest time. Specifically, the content was highest at the final stage of maturation (DR group, 11.99 mg/g), followed by the early stage of the fruit set (G group, 11.62 mg/g). Additionally, the samples collected in late August had relatively low amounts of lignans compared to those contained in other periods. Since the content of each Q-marker varies according to the stage of maturity, determining the appropriate harvest time is critical for the activity and quality control of S. chinensis.

4. Discussion

S. chinensis, first described in “Shen Nong Ben Cao Jing”, has significant hepatoprotective activity, as the fruits and extracts are widely used to treat chemical liver injuries in China. Given its importance, current studies have proposed several dependable methods for the quality evaluation of S. chinensis. UPLC coupled with triple quadrupole-linear ion trap mass spectrometry was developed to detect active components, and five chemical markers (i.e., quinic acid, malic acid, protocatechuic acid, and schisandrol B) were related to the identification of cultivated and wild S. chinensis [43]. UPLC coupled with quadrupole time-of-flight mass spectrometry was established to evaluate the quality of S. chinensis through the simultaneous quantification of 15 lignans [55]. Under the HPLC analysis method, malic acid, citric acid, and protocatechuic acid, as the main components, were utilized to distinguish S. chinensis and Schisandra sphenanthera [56]. However, quality evaluation based on compositional information often finds it difficult to truly reflect the relationship between quality and therapeutic efficacy [57]. Therefore, a strategy combining UPLC-Q-Extractive Orbitrap/MS, chemometric analysis, network pharmacology, and experimental validation was proposed and applied to the quality evaluation of TCM.
S. chinensis is a deciduous lianan with red berries harvested from August to September. The fruits of S. chinensis obtained at different times exhibit great similarities in chemical composition but vary in contents. Till now, there were few reports on chemical markers to distinguish these samples of S. chinensis. Multi-component determination combined with chemometrics could facilitate visualizing the authenticity and quality assessment [58]. In the present study, the UPLC-Q-Extractive Orbitrap/MS analysis of the chemical compositions of S. chinensis harvested from July to September identified 36 compounds. Subsequent chemometric analysis revealed that different samples could be significantly separated under the unsupervised PCA model. Moreover, the VIP parameters generated from OPLS-DA intuitively represented the differential compounds, which greatly contributed to distinguishing herbs harvested at different times. Compared to conventional analytical methods such as HPLC and UPLC-MS for identifying S. chinensis, the combination of chemometrics not only analyses the composition differences but also accurately classifies samples with similar compositions based on the variations in the content of characteristic substances, which provides a scientific basis for the discovery of chemical markers [13,15]. In addition, further effectiveness should be considered for the characterised components to discern which ones are Q-markers. Network pharmacology has become an effective tool for discovering active substances in TCM [22]. Targets related to the identified components were mapped to those associated with liver diseases, and a C-T-D network map was constructed after eliminating redundancies. By analysing the network and KEGG pathway, it is evident that lignans such as schisantherin B and schisandrin C serve as potential biomarkers for the hepatoprotective effect of S. chinensis. Furthermore, oxidative stress emerges as an essential factor in the progression of liver injury [52,59]. Based on chemical and pharmacological findings, as well as previous reports [1,48,52,53,54], we deduced that schisandrol A, angeloylgomisin H, schisantherin A, schisantherin B, schisandrin A, and schisandrin C might be the potential Q-markers of S. chinensis for the hepatoprotective activity, which were verified by in vitro experiments.
Analysing the structural properties reveals that the six Q-markers belong to unique dibenzocy-clooctadiene lignans. The skeletal structure of these compounds consists of two C-6/C-3 units linked by a bond between positions 8 and 8′ (Figure 9A). The varying substituents (e.g., hydroxyl, methylenedioxy, angeloyl, and benzoyl) attached to the cyclooctadiene in different lignan monomers result in differing levels of hepatoprotective effects. Compared with other compounds, compounds 23 and 26 without the hydroxyl and ester groups at the C-6 and C-7, exhibited a higher cell viability effect (>90%), suggesting that the substituents on cyclooctadiene may attenuate the protective effect of lignans on hepatocytes. The reduced bioactivity observed is likely attributed to the substituent groups in the cyclooctadiene ring. Particularly, the large substituents (e.g., benzoyl substituent in terms of schisantherin A) may cause steric hindrance, thereby impeding the binding of molecules to their targets [60]. Finally, the development of the HPLC-DAD method for simultaneous quantitative analysis enabled the measurability of the Q-markers from S. chinensis. This method was applied to analyse the six Q-markers in seven batches of S. chinensis, revealing significant variations in the lignan content in fruits obtained at different harvest times. These chemical changes, occurring during the maturation of the herb, lay the foundation for the quality evaluation of S. chinensis.

5. Conclusions

In the present study, a comprehensive strategy for discovering potential Q-markers was developed by integrating UPLC-Q-Extractive Orbitrap/MS, chemometric analysis, and network pharmacology. Following the principles of specificity and effectiveness, six compounds (schisandrol A, angeloylgomisin H, schisantherin A, schisantherin B, schisandrin A, and schisandrin C) were identified as the Q-markers for S. chinensis, which not only reflected the specificity and variability of the chemical composition, but was also verified to be closely related to the hepatoprotective activity. The established HPLC-DAD simultaneous quantification method demonstrated satisfied linearity, precision, and repeatability levels for the six Q-markers. Variations in the contents of these compounds were observed among the seven batches of S. chinensis harvested at different times. Notably, samples harvested in late September showed the highest content, suggesting a correlation between plant content and the life cycle stage. However, further studies on efficacy evaluation in vitro and in vivo still need to be performed to analyse the influence of Q-markers. This study also demonstrates that combining UPLC-Q-Extractive Orbitrap/MS, chemometric analysis, and network pharmacology can serve as an effective method for exploring Q-markers, facilitating a comprehensive and systematic evaluation of the quality of TCMs.

Supplementary Materials

The following supporting information can be downloaded at https://www.mdpi.com/article/10.3390/separations11030088/s1, Figure S1: TIC overlapping map of QC samples mass spectrometry results. (A) positive ion mode; (B) negative ion mode; Figure S2: Representative base peak intensity chromatograms of samples of S chinensis derived from UPLC-Q-Extractive Orbitrap/MS. Diagram of samples with different harvesting times in positive (A) and negative (B) modes; Table S1: Collecting information of seven batches of S. chinensis; Table S2: Adsorption, distribution, metabolism, and exclusion characteristic information of 36 identified compounds from S. chinensis; Table S3: Characteristic information of 13 potential targets of S chinensis for hepatoprotective; Table S4: Molecular docking of lignans binding with target and their binding energy; Table S5: Regression equation, linear range, LOD, LOQ, precision, and repeatability of six analytes.

Author Contributions

Conceptualization, J.Z. and Y.D.; formal analysis, Y.W.; investigation, Y.W.; methodology, Y.W. and Y.L.; project administration, J.Z.; supervision, J.Z.; validation, X.D.; visualization, X.D.; writing—original draft, Y.W.; writing—review and editing, Y.W., J.Z. and Y.D. All authors have read and agreed to the published version of the manuscript.

Funding

This research was funded by the National Natural Science Foundation of China (U1603285), the Jilin Provincial Department of Science and Technology Project (20210508005RQ), and the Jilin Provincial Department of Science and Technology Project (YDZJ202201ZYTS150).

Data Availability Statement

The data that support the findings of this work are available from the corresponding author upon reasonable request.

Conflicts of Interest

The authors declare no conflicts of interest.

References

  1. Jiang, Y.M.; Fan, X.M.; Wang, Y.; Tan, H.S.; Chen, P.; Zeng, H.; Huang, M.; Bi, H.C. Hepato-protective effects of six schisandra lignans on acetaminophen-induced liver injury are partially associated with the inhibition of CYP-mediated bioactivation. Chem. Biol. Interact. 2015, 231, 83–89. [Google Scholar] [CrossRef]
  2. Zhou, Y.; Men, L.H.; Sun, Y.X.; Wei, M.Y.; Fan, X. Pharmacodynamic effects and molecular mechanisms of lignans from Schisandra chinensis Turcz. (Baill.), a current review. Eur. J. Pharmacol. 2021, 892, 173796. [Google Scholar] [CrossRef]
  3. Yan, T.X.; Mao, Q.Q.; Zhang, X.Z.; Wu, B.; Bi, K.S.; He, B.S.; Jia, Y. Schisandra chinensis protects against dopaminergic neuronal oxidative stress, neuroinflammation and apoptosis via the BDNF/Nrf2/NF-κB pathway in 6-OHDA-induced Parkinson’s disease mice. Food Funct. 2021, 12, 4079–4091. [Google Scholar] [CrossRef] [PubMed]
  4. Yang, K.; Qiu, J.; Huang, Z.C.; Yu, Z.W.; Wang, W.J.; Hu, H.L.; You, Y. A comprehensive review of ethnopharmacology, phytochemistry, pharmacology, and pharmacokinetics of Schisandra chinensis (Turcz.) Baill. and Schisandra sphenanthera Rehd. et Wils. J. Ethnopharmacol. 2022, 284, 114759. [Google Scholar] [CrossRef]
  5. Chun, J.N.; Cho, M.S.; So, I.; Jeon, J.H. The protective effects of Schisandra chinensis fruit extract and its lignans against cardiovascular disease: A review of the molecular mechanisms. Fitoterapia 2014, 97, 224–233. [Google Scholar] [CrossRef] [PubMed]
  6. Kopustinskiene, D.M.; Bernatoniene, J. Antioxidant effects of Schisandra chinensis fruits and their active constituents. Antioxidants 2021, 10, 620. [Google Scholar] [CrossRef] [PubMed]
  7. Yan, T.X.; Wang, N.Z.; Liu, B.; Wu, B.; Xiao, F.; He, B.S.; Jia, Y. Schisandra chinensis ameliorates depressive-like behaviors by regulating microbiota-gut-brain axis via its anti-inflammation activity. Phytother. Res. 2020, 35, 289–296. [Google Scholar] [CrossRef]
  8. Chinese Pharmacopoeia Commission. Pharmacopoeia of the People’s Republic of China Chinese Pharmacopoeia Commission; China Medical Science Press: Beijing, China, 2020; Volume 1, p. 68. [Google Scholar]
  9. Lin, A.X.; Chan, G.; Hu, Y.; Ouyang, D.; Ung, C.O.L.; Shi, L.; Hu, H. Internationalization of traditional Chinese medicine: Current international market, internationalization challenges and prospective suggestions. Chin. Med. 2018, 13, 9. [Google Scholar] [CrossRef]
  10. Jiang, Y.; David, B.; Tu, P.; Barbin, Y. Recent analytical approaches in quality control of traditional Chinese medicines-A review. Anal. Chim. Acta 2010, 657, 9–18. [Google Scholar] [CrossRef]
  11. Min, G.H.; Min, W.Z.; YuJuan, L.; Zhi, Q.Z. Overview of the quality standard research of traditional Chinese medicine. Front. Med. 2011, 5, 195–202. [Google Scholar]
  12. Ahn, J.H.; Mo, E.J.; Jo, Y.H.; Kim, S.B.; Hwang, B.Y.; Lee, M.K. Variation of loganin content in Cornus officinalis fruits at different extraction conditions and maturation stages. Biosci. Biotechnol. Biochem. 2017, 81, 1973–1977. [Google Scholar] [CrossRef]
  13. Sun, D.; Li, Q.; Li, H.B.; Li, Y.H.; Piao, Z.Y. Quantitative analysis of six lignans in fruits with different colours of Schisandra chinensis by HPLC. Nat. Prod. Res. 2014, 28, 581–585. [Google Scholar] [CrossRef] [PubMed]
  14. Lee, S.; Yeon, S.W.; Turk, A.; Ryu, S.H.; Seo, J.; Lee, K.Y.; Hwang, B.Y.; Shin, H.; Lee, M.K. Variation of lignan content and α-glucosidase inhibitory activity of Schisandra chinensis fruit at different maturation stages: Comparison with stem, leaf and seed. Sci. Hortic. 2022, 293, 110679. [Google Scholar] [CrossRef]
  15. Juan, Y.C.; Yang, X.; Ling, W.M.; Ye, X.Z.; Yan, G.X. Application of characteristic fragment filtering with ultra high performance liquid chromatography coupled with high-resolution mass spectrometry for comprehensive identification of components in Schisandrae chinensis Fructus. J. Sep. Sci. 2019, 42, 1323–1331. [Google Scholar]
  16. Huang, Y.L.; Huang, Z.P.; Watanabe, C.C.; Wang, L.L. Authentication of Schisandra chinensis and Schisandra sphenantherae in Chinese patent medicines by pyrolysis-gas chromatography/mass spectrometry and fingerprint analysis. J. Anal. Appl. Pyrolysis 2019, 137, 70–76. [Google Scholar] [CrossRef]
  17. Onay, S.; Hofer, S.; Ganzera, M. Rapid analysis of nine lignans in Schisandra chinensis by supercritical fluid chromatography using diode array and mass spectrometric detection. J. Pharm. Biomed. 2020, 185, 113254. [Google Scholar] [CrossRef] [PubMed]
  18. Nowak, A.; Zakłos-Szyda, M.; Błasiak, J.; Nowak, A.; Zhang, Z.; Zhang, B. Potential of Schisandra chinensis (Turcz.) Baill. in Human Health and Nutrition: A Review of Current Knowledge and Therapeutic Perspectives. Nutrients 2019, 11, 333. [Google Scholar] [CrossRef] [PubMed]
  19. Zhi, Y.W.; Bei, Z.Y.; Ying, W.W.; Qi, H.L.; An, G.D.; Xiao, L.C. Approaches to establish Q-markers for the quality standards of traditional Chinese medicines. Acta Pharm. Sin. B 2017, 7, 439–446. [Google Scholar]
  20. Migues, V.H.; David, J.M.; David, J.P. Determination of polyphenols in Schinus terebinthifolius Raddi bark extracts and chemometric analysis. Anal. Methods 2020, 12, 1478–1485. [Google Scholar] [CrossRef]
  21. Patel, N.D.; Kanaki, N.S. Fingerprint analysis of Shankhpushpi for species discrimination by HPLC coupled with chemometric methods. J. Liq. Chromatogr. 2020, 43, 455–463. [Google Scholar] [CrossRef]
  22. Wang, B.; Ding, Y.; Zhao, P.H.; Li, W.; Li, M.; Zhu, J.B.; Ye, S.H. Systems pharmacology-based drug discovery and active mechanism of natural products for coronavirus pneumonia (COVID-19): An example using flavonoids. Comput. Biol. Med. 2022, 143, 105241. [Google Scholar] [CrossRef] [PubMed]
  23. Guo, Y.Y.; Ding, Y.; Xu, F.F.; Liu, B.Y.; Kou, Z.N.; Xiao, W.; Zhu, J.B. Systems pharmacology-based drug discovery for marine resources: An example using sea cucumber (Holothurians). J. Ethnopharmacol. 2015, 165, 61–72. [Google Scholar] [CrossRef] [PubMed]
  24. Newby, D.; Freitas, A.A.; Ghafourian, T. Decision trees to characterise the roles of permeability and solubility on the prediction of oral absorption. Eur. J. Med. Chem. 2015, 90, 751–765. [Google Scholar] [CrossRef] [PubMed]
  25. Daina, A.; Michielin, O.; Zoete, V. SwissADME: A free web tool to evaluate pharmacokinetics, drug-likeness and medicinal chemistry friendliness of small molecules. Sci. Rep. 2017, 7, 42717. [Google Scholar] [CrossRef] [PubMed]
  26. Liu, H.; Wang, J.; Zhou, W.; Wang, Y.H.; Yang, L. Systems approaches and polypharmacology for drug discovery from herbal medicines: An example using licorice. J. Ethnopharmacol. 2013, 146, 773–793. [Google Scholar] [CrossRef] [PubMed]
  27. Long, R.J.; Peng, L.; Jinan, W.; Wei, Z.; Bohui, L.; Chao, H.; Dong, L.P.; Hu, G.Z.; Yang, T.W.; Feng, Y.Y.; et al. TCMSP: A database of systems pharmacology for drug discovery from herbal medicines. J. Cheminform. 2014, 6, 13. [Google Scholar]
  28. Daina, A.; Michielin, O.; Zoete, V. SwissTargetPrediction: Updated data and new features for efficient prediction of protein targets of small molecules. Nucleic Acids Res. 2019, 47, 357–364. [Google Scholar] [CrossRef]
  29. Zhou, Y.; Zhang, Y.T.; Lian, X.C.; Li, F.C.; Wang, C.X.; Zhu, F.; Qiu, Y.Q.; Chen, Y.Z. Therapeutic target database update 2022: Facilitating drug discovery with enriched comparative data of targeted agents. Nucleic Acids Res. 2022, 50, 1398–1407. [Google Scholar] [CrossRef]
  30. Stelzer, G.; Rosen, N.; Plaschkes, I.; Zimmerman, S.; Twik, M.; Fishilevich, S.; Stein, T.I.; Nudel, R.; Lieder, I.; Mazor, Y.; et al. The GeneCards Suite: From Gene Data Mining to Disease Genome Sequence Analyses. Curr. Protoc. Bioinform. 2016, 54, 1–33. [Google Scholar] [CrossRef]
  31. Bardou, P.; Mariette, J.; Escudié, F.; Djemiel, C.; Klopp, C. Jvenn: An interactive Venn diagram viewer. BMC Bioinform. 2014, 15, 293. [Google Scholar] [CrossRef]
  32. Zhou, Y.; Zhou, B.; Pache, L.; Chang, M.; Khodabakhshi, A.H.; Tanaseichuk, O.; Benner, C.; Chanda, S.K. Metascape provides a biologist-oriented resource for the analysis of systems-level datasets. Nat. Commun. 2019, 10, 1523. [Google Scholar] [CrossRef]
  33. Shannon, P.; Markiel, A.; Ozier, O.; Baliga, N.S.; Wang, J.T.; Ramage, D.; Amin, N.; Schwikowski, B.; Ideker, T. Cytoscape: A software environment for integrated models of biomolecular interaction networks. Genome Res. 2003, 13, 2498–2504. [Google Scholar] [CrossRef]
  34. El-Laithy, H.M. Self-nanoemulsifying drug delivery system for enhanced bioavailability and improved hepatoprotective activity of biphenyl dimethyl dicarboxylate. Curr. Drug Deliv. 2008, 5, 170–176. [Google Scholar] [CrossRef]
  35. Deng, L.-L.; Xie, X.-D.; Li, J.; Wang, D.-P.; Hao, X.-J.; Chen, G.; Mu, S.-Z. Hepatoprotective constituents of total dibenzocyclooctadiene lignans from schisandra chinensis based on the spectrum-effect relationship. Molecules. 2021, 26, 6554. [Google Scholar] [CrossRef]
  36. Berman, H.M.; Westbrook, J.; Feng, Z.; Gilliland, G.; Bhat, T.N.; Weissig, H.; Shindyalov, I.N.; Bourne, P.E. The protein data bank. Nucleic Acids Res. 2000, 28, 235–242. [Google Scholar] [CrossRef]
  37. Li, Y.M.; Li, X.; Zhao, R.; Wang, C.Y.; Qiu, F.P.; Sun, B.L.; Ji, H.; Qiu, J.; Wang, C. Enhanced adhesion and proliferation of human umbilical vein endothelial cells on conductive PANI-PCL fiber scaffold by electrical stimulation. Mater. Sci. Eng. C 2017, 72, 106–112. [Google Scholar] [CrossRef] [PubMed]
  38. Zhou, Y.; Huang, S.X.; Pu, J.X.; Li, J.R.; Ding, L.S.; Chen, D.F.; Sun, H.D.; Xu, H.X. Ultra performance liquid chromatography coupled with quadrupole time-of-flight mass spectrometric procedure for qualitative and quantitative analyses of nortriterpenoids and lignans in the genus Schisandra. J. Pharm. Biomed. 2011, 56, 916–927. [Google Scholar] [CrossRef] [PubMed]
  39. Liu, X.K.; Guo, Y.L.; Cai, G.Z.; Gong, J.Y.; Wang, Y.; Liu, S.Y. Chemical composition analysis of Schisandra chinensis fructus and its three processed products using UHPLC-Q-Orbitrap/MS-based metabolomics approach. Nat. Prod. Res. 2022, 36, 3464–3468. [Google Scholar] [CrossRef]
  40. Yang, S.S.; Shan, L.L.; Luo, H.M.; Sheng, X.; Du, J.; Li, Y.B. Rapid classification and identification of chemical components of Schisandra Chinensis by UPLC-Q-TOF/MS combined with data post-processing. Molecules 2017, 22, 1778. [Google Scholar] [CrossRef] [PubMed]
  41. Gao, Y.; Wu, S.M.; Cong, R.H.; Xiao, J.Y.; Ma, F.L. Characterization of lignans in Schisandra chinensis oil with a single analysis process by UPLC-Q/TOF-MS. Chem. Phys. Lipids 2019, 218, 158–167. [Google Scholar] [CrossRef] [PubMed]
  42. Mocan, A.; Schafberg, M.; Crișan, G.; Rohn, S. Determination of lignans and phenolic components of Schisandra chinensis (Turcz.) Baill. using HPLC-ESI-TOF-MS and HPLC-online TEAC: Contribution of individual components to overall antioxidant activity and comparison with traditional antioxidant assays. J. Funct. Foods 2016, 24, 579–594. [Google Scholar] [CrossRef]
  43. Chen, S.Y.; Shi, J.J.; Zou, L.S.; Liu, X.H.; Tang, R.M.; Ma, J.M.; Wang, C.C.; Tan, M.X.; Chen, J.L. Quality evaluation of wild and cultivated schisandrae chinensis fructus based on simultaneous determination of multiple bioactive constituents combined with multivariate statistical analysis. Molecules 2019, 24, 1335. [Google Scholar] [CrossRef]
  44. Yu, F.; Chen, C.; Chen, S.; Wang, K.; Huang, H.; Wu, Y.; He, P.; Tu, Y.; Li, B. Dynamic changes and mechanisms of organic acids during black tea manufacturing process. Food Control. 2022, 132, 108535. [Google Scholar] [CrossRef]
  45. Yan, T.; Hu, G.S.; Wang, A.H.; Hong, Y.; Jia, J.M. Characterisation of proanthocyanidins from Schisandra chinensis seed coats by UPLC-QTOF/MS. Nat. Prod. Res. 2014, 28, 1834–1842. [Google Scholar] [CrossRef] [PubMed]
  46. Maietta, M.; Colombo, R.; Lavecchia, R.; Sorrenti, M.; Zuorro, A.; Papetti, A. Artichoke (Cynara cardunculus L. var. scolymus) waste as a natural source of carbonyl trapping and antiglycative agents. Food Res. Int. 2017, 100, 780–790. [Google Scholar] [PubMed]
  47. Peng, Y.Y.; Bishop, K.S.; Zhang, J.Y.; Chen, D.L.; Quek, S.Y. Characterization of phenolic compounds and aroma active compounds in feijoa juice from four New Zealand grown cultivars by LC-MS and HS-SPME-GC-O-MS. Food Res. Int. 2020, 129, 108873. [Google Scholar] [CrossRef] [PubMed]
  48. Lee, S.B.; Kim, C.Y.; Lee, H.J.; Yun, J.H.; Nho, C.W. Induction of the phase II detoxification enzyme NQO1 in hepatocarcinoma cells by lignans from the fruit of Schisandra chinensis through nuclear accumulation of Nrf2. Planta Med. 2009, 75, 1314–1318. [Google Scholar] [CrossRef] [PubMed]
  49. Gao, Y.; Ji, W.; Lu, M.; Wang, Z.; Jia, X.; Wang, D.; Cao, P.; Hu, C.; Sun, X.; Wang, Z. Systemic pharmacological verification of Guizhi Fuling decoction in treating endometriosis-associated pain. J. Ethnopharmacol. 2022, 297, 115540. [Google Scholar] [CrossRef] [PubMed]
  50. Yang, L.; Yu, Y.; Tian, G.; Deng, H.Y.; Yu, B. H3K9ac modification was involved in doxorubicin induced apoptosis by regulating Pik3ca transcription in H9C2 cells. Life Sci. 2021, 284, 119107. [Google Scholar] [CrossRef] [PubMed]
  51. Yue, F.B.; Meng, W.; Yang, P.Y.; Xia, A.Z.; Yan, M.X.; He, Y.D.; Rong, W.G. Protective mechanism of Forsythia suspense leaves extract against drug-induced liver injury. J. Northwest A&F Univ. 2022, 50, 23–33. [Google Scholar]
  52. Liu, J.M.; Chen, J.M.; Lin, M.J.; Wu, F.; Ma, C.R.; Zuo, X.; Yu, W.; Huang, M.J.; Fang, J.; Li, W.R.; et al. Screening and verification of CYP3A4 inhibitors from Bushen-Yizhi formula to enhance the bioavailability of osthole in rat plasma. J. Ethnopharmacol. 2022, 282, 114643. [Google Scholar] [CrossRef] [PubMed]
  53. Zhang, D.W.; Fang, B.Z.; Ting, H.T.; Yan, Z.X.; Qiang, L.; Jing, Z.; He, X.X. Schisandrin C improves acetaminophen-induced liver injury in mice by regulating Nrf2 signaling pathway. China J. Chin. Mater. Med. 2022, 47, 5299–5305. [Google Scholar]
  54. Fan, S.C.; Liu, C.H.; Jiang, Y.M.; Gao, Y.; Chen, Y.X.; Fu, K.; Yao, X.P.; Huang, M.; Bi, H.C. Lignans from Schisandra sphenanthera protect against lithocholic acid-induced cholestasis by pregnane X receptor activation in mice. J. Ethnopharmacol. 2019, 245, 112103. [Google Scholar] [CrossRef] [PubMed]
  55. Zhang, W.D.; Wang, Q.; Wang, Y.; Wang, X.J.; Pu, J.X.; Gu, Y.; Wang, R. Application of ultrahigh-performance liquid chromatography coupled with mass spectrometry for analysis of lignans and quality control of Fructus Schisandrae chinensis. J. Sep. Sci. 2012, 35, 2203–2209. [Google Scholar] [CrossRef] [PubMed]
  56. Oshima, R.; Kotani, A.; Kuroda, M.; Yamamoto, K.; Mimaki, Y.; Hakamata, H. Discrimination of schisandrae chinensis fructus and schisandrae sphenantherae fructus based on fingerprint profiles of hydrophilic components by high-performance liquid chromatography with ultraviolet detection. J. Nat. Med. 2017, 72, 399–408. [Google Scholar] [CrossRef] [PubMed]
  57. Zhang, T.J.; Bai, G.; Han, Y.; Xu, J.; Gong, S.; Li, Y.; Zhang, H.; Liu, C. The method of quality marker research and quality evaluation of traditional Chinese medicine based on drug properties and effect characteristics. Phytomedicine 2018, 44, 204–211. [Google Scholar] [CrossRef]
  58. Liang, Y.Z.; Xie, P.S.; Chau, F. Chromatographic fingerprinting and related chemometric techniques for quality control of traditional Chinese medicines. J. Sep. Sci. 2010, 33, 410–421. [Google Scholar] [CrossRef]
  59. Han, J.; Shi, X.; Du, Y.; Shi, F.; Zhang, B.; Zheng, Z.; Xu, J.; Jiang, L. Schisandrin C targets Keap1 and attenuates oxidative stress by activating Nrf2 pathway in Ang II-challenged vascular endothelium. Phytother. Res. 2019, 33, 779–790. [Google Scholar] [CrossRef]
  60. Song, J.X.; Lin, X.; Wong, R.N.S.; Sze, S.C.W.; Tong, Y.; Shaw, P.C.; Zhang, Y.B. Protective effects of dibenzocyclooctadiene lignans from Schisandra chinensis against beta-amyloid and homocysteine neurotoxicity in PC12 cells. Phytother. Res. 2010, 25, 435–443. [Google Scholar] [CrossRef] [PubMed]
Figure 1. The strategy for identifying Q-markers based on the chemometric analysis and network pharmacology.
Separations 11 00088 g001
Figure 2. The characteristics of S. chinensis during fruit maturation.
Separations 11 00088 g002
Figure 3. Representative base peak intensity chromatograms of the extract of S. chinensis derived from UPLC-Q-Extractive Orbitrap/MS.
Separations 11 00088 g003
Figure 4. Analysis maps of seven batches of S. chinensis with different harvesting times: (A) score plots of the PCA model; (B) the score plots of the OPLS-DA model; (C) cross-validation plot of the OPLS-DA model; and (D) VIP values of the compounds.
Separations 11 00088 g004
Figure 5. The target network of S chinensis. (A) Venn diagram of compounds and liver-related disease targets; (B) enrichment diagram of GO terms; (C) bubble diagram of the KEGG pathway; (D) C-T-D network (the purple diamond represents the compounds, the yellow circle represents potential targets, and the pink square represents diseases).
Separations 11 00088 g005
Figure 6. Combination effects between lignans and PIK3CA. (A) Compound 18 (schisantherin B), (B) positive control (DDB), and (C) compound 26 (schisandrin C).
Separations 11 00088 g006
Figure 7. Effect of the six compounds on the protective effect in CCl4-induced BRL-3A cells (the red fluorescence represents dead cells and the green fluorescence represents live cells). (A) Results of cell viability. The results represent the mean ± SD (n = 3), vs. normal control ### p < 0.001.vs. model ** p < 0.01, *** p < 0.0001. (B) The Calcein-AM/PI staining results of BRL-3A cells. (6) schisandrol A, (10) angeloylgomisin H, (17) schisantherin A, (18) schisantherin B, and (23) schisandrin C.
Separations 11 00088 g007
Figure 8. Fluorescence staining results of TRITC-phalloidin. Cells are displayed using DAPI (nuclear, blue) and phalloidin (fibrin filament, red) staining. The scale bar is 100 μm. (6) Schisandrol A, (10) angeloylgomisin H, (17) schisantherin A, (18) schisantherin B, and (23) schisandrin C.
Separations 11 00088 g008
Figure 9. The chemical structures of the six Q-markers (A) and the HPLC chromatogram of seven batches of S. chinensis obtained from different harvest times (B). Peaks: (6) Schisandrol A, (10) aneloylgomisin H, (17) schisantherin A, (18) schisantherin B, (23) schisandrin A, and (26) schisandrin C.
Separations 11 00088 g009
Table 1. Identification of the chemical constituents of S. chinensis using UPLC-Q-Extractive Orbitrap/MS.
No.tR (min)Ion ModeFormulaDetected (m/z)Fragment IonsIdentification
11.66[M + H]+C9H11NO2166.0862120.0810Phenprobamate [15]
24.38[M + NH4]+C29H37O11578.2590437.1958, 419.1843Micrandilactone D [38]
34.44[M + NH4]+C29H36O10562.2643527.2226Henridilactone D [15]
45.38[M + NH4]+C23H30O7436.2325401.1953, 386.1714, 370.1767, 369.1691Gomisin H [15]
56.06[M + NH4]+C29H34O9544.2539467.2049, 449.1954Lancifodilactone D [38]
66.50[M + H]+C24H32O7433.2106415.2111, 384.1926, 369.1691, 353.1743,Schisandrol A [39]
76.74[M + H]+C28H34O10531.2219485.2157, 401.1588, 383.1483Gomisin D [39]
86.85[M + H]+C22H28O6389.1951357.1690, 287.0912, 227.0699, 199.0752Gomisin J [39]
97.09[M + NH4]+C23H28O7434.2169399.1795, 368.1614, 353.1376, 330.1093Schisandrol B [39]
107.60[M + H]+C28H36O8501.2476483.2371, 401.1953Angeloylgomisin H [38]
118.09[M + H]+C28H36O8501.2476483.2373, 401.1953, 370.1764Tigloylgomisin H [38]
128.39[M + NH4]+C31H36O9570.2692431.2058, 387.1794, 356.1611Benzoylgomisin Q [15]
138.68[M + NH4]+C30H32O9554.2379415.1745, 371.1483, 340.1301, 325.1064Gomisin G [39,40]
148.91[M + NH4]+C28H34O9532.2537415.1745, 371.1483, 340.1300, 325.1065Angeloylgomisin P [41]
159.18[M + H]+C23H30O6403.2111371.1842, 340.1655Gomisin K1 [40]
169.31[M + NH4]+C28H34O9532.2535415.1746, 371.1484, 340.1300, 325.1065Gomisin F [42]
179.42[M + NH4]+C30H32O9554.2378415.1747,371.1485, 340.1303, 325.1067Schisantherin A 1 [39,40]
189.60[M + NH4]+C28H34O9532.2535415.1746, 371.1484, 340.1299, 325.1068Schisantherin B [41]
1910.07[M + H]+C23H30O6403.2110371.1848, 340.1666Schisanhenol [40]
2010.26[M + H]+C22H26O6387.1796355.1529, 325.1426, 285.0753Gomisin M2 [39]
2110.68[M + H]+C28H34O9515.2267469.2222, 385.1638, 355.1531Gomisin E [15]
2211.14[M + H]+C20H24O4387.1798355.1540, 227.0699Gomisin L1/L2 [15]
2312.31[M + H]+C24H32O6417.2262402.2232, 386.2072, 316.1302Schisandrin A [15]
2413.23[M + H]+C23H28O6401.1952386.1717, 331.1169, 300.0989, 285.0754Gomisin N [42]
2513.58[M + H]+C23H28O6401.1951386.1716, 331.1170, 300.0988, 285.0754Schisandrin B 1 [15,42]
2614.25[M + H]+C22H24O6385.1642355.1533, 315.0857, 285.0755Schisandrin C [15]
2714.77[M + NH4]+C30H32O8538.2434399.1796, 368.1613, 353.1372, 337.1426, 330.1092, 299.0907Benzoylgomisin O [40]
280.84[M − H]C6H8O7191.0186129.0180, 111.0074Quinic acid [43,44]
291.25[M − H]C7H12O6191.0187129.0180, 111.0074Citric acid 1 [44,45]
302.51[M − H]C16H18O9353.0876191.0553, 179.0341, 135.0439, 85.02801-O-caffeoylquinic acid [46]
312.81[M − H]C30H26O12577.1350451.1034, 425.0880, 407,0769, 289.0719Procyanidin B1 [47]
322.90[M − H]C16H18O8337.0928191.0553, 163.03903-O-p-coumaroylquinic acid [42]
333.21[M − H]C16H18O8337.0926191.0553, 173.04455-O-p-coumaroylquinic acid [42]
343.33[M − H]C27H30O16609.1456301.0352, 300.0274Rutin [42]
353.48[M − H]C21H20O12463.0881300.0275Quercetin-3-O-glucoside [42]
363.66[M − H]C21H20O11447.0931284.0328Kaempferol-3-O-gloucoside [42]
1 These compounds were confirmed by standard references.
Table 2. Content of the six Q-markers of S. chinensis obtained based on different harvest times.
GroupQ-Markers (mg/g)Total Content
of Q-Markers
(mg/g)
Schisandrol AAngeloyl-gomisin HSchisantherin ASchisantherin
B
Schisandrin ASchisandrin C
G6.32 ± 0.031.64 ± 0.011.01 ± 0.010.88 ± 0.011.07 ± 0.010.71 ± 0.0111.62 ± 0.05
GP16.28 ± 0.171.57 ± 0.021.01 ± 0.040.87 ± 0.021.06 ± 0.020.71 ± 0.0111.50 ± 0.28
GP25.50 ± 0.051.31 ± 0.010.75 ± 0.010.67 ± 0.010.80 ± 0.010.71 ± 0.019.74 ± 0.10
LR4.78 ± 0.111.28 ± 0.020.60 ± 0.010.65 ± 0.030.86 ± 0.020.55 ± 0.028.71 ± 0.22
R14.75 ± 0.051.42 ± 0.011.03 ± 0.010.91 ± 0.011.20 ± 0.010.52 ± 0.019.83 ± 0.12
R25.72 ± 0.031.48 ± 0.020.82 ± 0.010.63 ± 0.011.20 ± 0.010.50 ± 0.0110.36 ± 0.02
DR6.29 ± 0.031.72 ± 0.021.06 ± 0.041.25 ± 0.110.94 ± 0.010.73 ± 0.0211.99 ± 0.20
Disclaimer/Publisher’s Note: The statements, opinions and data contained in all publications are solely those of the individual author(s) and contributor(s) and not of MDPI and/or the editor(s). MDPI and/or the editor(s) disclaim responsibility for any injury to people or property resulting from any ideas, methods, instructions or products referred to in the content.

