
Recovery of Omega-3-Rich Lipids: Toward the Sustainable Valorization of Sea-Bass Industry Side Streams


Laboratory of Food Chemistry and Technology, School of Chemical Engineering, National Technical University of Athens, 5 Heroon Polytechniou Str., 157 80 Athens, Greece
*
Author to whom correspondence should be addressed.
Separations 2024, 11(4), 101; https://doi.org/10.3390/separations11040101
Submission received: 11 March 2024
/
Revised: 26 March 2024
/
Accepted: 27 March 2024
/
Published: 28 March 2024
(This article belongs to the Section Analysis of Natural Products and Pharmaceuticals)
Abstract
:This study pertains to the selection of the appropriate process parameters of lipid extraction aimed at the valorization of sea-bass gutting and filleting side stream biomass. A comparative kinetic study between an environmentally friendly polar (ethanol) and a conventional non-polar solvent (hexane) was implemented to determine the effect of temperature, solvent to solid ratio and time, providing insights in terms of the yield recovery and quality of omega-3 fatty acids. Maximum recovery yield (43.8 and 34.0 g/100 g of dried gutting and filleting by-products, respectively) was achieved within 10 min. In gutting by-products, ethanol achieved full lipid recovery at 35 °C and a 50:1 ratio, while for hexane, the maximum yield was 83%. In the case of filleting side-streams, hexane achieved exhaustive recovery at a 50:1 ratio and 20 °C compared with ethanol, where a higher temperature (50 °C) was needed for exhaustive recovery to be achieved. Differences were attributed to the diverse fatty acid profiles among the two by-products, with 27.3% and 40.8% polyunsaturated fatty acids in viscera and fish frames, respectively. All extracts at 20 °C and 35 °C remained below the oxidation limit set by the Codex Alimentarius Commission (peroxide value < 5 ; p-anisidine value < 20). Therefore, green solvents could assist conventional extraction, combining high efficiency and an improved environmental impact.
1. Introduction
Global demand for fish products has been characterized by about a 3% annual increase over the last 60 years, reaching 20.5 kg per capita consumption in 2019. Aquaculture and fisheries are rapidly expanding and rising as the major food sectors as a result of technological advancements in the sector, as well as consumer preferences shifting toward the consumption of fish products due to their high nutritional content. The yearly production of aquatic animals was estimated at 180,000 tons in 2020 [1,2]. In particular, the total annual production of European sea bass (Dicentrarchus labrax), which is classified as a high-quality Mediterranean fish and mainly farmed in the Mediterranean Sea [3], increased up to 4-fold in the last 20 years, reaching 245 ktons in 2020, which represented 3% of the total world aquatic species [1]. Almost 54 ktons of European sea bass were cultured in Greece, representing 17% of the global and 53% of the EU supply [4].
The increasing demand for high-quality fish products in conjunction with the expansion of fish processing (evisceration, scaling and filleting) are resulting in the significant production of fish side-stream biomass that is discarded or underutilized, mainly for the production of fish meal and fertilizers. It is estimated that about one-third of the global fish catch is wasted or lost annually. The main fish by-products, which are valuable sources of omega-3 fatty acids, proteins, minerals and vitamins, comprise viscera (representing up to 20% of the initial fish weight), bones (up to 15%), heads (up to 12%) and scales (up to 5%) [1,2,5,6]. Fatty acid composition varies among the different parts of the side streams, with mono-unsaturated fatty acids (MUFAs), and especially oleic acid (C18:1), representing the dominant fatty acid. Sea-bass gut and liver exhibit the highest amount of MUFAs compared with other by-products and fillets [7,8,9].
Fish-oil production constitutes an alternative for the valorization of fish residues, and fish oil is one of the most important fish products, since it is a rich source of omega-3 polyunsaturated fatty acids (PUFAs), mainly docosahexaenoic acid (C22:6, DHA) and eicosapentaenoic acid (C20:5, EPA), which are necessary bioactive compounds for human nutrition [5,10]. Fish oil is mainly used in aquaculture as a feed additive (73%), in the food industry (16%) and in the pharmaceutical industry, and it also appears in other applications such as pet food and biofuels. In terms of human consumption, it constitutes about 2% of the total fats and oils consumed worldwide. Fish-processing side streams contribute 48% of the total fish-oil production, while the remaining 52% comes from whole fish that are not intended for food purposes [1,6,10,11]. In terms of whole-fish species, oil production mainly comes from small oily pelagic fish such as anchovy, herring, sand eel and capelin, while viscera, heads and frames are the main side streams used for oil production and are usually derived from salmon, tuna, mackerel and whitefish processing. The contribution of by-products to oil production is expected to increase by up to 7% in the next decade, while the use of whole fish is expected to slightly decrease. South America, especially Peru and Chile, are the main producers worldwide, and Europe covers 21% of the production, which corresponds to approximately 170 million tons [11,12,13].
Fish oil can be obtained through wet-reduction technology which involves three processes, namely heating/cooking, pressing and centrifugation to separate the insoluble parts, the water and the oily phase. Another commonly used industrial process includes heating up to 90 °C followed by a one-step (using a tricanter) or a two-step separation process (decanter and separator of the two liquid phases), which results in an extract of higher quality in terms of oxidation level and concentration of free fatty acids [1,6,14]. However, both heating and pressing can be detrimental to fish oils, which are rich in unsaturated fatty acids. Apart from the aforementioned extraction methods, which are characterized as physical processes, fish lipid extraction can also be achieved by biological/enzymatic and chemical methods. Enzymatic production takes place either as autolysis, when the enzymes come from endogenous enzymes from fish guts, or as hydrolysis, using external enzymes from other sources. Autolysis is mainly used for fish silage production with the simultaneous recovery of fatty acids. On the other hand, external enzymes during hydrolysis constitute a low-cost alternative to oil production, leading to higher recovery yields compared with wet reduction, a shorter time and a more controllable process compared with autolysis [6,14,15]. Fish oil is usually extracted from fish tissues via the conventional chemical procedure, using solvents. Lipids in fish tissues can be either easily extractable or in interaction with proteins and polysaccharides as part of the membranes. Solvents penetrate into the fish tissues, disrupt the interaction between the fatty acids and the other components and dissolve the targeted compounds [14]. In the case of lipid recovery, the most commonly used solvents are non-polar, the main one being hexane, which is used on a large scale due to its high selectivity in non-polar compounds, its availability and its low boiling point. The main concern regarding these solvents is the toxicity both for humans and the environment, and the requirement for high temperatures, which can negatively affect the heat-sensitive compounds (e.g., fatty acids) [5,14,16,17]. Based on a benchmark of existing guides, the solvent selection guide (CHEM21) categorized the most common solvents in the following categories: recommended/preferred, problematic, hazardous and highly hazardous [18]. In this framework, environmentally friendly solvents have been introduced as alternatives to recover bioactive compounds from animal and plant tissues. Currently approved by the European Commission and the Food and Drug Administration (FDA) for use in the food sector, hexane has been questioned as hazardous and a non-preferred solvent [19]. Organic green solvents mainly comprise ethanol, 1-propanol, isopropyl alcohol and terpenes and are characterized by low toxicity, easy recyclability and high boiling points. The food industry would benefit from adopting environmentally friendly solvents. Opting for the use of ethanol aligns with conscious practices, especially if it is sourced sustainably. Compared with other solvents, ethanol is generally considered safer, due to its relative non-toxicity, for use in food and pharmaceutical applications, and it has been classed as generally recognized as safe (GRAS). Moreover, in terms of residual removal, its residues are easier to remove, producing cleaner final products. Ethanol has been used as a solvent during oil recovery from krill meal [20], shrimp by-products (Litopenaeus vannamei) [21] and squid (Doryteuthis gahi) waste [22], showing it to be a promising alternative to conventional lipid extraction.
The aim of this work was to study and compare the effect of a green solvent (ethanol) with its conventional non-polar counterpart (hexane) on the extraction of fatty acids from sea-bass filleting and gutting side streams as a means for efficient valorization. A kinetic study was conducted, and the recovery of fatty acids was mathematically modelled as a function of temperature, solvent to solid ratio and time for each solvent applied.
2. Materials and Methods
2.1. Raw Materials and Solvents
2.1.1. Raw Materials
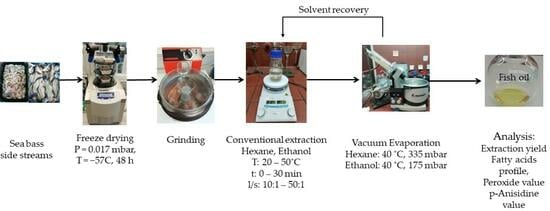
Fresh sea bass (Dicentrarchus labrax) gutting and filleting (frames) side streams were provided by SelectFISH S.A. (Ano Liosia, Athens, Greece), consisting of heads, skin, bones and tails in the case of filleting by-products, and viscera (guts, liver, heart, stomach) in the case of gutting by-products. The raw material was transferred to the laboratory of Food Chemistry and Technology, stored at −40 °C and then lyophilized in a freeze-dryer (Christ Alpha 1-4 LD Plus, Osterode am Harz, Germany) at P = 0.017 mbar and T = −57 °C for 48 h. The freeze-dried raw materials were milled for 10 s using a knife mill. Samples were stored at −40 °C until oil extraction.
2.1.2. Solvents and Reagents
The solvents used for the analysis of the extracts were acetyl chloride (≥99.0%) from Fluka, Sigma-Aldrich (Stockholm, Sweden). Methanol (≥99.9%), ethanol (≥99.9%), toluene (≥99.0%), n-hexane for HPLC (≥95%), acetic acid glacial (100%) and chloroform (≥98.0%) were obtained from Sigma-Aldrich (Steinheim, Germany). For the GC–MS analyses, a FAME standard mixture (Supelco 37 Component fatty acid methyl esters mix, Sigma-Aldrich, Steinheim, Germany) was used to quantify the fatty acids in the samples. In addition, a C7–C30 alkane mixture (Sigma-Aldrich, Steinheim, Germany) was analyzed for the determination of retention indices, while the extracted oil was diluted in 2,2,4-trimethylpentane (Sigma-Aldrich, Steinheim, Germany) prior to GC–MS analysis.
2.2. Methods
2.2.1. Total Oil Content—Soxhlet
The total oil content of both filleting and gutting by-products was defined using Soxhlet extraction for 8 h and hexane as a solvent, according to performed preliminary trials. Then, the solvent was evaporated in a rotary vacuum evaporator (BUCHI 461, Buchi Laboratotiums Technik AG, Flawil, Switzerland) at 45 °C. Hexane has been reported as a common solvent for the determination of total lipids in fish and seafood products.
2.2.2. Conventional Extraction
Screening of solvents with different polarity index (P′) values, such as hexane (P′ = 0.1), diethyl ether (P′ = 2.8), isopropyl alcohol (P′ = 3.9), ethanol (P′ = 4.3) and acetone (P′ = 5.1), was conducted at 35 °C and a 50:1 solvent to solid ratio in order to select and compare one polar and non-polar solvent for the kinetic study of fish-oil extraction. The results from the preliminary study can be seen in Supplementary Figure S1. Conventional extraction (CE) was carried out using ethanol and hexane at temperatures of 20, 35 and 50 °C for up to 30 min at different liquid/solid ratios (10:1 mL/g–50:1 mL/g). The samples and solvent were placed in cylindrical, capped glass containers (⌀5 cm × 8.5 cm) under constant agitation (180 rpm). Aliquots were withdrawn from the suspensions at predetermined time intervals, and the extraction yield was calculated. The mixtures of raw material (fish by-products) and solvent were separated by filtration through Whatman No. 42 filter paper. The solvent was removed from the recovered fish oil with a rotary vacuum evaporator.
2.2.3. Extraction Yield—Oil Recovery Determination
Oil recovery, expressed as % total fatty acid (FA) refers to the extractability (extraction yield), which is calculated as the percentage of the mass of extracted oil out of the total lipid content in dried raw sea-bass by-products as determined by Soxhlet extraction (Equation (1)).
2.2.4. Oil Quality Determination and Fatty Acid Analysis
Quality parameters of the extracted fish oil, namely the peroxide value (PV) and p-anisidine value (p-AV), were determined according to AOCS official standards. Specifically, the PV method was carried out according to AOCS method Cd 8–53 [23], and the p-AV method according to AOCS method Cd 18–90 [24]. Fatty acid analysis was carried out based on the method described by Semenoglou et al. [5] via the direct transesterification of fatty acids (FAs) extracted from sea-bass by-products.
2.3. Mathematical Modeling
Oil recovery was modelled using a first-order fractional model (Equation (2)):
where is the extraction yield at extraction time t, is the maximum extraction yield achieved at each condition of temperature and ratio, t is the extraction time and k is the extraction rate constant (min−1).
Mathematical model coefficients were calculated by applying non-linear regression on the experimental data using the SPSS Statistics 19 software package (IBM Corporation, Armonk, NY, USA).
2.4. Statistical Analysis
All experiments and analyses were carried out in duplicate. One- or two-way analysis of variance (ANOVA) was carried out at a significance level of 95% to determine statistically significant differences using temperature and/or ratio as factors. Differences were determined according to the Duncan test with STATISTICA 12.0 (StatSoft Inc., Tulsa, OK, USA). Values were considered significant at p < 0.05.
3. Results and Discussion
3.1. Oil Content and Fatty Acid Composition of Raw Materials
The total lipid content of sea-bass filleting and gutting side streams was determined via Soxhlet extraction with hexane as the solvent, as described in Section 2.2.1. The raw materials were found to contain 43.8 ± 2.3 and 34.0 ± 0.2 g oil/100 g of dried gutting and filleting by-products, respectively. The higher calculated oil content in the viscera (guts and gills) compared with the head, bones and skin is in agreement with the results reported by Munekata et al. [9].
The major fatty acids of the different raw materials, expressed as percentages of the total fatty acid content, are presented in Table 1. Filleting and gutting side streams were rich in both unsaturated (UFAs) and saturated fatty acids (SFAs). Monounsaturated fatty acids represented 46% and 42% in the case of frames and viscera, respectively. Oleic acid (C18:1 n-9) was the major fatty acid (35–36%) in both types of side streams. The main differences observed between the two raw materials were regarding the total amount of SFAs and PUFAs. Guts were characterized by higher PUFA (41%) and lower SFA content (17%) compared with fish frames, with almost equal SFA and PUFA concentrations (26.9% and 27.3%, respectively). The dominant omega-3 fatty acids in both raw materials were docosahexaenoic acid (DHA, C22:6 n-3) and eicosapentaenoic acid (EPA, C20:5 n-3). DHA constituted 12.8 and 7.0% in the case of gutting and filleting by-products, and EPA constituted 9.1 and 3.5%, respectively. These findings are in agreement with other studies that reported similar fatty acid compositions in different parts of sea-bass products, apart from linolenic acid (C18:3 n-3), which represented up to 3.3% in the aforementioned studies and which was not detected in our study [9,25,26]. The fatty acid profile of fish species varies with the seasonality, diet, age, salinity of water and conditions of growth (open sea vs cultured) [27,28,29].
3.2. Lipid Extraction Kinetics
Figure 1a–f and Figure 2a–f present the kinetics of lipid extraction from gutting and filleting tissues, respectively, expressed as the oil recovery as a function of extraction time for all the examined parameters (temperature, solvent, and solvent to solid ratio). Oil recovery significantly increased with time and reached equilibrium within the first 10 min. Oil extraction consists of two different phases: the washing of the available lipids from the surface, in which the recovery takes place rapidly, and another phase that includes the diffusion of the bioactive molecules within the tissues, which occurs at a much slower rate compared with the first phase [30,31]. Based on the results, it was evident that the washing step was completed within the first 4 min of extraction.
Solvent polarity significantly affected the recovery of total oil within the different by-products. In the case of viscera, ethanol (polar solvent) resulted in significantly higher yields (p < 0.05) compared with hexane (non-polar solvent) at each temperature and liquid to solid ratio. Ethanol as a solvent achieved near-exhaustive oil recovery at a ratio of 50:1, both at 35 °C (96.4% of total fatty acids) and 50 °C (99.6%). The highest yield with the use of the non-polar solvent was 83.6% at the highest temperature and ratio used. On the other hand, in the case of filleting side streams, the use of hexane as a solvent was more effective compared with ethanol, as exhaustive oil recovery was achieved after 20 min, even at the lowest temperature (20 °C), using a ratio of 50:1. However, an increased temperature (50 °C) was necessary for complete lipid recovery by the green polar solvent from these side streams after 10 min at a ratio of 50:1. Although ethanol is classified as a polar solvent and is completely miscible in water, it effectively dissolves non-polar components such as fatty acids due to the molecular structure exhibiting both non-polar (ethyl) and polar (hydroxyl) properties [30].
The differences observed in the total oil recovery from gutting and filleting by-products with the two solvents could be explained based on the fatty acid composition of the raw materials. As reported in Table 1, filleting side streams consisted of almost equal concentrations of SFAs and PUFAs, while gutting side streams consisted of 41% PUFAs and only 17% SFAs. Triacyclglycerols and, in general, the neutral (non-polar) lipids comprise the major proportion of fatty acids in every fish tissue and are mainly found in muscle and adipose tissues, followed by the phospholipids (polar lipids) of the cellular membranes at variable concentrations, which strongly depend on the diet of the fish and the seasonality [29,32]. In general, phospholipids contain lower amounts of SFAs and higher amounts of PUFAs, and especially omega-3 fatty acids (DHA, EPA), compared with triacylglycerols, which are mainly characterized by SFAs and medium chain MUFAs [20,33]. Delgado et al. [33] reported that there is an abundance of membranes in muscle cells and, consequently, an abundance of phospholipids which contain high proportions of PUFAs. In this context, Takahama et al. [34] tested about 40 different white-flesh fish species and concluded that the phospholipid content in both liver and heart, which were part of our gutting side streams, was up to 2-fold higher compared with the respective lipids in muscle. Regarding the heart, phospholipids represented 9–58% of the total fatty acids, depending on the fish species, while in the case of liver, they represented up to 50%. In another study, polar lipids represented about 13% of the total fatty acids in sea-bass viscera [32]. Similar results were also reported, as the highest recovery yields were achieved from krill meal with the use of polar solvents (ethanol or isopropanol) compared with hexane at a ratio of 12:1 [20]. Higher fatty acid extractability with a polar solvent compared with a non-polar solvent has also been reported in the case of different shrimp by-products (Penaeus vannamei and Procambarus clarkia [35], Litopenaeus vannamei [21]). In addition, higher recovery was achieved using a mixture of ethanol and hexane compared with using only the non-polar solvent, hexane, in a ratio of 4:6 followed by layer separation [36].
Oil recovery from the different side streams was modelled using Equation (2), and the maximum extraction yield achieved () and rate constant (k) are presented in Table 2 and Table 3, respectively for the selected parameters (solvent, extraction temperature and solvent to solid ratio). These kinetic results were used to calculate the predicted recovery for each case, based on Equation (2), which are presented as continuous lines in Figure 1 and Figure 2. The model fitted well the experimental data, with coefficients of determination (R2) of higher than 0.95.
The maximum oil recovery corresponds to the final yield achieved at the end of the extraction process. Regarding the effect of temperature, increasing temperature resulted in higher recovery for all the different conditions. In general, the effect of temperature was more significant in the case of ethanol compared with hexane. However, opposite results were observed at the ratio of 10:1, as the temperature increase from 20 to 50 °C raised the maximum total fatty acid recovery, using hexane as a solvent, from 30.5% to 45.0% (47% higher yield). The use of the highest temperature enhanced the maximum yield of oil extracted with ethanol from filleting side streams by 27.3%, 43.9% and 36.7% at a ratio of 10:1, 30:1 and 50:1, respectively, compared with the lowest temperature. The respective increase with hexane was equal to 23.3%, 13.9% and 1.8%. In terms of the viscera, the highest temperature increased the yield with ethanol as the solvent by 15.9%, 22.3% and 22.7% at 10:1, 30:1 and 50:1, respectively, and by 19.7% and 12.9% with the use of hexane at a ratio of 30:1 and 50:1. An increase in temperature leads to lower viscosity, which enhances solvent penetration into the matrix, and to higher solute solubility to the solvent due to the higher vapor pressure. However, heat-sensitive compounds, e.g., polyunsaturated fatty acids, can be thermally degraded at relatively higher temperatures [5,37,38]. The positive effect of temperature on oil yield has also been reported in the case of the recovery from fish discards with ethanol as solvent at 90 °C (31 g oil per 100 g of dry material) compared with 70 °C (13 goil/100 gd.m.) [39]. On the other hand, Iberahim and Tan [40] noticed an increase in the recovery yield when the temperature was raised from 50 °C to 70 °C due to the higher volatility and dissolving capacity of the solvent (mixture of hexane–isopropanol), but even higher temperatures (up to 90 °C) reduced the oil yield because of the lower solvent density.
Increasing the solvent to solid ratio enhanced the mass transfer phenomena since the concentration gradient between the liquid and the solid phase became higher, which accelerated the diffusion. The increase in the ethanol to solid ratio from 10:1 to 50:1 enhanced by 64.5–69.4% the maximum oil recovery from filleting side streams and 59.4–68.9% from the gutting by-products. Comparing the highest (50:1) with the lowest (10:1) hexane to sample ratios, these resulted in an 83.2–139.6% and 25.1–38.2% higher recovery in terms of fish viscera and frames, respectively. A similar increase in yield was reported with krill oil when the ratio of the ethanol-hexane solvent mixture was increased from 5:1 to 25:1, in which the entire lipid recovery was obtained [36].
In terms of the rate constants, it can be concluded that the type of by-product significantly affected this parameter (p < 0.05). The extraction rates from the viscera were higher than the respective from the fish frames. The differences could be explained by the lower particle size of the guts compared with the size of the frames. The bigger size of the raw material demonstrates higher intracellular diffusion resistance. In addition, the use of the non-polar solvent resulted in more intense oil recovery rates in comparison with the polar solvent, apart from the extraction from gutting by-products at 50 °C and 10:1, in which no statistically significant differences were observed between the different solvents. In terms of filleting by-products, using hexane, higher values of rate constants were obtained (increase of 13–192%) compared with ethanol, while in the case of the gutting side streams, the respective increase was up to 52%. According to the ANOVA analysis, solvent to solid ratio did not significantly (at a confidence level of 95%) influence the rate constants. Even though there are no similar studies that mathematically model the oil recovery from fish tissues using conventional solvent extraction, some published studies have been carried out on the extraction from plant tissue, demonstrating similar extraction curves. The extraction rate constants with ethanol ranged from 0.03 to 0.14 min−1 depending on the temperature (30–60 °C), moisture content (0–8.7%) and particle size (0.94–2.80 mm), in the case of Jatropha curcas [30], and from 0.3 to 0.7 min−1 in the washing step of the extraction from soybean depending on temperature [41].
3.3. Fatty Acid Composition of the Extracts
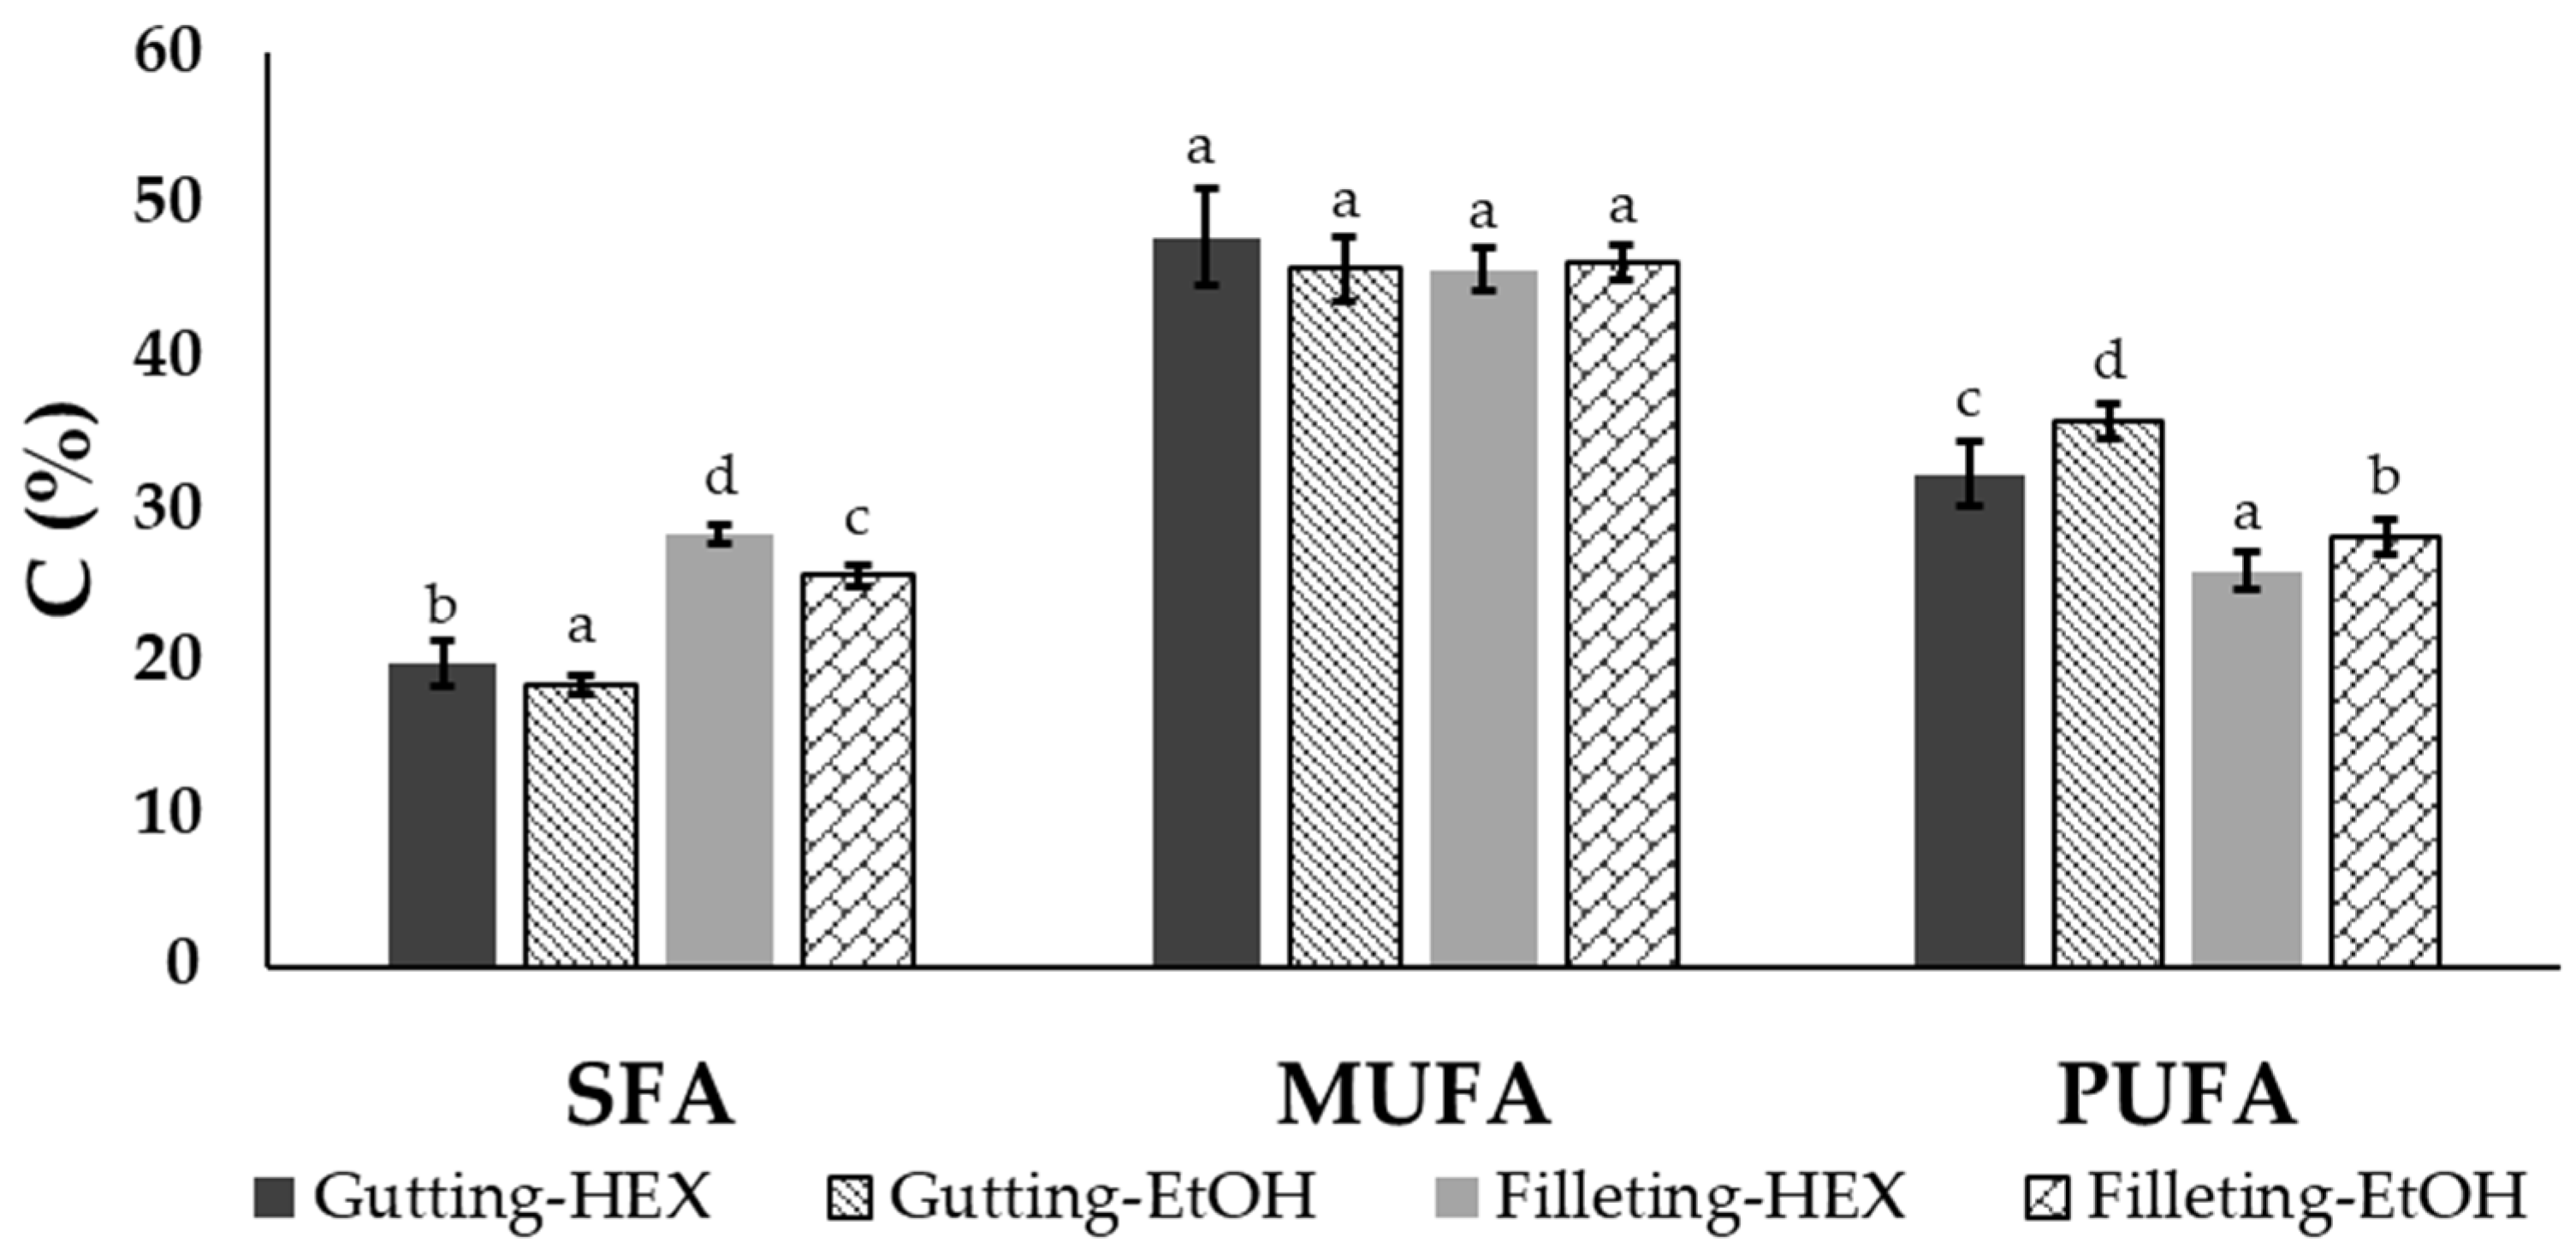
The extracted oil from the filleting and gutting side streams was rich in MUFAs, representing 45.7–47.8% of the total fatty acids in both by-products. The filleting side streams consisted of almost equal concentrations of SFAs and PUFAs, while the gutting side streams consisted of less than 20% SFAs and were rich in PUFAs for both solvents. In Figure 3, the total concentration of SFAs, MUFAs and PUFAs is presented for the two by-products and the two solvents at the lowest temperature (20 °C) and solvent to solid ratio (50:1) used. Since neither temperature nor ratio affected the fatty acid composition, the data are not shown.
According to the results, apart from the differences observed between the different by-products, the solvent selection influences the total amount of the recovered SFAs and MUFAs. More precisely, in the case of the viscera, SFAs represented 18.5% and 19.9% of the oil extracted with ethanol and hexane, respectively, while PUFAs represented 35.8% and 32.3% of that extracted with the polar and the non-polar solvents, respectively. It has been reported that non-polar solvents like hexane are more efficient for the recovery of triacylglycerols while polar solvents are more efficient for phospholipid extraction [14,17,42]. Thus, the differences observed with the different solvents could also be explained based on the aforementioned analysis of Section 3.2 relating to the lipid classes (phospholipid and triacylglycerols) contained in fish tissues. A similar effect on the fatty acid profile of extracts using ethanol compared with hexane as the solvent has also been reported in the case of shrimp by-products [35], krill [36] and krill meal [20].
3.4. Oxidation Level of the Extracts
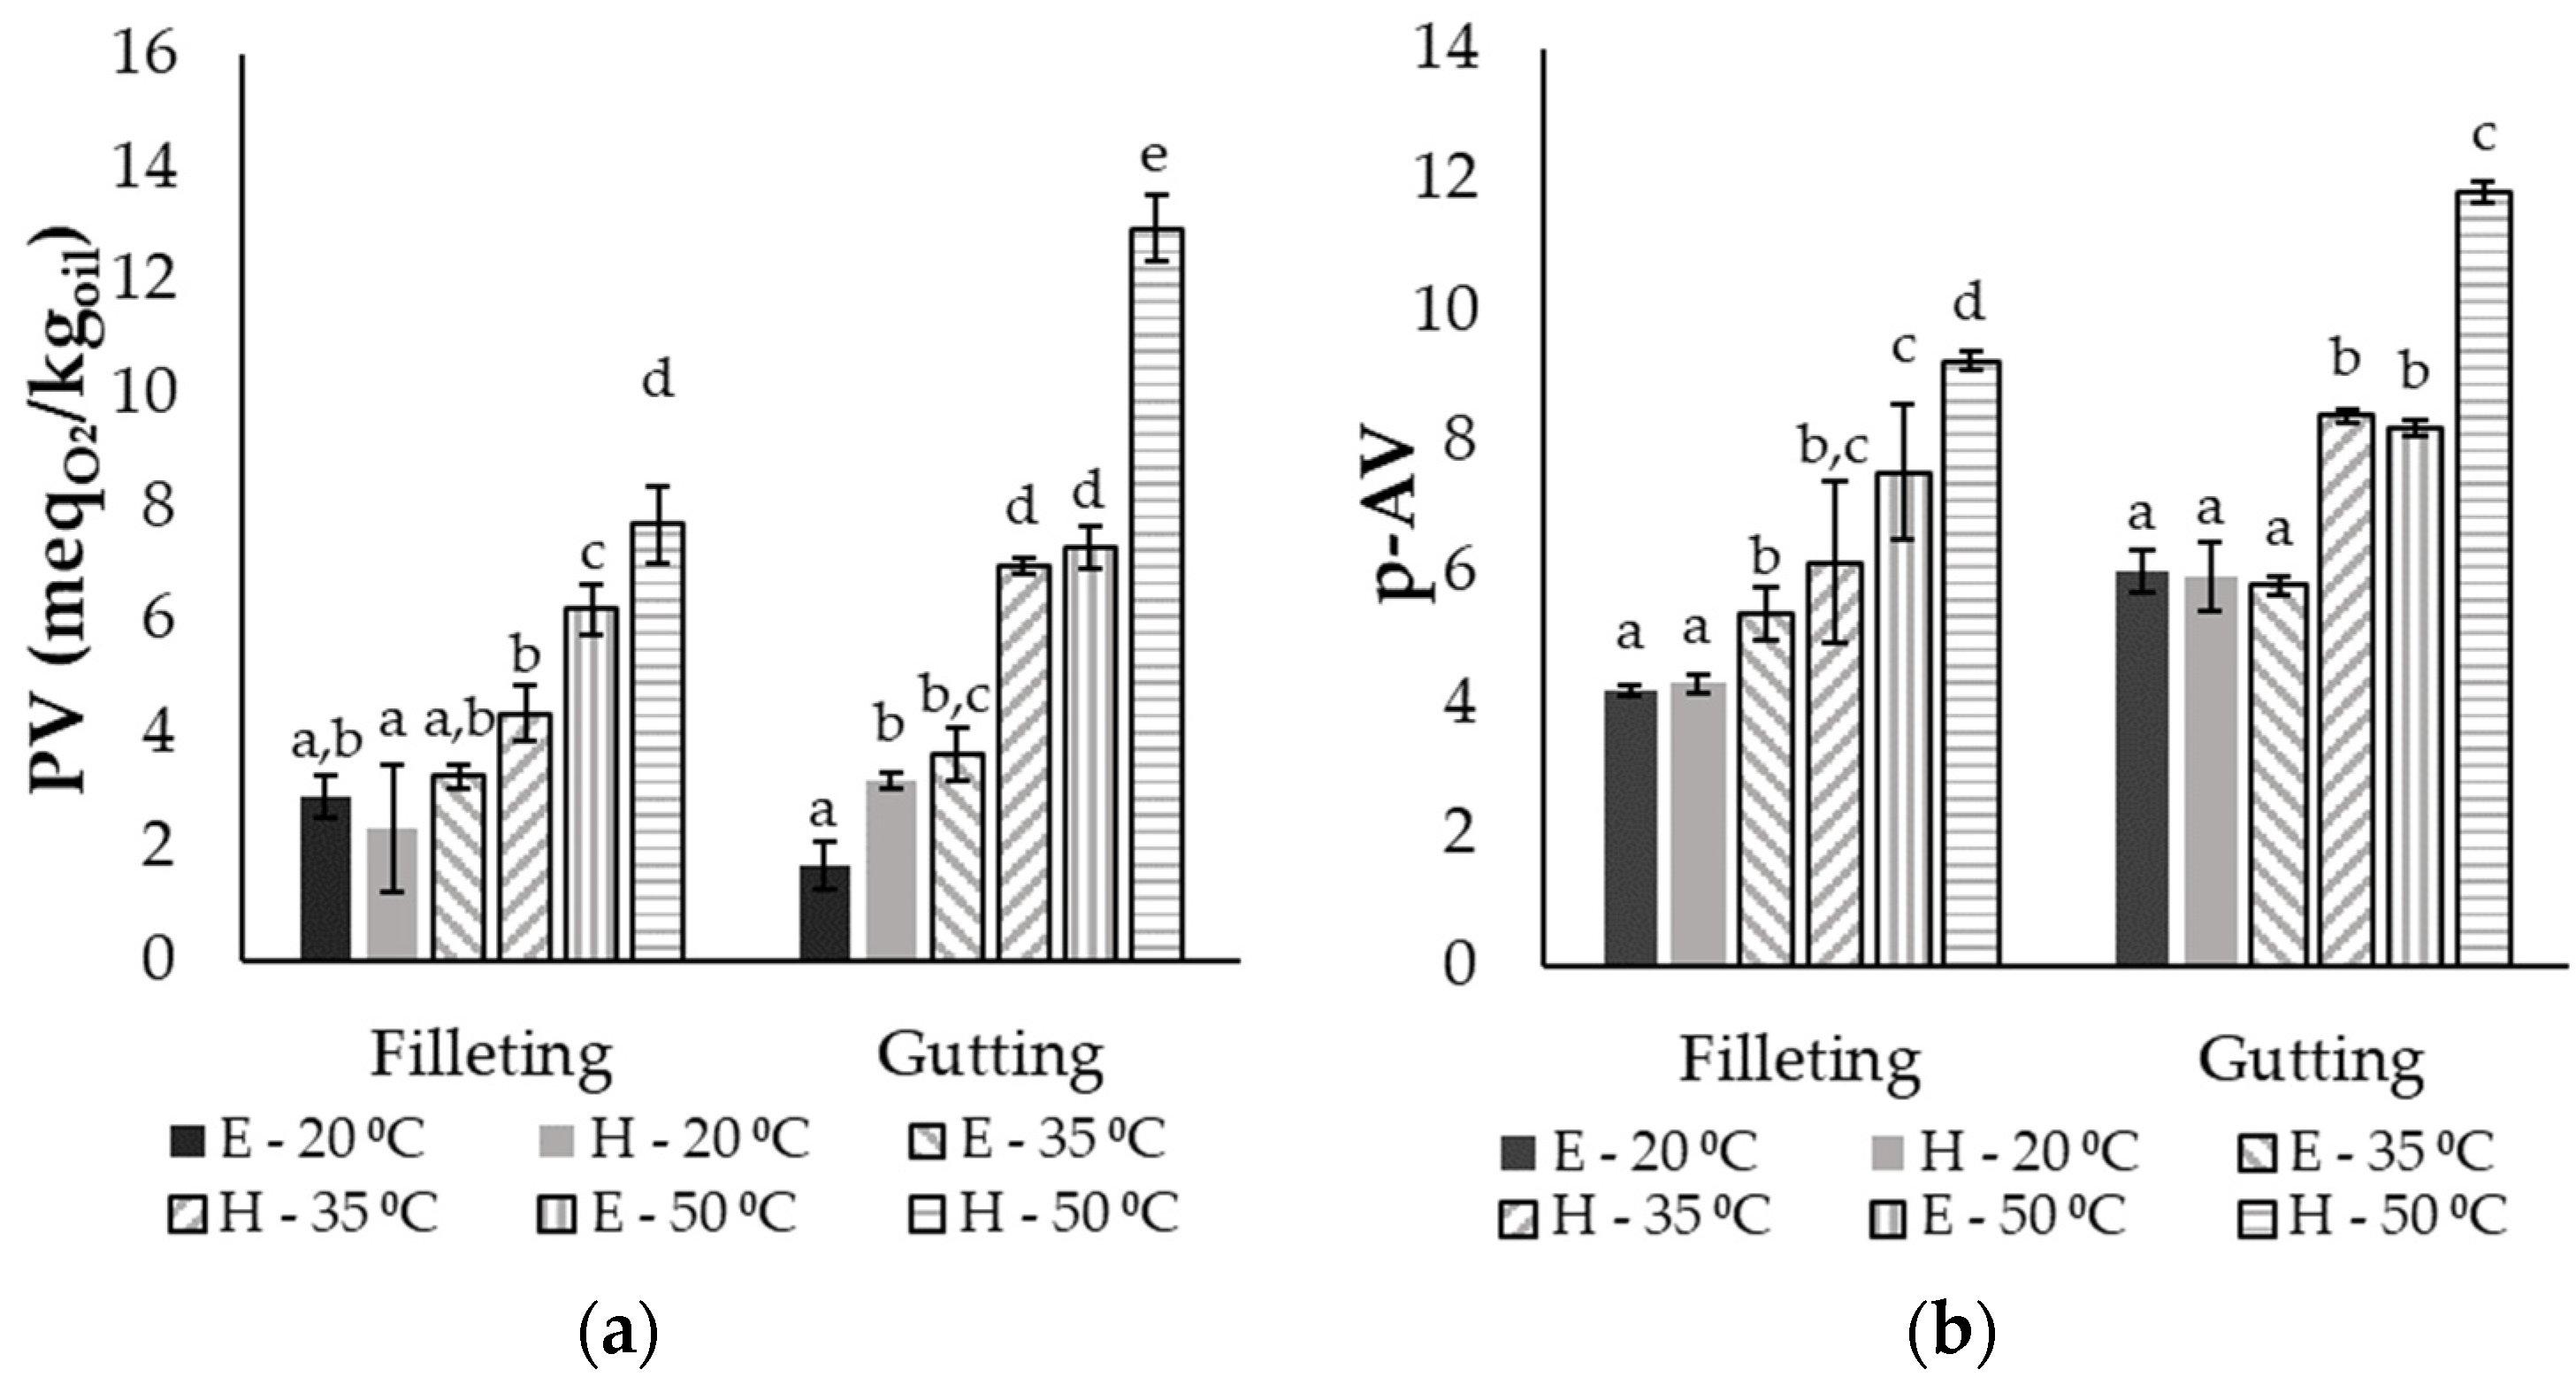
Fish oils are rich in UFAs, and thus are highly prone to lipid oxidation. Therefore, the peroxide value (PV) and the p-anisidine value (p-AV) were measured in order to estimate the oxidation level in the different extracts. In Figure 4, all the different parameters are presented for the different by-products, solvents and temperatures after 10 min of extraction, when the maximum recovery was achieved (presented in Section 3.2). Since no statistically significant differences were observed between the different ratios, only the results of the highest ratio (50:1) are shown. In general, significant differences were observed between the extracts from the gutting and the filleting side streams, with the latter exhibiting lower values for the PV and p-AV. This may be attributed to the differences in the fatty acid composition, since the rate of oxidation increases with increasing UFA content in oil [5,43], and the filleting by-products consisted of 73.1% UFA, while the gutting by-products consisted of 83.8% UFA. The hydrogen atoms near the double bonds of UFAs are characterized by low dissociation, facilitating their removal and the production of free radicals, which initiate the lipid oxidation [43].
Based on the results, within the extracts from the same raw material, both the type of solvent and the temperature affected the oxidation level of the extracts expressed through the primary and secondary oxidation products. Increasing the temperature led to higher oxidation levels of oil, and the highest PVs were 7.7 and 12.9 in the case of filleting and gutting side streams, respectively, and 9.2 and 11.8, respectively, in terms of the p-AV. The higher temperature used during the extraction facilitates the aforementioned abstraction of H atoms close to the double C-C bond of the UFAs due to the low energy required [43]. Moreover, the use of hexane as the solvent raised the level of primary (PV) and secondary (p-AV) oxidation products in the extracts, especially at 35 °C and 50 °C. Peroxide values of extracts with hexane were up to two times higher than the respective values with ethanol under the same conditions, while p-AVs were up to 45% higher. These differences could be attributed to the protic character of ethanol compared with the non-polar hexane and the effect of this on the free-radical chain reactions. The first step of auto-oxidation includes the H abstraction and radical formation, and it has been reported that electron transfer, and thus, radical generation, becomes much faster in non-polar solvents than in aquatic or protic polar solvents (such as ethanol) [7,44]. During the final termination step, aprotic solvents (such as hexane) could cause the formation of new radicals instead of stable products due to radical recombination, while protic solvents can stabilize the oxidation products by providing the required protons [44]. It should be also highlighted that the p-AV in all oil extracts was below the limit of 20, which is the maximum recommended value by the Codex Alimentarius Commission for fish oils appropriate for human consumption [45]. The respective limit in the case of PV is equal to 5 , and all the extracts at 20 and 35 °C were below this value, except for the oil from gutting by-products extracted with hexane at 35 °C. Although extraction using ethanol or hexane at 50 °C led to the highest yield values, these fish-oil extracts were more oxidized compared with those extracted at lower temperatures; the PVs and p-anisidine values were above the appropriate limits for human consumption. In order to select the optimum extraction parameters, it is essential to take into account both the oil recovery yield and the oxidation limits based on Codex Alimentarius. Thus, extraction using ethanol at a ratio of 50:1 and at 35 °C can be considered the optimum parameters, as almost 95% total oil recovery from fish frames and viscera was achieved. Sinanoglou et al. [32] reported peroxide values between 2 and 4 for oil extracted with chloroform and methanol from sea-bass viscera.
4. Conclusions
This study underlines the effect of an environmentally friendly solvent on the efficient recovery of bioactive compounds from fish side streams (viscera, fish frames), which could be further used as ingredients in food systems. Sea-bass filleting and gutting by-products are valuable fish oil sources (34.0 and 43.8 g oil/100 g, respectively), especially of omega-3 fatty acids, DHA and EPA (10.5 and 21.9% of the total fatty acids, respectively). To the best of our knowledge, this is the first kinetic study regarding the conventional solvent recovery of fatty acids for the valorization of fish discards, while simultaneously, a comparison of a polar (ethanol) and a non-polar (hexane) solvent was carried out. Based on the results obtained, the polarity of the solvent significantly affects the maximum oil recovery within the two types of by-products due to their different fatty acid composition. Ethanol achieved almost an exhaustive lipid recovery (>96%) at a ratio of 50:1 and at 35 °C and 50 °C in the case of viscera and fish frames, respectively. The increase in both the temperature and the solvent to solid ratio enhanced the maximum yield but did not significantly affect the rate constant. Ethanolic extracts were characterized by higher PUFA and lower SFA concentrations compared with extracts using hexane. The oil recovered with the polar solvent was less oxidized compared with that with the non-polar solvent, especially the extracts at 20 °C and 35 °C; however, all extracts were within the limits adopted for fish oils regarding human consumption. The results highlighted that the use of green solvents for fatty acid recovery is a suitable alternative method for the valorization of sea-bass processing side-streams.
Supplementary Materials
The following supporting information can be downloaded at: https://www.mdpi.com/article/10.3390/separations11040101/s1, Figure S1: (a) Total oil recovery, (b) fatty acids composition and (c) peroxide values of lipids extracted with different solvents from sea bass guts at 35 °C and 50:1 solvent to solid ratio.
Author Contributions
Conceptualization, I.S.; methodology, I.S. and M.K.; software, I.S., M.K. and M.G.; validation, I.S. and M.K.; formal analysis, I.S. and M.K.; investigation, I.S. and M.K.; resources, M.G. and P.T.; data curation, I.S. and M.K.; writing—original draft preparation, I.S. and M.K.; writing—review and editing, M.G. and P.T.; visualization, I.S., M.K., M.G. and P.T.; supervision, M.G. and P.T.; project administration, M.G. and P.T.; funding acquisition, P.T. All authors have read and agreed to the published version of the manuscript.
Funding
This research work was supported by the Hellenic Foundation for Research and Innovation (HFRI) under the 3rd Call for HFRI PhD Fellowships (Fellowship Number: 6251).
Data Availability Statement
The data are unavailable due to privacy restrictrions.
Conflicts of Interest
The authors declare no conflicts of interest.
References
- FAO. The State of World Fisheries and Aquaculture 2022, towards Blue Transformation; FAO: Rome, Italy, 2022; ISBN 9789251363645. [Google Scholar]
- Tsironi, T.; Semenoglou, I.; Taoukis, P. New Product Development from Marine Sources and Side Streams Valorization Using Nonthermal Processing Technologies. In Nonthermal Processing in Agri-Food-Bio Sciences; Režek Jambrak, A., Ed.; Springer: Berlin/Heidelberg, Germany, 2022; pp. 597–621. ISBN 9783030924157. [Google Scholar]
- Semenoglou, I.; Dimopoulos, G.; Tsironi, T.; Taoukis, P. Mathematical Modelling of the Effect of Solution Concentration and the Combined Application of Pulsed Electric Fields on Mass Transfer during Osmotic Dehydration of Sea Bass Fillets. Food Bioprod. Process. 2020, 121, 186–192. [Google Scholar] [CrossRef]
- HAPO. Annual Report: Aquaculture in Greece. 2023. Available online: https://fishfromgreece.com/wp-content/uploads/2023/10/HAPO_AR23_WEB-NEW.pdf (accessed on 26 March 2024).
- Semenoglou, I.; Eliasson, L.; Uddstål, R.; Tsironi, T.; Taoukis, P.; Xanthakis, E. Supercritical CO2 Extraction of Oil from Arctic Charr Side Streams from Filleting Processing. Innov. Food Sci. Emerg. Technol. 2021, 71, 102712. [Google Scholar] [CrossRef]
- Rustad, T.; Storrø, I.; Slizyte, R. Possibilities for the Utilisation of Marine By-Products. Int. J. Food Sci. Technol. 2011, 46, 2001–2014. [Google Scholar] [CrossRef]
- Belitz, H.-D.; Grosch, W.; Schieberle, P. Food Chemistry, 4th ed.; Springer: Berlin/Heidelberg, Germany, 2009; ISBN 9783540699330. [Google Scholar]
- Erkan, N.; Özden, Ö. Proximate Composition and Mineral Contents in Aqua Cultured Sea Bass (Dicentrarchus labrax), Sea Bream (Sparus aurata) Analyzed by ICP-MS. Food Chem. 2007, 102, 721–725. [Google Scholar] [CrossRef]
- Munekata, P.E.S.; Pateiro, M.; Domínguez, R.; Zhou, J.; Barba, F.J.; Lorenzo, J.M. Nutritional Characterization of Sea Bass Processing By-Products. Biomolecules 2020, 10, 232. [Google Scholar] [CrossRef]
- Ivanovs, K.; Blumberga, D. Extraction of Fish Oil Using Green Extraction Methods: A Short Review. Energy Procedia 2017, 128, 477–483. [Google Scholar] [CrossRef]
- FAO. The State of World Fisheries and Aquaculture 2020—Sustainability in Action; FAO: Rome, Italy, 2020; ISBN 9789251055687. [Google Scholar]
- Carvajal, A.K.; Mozuraityte, R.; Fisheries, S. Fish Oils: Production and Properties, 1st ed.; Elsevier Ltd.: Amsterdam, The Netherlands, 2016; ISBN 9780123849472. [Google Scholar]
- Einarsson, M.I.; Jokumsen, A.; Bæk, A.M.; Jacobsen, C.; Samuelsen, T.A.; Pálsson, J.; Eliasen, O. Nordic Centre of Excellence Network in Fishmeal and Fish Oil; Matís: Reykjavík, Iceland, 2019. [Google Scholar] [CrossRef]
- Adeoti, I.A.; Hawboldt, K. A Review of Lipid Extraction from Fish Processing By-Product for Use as a Biofuel. Biomass Bioenergy 2014, 63, 330–340. [Google Scholar] [CrossRef]
- Hathwar, S.C.; Bijinu, B.; Rai, A.K.; Narayan, B. Simultaneous Recovery of Lipids and Proteins by Enzymatic Hydrolysis of Fish Industry Waste Using Different Commercial Proteases. Appl. Biochem. Biotechnol. 2011, 164, 115–124. [Google Scholar] [CrossRef]
- Haq, M.; Chun, B.S. Characterization of Phospholipids Extracted from Atlantic Salmon By-Product Using Supercritical CO2 with Ethanol as Co-Solvent. J. Clean. Prod. 2018, 178, 186–195. [Google Scholar] [CrossRef]
- Sahena, F.; Zaidul, I.S.M.; Jinap, S.; Saari, N.; Jahurul, H.A.; Abbas, K.A.; Norulaini, N.A. PUFAs in Fish: Extraction, Fractionation, Importance in Health. Compr. Rev. Food Sci. Food Saf. 2009, 8, 59–74. [Google Scholar] [CrossRef]
- Prat, D.; Wells, A.; Hayler, J.; Sneddon, H.; McElroy, C.R.; Abou-Shehada, S.; Dunn, P.J. CHEM21 Selection Guide of Classical- and Less Classical-Solvents. Green. Chem. 2015, 18, 288–296. [Google Scholar] [CrossRef]
- European Parliament and the Council of the European Union. 2009/32/EC: Decision of 23 April 2009 on the Approximation of the Laws of the Member States on Extraction Solvents Used in the Production of Foodstuffs and Food Ingredients; European Parliament and the Council of the European Union: Strasbourg, France, 2009. [Google Scholar]
- Xie, D.; Jin, J.; Sun, J.; Liang, L.; Wang, X.; Zhang, W.; Wang, X.; Jin, Q. Comparison of Solvents for Extraction of Krill Oil from Krill Meal: Lipid Yield, Phospholipids Content, Fatty Acids Composition and Minor Components. Food Chem. 2017, 233, 434–441. [Google Scholar] [CrossRef] [PubMed]
- Gulzar, S.; Benjakul, S. Ultrasound Waves Increase the Yield and Carotenoid Content of Lipid Extracted from Cephalothorax of Pacific White Shrimp (Litopenaeus vannamei). Eur. J. Lipid Sci. Technol. 2018, 120, 1700495. [Google Scholar] [CrossRef]
- Aubourg, S.P.; Rodríguez, A.; Trigo, M.; Medina, I. Yield Enhancement of Valuable Lipid Compounds from Squid (Doryteuthis gahi) Waste by Ethanol/Acetone Extraction. Foods 2023, 12, 2649. [Google Scholar] [CrossRef] [PubMed]
- AOCS Official Method Cd 8-53; AOCS: Champaign, IL, USA, 1998.
- AOCS Official Method Cd 18-90; AOCS: Champaign, IL, USA, 2004.
- de la Fuente, B.; Pinela, J.; Calhelha, R.C.; Heleno, S.A.; Ferreira, I.C.F.R.; Barba, F.J.; Berrada, H.; Caleja, C.; Barros, L. Sea Bass (Dicentrarchus labrax) and Sea Bream (Sparus aurata) Head Oils Recovered by Microwave-Assisted Extraction: Nutritional Quality and Biological Properties. Food Bioprod. Process. 2022, 136, 97–105. [Google Scholar] [CrossRef]
- Messina, C.M.; Renda, G.; La Barbera, L.; Santulli, A. By-Products of Farmed European Sea Bass (Dicentrarchus labrax L.) as a Potential Source of n-3 PUFA. Biologia 2013, 68, 288–293. [Google Scholar] [CrossRef]
- Ntzimani, A.; Angelakopoulos, R.; Stavropoulou, N.; Semenoglou, I.; Dermesonlouoglou, E.; Tsironi, T.; Moutou, K.; Taoukis, P. Seasonal Pattern of the Effect of Slurry Ice during Catching and Transportation on Quality and Shelf Life of Gilthead Sea Bream. J. Mar. Sci. Eng. 2022, 10, 443. [Google Scholar] [CrossRef]
- Zotos, A.; Vouzanidou, M. Seasonal Changes in Composition, Fatty Acid, Cholesterol and Mineral Content of Six Highly Commercial Fish Species of Greece. Food Sci. Technol. Int. 2012, 18, 139–149. [Google Scholar] [CrossRef]
- Skalli, A.; Robin, J.H.; Le Bayon, N.; Le Delliou, H.; Person-Le Ruyet, J. Impact of Essential Fatty Acid Deficiency and Temperature on Tissues’ Fatty Acid Composition of European Sea Bass (Dicentrarchus labrax). Aquaculture 2006, 255, 223–232. [Google Scholar] [CrossRef]
- Santos, S.B.D.; Martins, M.A.; Caneschi, A.L.; Aguilar, P.R.M.; Coimbra, J.S.D.R. Kinetics and Thermodynamics of Oil Extraction from Jatropha curcas L. Using Ethanol as a Solvent. Int. J. Chem. Eng. 2015, 2015, 871236. [Google Scholar] [CrossRef]
- Amarante, R.C.A.; Oliveira, P.M.; Schwantes, F.K.; Morón-Villarreyes, J.A. Oil Extraction from Castor Cake Using Ethanol: Kinetics and Thermodynamics. Ind. Eng. Chem. Res. 2014, 53, 6824–6829. [Google Scholar] [CrossRef]
- Sinanoglou, V.; Houhoula, D.; Kyrana, V.; Lougovois, V. Visceral Oil from Farmed Sparus aurata, Dicentrarchus labrax and Diplodus puntazzo as a Source of ω-3 PUFA. Czech J. Food Sci. 2017, 35, 414–423. [Google Scholar] [CrossRef]
- Delgado, A.; Estevez, A.; Hortelano, P.; Alejandre, M.J. Analyses of Fatty Acids from Different Lipids in Liver and Muscle of Sea Bass (Dicentrarchus zabrax L.). Influence of Temperature and Fasting. Comp. Biochem. Physiol. A Physiol. 1994, 108, 673–680. [Google Scholar] [CrossRef]
- Takama, K.; Suzuki, T.; Yoshida, K.; Arai, I.H.; Anma, H. Lipid Content and Fatty Acid Composition of Phospholipids in White-Flesh Fish Species. Fish. Sci. 1994, 60, 177–184. [Google Scholar] [CrossRef]
- Wang, J.L.; Yu, Z.L.; Yin, F.W.; Li, D.Y.; Liu, H.L.; Song, L.; Zhou, D.Y. Comparison of Different Solvents for Extraction of Oils from By-Products of Shrimps Penaeus vannamei and Procambarus clarkia. J. Food Process Preserv. 2021, 45, e15754. [Google Scholar] [CrossRef]
- Sun, W.; Shi, B.; Xue, C.; Jiang, X. The Comparison of Krill Oil Extracted through Ethanol–Hexane Method and Subcritical Method. Food Sci. Nutr. 2019, 7, 700–710. [Google Scholar] [CrossRef]
- Go, A.W.; Pham, T.Y.N.; Ju, Y.-H.; Agapay, R.C.; Angkawijaya, A.E.; Quijote, K.L. Extraction of Lipids from Post-Hydrolysis Spent Coffee Grounds for Biodiesel Production with Hexane as Solvent: Kinetic and Equilibrium Data. Biomass Bioenergy 2020, 140, 105704. [Google Scholar] [CrossRef]
- Mathimani, T.; Uma, L.; Prabaharan, D. Optimization of Direct Solvent Lipid Extraction Kinetics on Marine Trebouxiophycean Alga by Central Composite Design—Bioenergy Perspective. Energy Convers. Manag. 2017, 142, 334–346. [Google Scholar] [CrossRef]
- Mat Yasin, N.H.; Ahmad, N.A.N.; Mohd Hanapi, M.F. Extraction of FAME from Fish Waste by Using Modified Soxhlet Method. IOP Conf. Ser. Mater. Sci. Eng. 2021, 1092, 012015. [Google Scholar] [CrossRef]
- Iberahim, N.I.; Tan, B.C. Hexane-Isopropanol Extraction and Quality Assessment of Omega-3 Fish Oil from Atlantic Salmon (Salmo salar). Proc. IOP Conf. Ser. Mater. Sci. Eng. 2020, 932, 012038. [Google Scholar] [CrossRef]
- Toda, T.A.; Sawada, M.M.; Rodrigues, C.E.C. Kinetics of Soybean Oil Extraction Using Ethanol as Solvent: Experimental Data and Modeling. Food Bioprod. Process. 2016, 98, 1–10. [Google Scholar] [CrossRef]
- Saini, R.K.; Prasad, P.; Shang, X.; Keum, Y.S. Advances in Lipid Extraction Methods—A Review. Int. J. Mol. Sci. 2021, 22, 13643. [Google Scholar] [CrossRef]
- Schmid, M.; Guihéneuf, F.; Stengel, D.B. Evaluation of Food Grade Solvents for Lipid Extraction and Impact of Storage Temperature on Fatty Acid Composition of Edible Seaweeds Laminaria digitata (Phaeophyceae) and Palmaria palmata (Rhodophyta). Food Chem. 2016, 208, 161–168. [Google Scholar] [CrossRef]
- Schaich, K.M. Challenges in Elucidating Lipid Oxidation Mechanisms: When, Where, and How Do Products Arise? In Lipid Oxidation: Challenges in Food Systems; Logan, A., Nienaber, U., Pan, X., Eds.; AOCS Press: Champaign, IL, USA, 2013; pp. 1–52. ISBN 9780988856516. [Google Scholar]
- FAO/WHO Codex Alimentarius Commision. Standard for Fish Oils (CXS 329-2017) Adopted in 2017; FAO/WHO Codex Alimentarius Commision: Rome, Italy, 2017. [Google Scholar]
Figure 1.
Evolution of oil recovery as a function of extraction time from gutting side streams using (a) ethanol at 20 °C, (b) hexane at 20 °C, (c) ethanol at 35 °C, (d) hexane at 35 °C, (e) ethanol at 50 °C and (f) hexane at 50 °C at 3 different solvent to solid ratios (10:1, 30:1, 50:1). Error bars represent the standard deviation of the obtained experimental replicates.
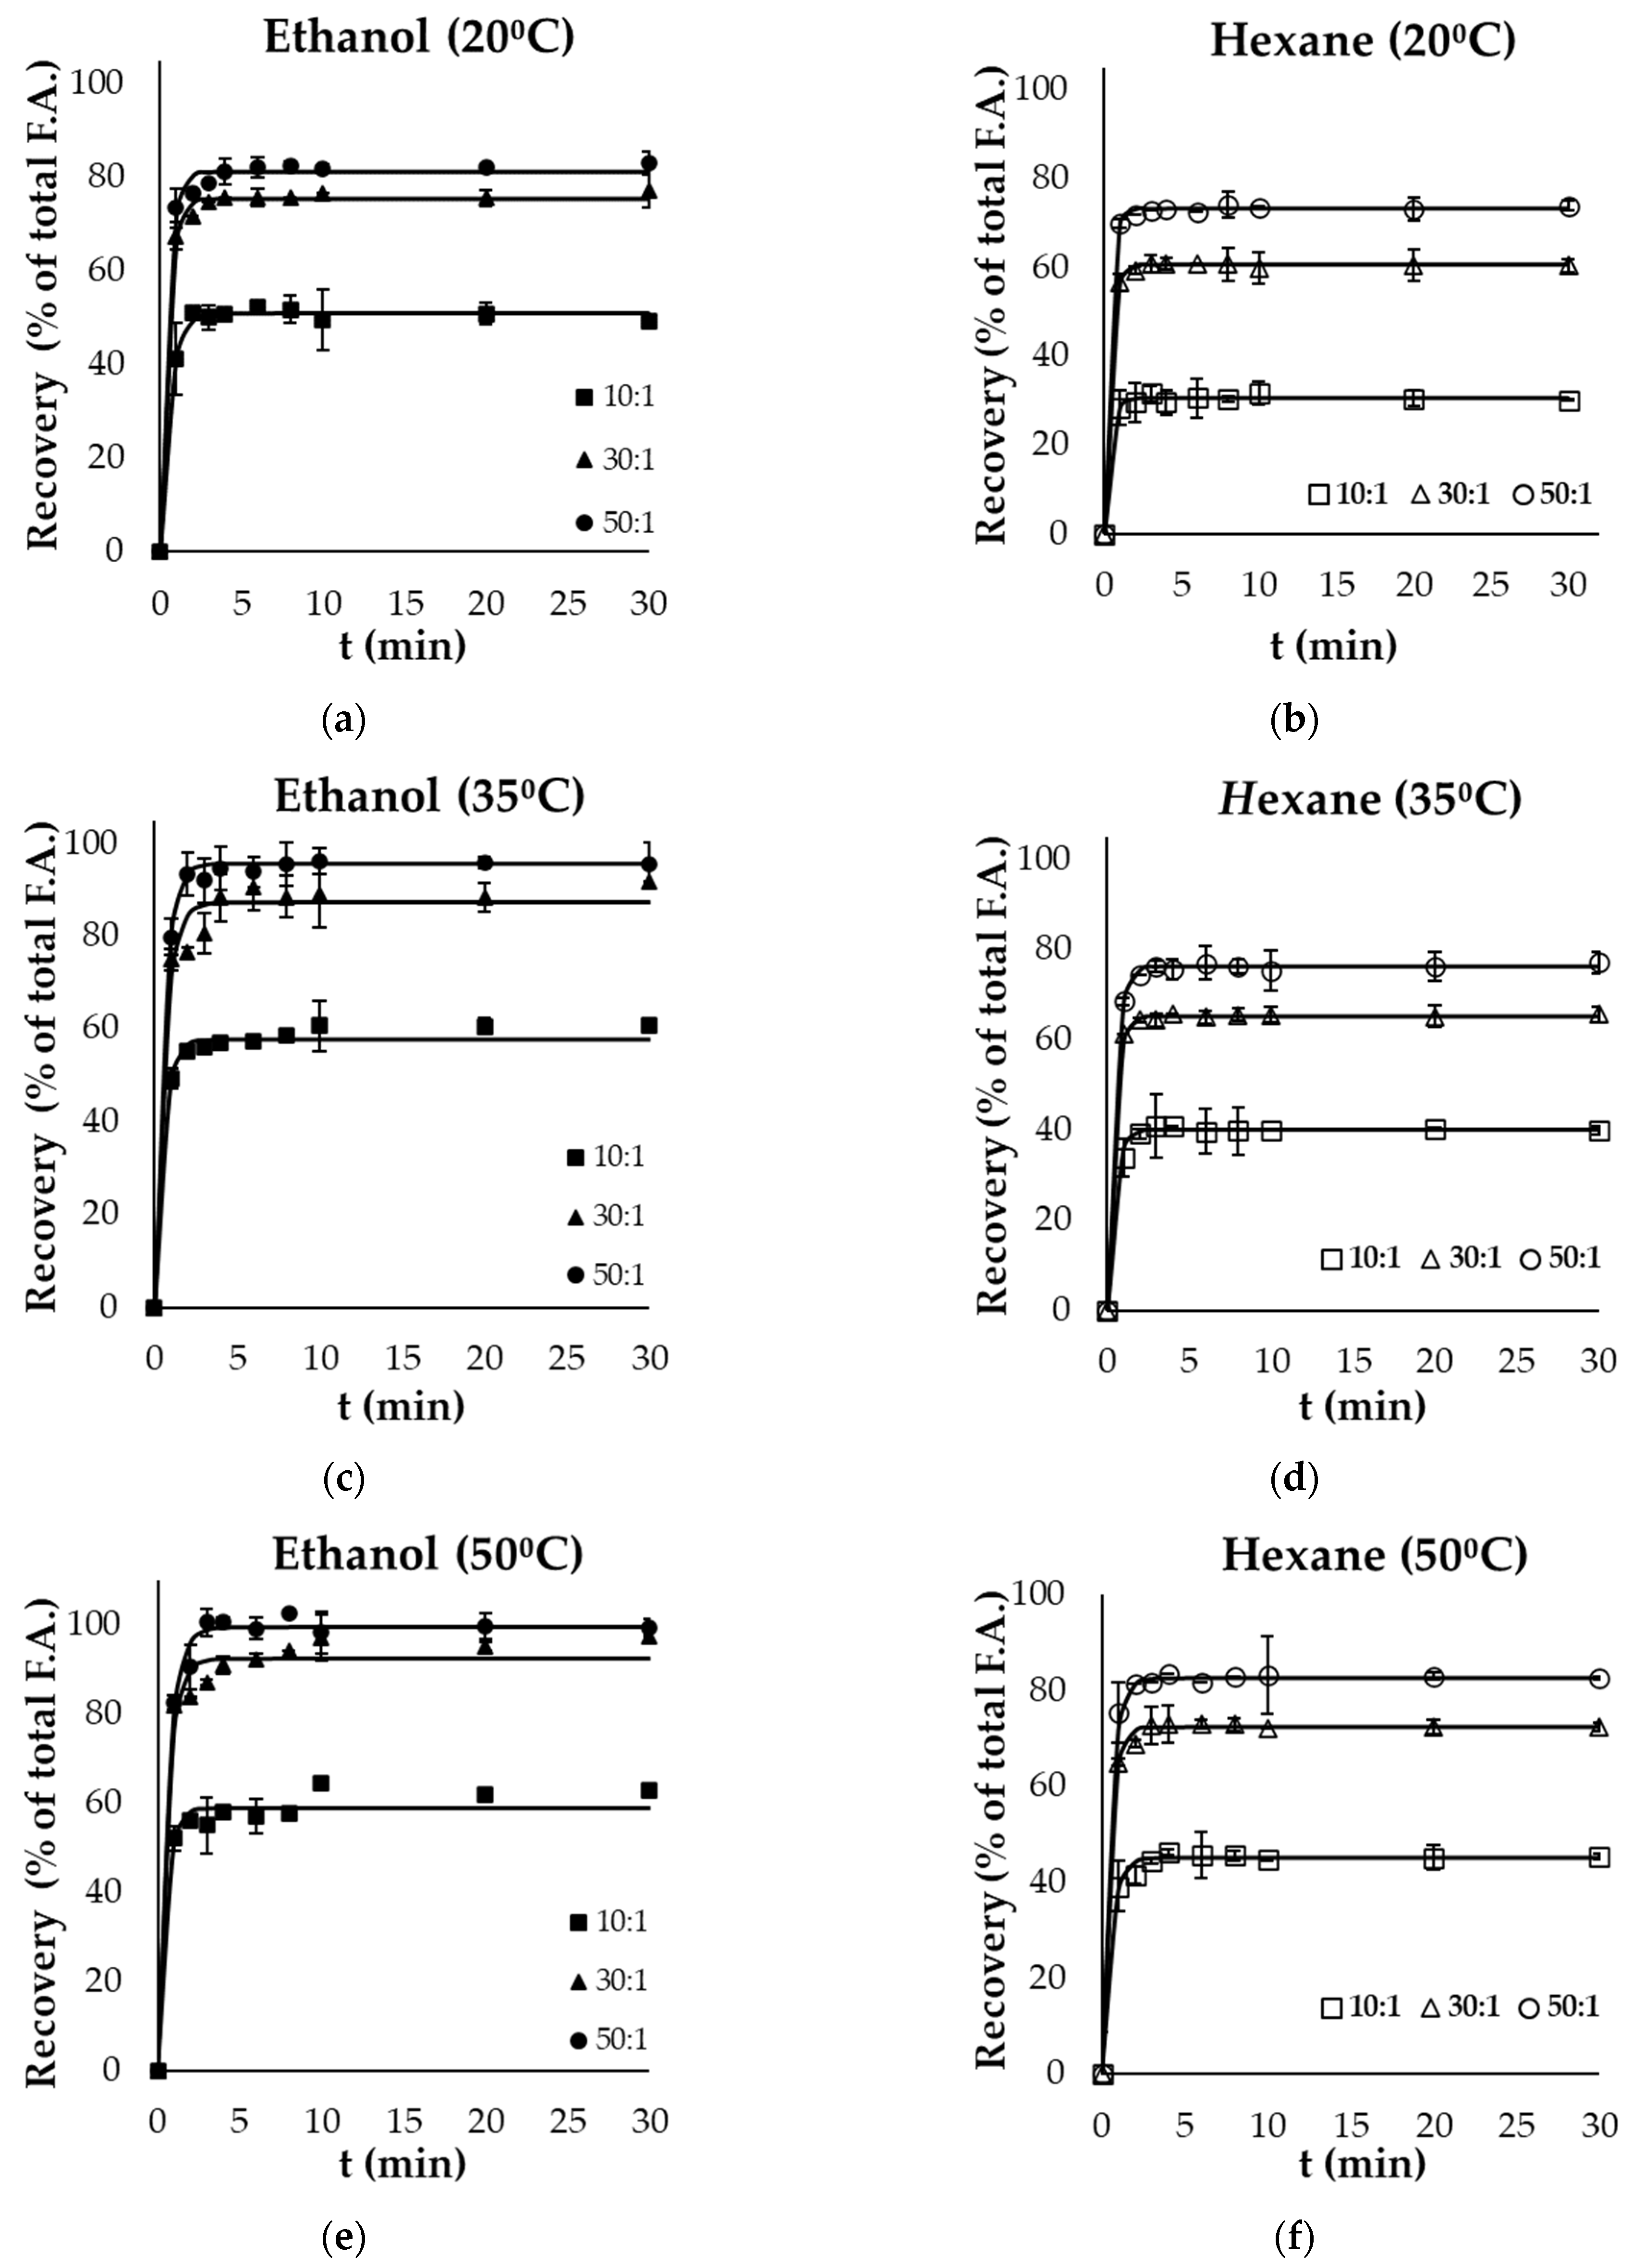
Figure 2.
Evolution of oil recovery as a function of extraction time from filleting side streams using (a) ethanol at 20 °C, (b) hexane at 20 °C, (c) ethanol at 35 °C, (d) hexane at 35 °C, (e) ethanol at 50 °C and (f) hexane at 50 °C at 3 different solid to solvent ratios (10:1, 30:1, 50:1). Error bars represent the standard deviation of the obtained experimental replicates.
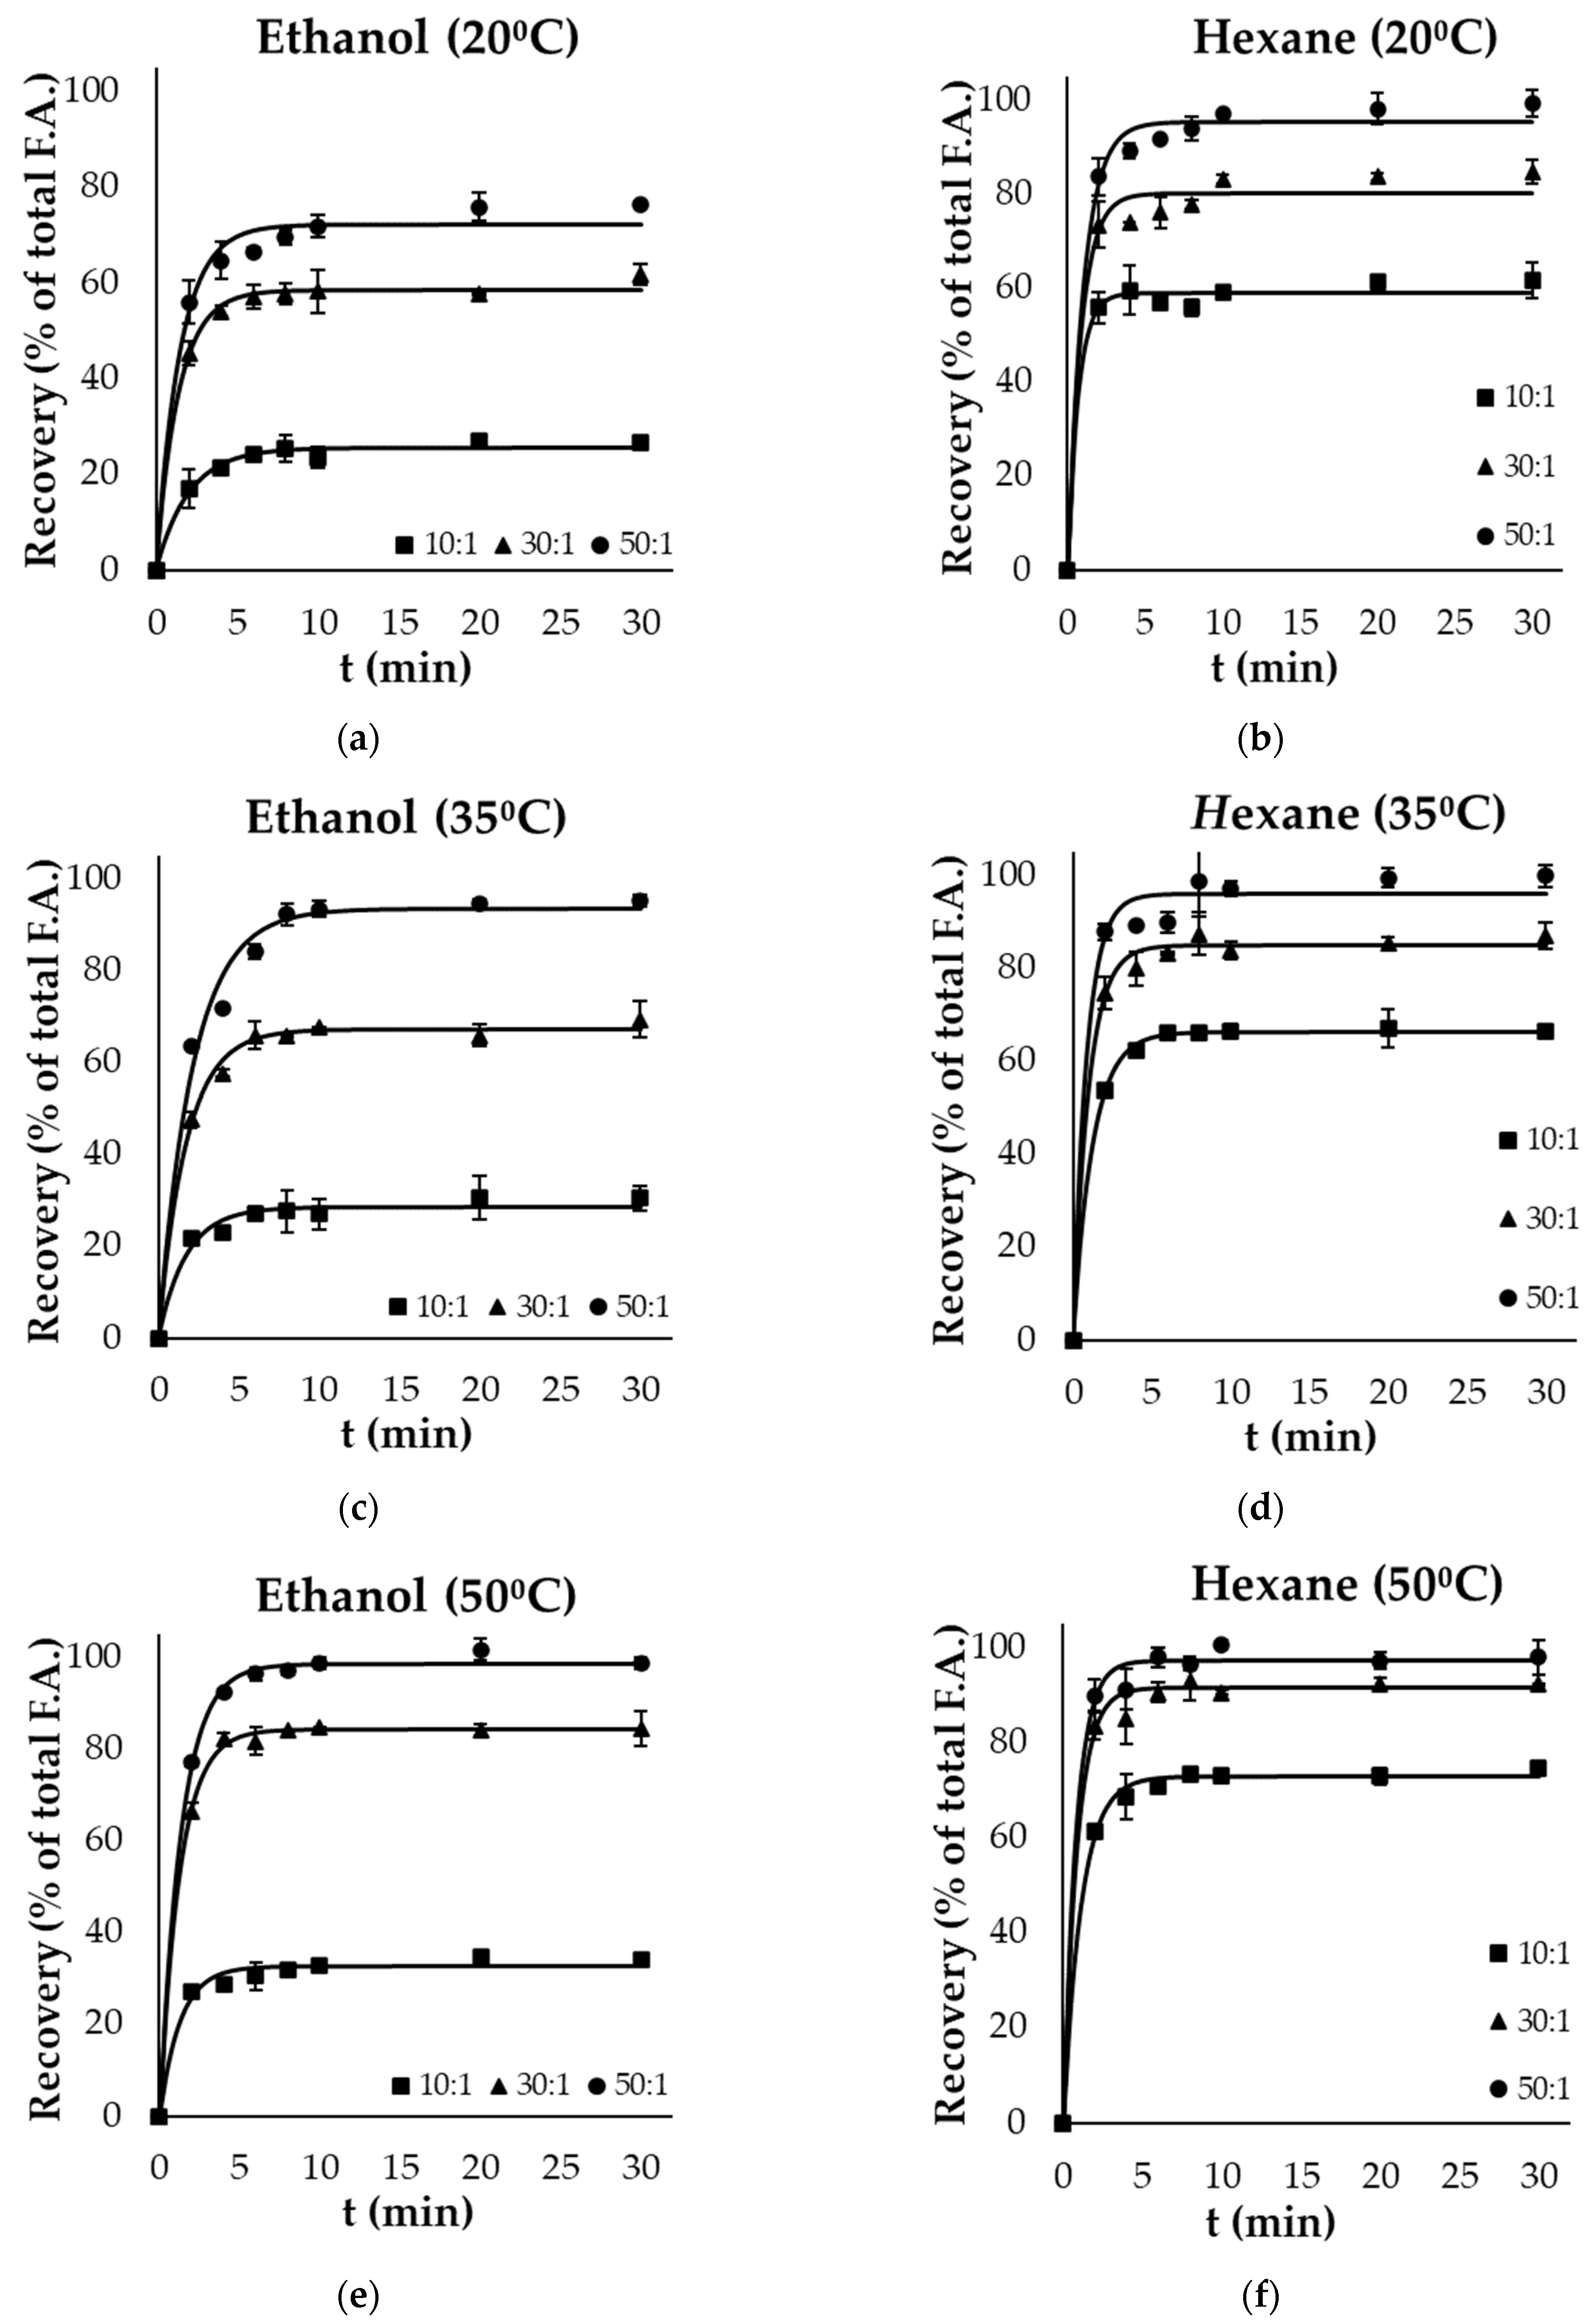
Figure 3.
Total SFA, MUFA and PUFA concentrations (expressed as the % of total fatty acids) of oil extracted from gutting or filleting side streams with ethanol (EtOH) or hexane (HEX) at 50 °C and a solvent to solid ratio of 50:1 (mean ± standard deviation). Different letters above the error bars denote significant differences between the same FA group according to ANOVA followed by Duncan test (at a 95% Confidence Level).

Figure 4.
(a) Peroxide value (PV) and (b) p-anisidine value (p-AV) of oil extracted from gutting or filleting side streams after 10 min of extraction with ethanol (E) or hexane (H) at 20, 35 or 50 °C and a ratio of 50:1 (mean ± standard deviation). Different letters above the error bars denote significant differences (at a confidence level of 95%) between the same by-product group according to an ANOVA followed by a Duncan test.

Table 1.
Fatty acid composition expressed as the % of the total fatty acids of filleting and gutting by-products.
Table 1.
Fatty acid composition expressed as the % of the total fatty acids of filleting and gutting by-products.
| Fatty Acids | Filleting By-Products | Gutting By-Products |
|---|---|---|
| C14:0 | 3.72 ± 0.13 | 2.41 ± 0.01 |
| C16:0 | 18.7 ± 0.4 | 11.0 ± 0.5 |
| C16:1 | 5.36 ± 0.14 | 3.31 ± 0.27 |
| C18:0 | 3.00 ± 0.03 | 3.07 ± 0.16 |
| C18:1 n-9 | 36.3 ± 0.9 | 34.8 ± 0.4 |
| C18:2 n-6 | 16.1 ± 0.7 | 14.5 ± 0.2 |
| C20:1 n-9 | 2.05 ± 0.15 | 1.89 ± 0.15 |
| C20:2 | 0.25 ± 0.05 | 1.07 ± 0.01 |
| C20:4 n-6 | 0.28 ± 0.03 | 1.21 ± 0.12 |
| C20:5 n-3 | 3.54 ± 0.04 | 9.08 ± 0.31 |
| C22:1 n-9 | 1.93 ± 0.37 | 1.27 ± 0.11 |
| C22:6 n-3 | 7.04 ± 0.73 | 12.8 ± 0.3 |
| SFA | 26.9 ± 0.7 | 17.2 ± 0.7 |
| MUFA | 45.8 ± 1.6 | 42.0 ± 1.0 |
| PUFA | 27.3 ± 1.6 | 40.8 ± 1.2 |
Data are expressed as the mean value ± standard deviation.
Table 2.
Maximum (final) oil concentration (Yf) for different by-products (side streams), solvents, solvent to solid ratios and temperatures.
Table 2.
Maximum (final) oil concentration (Yf) for different by-products (side streams), solvents, solvent to solid ratios and temperatures.
| Yf (%) Filleting Side Streams | ||||||
|---|---|---|---|---|---|---|
| Temperature (°C) | Ethanol 10:1 | Ethanol 30:1 | Ethanol 50:1 | Hexane 10:1 | Hexane 30:1 | Hexane 50:1 |
| 20 | 25.6 ± 0.6 aAx | 58.6 ± 0.7 aAy | 72.2 ± 1.6 aAz | 59.1 ± 0.9 aBx | 80.3 ± 1.7 aBy | 95.5 ± 1.4 aBz |
| 35 | 28.6 ± 0.9 bAx | 67.2 ± 0.9 bAy | 93.4 ± 2.3 bAz | 66.4 ± 0.3 bBx | 84.9 ± 0.9 bBy | 96.2 ± 1.8 bBz |
| 50 | 32.7 ± 0.8 cAx | 84.3 ± 0.5 cAy | 98.7 ± 0.7 cAz | 72.9 ± 0.6 cBx | 91.5 ± 1.1 cBy | 97.2 ± 1.1 cBz |
| Yf (%) Gutting Side Streams | ||||||
| 20 | 51.0 ± 0.5 aAx | 75.6 ± 0.5 aAy | 81.2 ± 0.8 aAz | 30.5 ± 0.3 aBx | 60.5 ± 0.2 aBy | 73.1 ± 0.3 aBz |
| 35 | 57.6 ± 0.7 bAx | 87.4 ± 1.6 bAy | 96.8 ± 0.5 bAz | 40.1 ± 0.4 bBx | 65.3 ± 0.2 bBy | 76.2 ± 0.3 bBz |
| 50 | 59.1 ± 1.2 cAx | 92.5 ± 1.8 cAy | 99.7 ± 1.1 cAz | 45.1 ± 0.5 cBx | 72.4 ± 0.4 cBy | 82.6 ± 0.3 cBz |
Data are expressed as the mean value ± standard deviation. Superscript letters a, b and c, indicate significant differences (p < 0.05) between temperatures. Superscript letters A and B indicate significant differences (p < 0.05) between solvents. Superscript letters x, y and z indicate significant differences (p < 0.05) between solvent to solid ratio.
Table 3.
Rate constants (k) for the different by-products (side streams), solvents, solvent to solid ratios and temperatures, based on Equation (2).
Table 3.
Rate constants (k) for the different by-products (side streams), solvents, solvent to solid ratios and temperatures, based on Equation (2).
| k (min−1) Filleting Side Streams | ||||||
|---|---|---|---|---|---|---|
| Temperature (°C) | Ethanol 10:1 | Ethanol 30:1 | Ethanol 50:1 | Hexane 10:1 | Hexane 30:1 | Hexane 50:1 |
| 20 | 0.50 ± 0.06 xa | 0.72 ± 0.06 xa | 0.67 ± 0.09 xa | 1.46 ± 0.36 xb | 1.15 ± 0.27 xb | 0.99 ± 0.13 xb |
| 35 | 0.58 ± 0.11 ya | 0.58 ± 0.04 ya | 0.47 ± 0.06 ya | 0.80 ± 0.03 yb | 1.01 ± 0.10 yb | 1.15 ± 0.24 yb |
| 50 | 0.78 ± 0.13 xa | 0.79 ± 0.03 xa | 0.74 ± 0.04 xa | 0.88 ± 0.06 xb | 1.16 ± 0.17 xb | 1.24 ± 0.17 xb |
| k (min−1) Gutting Side Streams | ||||||
| 20 | 1.71 ± 0.14 xa | 2.16 ± 0.16 xa | 2.25 ± 0.24 xa | 2.59 ± 0.18 xb | 2.71 ± 0.14 xb | 3.10 ± 0.23 xb |
| 35 | 1.91 ± 0.21 ya | 1.70 ± 0.18 ya | 1.85 ± 0.08 ya | 2.27 ± 0.17 yb | 2.48 ± 0.13 yb | 2.26 ± 0.10 yb |
| 50 | 2.06 ± 0.25 xa | 1.77 ± 0.30 xa | 1.66 ± 0.14 xa | 1.90 ± 0.19 xb | 2.22 ± 0.15 xb | 2.04 ± 0.11 xb |
Data are expressed as mean value ± standard deviation. Superscript letters x and y indicate significant differences (p < 0.05) between temperatures. Superscript letters a and b indicate significant differences (p < 0.05) between the solvents.
Disclaimer/Publisher’s Note: The statements, opinions and data contained in all publications are solely those of the individual author(s) and contributor(s) and not of MDPI and/or the editor(s). MDPI and/or the editor(s) disclaim responsibility for any injury to people or property resulting from any ideas, methods, instructions or products referred to in the content. |
© 2024 by the authors. Licensee MDPI, Basel, Switzerland. This article is an open access article distributed under the terms and conditions of the Creative Commons Attribution (CC BY) license (https://creativecommons.org/licenses/by/4.0/).
Share and Cite
MDPI and ACS Style
Semenoglou, I.; Katsouli, M.; Giannakourou, M.; Taoukis, P. Recovery of Omega-3-Rich Lipids: Toward the Sustainable Valorization of Sea-Bass Industry Side Streams. Separations 2024, 11, 101. https://doi.org/10.3390/separations11040101
AMA Style
Semenoglou I, Katsouli M, Giannakourou M, Taoukis P. Recovery of Omega-3-Rich Lipids: Toward the Sustainable Valorization of Sea-Bass Industry Side Streams. Separations. 2024; 11(4):101. https://doi.org/10.3390/separations11040101
Chicago/Turabian StyleSemenoglou, Ioanna, Maria Katsouli, Maria Giannakourou, and Petros Taoukis. 2024. "Recovery of Omega-3-Rich Lipids: Toward the Sustainable Valorization of Sea-Bass Industry Side Streams" Separations 11, no. 4: 101. https://doi.org/10.3390/separations11040101
Note that from the first issue of 2016, this journal uses article numbers instead of page numbers. See further details here.