Article

Volatile Carbonyl Compounds Emission in Dry-Process Fibreboard: Identification through a Selective GDME-HPLC-DAD-MS/MS Method

by
Fátima Daniela Gonçalves
1,
Jorge M. Martins
2,3,4,
Luísa H. Carvalho
2,3,4,
José António Rodrigues
1 and
Rui Miguel Ramos
1,*
1
LAQV-REQUIMTE—Departamento de Química e Bioquímica, Faculdade de Ciências da Universidade do Porto, Rua do Campo Alegre, s/n, 4169-007 Porto, Portugal
2
DEMad—Departamento de Engenharia de Madeiras, Instituto Politécnico de Viseu, Campus Politécnico de Repeses, 3504-510 Viseu, Portugal
3
LEPABE—Faculty of Engineering, University of Porto, Rua Dr. Roberto Frias, s/n, 4200-465 Porto, Portugal
4
AliCE—Associate Laboratory in Chemical Engineering, Faculty of Engineering, University of Porto, Rua Dr. Roberto Frias, 4200-465 Porto, Portugal
*
Author to whom correspondence should be addressed.
Separations 2024, 11(4), 92; https://doi.org/10.3390/separations11040092
Submission received: 21 February 2024 / Revised: 14 March 2024 / Accepted: 22 March 2024 / Published: 25 March 2024

Abstract

:
This work presents a novel application of gas-diffusion microextraction (GDME) for the extraction and identification of volatile carbonyl compounds from a dry-process fibreboard (MDF) by combining high-performance liquid chromatography with diode array detection (HPLC–DAD) and mass spectrometry (MS). GDME is a simple, inexpensive, and environmentally friendly technique that allows the simultaneous extraction and derivatization with 2,4-dinitrophenylhydrazine (DNPH) of selected volatiles. The extraction conditions were optimized using design of experiments through a 24 full fractional design followed by a Box–Behnken design, resulting in 35 min of extraction at 45 °C using 500 µL of DNPH 0.15%. The analysis of commercial MDF samples with different characteristics, such as thickness or colour, showed a distinct emission profile of volatile carbonyls. The principal emitting compounds found were formaldehyde, acetaldehyde, acetone, butanal, pentanal, hexanal, heptanal, octanal, and nonanal. A total of 25 compounds were identified using MS, including saturated and unsaturated aldehydes, ketones, dicarbonyls, and benzaldehyde-derivatives. This method can be a valuable tool for the qualitative evaluation of VOCs released from wood-based panels and for the assessment of indoor-air quality.

1. Introduction

Wood-based panels (WBPs) are one of the most dynamic and expanding segments of the woodworking industry. In recent decades, there has been an increase in productivity and product quality, using more sustainable production processes, due to the growing demand for these products as building materials for furniture or for decorative purposes. WBPs are products made from wood fibres, particles, or veneers glued together with an adhesive, through the influence of heat and pressure in a hot-plate press [1,2,3]. Some known examples of WBPs are particleboard, fibreboard, plywood, and oriented strand board [1,4].
A fibreboard is a panel made using wood fibres as raw material, and is classified according to EN 316 [5]. This type of panel can be classified according to their production process or density of the finished panel in wet process fibreboards and dry-process fibreboards. Wet process fibreboards include softboards, medium boards, or hardboards; dry-process fibreboards or, as commercially known, Medium Density Fibreboard (MDF), include different classes as High Density Fibreboard (HDF), Light MDF, and Ultra-Light MDF [6,7]. Every type of panel mentioned above has distinct mechanical properties and characteristics because of the differences in their production processes. MDF, the most commercially known fibreboard, is produced from lignocellulosic fibres with a moisture content below 20%, submitted to a hot-press process with the addition of an adhesive, generally a urea-formaldehyde (UF) or melamine-urea-formaldehyde (MUF) resin [1]. Considering their characteristics, such as having flat surfaces which are ideal for painting or conjugate with decorative foils, MDF have been vastly used for tabletops, drawer fronts, or door panels [1,8].
Nowadays, a major source of indoor air pollution is associated with building materials and furnishings, together with inappropriate ventilation [9,10]. WBPs are one of the most known and significant sources contributing to the release of volatile organic compounds (VOCs) to the indoor air [11]. Formaldehyde is probably the most known and regulated VOC released from WBPs, due to its classification as a group 1 human carcinogen attributed by the International Agency for Research on Cancer (IARC) [12]. Its presence in WBPs is mainly associated with the use of formaldehyde-containing resins, such as UF or MUF in the panel production. However, besides formaldehyde, other VOCs can be released from WBPs as a natural emission from wood or resulting from industrial production. VOCs such as terpenes, terpenoids, alcohols, aldehydes, ketones, and acids constitute an important portion of wood extractives [11,13,14]. According to a literature review performed by Baumann et al. [15] the following VOCs have been associated with wood products: benzaldehyde, benzene, borneol, camphene, 3-carene, p-cymene, heptanal, heptane, 2-heptanone, 3-heptanone, hexanal, limonene, nonanal, octanal, octane, t-2-octenal, pentanal, pentane, 1-pentanol, α-pinene, β-pinene, toluene, and xylenes. These authors also found a prevalence of aldehydes (pentanal, hexanal, benzaldehyde, and heptanal) and terpenoid compounds in southern pine particleboards (which includes different species of pine as Longleaf pine (Pinus palustris), Shortleaf pine (Pinus echinata), Loblolly pine (Pinus taeda), Slash pine (Pinus elliottii)), pine MDF, and other MDF samples. Gabriel et al. [16] compared the emission of VOCs from MDF containing different proportions of softwoods and hardwoods, concluding that the total emission of aldehydes (hexanal, heptanal, octanal, nonanal, and decanal) declines upon the increase in the amount of hardwood used. Kim et al. [17] estimated the total emission of VOCs as 36% aldehydes (hexanal, pentanal, octanal), 40% terpenes (α-pinene, β-pinene, borneol), and 24% alkanes (heptane, heptadecane, octadecane) during the hot-pressing of Radiata pine MDF. Brown [18] reported the emission of formaldehyde, acetone, butanal, hexanal, methanol, and others from office furniture mostly composed of MDF. Jun et al. [19] reported aldehyde emissions mainly composed of hexanal and pentanal, with smaller amounts of benzaldehyde, furfural, and nonanal, besides other terpenes, organic acids, and alcohols in MDF made of Scots pine (Pinus sylvestris L.). Overall, the importance that volatile carbonyl compounds have on the emission profile of WBPs and of MDF is undeniable.
For the determination of VOCs from WBPs, the most used instrumental analytical technique is gas chromatography coupled to mass spectrometry (GC–MS) and, to a lesser extent, liquid-chromatography coupled to mass spectrometry (LC–MS) [11]. For the extraction of volatiles from samples, different approaches can be followed according to the type of sample and aim of the analysis. Through the active sampling method described in ISO 16000-3 [20], it is possible to perform the determination of formaldehyde and 12 other volatile carbonyl compounds in the air. The air is drawn through a silica gel cartridge coated with 2,4-dinitrophenylhydrazine (DNPH) reagent, where the carbonyl compounds will form stable derivatives with DNPH. The resulting derivatives are analysed using high-performance liquid chromatography (HPLC) with UV detection or diode array detection (DAD). In ISO 16000-6 [21] and ISO 16000-9 [22], the determination of VOCs emitted from building materials and other products used in indoor environments and the determination of VOCs emitted from building products and furnishings, respectively, is possible by collecting the sampled air from an emission test chamber through one or more Tenax TA® sorbent tubes. By means of thermal desorption, the captured VOCs are analysed using GC–MS. Headspace solid-phase microextraction (HS-SPME) is another method used for the extraction of VOCs from wood and WBPs [11,13,23,24,25]. In this technique, a coated fused silica fibre is exposed to the headspace of a sample in a closed vessel, where a partition between sample extract and headspace air takes place. The analysis is performed using GC–MS after thermal desorption of the analytes.
In this work, we propose the combination of gas-diffusion microextraction (GDME) with a derivatization reaction with DNPH for the selective extraction/derivatization of volatile carbonyl compounds from MDF samples, towards their HPLC–DAD determination and mass spectrometry identification.
The analytical strategy employed relies on an innovative approach for the extraction of volatile organic compounds based on GDME [26]. GDME is a non-exhaustive extraction technique for volatile analytes that combines membrane-assisted gas-diffusion and microextraction, providing a simple, fast, and economical alternative for the extraction on VOCs from solids [27,28]. An unequivocal advantage of GDME is the possibility of combining derivatization with the extraction process, by having a derivatizing agent in the acceptor solution. This results in a continuous extraction process where an equilibrium state of the volatile compounds between the headspace and the solid sample is not reached, besides improving the extraction selectivity and chromatographic detection. In this work, an evaluation of different chromatographic aspects together with an optimization of the most influential extraction parameters, through a design of experiments, was conducted.

2. Materials and Methods

2.1. Chemicals

All reagents were used without further treatment and all aqueous solutions were prepared using ultrapure water (resistivity > 18.2 MΩ cm) obtained from a Direct-Q 3UV system (Merck Millipore, Darmstadt, Germany).
Acetonitrile (Fisher, Hampton, NH, USA, HPLC gradient grade, A/0627/17), 0.1% formic acid solution, prepared by diluting the appropriate volume of formic acid (Chem-Lab, Zedelgem, Belgium, CL00.1305, 99–100%) and 10 mmol L−1 acetate buffer solution, prepared by mixing 0.8 g of ammonium acetate (Sigma-Aldrich, Darmstadt, Germany, A7262, >98%) with 0.6 mL of acetic acid (Merck, Darmstadt, Germany, 1.00066.0250, >99.8%) in 1.0 L, were used as the mobile phase for the chromatographic analyses.
The DNPH solution (0.15% w/v) was prepared by dissolving 0.03 g of DNPH (TCI, Zwijndrecht, Belgium, D0846, >98.0%) in 10 mL of acetonitrile, to which 10 mL of HCl 40 mmol L−1 were added, since the derivatization reaction is optimum at acidic pH [27]. To avoid the contamination and degradation of the DNPH solution, this reagent was prepared weekly.

2.2. Samples

The samples used in this work consisted of commercial MDF samples provided by Valbopan–Fibras de Madeira, SA. Coloured MDF was produced with Maritime pine (Pinus pinaster Ait.) and with MUF or UF resin, together with different dyes.
The samples were cut in 25 × 25 (width × length, in millimetres) pieces using a PROXXON Table Saw FET equipped with a super-cut saw blade (Ø 85 × 0.5 × 10 mm, 80 teeth).
In relation to their properties, these samples had different colours and were available with different thickness, while being mostly composed of pine wood fibre and MUF resin (Table 1).

2.3. Chromatographic Analysis

HPLC–DAD analyses were performed using a Thermo Scientific Dionex UltiMateTM 3000 HPLC system that was composed of a quaternary pump (LPG-3400SD), an autosampler (ACC-3000), a column oven, and a diode-array detector (DAD-3000) from Thermo Scientific, Waltham, MA, USA, operated using the Chromeleon 7 software. The elution was carried out at 30 °C in gradient mode, using acetonitrile (A) and 0.1% formic acid (B), as follows: 40% to 55% A from 0 to 17 min, 55% to 100% A from 17 to 50 min, 100% to 40% A from 50 to 55 min, and 40% A from 55 to 60 min. Sample volume injected was 20 µL, detection was performed at 360 nm, and the flow rate was set at 0.450 mL min−1. The column used for the analysis was a Kinetex® EVO C18 column (150 × 4.6 mm; 2.6 µm) equipped with a guard column, both from Phenomenex (Torrance, CA, USA). The same operative conditions and column were used for the mass spectrometry analyses.
The mass spectrometry analyses were performed in a Thermo Scientific Vanquish UPLC equipped with a triple quadrupole linear ion trap mass spectrometer (LTQ XL™ Linear Ion Trap Mass Spectrometer) (Waltham, MA, USA,) and an ESI source in the negative ion mode in the following conditions: capillary temperature, 300 °C; source voltage, 3.20 kV; source current, 100 μA; capillary voltage, −30.0 V; sheath gas (N2) flow, 40 arbitrary units; auxiliary gas (N2) flow, 15 arbitrary units. The mass detection was performed in the range 160–500 m/z. Xcalibur software version 1.4 (Thermo Electron Corp., Waltham, MA, USA) was used for data acquisition and processing.

2.4. GDME Procedure

The GDME principles, overall configuration, and illustrative representation schemes have been described in previous works [28,29]. Briefly, analytes are extracted from the sample due to its volatility using a gas-diffusion process through a gas-permeable membrane (13 mm diameter, 5.0 µm pore size, Merck Millipore, Germany) and are recovered in an acceptor solution containing a derivatization reagent. GDME simplifies the sample preparation process by simultaneously allowing the extraction and derivatization steps, which increases the selectivity and workability of the process.
Unless stated otherwise, the following procedure was used: (i) a test sample piece is placed inside a commercial 100 mL laboratory glass flask; (ii) the flask is closed, 500 µL of the derivatization solution (DNPH 0.15% w/v) are added to the GDME device, and the flask is partially immersed in a water bath at 45 °C; (iii) the extraction is performed for 35 min, and after that time period, the acceptor solution containing the derivatized extracted analytes is collected and transferred to an autosampler vial for chromatographic analysis.

2.5. Statistical Analysis

All the statistical analysis was performed using Statistica® (version 14.0.0.15) by TIBCO, Santa Clara, CA, USA.

3. Results and Discussion

3.1. HPLC Method Optimization

The influence of the mobile phase composition on the chromatographic separation of carbonyl compounds was evaluated by preparing and injecting a standard mixture of derivatized carbonyls. This standard mixture was prepared by mixing 500 µL of DNPH 0.15% and 10 µL of each of the following aldehyde 10 mM standard solutions (formaldehyde, acetaldehyde, propanal, butanal, pentanal, hexanal, heptanal, octanal, nonanal, and decanal). Three mobile phases were tested: (i) acetonitrile (A) and water (B); (ii) acetonitrile (A) and 0.1% formic acid (B); and (iii) acetonitrile (A) and 10 mmol L−1 ammonium acetate buffer (B). The gradient elution method used in this study was adapted from a previous work [27,30] and was as follows: 50% to 65% A from 0 to 20 min, 65% to 100% A from 20 to 45 min, 100% to 50% A from 45 to 55 min, and 50% A from 55 to 60 min. The flow rate was set at 0.450 mL min−1, the sample volume injected was 20 µL, and the detection was performed at 360 nm. The resulting chromatograms are presented in Figure 1.
Mobile phase (i) had poor separation of isomers, which led to asymmetrical peaks and low resolution. Mobile phase (ii and iii) showed a reasonable chromatographic profile with adequate resolution. Considering that the method was intended to be used with mass spectrometry, it was important to have a mobile phase that would benefit the ionization of analytes. As such, the mobile phase chosen was acetonitrile and 0.1% formic acid.
For preliminary tests, the gradient elution method used for this study was adapted from a previous work [27,30]. However, due to the changes introduced in the mobile phase and chromatographic column, certain derivatized carbonyl compounds co-elute when using these conditions. After several tests to improve the resolution of the separation, the optimized chromatographic gradient for the separation of the DNPH-derivatized carbonyl compounds using acetonitrile (A) and 0.1% formic acid (B) was: 40% to 55% A from 0 to 17 min, 55% to 100% A from 17 to 50 min, 100% to 40% A from 50 to 55 min, and 40% A from 55 to 60 min. The flow rate was 0.450 mL min−1, the sample volume injected was 20 µL, and the DAD detection was performed at 360 nm.

3.2. Optimization of GDME Conditions

From previous works where GDME was used for the extraction of volatile analytes from samples [27,29] it was established that the experimental parameters temperature and time of extraction and the volume of the acceptor solution had the main influence on the outcome of the extraction. Therefore, considering that this was the first application of GDME to MDF samples, an optimization of the extraction conditions through a design of experiments (DOE) was conducted [31,32].
The optimization of the extraction conditions was separated into two stages: a screening through a 24 full fractional design followed by a Box–Behnken design. For both stages, 25 µL of a mixture of standards (furfural, benzaldehyde, and hexanal) at 0.2 mmol L−1 was added on top of 25 × 20 × 17 mm test pieces. The experimental variables studied in the screening step were the temperature of extraction, time of extraction, volume of DNPH solution, and its concentration (Table 2).
This 24 full fractional design was employed to originate an 18-run experimental plan with two centre points, where the centre conditions were used (Table S1). All experiments were performed in triplicates. The centre points were used to evaluate the factor-response linearity and to determine the experimental error. The significance of the effects was evaluated using analysis of variance (ANOVA) at a 95% significance level, from which Pareto charts of the main effects were produced for formaldehyde, acetaldehyde, furfural, and benzaldehyde (Figure 2). In a Pareto chart, the length of the bars is proportional to the absolute value of the standardized effect estimate, which can be used to compare the relative importance of the different effects. When a factor bar exceeds the 95% significance level line (p = 0.05) in a Pareto chart, that factor statistically has a significant effect on the results. By analysing the Pareto charts obtained using TIBCO Statistica®, it was possible to conclude that temperature and time of extraction are the variables that mostly affected the results. Interactions that involve both these variables, represented by 1by2 in the Pareto charts, showed a significant effect on the peak area of formaldehyde and acetaldehyde. The interaction between time of extraction and volume of DNPH had a significant effect on the peak area of benzaldehyde. The Pareto chart for furfural showed that there were no significant effects. Using ANOVA analysis, it was possible to verify the existence of curvature in all responses.
To understand the interaction between temperature and time of extraction, a response surface model was used, specifically a three-level Box–Behnken design for three factors, where temperature of extraction, time of extraction, and volume of DNPH solution were studied (Table S2). The Box–Behnken design consisted of a 15-run experimental plan with three central points. A concentration of DNPH solution of 0.15% (w/v) was used, and all experiments were performed in triplicate. The results obtained for the HPLC separation of formaldehyde, acetaldehyde, furfural, benzaldehyde, and hexanal showed that the highest peak areas for formaldehyde and acetaldehyde occurs when the extraction was performed at 60 °C for 60 min, using 500 µL of DNPH 0.15%. For furfural, benzaldehyde, and hexanal, the highest peak areas were achieved for 35 min of extraction at 30 °C using 250 µL of DNPH 0.15%. The use of 250 µL of acceptor solution at high temperatures proved to not be practical when the extraction was carried out for a long period, as evaporation starts to have an effect. Extractions where 750 µL of acceptor solution was used led to lower peak areas when compared to the results achieved using 250 µL under the same temperature and time of extraction. For these reasons, the volume of DNPH considered optimal was 500 µL.
The response surface models allowed a better understanding of the interaction between the two main significant factors, temperature and time of extraction (Figure 3). Through analysis of the response surface models, it was possible to conclude:
  • The signals of formaldehyde and acetaldehyde, compounds emitted solely from the sample, showed a continuous increase in peak area when both time and temperature of extraction were increased. Therefore, no maximum was achieved.
  • Results for furfural suggest that the influence of extraction time was higher than the influence of extraction temperature. The highest peak area corresponded to conditions near the centre value: 35 min of extraction time at a 30 °C temperature.
  • Benzaldehyde’s and hexanal’s models showed a curvature at conditions near the centre points (45 °C and 35 min), where the peak area reached a maximum.
The criteria to choose the overall optimal conditions was a compromise between the temperature and time of extraction that resulted in the highest peak area for all compounds studied. As such, the optimal conditions of extraction achieved were 35 min of extraction at 45 °C using 500 µL of DNPH 0.15%.

3.3. Analysis of Commercial MDF Samples

The GDME method was employed in the extraction of several commercial MDF samples, using the optimized extraction conditions. Triplicates were performed for each sample.
From a general standpoint, the highest emitting observed compounds were formaldehyde, acetaldehyde, acetone, butanal, pentanal, hexanal, heptanal, octanal, and nonanal, which is consistent with records found in the literature. Aldehydes are supposed to arise from the oxidation of wood components during the manufacturing of WBPs [19].
The effect of sample thickness on the emission of VOCs was assessed on an orange MDF bonded with MUF resin, where thicknesses of 12, 16, and 19 mm were evaluated. A similar chromatographic profile of volatile carbonyls was observed in the three samples, with the most noticeable differences in the emission being attributed to pentanal, hexanal, and acetone. While for pentanal and hexanal, the highest emission occurred for the lower thickness samples (12 > 16 > 19 mm), for acetone, the opposite trend was observed, with the highest emission observed for the thickest sample (Figure S1). Sun et al. [33] evaluated the effect of thickness on total volatile organic compounds (TVOC) emission in particleboards and concluded that, assuming a constant density and resin content during the production, as the thickness increases, the TVOC also increases, considering the increase use of adhesive and wood particles.
As there were MDF samples produced with both UF and MUF resins, it was also possible to evaluate the effect of the resin type on the emission of volatile carbonyls. For this purpose, a grey 19 mm MDF sample produced with UF, and another with MUF resin, were used. The peak for formaldehyde obtained for the MUF-bonded MDF was lower than the UF-bonded MDF, which was expected considering the available literature [34]. The remaining chromatographic signals were similar.
The wide array of colours of these MDF samples brought forth the possibility of investigating whether different colours resulted in different emission profiles due to the dyes used in their production. In an attempt to visualize these differences, several MUF-bonded MDF samples of 19 mm thickness were compared and, to facilitate the interpretation of the results, the TVOC resulting from the most intense chromatographic signals was considered (Figure 4). Results show that the samples with the highest emission were the orange and white-grey coloured MDF, followed by the khaki MDF; on the other side, the least emitting was the green-mint coloured MDF. Statistically significant differences were found for these samples.
Considering the different availability of samples for each colour, which in some cases only accounted for one or two representatives, the same study was conducted for 19 mm MDF panels of the same colour to assess the degree of variability on the TVOC emission. For this purpose, white-grey MDFs (Figure 5A) and black MDFs (Figure 5B) were used. The results did not show statistically significant differences for the white-grey MDF panels, while for the black MDFs, a clear difference was observed between UF and MUF-bonded panels. These results do not support a definitive claim on the influence of the dye used to produce the MDF panels on the emission of volatile carbonyl compounds. Although some characteristics of the panels were provided, such as the type of wood fibre or the adhesive used for the production, there are other factors susceptible of influencing the emission of volatile carbonyl compounds. These include the date of production, storage conditions, ratio of adhesive to fibre (dry basis), initial moisture content of the raw materials, and others, which are known to influence the emission of VOCs from WBPs [16,33,35].

3.4. Identification of Volatile Carbonyl Compounds in MDF through HPLC–DAD–MS/MS

The unequivocal identification of MDF-extracted carbonyl compounds was performed using mass spectrometry, which allowed the identification of unknown compounds present in the samples. These compounds were identified as their DNPH derivatives. The extracts used for the analysis were obtained according to the previously described procedure, and the LC–MS/MS analysis were performed in the negative ion mode. In this analysis mode, the mass spectra showed the base peaks as pseudomolecular ions, meaning molecular ions that have lost one proton [M–H] from the carbonyl-DNPH. Given the extensive use of DNPH in the analysis of volatile carbonyls in samples, the fragmentation pattern of several DNPH derivatives has been documented over the years. In 1998, Kölliker et al. introduced an elucidative diagram for the identification of DNPH derivatives according to characteristic fragments present in different compound groups [36]. Therefore, the identification of the compounds was performed by comparing the MS spectral information of the DNPH derivatives with those obtained from the analysis of standard solutions, together with those reported in the literature.
Table 3 resumes the MS/MS data for each chromatographic signal identified in the extracted samples. A simple way to easily differentiate between an aldehyde and a ketone is the relative abundance of fragment ions m/z 163 and 179. While aldehydes-DNPH show intense m/z 163 and 179 fragment ions, ketones-DNPH are characterized by a much lower relative abundance of the m/z 163 ion in comparison with the m/z 179 ion [36]. Other typical ions include m/z 152 and 122, resulting from multiple fragmentations as [M–H] → [M–H–30] → m/z 152 → m/z 122. Aliphatic aldehydes (C1 to C10, formaldehyde to decanal) show the characteristic fragments of aldehydes saturated in the α carbon (m/z 163, 179, [M–H–30], [M–H–45/46]).
Peak 8 presented a precursor ion m/z 301.01. An abundant fragment m/z 163 and 254 [M–H–47] is indicative of an unsaturated aldehyde. An aromatic aldehyde is distinguished from a double-bonded aldehyde by the presence of fragment [M–H–164], which is the case with fragment m/z 137. The presence of fragment 209 m/z suggests an aromatic aldehyde not ortho-substituted, and fragment 182 may be due to the presence of a hydroxyl group [37]. A possible match is 4-hydroxybenzaldehyde, a compound resulting from the depolymerization of lignin [44,45]. The corresponding mass spectrum for this compound is provided in the Support Information.
Peak 13, with a precursor ion m/z 461.18, is within the relation (433 + n × 14) which might correspond to an oxoacid [36,41]. However, not enough data were available to provide a tentative identification (mass spectrum provided in Support Information).
Peak 19 presented a precursor ion m/z 445.15 and an abundant MS/MS fragment 182, which is indicative of a dicarbonyl compound bound to two DNPH molecules. The presence of fragment m/z 179 and the absence of m/z 163 suggests a diketone. Considering the DNPH derivatization equation, the resulting diketone would have a molar mass of 86, which could correspond to 2,3-butanedione. The fragmentation pattern of 2,3-butanedione found in the analysis of a standard and seen in the literature was identical to the one for peak 19, thus confirming its identity.
Peak 20 presented a precursor ion m/z 327.12. An abundant MS/MS fragment 163 is indicative of an aldehyde, and the presence of fragment [M–H–47] m/z 280 suggests that the compound could be an aromatic or saturated aldehyde in α. As there are fragments of [M–H–164] m/z 163 and [M–H–93] m/z 234, indicative of an aromatic aldehyde with no substitution in the ortho position, it is probable that peak 20 corresponds to an aromatic aldehyde not ortho-substituted. However, no further correlations could be made to propose a tentative identification of the compound (mass spectrum provided in Support Information).

4. Conclusions

In this work, the GDME methodology was applied for the direct extraction of volatile carbonyl compounds released from MDF samples through derivatization with DNPH. Major advantages of the use of the GDME technique are its simplicity and low cost, as well as being an environmentally friendly approach which can be used for the qualitative evaluation of VOCs released from these wood products. Furthermore, it can be easily adapted to other classes of volatile compounds by adjusting the acceptor derivatization solution inside the GDME device. An extensive optimization of chromatographic and GDME conditions was performed using designs of experiments, leading to optimal conditions of 35 min of extraction at 45 °C, using 500 µL of DNPH 0.15%. The analysis of commercial MDF samples with different characteristics, such as thickness or colour, showed clearly distinct emissions of volatile carbonyl compounds which could not be attributed solely to a single characteristic of the MDF panel, such as the colour. Further studies would require a controlled production process of the MDF samples in order to singularize the causes for the different emissions. Through mass spectrometry, it was possible to characterize the emission profile of volatile carbonyl compounds in the analysed MDF samples. Herein, a total of 25 compounds were identified. Besides the well-known saturated aldehydes, unsaturated aldehydes, ketones, dicarbonyls, and benzaldehyde-derivatives were successfully identified.

Supplementary Materials

The following supporting information can be downloaded at: https://www.mdpi.com/article/10.3390/separations11040092/s1, Table S1: Experimental matrix for the 24 full factorial design study; Table S2: Real and coded matrices for the Box–Behnken design; Figure S1: Representative chromatogram of orange MDF bonded with MUF resin with thicknesses of 12 mm (Separations 11 00092 i001), 16 mm (Separations 11 00092 i002) and 19 mm (Separations 11 00092 i003
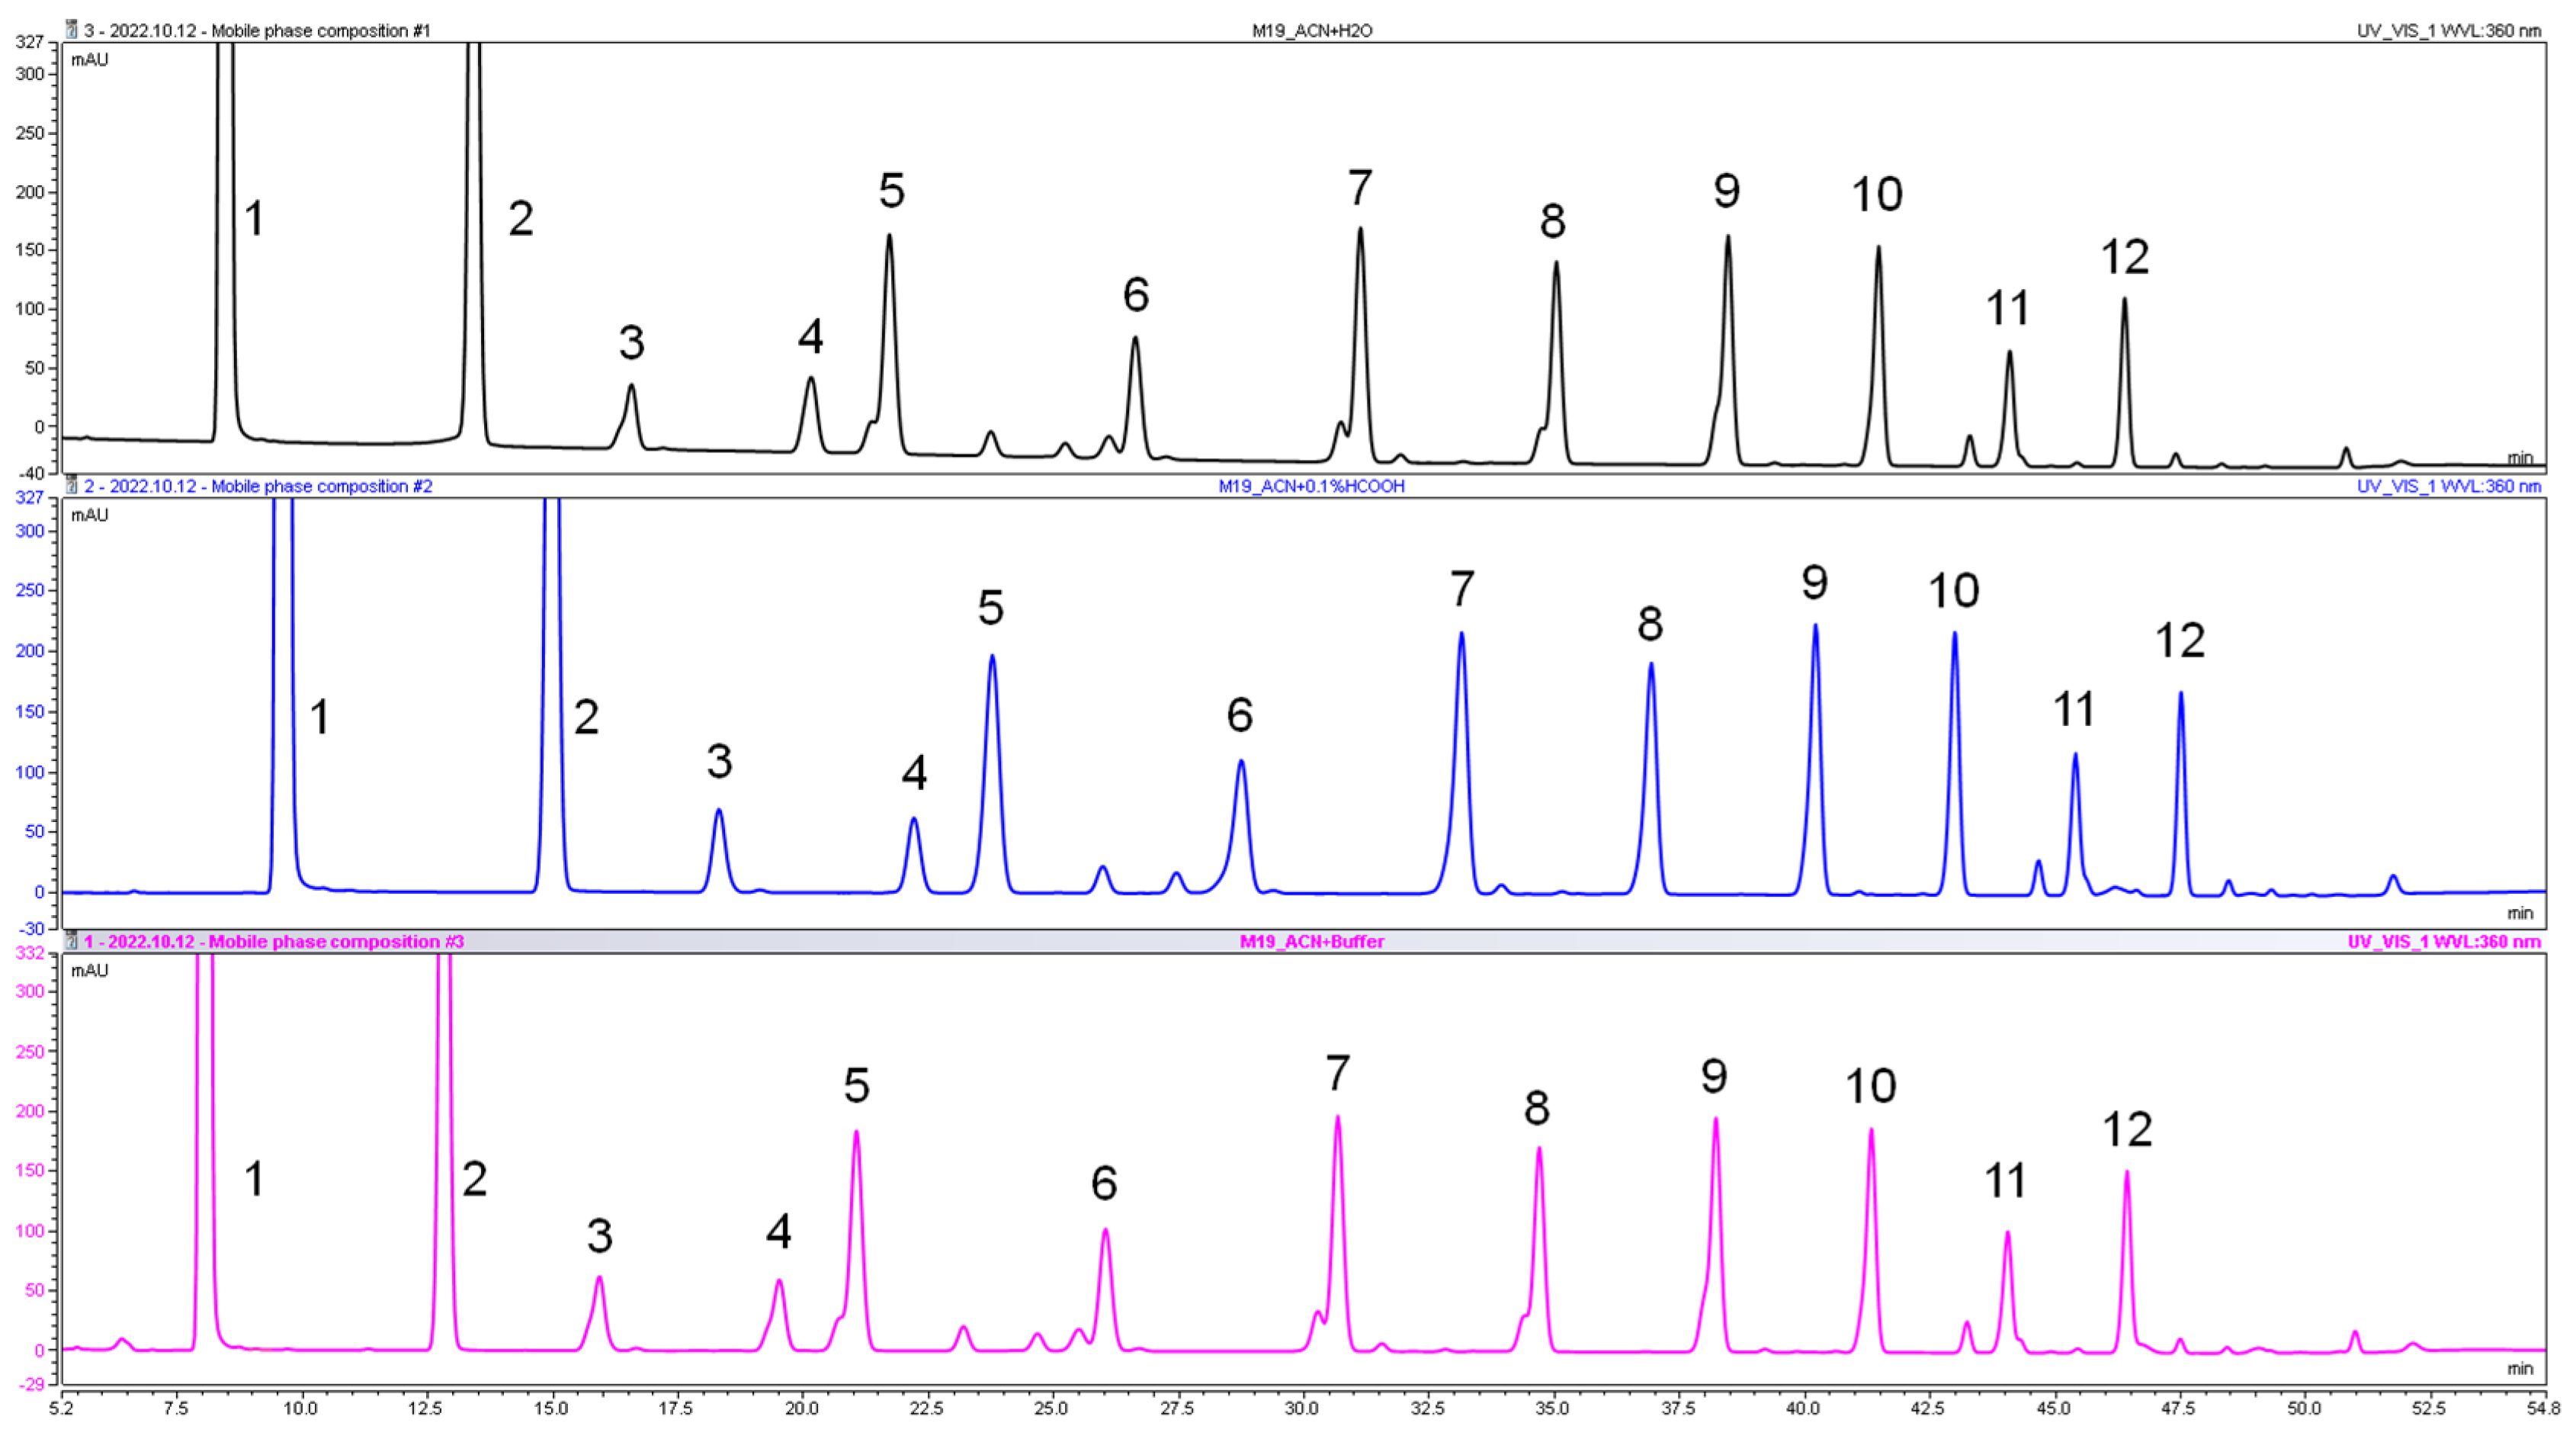
). Identified compounds as DNPH derivatives: 1—DNPH; 2—formaldehyde; 3—acetaldehyde; 4—acetone; 5—furfural; 6—propanal; 7—butanal; 8—benzaldehyde; 9—pentanal; 10—hexanal; 11—heptanal; 12—octanal; 13—nonanal; Figure S2: MS/MS spectrum for the [M—H] ion for Peaks 8, 13 and 20.

Author Contributions

F.D.G.: Investigation, Formal analysis; Writing—Review and Editing; J.M.M.: Methodology, Formal analysis, Writing—Review and Editing; L.H.C.: Methodology, Formal analysis, Writing—Review and Editing; J.A.R.: Resources, Writing—Review and Editing, Supervision; R.M.R.: Conceptualization, Methodology, Formal analysis, Resources, Writing—Original Draft, Writing—Review and Editing, Supervision, Funding acquisition. All authors have read and agreed to the published version of the manuscript.

Funding

This work received financial support from national funds (FCT/MCTES, Fundação para a Ciência e Tecnologia and Ministério da Ciência, Tecnologia e Ensino Superior) through project PTDC/CTM-PAM/1348/2021 (DOI: 10.54499/PTDC/CTM-PAM/1348/2021).

Institutional Review Board Statement

Not applicable.

Data Availability Statement

All new data are contained within the article or supplementary material.

Acknowledgments

This work was supported by FCT/MCTES through national funds: LAQV, UIDB/50006/2020 (DOI:10.54499/UIDB/50006/2020), UIDP/50006/2020 (DOI:10.54499/UIDP/50006/2020) and LA/P/0008/2020 (DOI: 10.54499/LA/P/0008/2020); LEPABE, UIDB/00511/2020 (DOI: 10.54499/UIDB/00511/2020) and UIDP/00511/2020 (DOI: 10.54499/UIDP/00511/2020) and ALiCE, LA/P/0045/2020 (DOI: 10.54499/LA/P/0045/2020). RMR acknowledges FCT for the Junior Research fellowship CEECIND/04259/2017 through the Individual Call to Scientific Employment Stimulus. The authors are grateful to Dra Zélia Azevedo for her contribution in HPLC-DAD-MS/MS analyses.

Conflicts of Interest

The authors declare no conflicts of interest.

References

  1. Irle, M.; Barbu, M.C.; Niemz, P.; Carvalho, L.; Martins, J.M.S.; Costa, C.A.V.; Muszynski, L.; Launey, M.E.; Dunky, M.; Aderhold, J.; et al. Wood-Based Panels—An Introduction for Specialists; Brunel University Press: London, UK, 2010. [Google Scholar]
  2. Salem, M.Z.M.; Böhm, M. Understanding of formaldehyde emissions from solid wood: An overview. BioResources 2013, 8, 4775–4790. [Google Scholar] [CrossRef]
  3. Hemmilä, V.; Adamopoulos, S.; Karlsson, O.; Kumar, A. Development of sustainable bio-adhesives for engineered wood panels-A Review. RSC Adv. 2017, 7, 38604–38630. [Google Scholar] [CrossRef]
  4. Simon, V.; Uitterhaegen, E.; Robillard, A.; Ballas, S.; Véronèse, T.; Vilarem, G.; Merah, O.; Talou, T.; Evon, P. VOC and carbonyl compound emissions of a fiberboard resulting from a coriander biorefinery: Comparison with two commercial wood-based building materials. Environ. Sci. Pollut. Res. 2020, 27, 16121–16133. [Google Scholar] [CrossRef] [PubMed]
  5. EN 316:2009; Wood Fibre Boards. Definition, Classification and Symbols. CEN-European Committee for Standardization: Brussels, Belgium, 2009.
  6. Kamke, F.A. Wood: Nonstructural Panel Processes. In Encyclopedia of Materials: Science and Technology; Buschow, K.H.J., Cahn, R.W., Flemings, M.C., Ilschner, B., Kramer, E.J., Mahajan, S., Veyssière, P., Eds.; Elsevier: Oxford, UK, 2001; pp. 9673–9678. [Google Scholar]
  7. Gonçalves, C.; Paiva, N.T.; Ferra, J.M.; Martins, J.; Magalhães, F.; Barros-Timmons, A.; Carvalho, L. Utilization and characterization of amino resins for the production of wood-based panels with emphasis on particleboards (PB) and medium density fibreboards (MDF). A review. Holzforschung 2018, 72, 653–671. [Google Scholar] [CrossRef]
  8. Hagel, S.; Joy, J.; Cicala, G.; Saake, B. Recycling of Waste MDF by Steam Refining: Evaluation of Fiber and Paper Strength Properties. Waste Biomass Valorization 2021, 12, 5701–5713. [Google Scholar] [CrossRef]
  9. Salthammer, T.; Mentese, S.; Marutzky, R. Formaldehyde in the indoor environment. Chem. Rev. 2010, 110, 2536–2572. [Google Scholar] [CrossRef] [PubMed]
  10. Salthammer, T. Emerging indoor pollutants. Int. J. Hyg. Environ. Health 2020, 224, 113423. [Google Scholar] [CrossRef] [PubMed]
  11. Adamová, T.; Hradecký, J.; Pánek, M. Volatile organic compounds (VOCs) from wood and wood-based panels: Methods for evaluation, potential health risks, and mitigation. Polymers 2020, 12, 2289. [Google Scholar] [CrossRef]
  12. Formaldehyde, 2-Butoxyethanol and 1-tert-Butoxypropan-2-ol; IARC Monographs on the Evaluation of Carcinogenic Risks to Humans, Volume 88; International Agency for Research on Cancer: Lyon, France, 2006.
  13. Bajer, T.; Šulc, J.; Ventura, K.; Bajerová, P. Volatile compounds fingerprinting of larch tree samples for Siberian and European larch distinction. Eur. J. Wood Wood Prod. 2020, 78, 393–402. [Google Scholar] [CrossRef]
  14. N’Guessan, J.L.L.; Niamké, B.F.; Yao, N.J.C.; Amusant, N. Wood Extractives: Main Families, Functional Properties, Fields of Application and Interest of Wood Waste. For. Prod. J. 2023, 73, 194–208. [Google Scholar] [CrossRef]
  15. Baumann, M.G.D.; Lorenz, L.F.; Batterman, S.A.; Zhang, G.Z. Aldehyde emissions from particleboard and medium density fiberboard products. For. Prod. J. 2000, 50, 75–82. [Google Scholar]
  16. Gabriel, M.; Behn, C.; Roffael, E. Influence of fibre preparation method and wood species on the VOC-emissions from MDF boards. Int. Wood Prod. J. 2015, 6, 79–83. [Google Scholar] [CrossRef]
  17. Kim, G.H.; Cho, J.S.; Ra, J.B.; Park, J.Y. Volatile organic compounds emissions from radiata pine MDF as a function of pressing variables. For. Prod. J. 2006, 56, 91–95. [Google Scholar]
  18. Brown, S.K. Chamber Assessment of Formaldehyde and VOC Emissions from Wood-Based Panels. Indoor Air 1999, 9, 209–215. [Google Scholar] [CrossRef] [PubMed]
  19. Jun, S.; Qi, F.; Ohlmeyer, M.; Wang, J. Effects of the antioxidants on the aldehyde emissions from MDF made of Scots pine (Pinus sylvestris L.). J. Chem. Pharm. Res. 2014, 6, 133–138. [Google Scholar]
  20. ISO 16000-3:2022; Indoor Air—Part 3: Determination of Formaldehyde and Other Carbonyl Compounds in Indoor and Test Chamber Air—Active Sampling Method. International Organization for Standardization: Geneva, Switzerland, 2022.
  21. ISO 16000-6:2021; Indoor Air—Part 6: Determination of Organic Compounds (VVOC, VOC, SVOC) in Indoor and Test Chamber Air by Active Sampling on Sorbent Tubes, Thermal Desorption and Gas Chromatography Using MS or MS FID. International Organization for Standardization: Geneva, Switzerland, 2021.
  22. ISO 16000-9:2006; Indoor Air—Part 9: Determination of the Emission of Volatile Organic Compounds from Building Products and Furnishing—Emission Test Chamber Method. International Organization for Standardization: Geneva, Switzerland, 2006.
  23. Wajs, A.; Pranovich, A.; Reunanen, M.; Willför, S.; Holmbom, B. Headspace-SPME Analysis of the Sapwood and Heartwood of Picea Abies, Pinus Sylvestris and Larix Decidua. J. Essent. Oil Res. 2007, 19, 125–133. [Google Scholar] [CrossRef]
  24. Jia, L.; Chu, J.; Li, J.; Ren, J.; Huang, P.; Li, D. Formaldehyde and VOC emissions from plywood panels bonded with bio-oil phenolic resins. Environ. Pollut. 2020, 264, 114819. [Google Scholar] [CrossRef] [PubMed]
  25. Schumann, A.; Lenth, C.; Hasener, J.; Steckel, V. Detection of volatile organic compounds from wood-based panels by gas chromatography-field asymmetric ion mobility spectrometry (GC-FAIMS). Int. J. Ion Mobil. Spectrom. 2012, 15, 157–168. [Google Scholar] [CrossRef]
  26. Pacheco, J.G.; Valente, I.M.; Gonçalves, L.M.; Rodrigues, J.A.; Barros, A.A. Gas-diffusion microextraction. J. Sep. Sci. 2010, 33, 3207–3212. [Google Scholar] [CrossRef]
  27. Brandão, P.F.; Ramos, R.M.; Almeida, P.J.; Rodrigues, J.A. Determination of Carbonyl Compounds in Cork Agglomerates by GDME-HPLC-UV: Identification of the Extracted Compounds by HPLC-MS/MS. J. Agric. Food Chem. 2017, 65, 1037–1042. [Google Scholar] [CrossRef]
  28. Ferreira, R.C.; Ramos, R.M.; Gonçalves, L.M.; Almeida, P.J.; Rodrigues, J.A. Application of gas-diffusion microextraction to solid samples using the chromatographic determination of α-diketones in bread as a case study. Analyst 2015, 140, 3648–3653. [Google Scholar] [CrossRef] [PubMed]
  29. Brandão, P.F.; Ramos, R.M.; Valente, I.M.; Almeida, P.J.; Carro, A.M.; Lorenzo, R.A.; Rodrigues, J.A. Gas-diffusion microextraction coupled with spectrophotometry for the determination of formaldehyde in cork agglomerates. Anal. Bioanal. Chem. 2017, 409, 2885–2892. [Google Scholar] [CrossRef] [PubMed]
  30. Ferreira, I.M.; Carvalho, D.O.; Silva, M.G.; Guido, L.F. Gas-diffusion microextraction (GDME) combined with derivatization for assessing beer staling aldehydes: Validation and application. Foods 2021, 10, 1704. [Google Scholar] [CrossRef] [PubMed]
  31. Czitrom, V. One-Factor-at-a-Time versus Designed Experiments. Am. Stat. 1999, 53, 126–131. [Google Scholar] [CrossRef]
  32. Miller, J.N.; Miller, J.C. Statistics and Chemometrics for Analytical Chemistry, 6th ed.; Pearson Education Limited: London, UK, 2010. [Google Scholar]
  33. Sun, S.; Zhao, Z.; Shen, J. Effects of the manufacturing conditions on the vocs emissions of particleboard. BioResources 2020, 15, 1074–1084. [Google Scholar] [CrossRef]
  34. Chrobak, J.; Iłowska, J.; Chrobok, A. Formaldehyde-Free Resins for the Wood-Based Panel Industry: Alternatives to Formaldehyde and Novel Hardeners. Molecules 2022, 27, 4862. [Google Scholar] [CrossRef] [PubMed]
  35. Korenberg, C.; Bertolotti, G. Emissions from MDF: Governing Factors and Mitigation Strategies. Stud. Conserv. 2019, 64, 249–260. [Google Scholar] [CrossRef]
  36. Kölliker, S.; Oehme, M.; Dye, C. Structure elucidation of 2,4-dinitrophenylhydrazone derivatives of carbonyl compounds in ambient air by HPLC/MS and multiple MS/MS using atmospheric chemical ionization in the negative ion mode. Anal. Chem. 1998, 70, 1979–1985. [Google Scholar] [CrossRef]
  37. Zwiener, C.; Glauner, T.; Frimmel, F.H. Liquid Chromatography/Electrospray Ionization Tandem Mass Spectrometry and Derivatization for the Identification of Polar Carbonyl Disinfection By-Products. In Liquid Chromatography/Mass Spectrometry, MS/MS and Time of Flight MS; ACS Symposium Series; American Chemical Society: Washington, DC, USA, 2003; Volume 850, pp. 356–375. [Google Scholar]
  38. Santos, J.R.; Rodrigues, J.A. Characterization of volatile carbonyl compounds in defective green coffee beans using a fan assisted extraction process. Food Control 2020, 108, 106879. [Google Scholar] [CrossRef]
  39. Cruz, M.P.; Valente, I.M.; Gonçalves, L.M.; Rodrigues, J.A.; Barros, A.A. Application of gas-diffusion microextraction to the analysis of free and bound acetaldehyde in wines by HPLC-UV and characterization of the extracted compounds by MS/MS detection. Anal. Bioanal. Chem. 2012, 403, 1031–1037. [Google Scholar] [CrossRef]
  40. Schulte-Ladbeck, R.; Lindahl, R.; Levin, J.O.; Karst, U. Characterization of chemical interferences in the determination of unsaturated aldehydes using aromatic hydrazine reagents and liquid chromatography. J. Environ. Monit. 2001, 3, 306–310. [Google Scholar] [CrossRef]
  41. Teixeira, S.L.; Santos, J.R.; Almeida, P.J.; Rodrigues, J.A. Fan assisted extraction and HPLC-DAD-MS/MS identification of volatile carbonyl compounds as chemical descriptors of healthy and defective roasted coffee beans. Food Control 2022, 138, 109014. [Google Scholar] [CrossRef]
  42. Richardson, S.D.; Caughran, T.V.; Poiger, T.; Guo, Y.; Crumley, F.G. Application of DNPH Derivatization with LC/MS to the Identification of Polar Carbonyl Disinfection Byproducts in Drinking Water. Ozone Sci. Eng. 2000, 22, 653–675. [Google Scholar] [CrossRef]
  43. Ochs, S.D.M.; Fasciotti, M.; Netto, A.D.P. Analysis of 31 hydrazones of carbonyl compounds by RRLC-UV and RRLC-MS(/MS): A comparison of methods. J. Spectrosc. 2015, 2015, 890836. [Google Scholar] [CrossRef]
  44. Foyer, G.; Chanfi, B.-H.; Virieux, D.; David, G.; Caillol, S. Aromatic dialdehyde precursors from lignin derivatives for the synthesis of formaldehyde-free and high char yield phenolic resins. Eur. Polym. J. 2016, 77, 65–74. [Google Scholar] [CrossRef]
  45. Cantarella, M.; Cantarella, L.; Gallifuoco, A.; Spera, A.; Alfani, F. Effect of inhibitors released during steam-explosion treatment of poplar wood on subsequent enzymatic hydrolysis and SSF. Biotechnol. Prog. 2004, 20, 200–206. [Google Scholar] [CrossRef] [PubMed]
Figure 1. Chromatograms obtained for the three mobile phases studied: acetonitrile and water (black line, on top), acetonitrile and 0.1% formic acid (blue line, in the middle), acetonitrile and 10 mmol L−1 ammonium acetate buffer (pink line, bottom). The compounds identified by the numbers are: 1—DNPH, 2—formaldehyde−DNPH, 3—acetaldehyde−DNPH, 4—acetone−DNPH (contamination in DNPH reagent), 5—propanal−DNPH, 6—butanal−DNPH, 7—pentanal−DNPH, 8—hexanal−DNPH, 9—heptanal−DNPH, 10—octanal−DNPH, 11—nonanal−DNPH, 12—decanal−DNPH.
Separations 11 00092 g001
Figure 2. Pareto charts for formaldehyde, acetaldehyde, furfural, and benzaldehyde obtained using TIBCO Statistica®.
Separations 11 00092 g002
Figure 3. Surface response models obtained for the interaction between temperature and time of extraction for formaldehyde, acetaldehyde, furfural, benzaldehyde, and hexanal for the Box–Behnken design, obtained using TIBCO Statistica®.
Separations 11 00092 g003
Figure 4. Representation of TVOC obtained for the analysis of nine MUF-bonded MDF samples of 19 mm thickness. TVOC are expressed as the sum of the chromatographic area obtained for formaldehyde, acetaldehyde, furfural, propanal, butanal, benzaldehyde, pentanal, hexanal, heptanal, octanal, and nonanal. The data are expressed as the mean ± SD values for at least three independent experiments. The statistically significant differences are marked by different letters, where values with different letters are significant different according to Tukey’s test (p < 0.05).
Separations 11 00092 g004
Figure 5. Representation of TVOC obtained for the analysis of white-grey (A) and black (B) MDF samples of 19 mm thickness. TVOC are expressed as the sum of the chromatographic area obtained for formaldehyde, acetaldehyde, furfural, propanal, butanal, benzaldehyde, pentanal, hexanal, heptanal, octanal, and nonanal. The data are expressed as the mean ± SD values for at least three independent experiments. The statistically significant differences are marked by different letters, where values with different letters are significant different according to Tukey’s test (p < 0.05). Black MDF sample 1 and 2, represented with a pattern, were produced with a UF resin.
Separations 11 00092 g005
Table 1. List of MDF samples analysed in this work.
ColourThickness/mm (n° Samples)
Black8 (1), 16 (1), 19 (4) *
Khaki19 (2)
Chocolate Brown8 (1), 16 (1), 19 (2)
Green Mint8 (1), 19 (1)
Grey8 (2) §, 12 (2), 16 (1), 19 (4) §
Orange12 (1), 16 (1), 19 (5)
Scarlet19 (3)
White Grey8 (1), 16 (1), 19 (4)
Yellow16 (1), 19 (3)
* Two samples produced with UF resin. § One sample produced with UF resin.
Table 2. Factors and levels for the 24 full factorial design.
FactorLow (−1)Centre (0)High (+1)
Temperature (°C)304560
Time (min)103560
Volume of DNPH (µL)250500750
Concentration of DNPH [% (w/v)]0.100.200.30
Table 3. List of identified compounds, as DNPH derivatives, in the extracts of MDF samples.
CompoundtR (Min)Identified Compound[M–H]Product Ions (m/z)Standard and/or
Reference
18.491-hydroxypropan-2-one (Acetol) 253.01177, 179, 152, 151Standard; [37]
212.34Formaldehyde208.95163, 120, 151, 123, 179Standard; [27]
315.63Acetaldehyde223.07179, 178, 163, 151, 152Standard; [27]
419.40Propan-2-one (Acetone)237.03151, 179, 207, 152Standard; [27]
520.74Furan-2-carbaldehyde
(Furfural)
275.05228, 163, 179, 151, 111Standard; [27]
621.09Propanal237.10179, 151, 207, 163, 191Standard; [27]
722.92Hydroxyheptanone *309.11233, 152, 179, 165, 279[38]
823.924-hydroxybenzaldehyde301.01182, 163, 254, 137, 255Standard; [36]
924.56Prop-2-enal (Acrolein)433.05235, 223, 179, 415, 209Standard; [39,40]
1025.85Butanal251.12163, 179, 205, 152Standard; [39]
1126.83(E)-but-2-enal
(Crotonaldehyde)
447.10429, 237, 249, 179, 411Standard; [36]
1227.62Benzaldehyde285.03163, 238, 121, 179, 192Standard; [27]
1329.42Unknown461.07237, 223, 179, 263, 443[36,41]
1429.77Oxaldehyde (Glyoxal)417.07182, 234Standard; [37]
1529.85Pentanal265.12163, 179, 152, 151, 220Standard; [27]
1631.93Pentane-2,3-dione459.13276, 182, 261, 279, 179Standard; [41]
1733.36Hexanal279.04163, 179, 152, 153, 205Standard; [27]
1835.51(E)-2-heptenal291.15163, 152, 214, 219, 244Standard; [38]
1935.88Butane-2,3-dione445.15182, 399, 364, 265, 179Standard; [41]
2036.17aldehyde-aromatic not ortho substituted327.09163, 280, 179, 234, 162[36]
2136.69Heptanal293.19163, 179, 152, 153, 247Standard; [27]
2238.58(E)-oct-2-enal305.19228, 163, 152, 258, 233Standard; [38]
2338.942,5-dihydroxybenzaldehyde *317.06230, 270, 244, 163, 249[42]
2439.67Octanal307.13163, 179, 152, 261, 153Standard; [27]
2542.40Nonanal321.13163, 179, 152, 275, 157Standard; [43]
2643.95(E)-dec-2-enal333.20163, 261, 152, 179, 257Standard; [36]
2744.88Decanal335.21163, 289, 179, 171, 152Standard; [43]
* Tentative identification.
Disclaimer/Publisher’s Note: The statements, opinions and data contained in all publications are solely those of the individual author(s) and contributor(s) and not of MDPI and/or the editor(s). MDPI and/or the editor(s) disclaim responsibility for any injury to people or property resulting from any ideas, methods, instructions or products referred to in the content.

