

Decoding the Volatile Profile of White Romanian Fetească Wines
by
 , ,
, ,
Fulvia-Ancuța Manolache
1 ,
,
Denisa-Eglantina Duță
1,
Gabriela Daniela Criveanu-Stamatie
1,
Teodora-Alexandra Iordache
1 and
Maria-Cristina Todașcă
2,* 1
National Research & Development Institute of for Food Bioresources, IBA Bucharest, 6th Dinu Vintila Street, 021102 Bucharest, Romania
2
“C. Nenitescu” Department of Organic Chemistry, Faculty of Chemical Engineering and Biotechnology, National University of Science and Technology Politehnica, 1–7 Gh. Polizu Street, 011061 Bucharest, Romania
*
Author to whom correspondence should be addressed.
Separations 2024, 11(5), 141; https://doi.org/10.3390/separations11050141
Submission received: 15 April 2024
/
Revised: 28 April 2024
/
Accepted: 30 April 2024
/
Published: 3 May 2024
(This article belongs to the Topic Advances in Analysis of Food and Beverages)
Abstract
:The wine’s volatilome, most of the time, defines not only its aroma, but also, its major attributes. In the case of wines, the authentication process has become imperative, in light of increased production of alcoholic beverages; consequently, reliable analytical methods have served for it. Therefore, the goal of this research was to establish the global volatile profile of traditional Romanian white wines from Fetească varieties (Fetească albă, Fetească regală) in order to identify its unique characteristics by means of a headspace solid-phase microextraction coupled with gas chromatography analysis (HS-SPME/GC-MS) and e-Nose devoted techniques. Statistics was also employed aimed at differentiating the analyzed wine by varietal groups. Consequently, 23 volatile compounds were detected and quantified in 39 Fetească white wine samples originating from various production areas (Muntenia, Oltenia, Transylvania, Banat and Dobrogea), then further classified according to their odor thresholds in five aromatic classes (floral, fruity, sweet, lactic (cheesy) and other). In addition, statistics (Principal Component Analysis (PCA), Hieratical Clustering Analysis (HCA)) were used aiming to differentiate the analyzed varietal groups. The outcomes have pointed out the existence of distinct clusters connected with ethyl esters or alcohol composition and production year, depending on each examined variety.
1. Introduction
Traditional wines are part of the cultural heritage of every EU country. In the case of grape varieties that are cultivated widely, there are specific expectations in terms of taste and color of the obtained wines (for instance, Cabernet Sauvignon wines, which meet specific taste and color requirements regardless of the geographical origin). Local grape varieties used for traditional winemaking, which are cultivated only in limited areas, are still in need of steadiness in the characteristics of the final product.
Currently, the global wine market is growing, and so is wine production, showing the need for continuous authentication of local, traditional, specific wines. Oenologists and researchers have endeavored to prove the genuineness of conventional wines or trademarks wines (e.g., PDO, CDO or PGI), mainly based on the distinctive fragrance/aroma [1,2].
Wine’s aroma is one of the most predominant qualitative traits, with volatile compounds leading to the promotion of some molecules further binding to olfactory receptors, finally affecting the consumer’s acceptance [3]. The aroma of wine can be influenced by several factors, including grape variety, climatic conditions (temperature and precipitation), harvesting time or biochemical processes that occur during fermentation/aging/maturation processes. According to the literature, over 800 compounds have been identified in wines, including alcohols, esters, phenols, lactones and aldehydes, with a large variety of these standing for the pursued objective [4].
The HS-SPME/GC-MS technique proved to be a reliable tool for detecting and identifying specific wine components, such as volatile aroma compounds (terpenes, alcohols, ethyl esters, etc.) [5,6]. This technique allows for the analysis of the volatile profile of wines, providing information on the composition and characteristics of the integrated aroma compounds [7]. It has been used to analyze the volatile compounds in different wine varieties and regions, highlighting the sensory attributes and volatiles that contribute to the diversity of wines [8]. Overall, the HS-SPME/GC-MS assay is a valuable analytical technique for the detection and identification of specific wine components, allowing for a better understanding of the aroma profile and sensory attributes of wines. HS/SPME, coupled with GC/MS and statistical analyses, such as analysis of variance, linear discriminant analysis (LDA), PCA, and factor analysis (FA), were employed by Karabagias et al. (2021) to analyze the data obtained from the volatile profile of eight Greek white wines (dry and demi-dry from different growing regions). The findings of the study underscored the effectiveness of volatile compound identification and characterization in clear facilitating the differentiation among the examined wine samples [9].
Lin Zhang et al. (2023) characterized 99 commercially available Chinese wine samples, comprising Cabernet Sauvignon (CS), Syrah (S), and Merlot (M) using HS-SPME/GC-MS. The primary focus was on delineating the volatile fingerprint. Examination of a total of 54 constituents, both qualitatively and quantitatively, revealed significant disparities among specific regions. Notably, ethyl acetate emerged as the most prevalent ethyl ester in CS samples, within the concentration range of 40.8 to 264.3 mg/L. Phenylethyl alcohol, with concentrations ranging from 21.7 to 76.0 mg/L, significantly contributed to defining the overall aroma profile of CS wines. Additionally, various statistical methodologies, including PCA and sensory description assays, complemented the study, highlighting the considerable diversity among the examined samples [10].
In a separate study, Rubén Del Barrio-Galán et al. (2021) tried to identify the volatiles and other specific compounds, such as total organic acids, glycerol, and low-molecular-weight phenolic compounds, present in 73 white and rosé wines originating from diverse Spanish regions with Protected Designations of Origin (PDO). Analysis was conducted using HPLC-DAD and HS-SPME/GC-FID techniques. Principal Component Analysis and least significant differences, employing the ANOVA tool, were indispensable tools in identifying the variables contributing most to the differentiation of wines, based on their PDOs. This analysis revealed distinct differences among the studied wines originating from various PDO areas, despite their geographical proximity [11].
Another import technique used for the volatilome characterization of wine is electronic nose technology. This technique has been used to assess volatile aromatic compounds in agriculture and food applications, including determining products’ maturity stage, pest and disease attacks, or for classification purposes [12]. An electronic nose, also known as an e-Nose, plays a significant role in wine analysis, offering a modern and efficient alternative to traditional methods. In the wine industry, electronic noses have shown potential for the identification and classification of wine varieties or quality [13]. Electronic noses are designed to detect and analyze volatile organic compounds (VOCs) present in wines. These VOCs contribute to the aroma and flavor profile of the wine. They have been used to analyze and identify distinct varieties of wine, showing significant differences between samples and classifying them according to chemical analysis [14]. Additionally, electronic noses have been used to detect 2,4,6-trichloroanisole (TCA) in wine, which causes cork taint, and to classify cork samples with low TCA concentrations [15].
Electronic nose technology has the potential to be implemented in the wine industry for routine quality assurance purposes. Winemakers could use electronic noses to assess the aging potential and quality of their wines throughout the production process, enabling them to make informed decisions about blending, bottling, and storage conditions.
The objective of this study was to highlight the volatile profile of two traditional Romanian white wines using HS-SPME/GC-MS and electronic nose techniques. Fetească regală (FR) and Fetească albă (FA) wine samples were selected from different wine producing regions of Romania, covering all growing regions, specific for each variety of grapes. This sampling strategy aimed to provide a comprehensive representation of the various geographic regions where these grape varieties are cultivated. Based on the current knowledge, no research has been conducted on Romanian wines covering the selected winemaking areas. In this study, the electronic nose provided a digital fingerprint of the volatile compounds present in the analyzed wine samples.
2. Materials and Methods
2.1. Wine Samples
The research study has focused on two native grape varieties, specifically, Fetească albă (FA) and Fetească regală (FR). A total of 39 wine samples originating from various wine-producing regions across Romania were investigated. Namely, 16 samples of FA wine were analyzed, sourced from vineyards from Muntenia, Oltenia, Moldova and Transylvania, whereas the 23 samples of FR wine were cultivated in Muntenia, Oltenia, Moldova, Transylvania, Dobrogea and Banat. These wines were procured from local wineries, and from different production years (Table 1).
The selected samples cover all winemaking areas where Fetească variety of white wines are produced (Figure 1).
2.2. Chemicals and Reagents
The reagents and materials which were used for the GC-MS analysis are: 2-octanol, the reference solution, from Sigma Aldrich (Saint Louis, MO, USA); Sodium chloride (>99% purity) from LachNer (Neratovice, Czech Republic); TG-Wax MS capillary column (30 m × 0.25 mm × 0.25 µm) from Thermo Fisher Scientific (Waltham, MA, USA); The grey SPME fiber 50/30 µm divinylbenzene/carboxen/polydimethylsiloxane (DVB/CAR/PDMS) was bought from Merck, Supelco (Darmstadt, Germany).
2.3. Methods
2.3.1. HS-SPME/GC-MS Analysis
HS-SPME/GC-MS has been extensively used to identify the volatile profile of wine samples.
a. Wine sample preparation. Volatile compounds were analyzed according to the method of Hanganu A. et.al (2012) with some modifications. Prior to the analysis, the wine samples were stored at a temperature of +4 °C. An aliquot of wine (10 mL) was added to a 20 mL glass vial containing NaCl (3 g); an internal standard solution of 2-octanol (1 mg/mL) was further added. The vial with the mixture was agitated on a shaker with controlled temperature, 40 °C at 200 rpm for 30 min. The SPME fiber, divinylbenzene/carboxen/polydimethylsiloxane (DVB/CAR/PDMS), was inserted into the headspace of the sample vial and kept under constant stirring of the sample, 200 rpm, 30 min, for continuous adsorbtion. Thus, the adsorption of volatile compounds on the fiber was achieved. Different SPME fibers, PDMS, PDMS–DVB, CAR–PDMS and DVB/CAR/PDMS were previously tested by Jordi Torrens et al. in a volatile compound analysis of white and red wines, and the DVB/CAR/PDMS fiber proved to be the best option for the analysis of volatile compounds in wines. This way, adapting the parameters and conditions to the specific equipment, the same fiber was used for the identification of the volatile profile of the analyzed white wines [19].
b. Chromatographic Analysis
Following the incubation and extraction operations, the volatile compounds adsorbed on the fiber were thermally desorbed in the GC-MS injector (FOCUS GC), and were further analyzed using the mass spectrometer POLARISQ, an ion-trap mass spectrometer. The gas chromatograph was equipped with a TG-Wax MS capillary column (30 m × 0.25 mm × 0.25 µm). All injections were performed in split mode following a 1:10 split ratio, using He as carrier gas, at a constant rate of 1 mL/min. The mass range, m/z 25–250, Full Scan Mode in EI (electron ionization) mode, served at compounds identification.
The initial temperature of the FOCUS GC oven was 40 °C for 5 min, then it ramped up to 240 °C, with 5 °C/min and held at 240 °C for 10 min. The desorption and separation of the compounds lasted 55 min. The transfer line was maintained at 240 °C
Identification of the aroma substances was carried out using the detected m/z (details about volatile organic compounds detected via GC-MS analysis, matching with NIST library are shown in the supplementary materials Figure S1), and corroborated the data found in the literature and NIST library [11].
2.3.2. Odor Threshold Value (OTV) and Aroma Series
The odor threshold value (OTV) represents the smallest content of a chemical in the vapory phase possible to be detected by smell. The OTVs measurements were conducted by dividing the determined compound concentration in the wine (using GC-MS assay) by the concentration corresponding to its odor threshold recovered from literature sources; see Equation (1).
where, C is the concentration of volatile determined into the analyzed samples, using GC-MS analysis; and T is the odor threshold reported in the specialized literature sources.
OTV = C/T
The aroma series comprises a group of volatiles, similar in terms of sensorial descriptors, with their mathematical value being the average of OTVs of aroma constituents [20].
2.3.3. Electronic Nose (e-Nose) Technique Sampling
The global volatile composition of white wine samples was analyzed, using the α-Prometheus multi-sensor system for food quality control (e-Nose) (FOX 4000, Alpha M.O.S., Toulouse, France) equipped with 18 metal oxide sensors.
Sample preparation consisted of 0.05 g of each sample weighted into 10 mL vials. Vials were capped and incubated at 35 °C in the oven of the equipment for 300 s, under agitation at 250 rpm, to engender liquid vapors to generate the volatile headspace. A total of 1000 µL of the headspace was injected, with a speed of 1000 µL/s, into the measuring chamber of the electronic nose.
Three replications were performed for each wine type, and a statistical analysis was applied to the recorded signals. The data underwent analysis using the Alpha Soft version 2.1 software. Weekly sensor diagnostics checks were conducted utilizing the manufacturer-provided sensor diagnostics kit.
2.3.4. Statistical Analysis
Statistical analysis was carried out using the statistical package XLSTAT, an add-in for Microsoft Excel. PCA and HCA were performed on wine’s compositional data, generated from the HS-SPME/GC-MS analysis.
3. Results and Discussion
3.1. HS-SPME/GC-MS
Following the analysis of the 39 white wine samples from FA and FR varieties, a total number of 23 volatile compounds have been identified and quantified: ethyl acetate; butanoic acid, ethyl ester; isovaleric acid, ethyl ester; isopentyl alcohol, acetate; hexanoic acid, ethyl ester; lactic acid, ethyl ester; octanoic acid, ethyl ester; decanoic acid, diethyl ester; butandioic acid, diethyl ester; acetic acid, penthyl ester; propyl alcohol; isobutyl alcohol; isopentyl alcohol; phenylethyl alcohol; 2, 3-butandiol; glycerin; hexanoic acid; octanoic acid; sorbic acid; decanoic acid; ionone; and furfural and acetic acid. Figure 2 presents the gas chromatogram (relative abundance function time) of the volatile compounds extracted from Fetească albă wine produced at Dealu Mare, and in Table 2, the names of volatile compound identified in this sample are presented.
The volatile compounds identified in all of the 39 analyzed samples were divided in several chemical classes, including esters, alcohols, aldehydes/ketones and organic/carboxylic acids. The number of identified volatile compounds in Fetească variety wines is comparable to those in the literature sources. As proof, in the study performed by Delia Elena Urcan et al. (2015) [21], the authors have identified in Fetească albă and regală varieties, by means of HPLC, 24 bound and free volatile compounds. On the same grape varieties as those we have employed, Colibaba Cintia et al. (2014) [22], using GC, have scored a number of 31 compounds (including terpenes). In addition, George Adrian Cojocaru and Arina Oana (2019) [23] have identified, working on Fetească regală produced by different pre-treatments of the must, 23 volatile compounds, including monoterpenes.
Alcohols, aromatic and aliphatic ones, are usually synthesized via the anabolic pathway of sugar metabolism. Some of these compounds contribute to defining/completing the fruity and flowery notes (e.g., 2-phenylethanol can express aromas such as honey or roses); meanwhile, others promote unpleasant odors (e.g., 2/3-methyl-1-butanol draws undesirable smells and aromas), depending on the concentration retrieved in the wine [24,25]. From the comparative analysis of FA and FR wine samples, the highest amount of alcohols were noted in the Muntenia region, namely isobutyl and isopentyl alcohols, and in the case of FR wines, in addition to Muntenia, in the Transylvania area. 2,3–butanediol and phenylethyl alcohol distinguished themselves among the six determined alcohols, by their contribution to the buttery or floral sent (rose like) [26], being spotted into the same two mentioned regions.
Esters play a fundamental role in defining wine destination by favoring fruity and floral flavors. They are formed, in a small quantity, during grape ripening, and the majority during the fermentation processes (alcoholic and malolactic) [24]. According to the odor descriptors previously reported (Table 3), ethyl butyrate may be responsible for the sour fruit, strawberry, or sweet fruit aroma. The flavor of green apple, fruit, strawberry, and anise was considered to originate from the contribution of ethyl hexanoate. Ethyl octanoate yielded the pineapple, pear and floral aromas, and ethyl lactate helped in pointing out the role of lactic and raspberry odors in defining the global aroma profile [27]. Additionally, ethyl isovalerate and amyl acetate have been observed in Transylvania, Muntenia, Moldova, and even Oltenia (only amyl acetate), in FA samples.
Ethyl isovalerate and amyl acetate were associated with banana or sweet fruit smells. Among the ethyl esters found in FR and FA, the most abundant were hexanoic, octanoic acids ethyl esters, closely followed to butandioic acid diethyl ester.
The presence of carboxylic acids can be detected, in a small part, in the must prior to the alcoholic fermentation; meanwhile, the rest or the highest quantity of these are formed during the metabolic processes conducted by microorganisms [28]. Referring to the volatile fatty acids retrieved for the wine samples, hexanoic acid, followed by octanoic acid, were widespread among the selected areas. The distribution of sorbic acid (pH corrector acid), among FR and FA samples was marked in Moldova and Muntenian regions; meanwhile, decanoic acid had a more visible contribution, particularly in FR wines in Muntenia, Dobrogea, and Moldova.
Acetic acid measured at a maximum concentration level of 243 mg/L (the normal measured level, in wines, is around 300 mg/L), independent of white wine category or regions, indicated a positive influence, especially in reacting with esters producing acetate esters in defining the final quality of wines [29].
Furfural was determined in the Transylvania, Oltenia and Moldova regions for both FA and FR; the same as ionone, which has a more pronounced influence.
In view of making data easier to visualize and compare, a heatmap representation was plotted. The correlations established between the variable compounds, using the heatmap (Figure 3), revealed that, although the identified chemical families are almost the same for both varieties of Fetească wine (FA, FR), there are no visible differences between the samples collected from different growing regions.
3.2. Aroma Correlation between White Wine Samples
Each identified volatile compound imprints a different characteristic on the overall aroma profile of white wines. Thus, in order to assess the influence of the aroma compounds in the studied Fetească white wines, the OTVs were determined. However, a volatile can express multiple aromas, making it difficult to be single-classified; therefore, these aromatic compounds (similar in terms of sensorial descriptors) were further grouped in five aromatic series: floral, fruity, sweet, lactic (cheesy) and other [20].
The gathered data was assembled into a bipartite network consisting of two nodes: the five aromatic series and their corresponding volatile organic compounds, covering five classes, using yEd graph Editor (Figure 4). Further, for the construction of an aroma network dedicated to each category of the analyzed white wines, the OTVs were summed together based on shared aroma characteristics, employing Microsoft Excel, 2013 (Figure 5) [2].
For FA wines, the fruity scent of volatile organic compounds gives the most of the wine’s global aroma, shortly followed by floral, in a smaller percentage (16%). Ethyl esters and alcohols are those responsible for this fruity predominant note, their concentration being much higher than their odor thresholds reported by various scientific papers. These findings are similar to the results reported by Sílvia Petronilho et al. (2020). In accordance with the graphical representation of aroma series for FR wines, the floral scent of volatile organic compounds is responsible for the global profile of this wine category. Ethyl octanoate exhibited the biggest OVT, among the fifth compounds responsible for the fruity aroma [2].

Table 3.
Detailed data regarding the sensorial attributes of the identified volatiles compounds.
| No. | Wine’s Volatile Compounds | Wine’s Odor Descriptors | Odor Thresholds | |
|---|---|---|---|---|
| Compound’s Chemical Classes | Volatile Compound’s Name | |||
| 1. | Ethyl esters | Ethyl acetate | Aromatic, Brandy, Grape [30] | 5 ppb to 5 ppm [31] |
| 2. | Butanoic acid ethyl ester (ethyl butanoate/ethyl butyrate) | Sour fruit, banana and strawberry flavors, floral and fruity aromas [32] | 0.1 to 18 ppb [31] | |
| 3. | Isovaleric acid, ethyl ester (ethyl isovalerate) | Apple, Fruit, Pineapple, Sour [3] | 0.01 to 0.4 ppb [31] | |
| 4. | Isopentyl alcohol, acetate (1-butanol, 3-methyl-, acetate/isoamyl acetate) | Banana, Apple, Glue, Pear [30] | 17 μg/L [3] | |
| 5. | Hexanoic acid ethyl ester (ethyl hexanoate) | Apple Peel, Brandy, Fruit Gum, Overripe Fruit, Pineapple [30] | 0.3 to 5 ppb [31] | |
| 6. | Lactic acid, ethyl ester (ethyl lactate) | Cheese, Floral, Fruit, Pungent, Rubber [30] | 0.15 ppm [33] | |
| 7. | Octanoic acid ethyl ester (ethyl octanoate) | Apricot, Brandy, Fat, Floral, Pineapple [30] | 0.002 ppm [33] | |
| 8. | Decanoic acid diethyl ester (ethyl laurate) | Floral, Fruity [31] | 50 ppm [31] | |
| 9. | Butandioic acid diethyl ester (diethyl succinate) | Cotton, Fabric, Floral, Fruit, Wine [30] | 10 ppm [31] | |
| 10. | Acetic acid, penthyl ester (amyl acetate) | Apple, Banana, Glue, Pear [30] | 0.0052 ppm [34] | |
| 11. | Alcohols | Propyl alcohol (1-propanol) | Alcohol, ripe fruit flavors [32] | 5.7 to 40 ppm [31] |
| 12. | Isobutyl alcohol (2-methyl-1-propanol) | Sweet, Musty [31] | 360 ppb to 3.3 ppm [31] | |
| 13. | Isopentyl alcohol (isoamyl alcohol/3-methyl-1-butanol) | Mellow, Astringent, whisky-characteristic [32] | 250 ppb to 4.1 ppm [31] | |
| 14. | Phenylethyl alcohol (2-phenylethanol) | Fruit, Honey, Lilac, Rose, Wine [30] | 0.015 ppb to 3.5 ppm [31] | |
| 15. | 2–3 butandiol | Butter, creamy [27,35] | 120 ppm | |
| 16. | Carboxylic acids | Hexanoic acid (Caproic acid) | Cheese, Oil, Pungent, Sour [30] | 93 ppb to 10 ppm [31] |
| 17. | Octanoic acid (Caprylic acid) | Cheese, Fat, Grass, Oil [30] | 10 ppm [31] | |
| 18. | Decanoic acid (Capric acid) | Dust, Fat, Grass [3] | 1.6 ppm | |
| 19. | Acetic acid | Sour and pungent vinegar odor [32] | 15 ppm [31] | |
| 20. | Aldehydes/ Ketones | Ionone | Violet, Wood, Floral [30,33] | 0.9 ppb |
| 21. | Furfural | Almond, Baked Potatoes, Bread, Burnt, Spice [3] | 65 ppm | |
3.3. Electronic Nose (e-Nose) Results
The electronic nose analysis presents pattern recognition for the detection of volatile compounds present in wine samples.
In the FOX equipment, there are three types of sensors currently used: P and T Sensors implemented in the Chambers A and B and LY Sensors used in the Chamber C. If the sensitive layer is placed on a tube of aluminum, the sensor’s name possesses the prefix T (example: T30/1, T70/2, etc.) and if the sensitive layer is placed on a plan substrate, the sensor’s name possesses the prefix P (example: P30/1, P10/1, P10/2). The LY sensors are metal oxide sensors based on chromium titanium oxide (Cr2-xTixO3+y) and on Tsungsten oxide (WO3). Wine samples were analyzed using all of the 18 sensors [36]. Each sensor is sensitive and reacts to certain compounds in wine.
Figure 6 illustrates the response of 18 sensors from a sample of Fetească albă: LY2/LG: LY2/GLY2/AA; LY2/Gh; LY2/gCTI: LY2/gCT: T30/1: P10/1: P10/2: P40/1: T70/2; PA2: P30/1: P40/2: P30/2; T40/2: 140/1: TA2 [37].
Following the acquisition of the sensor responses for each wine sample, a comprehensive data library was created for all analyzed samples. This data library comprises a table detailing the values obtained from each sensor, aggregating all results of sensors. Subsequently, statistical analysis, specifically Principal Component Analysis (PCA), was conducted utilizing the dataset from the data library.
To simplify the high dimensionality of the data set, and to understand the variability among the wine samples, all responses of sensors obtained for each analysis of wine using the e-Nose were submitted to a PCA to generate a visual representation of the discrimination between the wine samples (Figure 7).
In the PCA visualization of the electronic nose data, the observed sample lacks major fluctuations in analyzed volatile compounds.
We can conclude that the Fetească albă and Fetească regală samples analyzed present the same characteristics of volatile compounds, even though they were obtained in different winemaking regions and different years. These results could help the producers of these traditional Romanian wines in the process of obtaining them since, currently, the traditional wines are produced in accordance with oenologist experience and taste, because they have no reliable database and lists with the expected characteristics for each variety. Consequently, for one grape variety, several distinct wines are produced from one region to another and, sometimes, from one producer to another in the same region. Therefore, especially for traditional wines, a general list with the expected varietal characteristic in relation to the obtained wine is mandatory. This study aims to establish the main varietal characteristics and, in this way, to help the producers to identify and to highlight the main characteristics of Fetească white wines. Also, the results obtained from the sensors of the e-Nose can help establish the authenticity of these wines.
3.4. Statistical Analysis of Wine Samples Based on HS SPME/GC-MS Data
A characterization of unicity in the case of each studied Fetească variety was aimed by means of PCA. The representation of the two main principal components F1/F2 is shown in Figure 8. The analyzed wine samples tend to cluster in accordance with the wine variety (Fetească albă or Fetească regală), but the system variability is really high, considering the broad area from which the analyzed wine sample were collected and the different production year. The PCA result shows that we have a small explanation of the variation from the first three principal components; therefore, the variation from one sample to another it is significant. This result supports the claim for a clear list of characteristics specific for each Fetească variety. Despite this, several conclusions could be extracted; for example: Fetească albă variety tends to contain more esters in comparison to the Fetească regală variety. The Fetească regală variety contains more glycerin in comparison to Fetească albă variety.
In Figure 9, the PCA analysis was applied to samples from Fetească regală (FR) variety. In this case, the first four principal components explain 70% of the system variation, which has an important value when samples from all producing regions are included in the study. Of course, if we consider only the samples for each region of the country, the results in terms of variation explanation are improved, but the idea was to try to find the general characteristics of the wine variety across all production areas. In the case of individual variety characterization, the system variability explanation was improved. Therefore, it can be noticed in Figure 9 that Fetească regală samples tend to differentiate based on the production year, in accordance with the ester compositions (2019 and 2020) and in accordance with alcohol concentrations (2018).
In Figure 10, the results for the PCA analysis applied to the Fetească albă (FA) wines is illustrated. In this case, the system variance is explained better than in the case of Fetească regală wines, with this proving a more comparable processing approach of the producers in the case of this Fetească variety. In the case of Fetească albă wines, the clustering tendency is generated by the carboxylic acid composition (2019 and 2020), and the esters and alcohols composition for the other cultivars (2018 and 2017). Those results are in accordance with the observations made by the e-Nose.
The Hierarchical Clustering Analysis of the FA wine samples, presented in Figure 11, shows four separate clusters corresponding to different samples processing, and not in accordance with the different geographical regions. Therefore, the influence of the oenological techniques tends to differentiate the samples more than the wine growing area.
The same results are shown in Figure 12 by the FR samples, which clustered in five distinct clusters, which supports the results obtained by PCA.
4. Conclusions
A total of 39 samples of white wine from Romanian Fetească varieties were analyzed, and 23 volatile compounds were quantified using the HS-SPME/GC-MS and e-Nose techniques in order to reveal the authenticity attributes. In this regard, the volatile profile defined by the flavor compounds was depicted. The 23 chemical compounds detected were classified into four classes: esters, alcohols, aldehydes/ketones and organic/carboxylic acids. According to the odor threshold detailed in the literature, the compounds were further divided in five aroma series, in this way being easily to visualize the imprint of each category on Fetească albă and Fetească regală wine samples. The data collected via e-Nose software has scored the authenticity of these wines bearing almost the same characteristics of volatile compounds, despite the different winemaking regions and production years. Principal Component Analysis finally confirmed e-Nose outputs that, despite the great variability of samples (e.g., different growing regions, different production years), the samples tend to cluster according to wine variety and the processing techniques.
The results obtained in the present study are a useful tool when a specific handling techniques will be applied in the white Fetească grape variety processing to obtain wines with similar individualities, which could be easily identify by oenologist when the wine quality is established. In the meanwhile, those results are important for when the variety authentication of Fetească white wines is targeted.
Supplementary Materials
The following supporting information can be downloaded at: https://www.mdpi.com/article/10.3390/separations11050141/s1, Figure S1: Spectrum of volatile organic compounds detected via GC-MS analysis, matching with NIST library.
Author Contributions
Conceptualization M.-C.T. and F.-A.M.; T.-A.I. and F.-A.M. writing—original draft preparation; formal analysis, F.-A.M., D.-E.D. and G.D.C.-S.; writing—review and editing, M.-C.T., F.-A.M. and T.-A.I.; project administration, F.-A.M. All authors have read and agreed to the published version of the manuscript.
Funding
This research was funded by the Ministry of Research, Innovation and Digitalization, contract 22N/2019, grant number PN 19 02 04 02, “Experimental research regarding the analysis of some traditional Romanian wines by spectral methods and chromatography’s in order to establish the unique characteristics for uniqueness” and contract 17 PFE (2021–2024).
Data Availability Statement
The data presented in this study are available on request from the corresponding author.
Conflicts of Interest
The authors declare no conflicts of interest.
References
- Khakimov, B.; Bakhytkyzy, I.; Fauhl-Hassek, C.; Engelsen, S.B. Non-Volatile Molecular Composition and Discrimination of Single Grape White of Chardonnay, Riesling, Sauvignon Blanc and Silvaner Using Untargeted GC–MS Analysis. Food Chem. 2022, 369, 130878. [Google Scholar] [CrossRef] [PubMed]
- Petronilho, S.; Lopez, R.; Ferreira, V.; Coimbra, M.A. Supplementary Material Revealing the Usefulness of Aroma Networks to Explain Wine Aroma Properties: The Case Study of Portuguese Wines by Chemical Families, Odor Threshold, Content, and Odor Active Value (OAV). Molecules 2020, 25, 272. [Google Scholar] [CrossRef] [PubMed]
- Han, S.; Yang, J.; Choi, K.; Kim, J.; Adhikari, K.; Lee, J. Chemical Analysis of Commercial White Wines and Its Relationship with Consumer Acceptability. Foods 2022, 11, 603. [Google Scholar] [CrossRef] [PubMed]
- Luzzini, G.; Slaghenaufi, D.; Ugliano, M. Volatile Compounds in Monovarietal Wines of Two Amarone Della Valpolicella Terroirs: Chemical and Sensory Impact of Grape Variety and Origin, Yeast Strain and Spontaneous Fermentation. Foods 2021, 10, 2474. [Google Scholar] [CrossRef] [PubMed]
- Jiang, K.; Xu, K.; Wang, J.; Meng, F.; Wang, B. Based on HS-SPME-GC-MS Combined with GC-O-MS to Analyze the Changes of Aroma Compounds in the Aging Process of Citri Reticulatae Pericarpium. Food Biosci. 2023, 54, 102798. [Google Scholar] [CrossRef]
- Gu, W.; Wei, Y.; Fu, X.; Gu, R.; Chen, J.; Jian, J.; Huang, L.; Yuan, C.; Guan, W.; Hao, X. HS-SPME/GC×GC-TOFMS-Based Flavoromics and Antimicrobial Properties of the Aroma Components of Zanthoxylum Motuoense. Foods 2023, 12, 2225. [Google Scholar] [CrossRef]
- Rossi, L.; Foschi, M.; Biancolillo, A.; Maggi, M.A.; D’Archivio, A.A. Optimization of HS-SPME-GC/MS Analysis of Wine Volatiles Supported by Chemometrics for the Aroma Profiling of Trebbiano d’Abruzzo and Pecorino White Wines Produced in Abruzzo (Italy). Molecules 2023, 28, 1534. [Google Scholar] [CrossRef] [PubMed]
- Piergiovanni, M.; Carlin, S.; Lotti, C.; Vrhovsek, U.; Mattivi, F. Development of a Fully Automated Method HS-SPME-GC-MS/MS for the Determination of Odor-Active Carbonyls in Wines: A “Green” Approach to Improve Robustness and Productivity in the Oenological Analytical Chemistry. J. Agric. Food Chem. 2024, 72, 1995–2007. [Google Scholar] [CrossRef]
- Karabagias, I.K.; Karabagias, V.K.; Badeka, A.V. Volatilome of White Wines as an Indicator of Authenticity and Adulteration Control Using Statistical Analysis. Aust. J. Grape Wine Res. 2021, 27, 269–279. [Google Scholar] [CrossRef]
- Zhang, L.; Liu, Q.; Li, Y.; Liu, S.; Tu, Q.; Yuan, C. Characterization of Wine Volatile Compounds from Different Regions and Varieties by HS-SPME/GC-MS Coupled with Chemometrics. Curr. Res. Food Sci. 2023, 6, 100418. [Google Scholar] [CrossRef]
- Del Barrio-Galán, R.; Valle-Herrero, H.d.; Bueno-Herrera, M.; López-de-la-Cuesta, P.; Pérez-Magariño, S. Volatile and Non-Volatile Characterization of White and Rosé Wines from Different Spanish Protected Designations of Origin. Beverages 2021, 7, 49. [Google Scholar] [CrossRef]
- Fuentes, S.; Viejo, C.G. Novel Use of E-Noses for Digital Agriculture, Food, and Beverage Applications. In Nanotechnology-Based E-Noses: Fundamentals and Emerging Applications; Gupta, R.K., Nguyen, T.A., Bilal, M., Ahmadi, M., Eds.; Woodhead Publishing: Shaston, UK, 2023; pp. 415–432. [Google Scholar]
- Celdrán, A.C.; Oates, M.J.; Molina Cabrera, C.; Pangua, C.; Tardaguila, J.; Ruiz-Canales, A. Low-Cost Electronic Nose for Wine Variety Identification through Machine Learning Algorithms. Agronomy 2022, 12, 2627. [Google Scholar] [CrossRef]
- Erwanto, D.; Wahyudi, D.; Fatkhur Rizal, R. Sistem Electronic Nose Untuk Deteksi Aroma Pada Fasilitas Kamar Mandi Berbasis IoT. J. Zetroem 2023, 5, 43–50. [Google Scholar] [CrossRef]
- Meléndez, F.; Arroyo, P.; Gómez-Suárez, J.; Palomeque-Mangut, S.; Suárez, J.I.; Lozano, J. Portable Electronic Nose Based on Digital and Analog Chemical Sensors for 2,4,6-Trichloroanisole Discrimination. Sensors 2022, 22, 3453. [Google Scholar] [CrossRef]
- Pati, S.; Tufariello, M.; Crupi, P.; Coletta, A.; Grieco, F.; Losito, I. Quantification of Volatile Compounds in Wines by HS-SPME-GC/MS: Critical Issues and Use of Multivariate Statistics in Method Optimization. Processes 2021, 9, 662. [Google Scholar] [CrossRef]
- Jin, X.; Wu, S.; Yu, W.J.; Xu, X.; Huang, M.; Tang, Y.; Yang, Z. Wine Authentication Using Integration Assay of MIR, NIR, E-Tongue, HS-SPME-GC-MS, and Multivariate Analyses: A Case Study for a Typical Cabernet Sauvignon Wine. J. AOAC Int. 2019, 102, 1174–1180. [Google Scholar] [CrossRef]
- Harta A3 Podgorii Spate Romana 2023. Available online: https://www.crameromania.ro/upload/HartaA3podgoriispate%20romana%202023.png (accessed on 26 January 2024).
- Torrens, J.; Riu-Aumatell, M.; López-Tamames, E.; Buxaderas, S. Volatile Compounds of Red and White Wines by Headspace-Solid-Phase Microextraction Using Different Fibers. J. Chromatogr. Sci. 2004, 42, 310–316. [Google Scholar] [CrossRef]
- Dumitriu, G.D.; Sánchez-Suárez, F.; Peinado, R.A.; Cotea, V.V.; de Lerma, N.L.; Gabur, I.; Simioniuc, V. Metabolomics of Red Wines Aged Traditionally, with Chips or Staves. Foods 2024, 13, 196. [Google Scholar] [CrossRef]
- Urcan, D.E.; Lung, M.L.; Giacosa, S.; Torchio, F.; Ferrandino, A.; Vincenzi, S.; Rió Segade, S.; Pop, N.; Rolle, L. Phenolic Substances, Flavor Compounds, and Textural Properties of Three Native Romanian Wine Grape Varieties. Int. J. Food Prop. 2016, 19, 76–98. [Google Scholar] [CrossRef]
- Colibaba, C.; Cotea, V.; Liliana, R.; Marius, N.; Vararu, F.; Luchian, C. Studies of the Influence of Some Conditioning Treatments on Some Volatile Compounds in Fetească Albă Wines. Sci. Pap. Ser. Hortic. 2014, 55, 181–186. [Google Scholar]
- Cojocaru, G.A.; Antoce, A.O. Influence of Glutathione and Ascorbic Acid Treatments during Vinification of Feteasca Regala Variety and Their Antioxidant Effect on Volatile Profile. Biosensors 2019, 9, 140. [Google Scholar] [CrossRef] [PubMed]
- Liu, S.; Lou, Y.; Li, Y.; Zhao, Y.; Laaksonen, O.; Li, P.; Zhang, J.; Battino, M.; Yang, B.; Gu, Q. Aroma Characteristics of Volatile Compounds Brought by Variations in Microbes in Winemaking. Food Chem. 2023, 420, 136075. [Google Scholar] [CrossRef] [PubMed]
- Petretto, G.; Urgeghe, P.P.; Cabizza, R.; Del Caro, A. Evaluation of Volatile and Chemical Profile of Sherry-like White Wine Vernaccia Di Oristano from Sardinia by Comprehensive Targeted and Untargeted Approach. Eur. Food Res. Technol. 2023, 249, 1887–1897. [Google Scholar] [CrossRef]
- Cordente, A.G.; Nandorfy, D.E.; Solomon, M.; Schulkin, A.; Kolouchova, R.; Francis, I.L.; Schmidt, S.A. Aromatic Higher Alcohols in Wine: Implication on Aroma and Palate Attributes during Chardonnay Aging. Molecules 2021, 26, 4979. [Google Scholar] [CrossRef] [PubMed]
- Tao, Y.-S.; Li, H. Active Volatiles of Cabernet Sauvignon Wine from Changli County. Health 2009, 1, 176–182. [Google Scholar] [CrossRef]
- Avram, V.; Floare, C.G.; Hosu, A.; Cimpoiu, C.; Măruţoiu, C.; Moldovan, Z. Characterization of Romanian Wines by Gas Chromatography–Mass Spectrometry. Anal. Lett. 2015, 48, 1099–1116. [Google Scholar] [CrossRef]
- The Role of Acetic Acid in Wine. Available online: https://www.calwineries.com/learn/wine-chemistry/wine-acids/acetic-acid (accessed on 1 February 2024).
- Flavor Ingredient Library. Available online: https://www.femaflavor.org/flavor-library (accessed on 15 January 2024).
- Chemical Book. Available online: https://www.chemicalbook.com/ (accessed on 15 January 2024).
- Cao, W.; Shu, N.; Wen, J.; Yang, Y.; Jin, Y.; Lu, W. Characterization of the Key Aroma Volatile Compounds in Nine Different Grape Varieties Wine by Headspace Gas Chromatography–Ion Mobility Spectrometry (HS-GC-IMS), Odor Activity Values (OAV) and Sensory Analysis. Foods 2022, 11, 2767. [Google Scholar] [CrossRef] [PubMed]
- Jiang, B.; Zhang, Z. Volatile Compounds of Young Wines from Cabernet Sauvignon, Cabernet Gernischet and Chardonnay Varieties Grown in the Loess Plateau Region of China. Molecules 2010, 15, 9184–9196. [Google Scholar] [CrossRef] [PubMed]
- Amyl Acetate. Available online: https://pubchem.ncbi.nlm.nih.gov/#query=amyl%20acetate (accessed on 15 January 2024).
- Hao, N.; Liu, J.; Wang, F.; Cao, J.; Chen, Q.; He, L.; Guan, X.; Liu, S.; Shi, K. Malolactic Fermentation Performance of Indigenous Oenococcus Oeni Strains from Shaanxi Wine Region (China) and Their Mutants on Pinot Noir and Chardonnay Wines. Lwt 2023, 185, 115170. [Google Scholar] [CrossRef]
- Plawiak, P.; Maziarz, W. Comparison of Artificial Intelligence Methods on the Example of Tea Classification Based on Signals from E-Nose Sensors. Adv. Signal Process. 2013, 1, 19–32. [Google Scholar] [CrossRef]
- Pławiak, P.; Rzecki, K. Approximation of Phenol Concentration Using Computational Intelligence Methods Based on Signals from the Metal-Oxide Sensor Array. IEEE Sens. J. 2015, 15, 1770–1783. [Google Scholar] [CrossRef]
Figure 1.
Samples collected in the study highlighting wine regions (picture modified from [18]). Reproduced with permission of Revino Romania SRL; available online: https://www.crameromania.ro/ (accessed on 26 January 2024).
Figure 1.
Samples collected in the study highlighting wine regions (picture modified from [18]). Reproduced with permission of Revino Romania SRL; available online: https://www.crameromania.ro/ (accessed on 26 January 2024).

Figure 2.
Representation of a GC-MS chromatogram from Fetească Albă sample, SAH_DM.
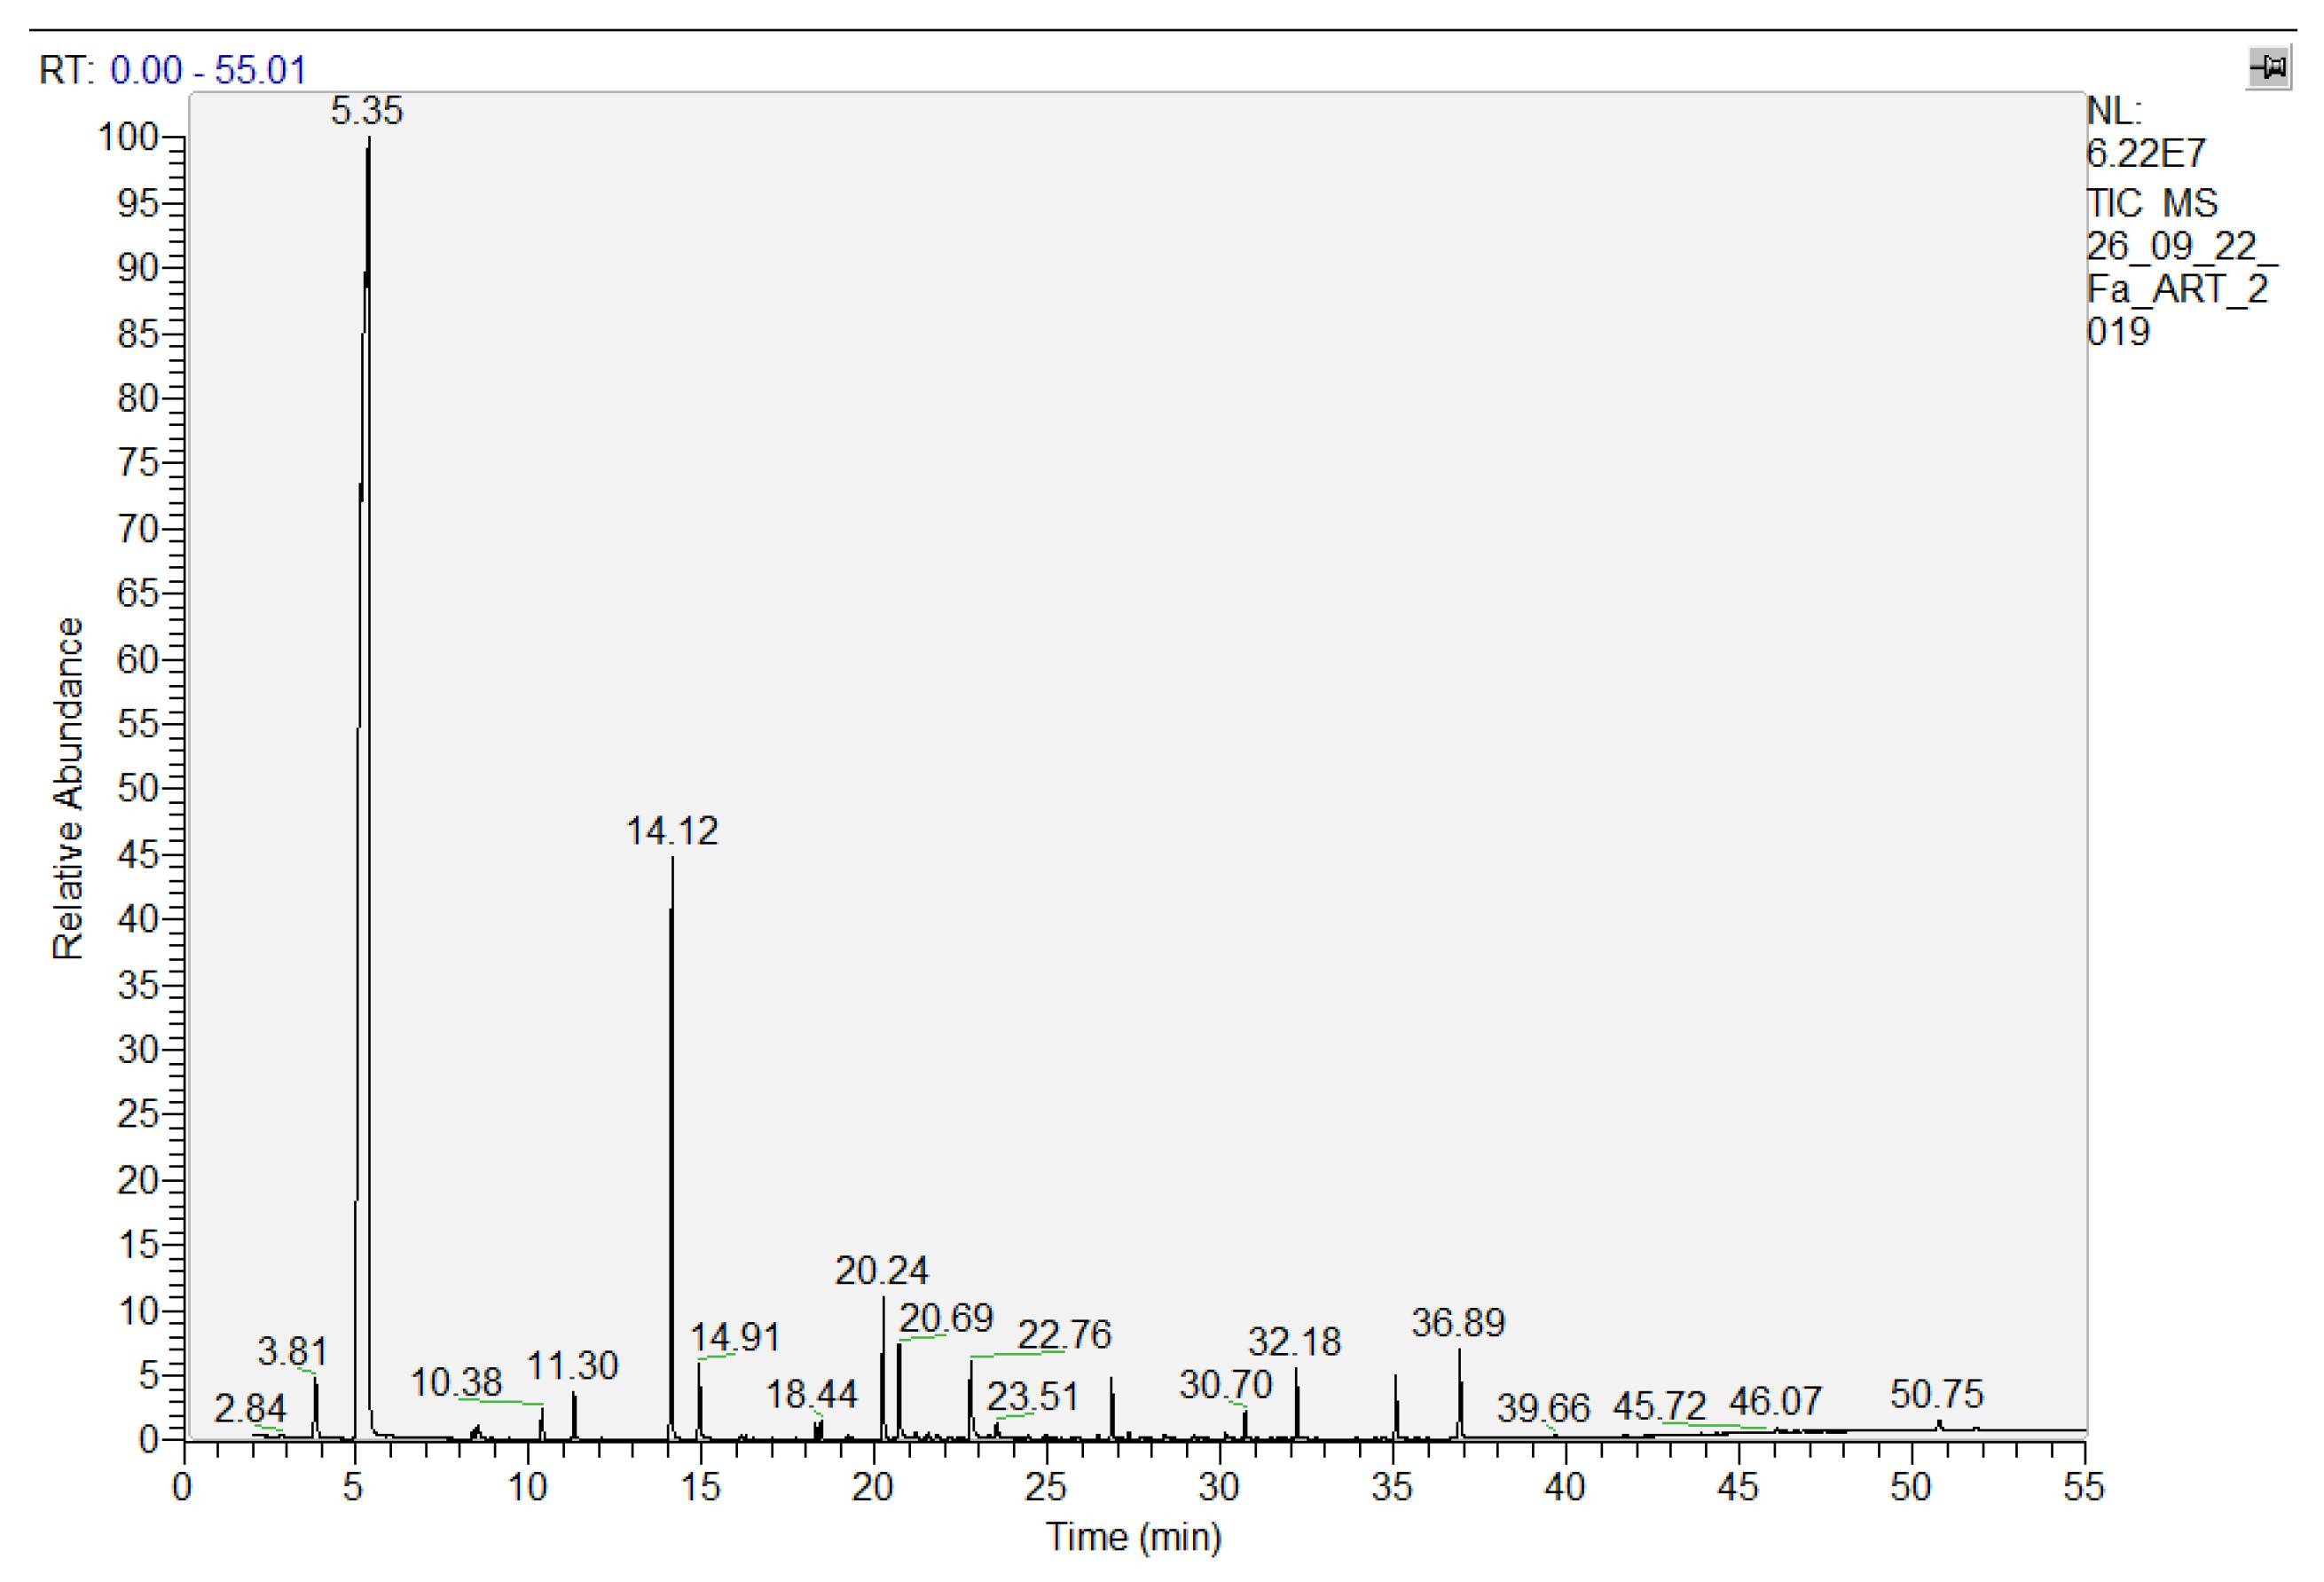
Figure 3.
Heatmap representation of Fetească albă and regală wine samples.
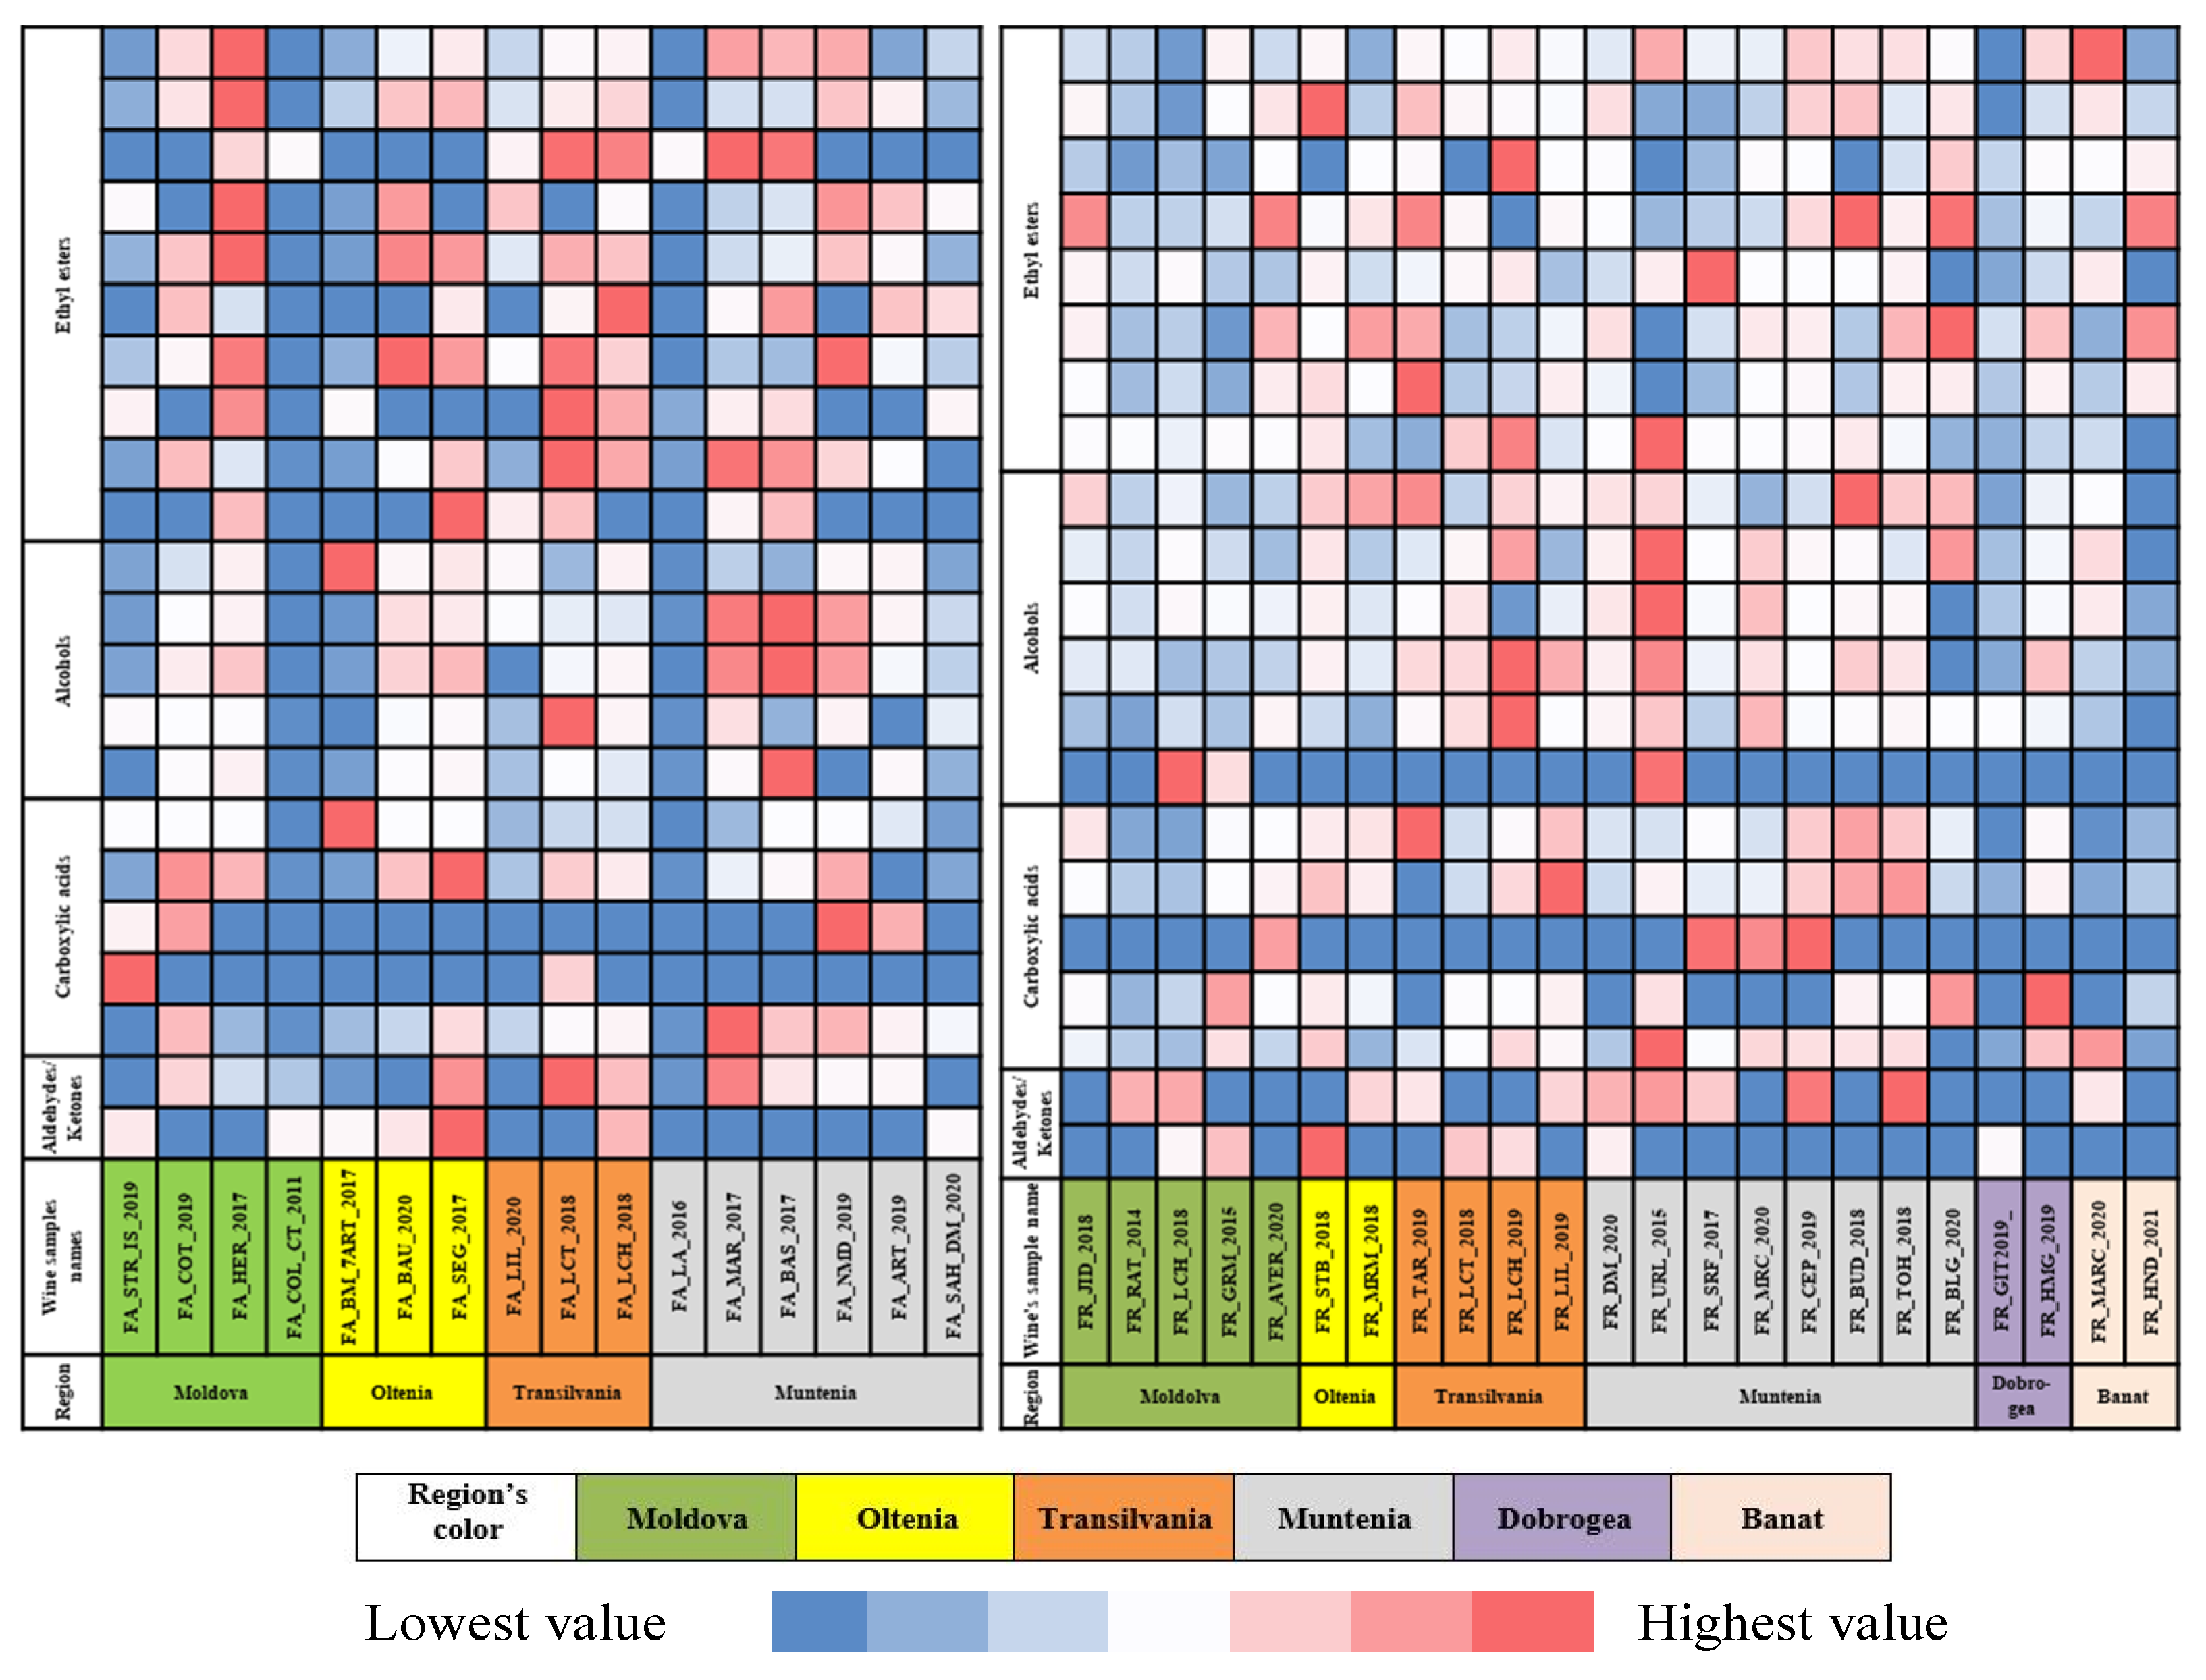
Figure 4.
The correlation between aroma descriptors and corresponding volatile compounds identified in the white wine samples.
Figure 4.
The correlation between aroma descriptors and corresponding volatile compounds identified in the white wine samples.
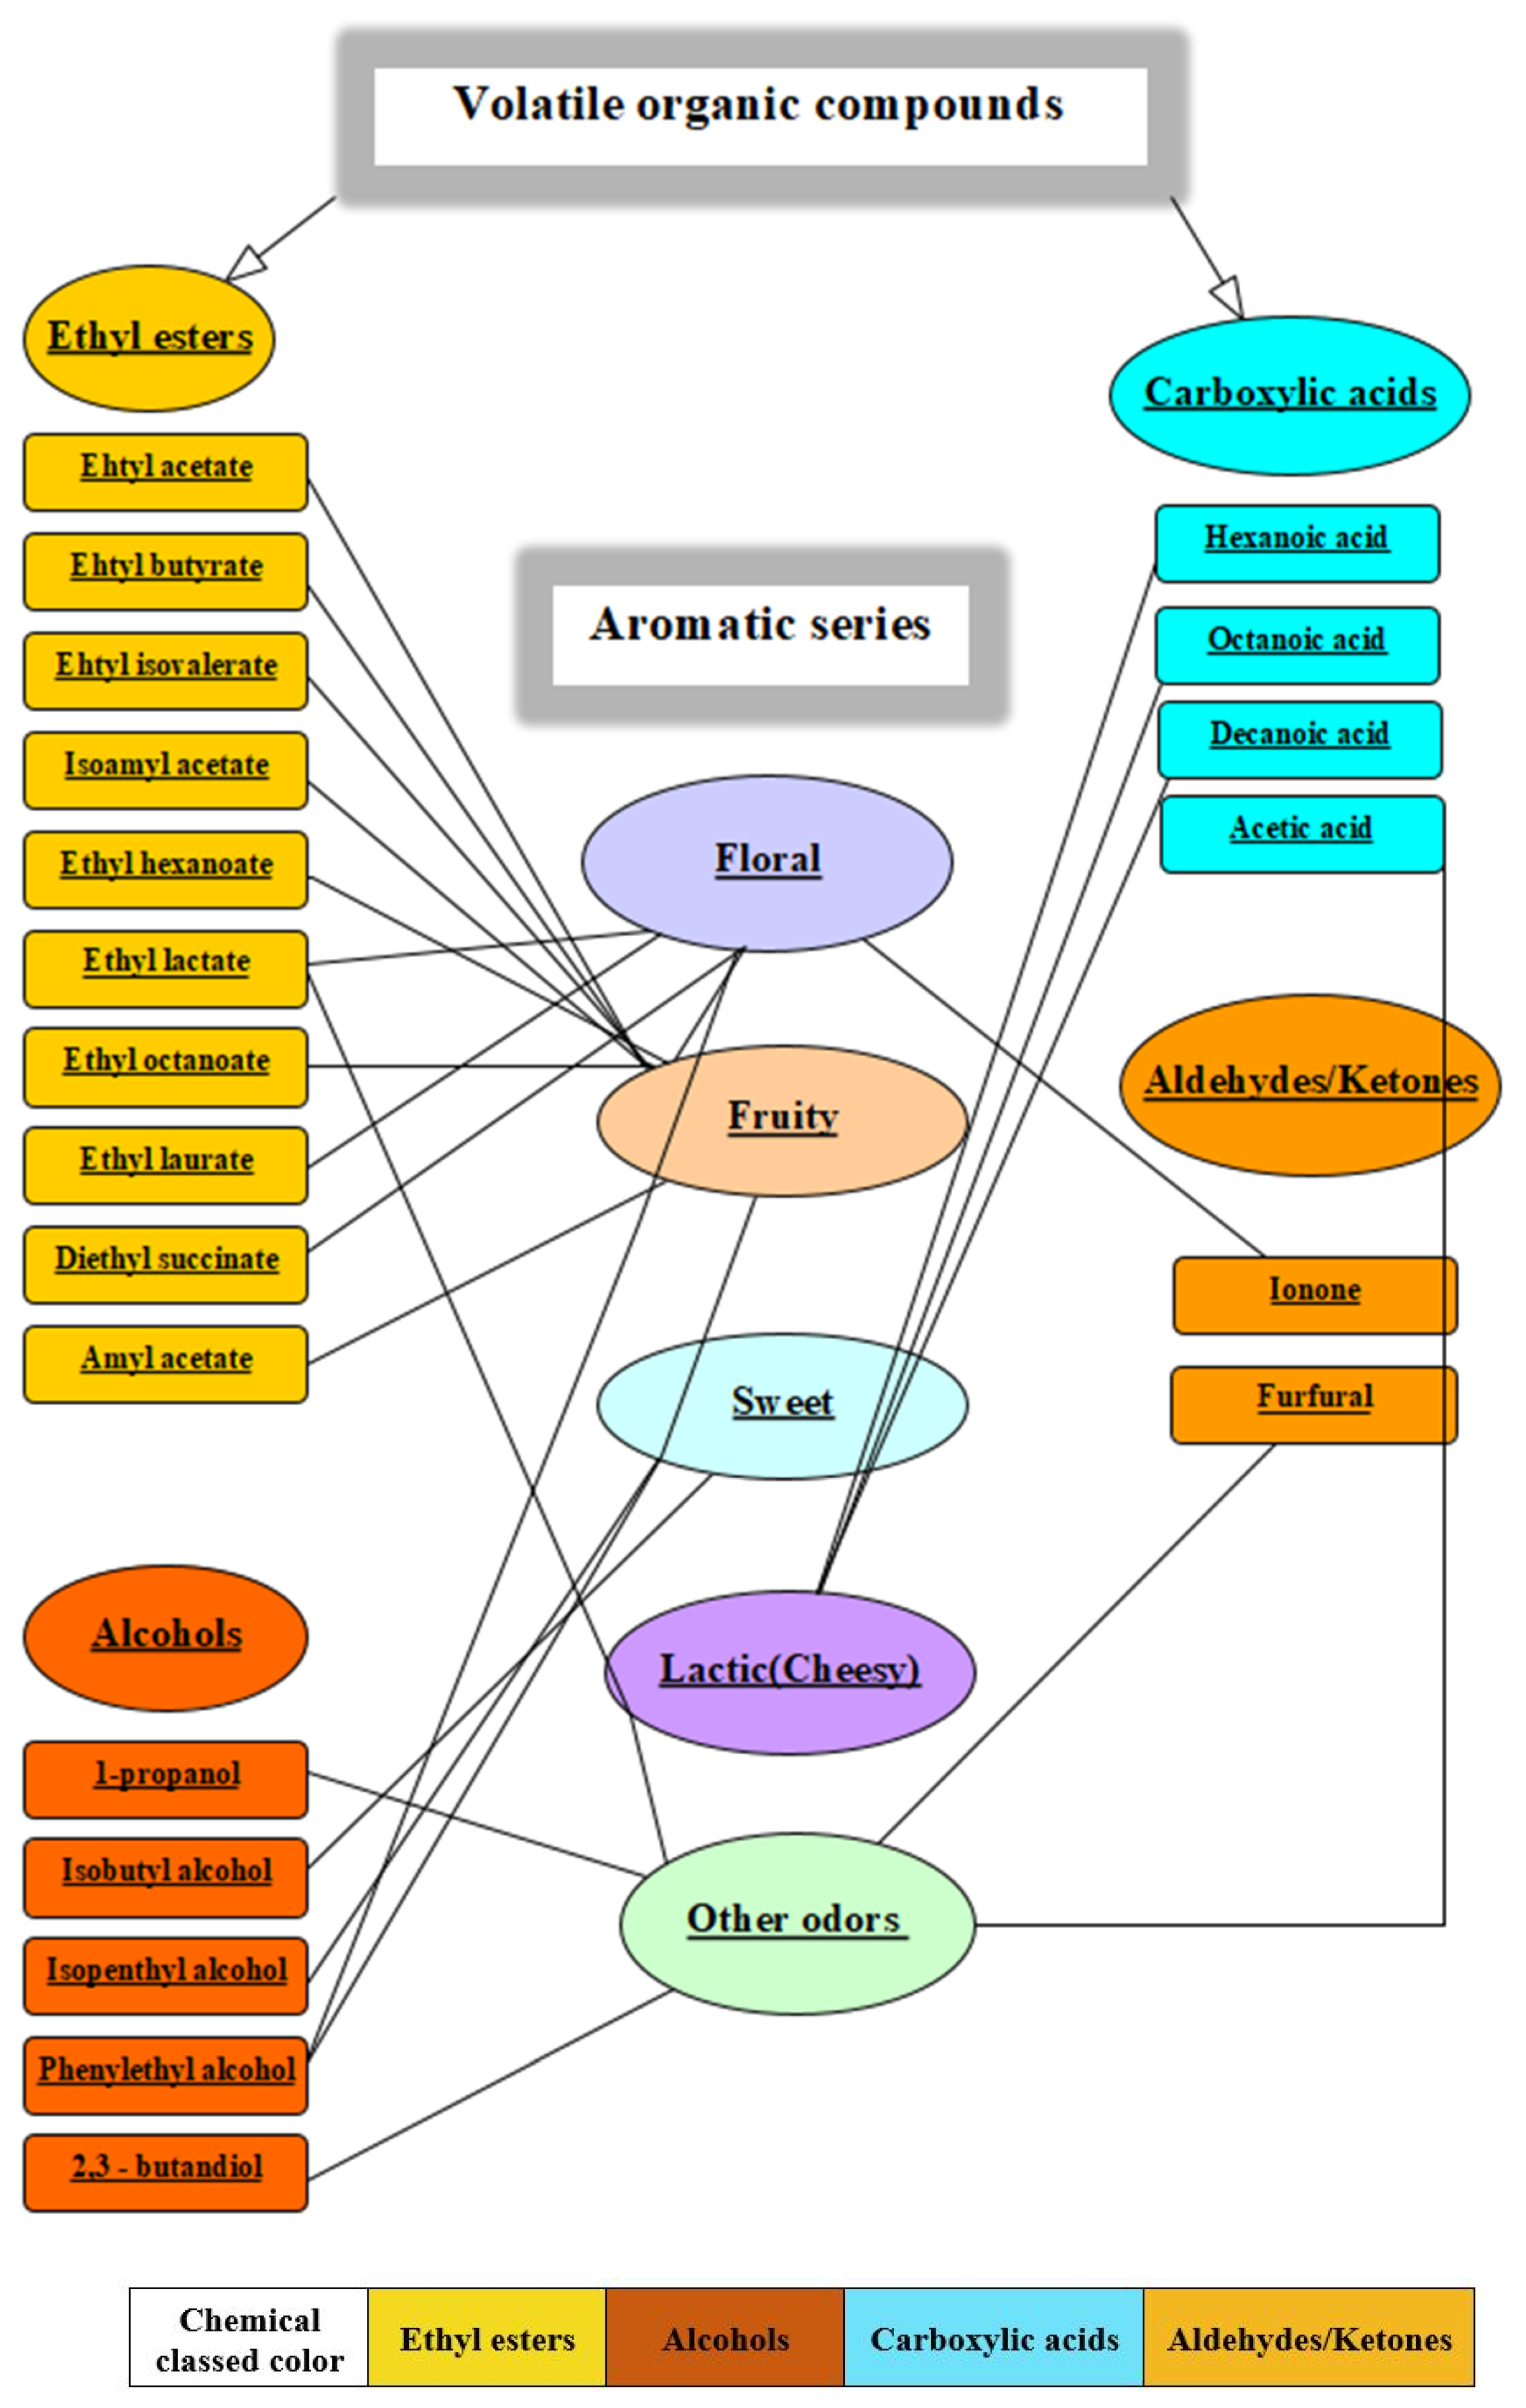
Figure 5.
The influence of aroma series on the volatile profile of FA wines (left) and FR wines (right).
Figure 5.
The influence of aroma series on the volatile profile of FA wines (left) and FR wines (right).

Figure 6.
Raw sensor signals of Fetească albă wine samples.
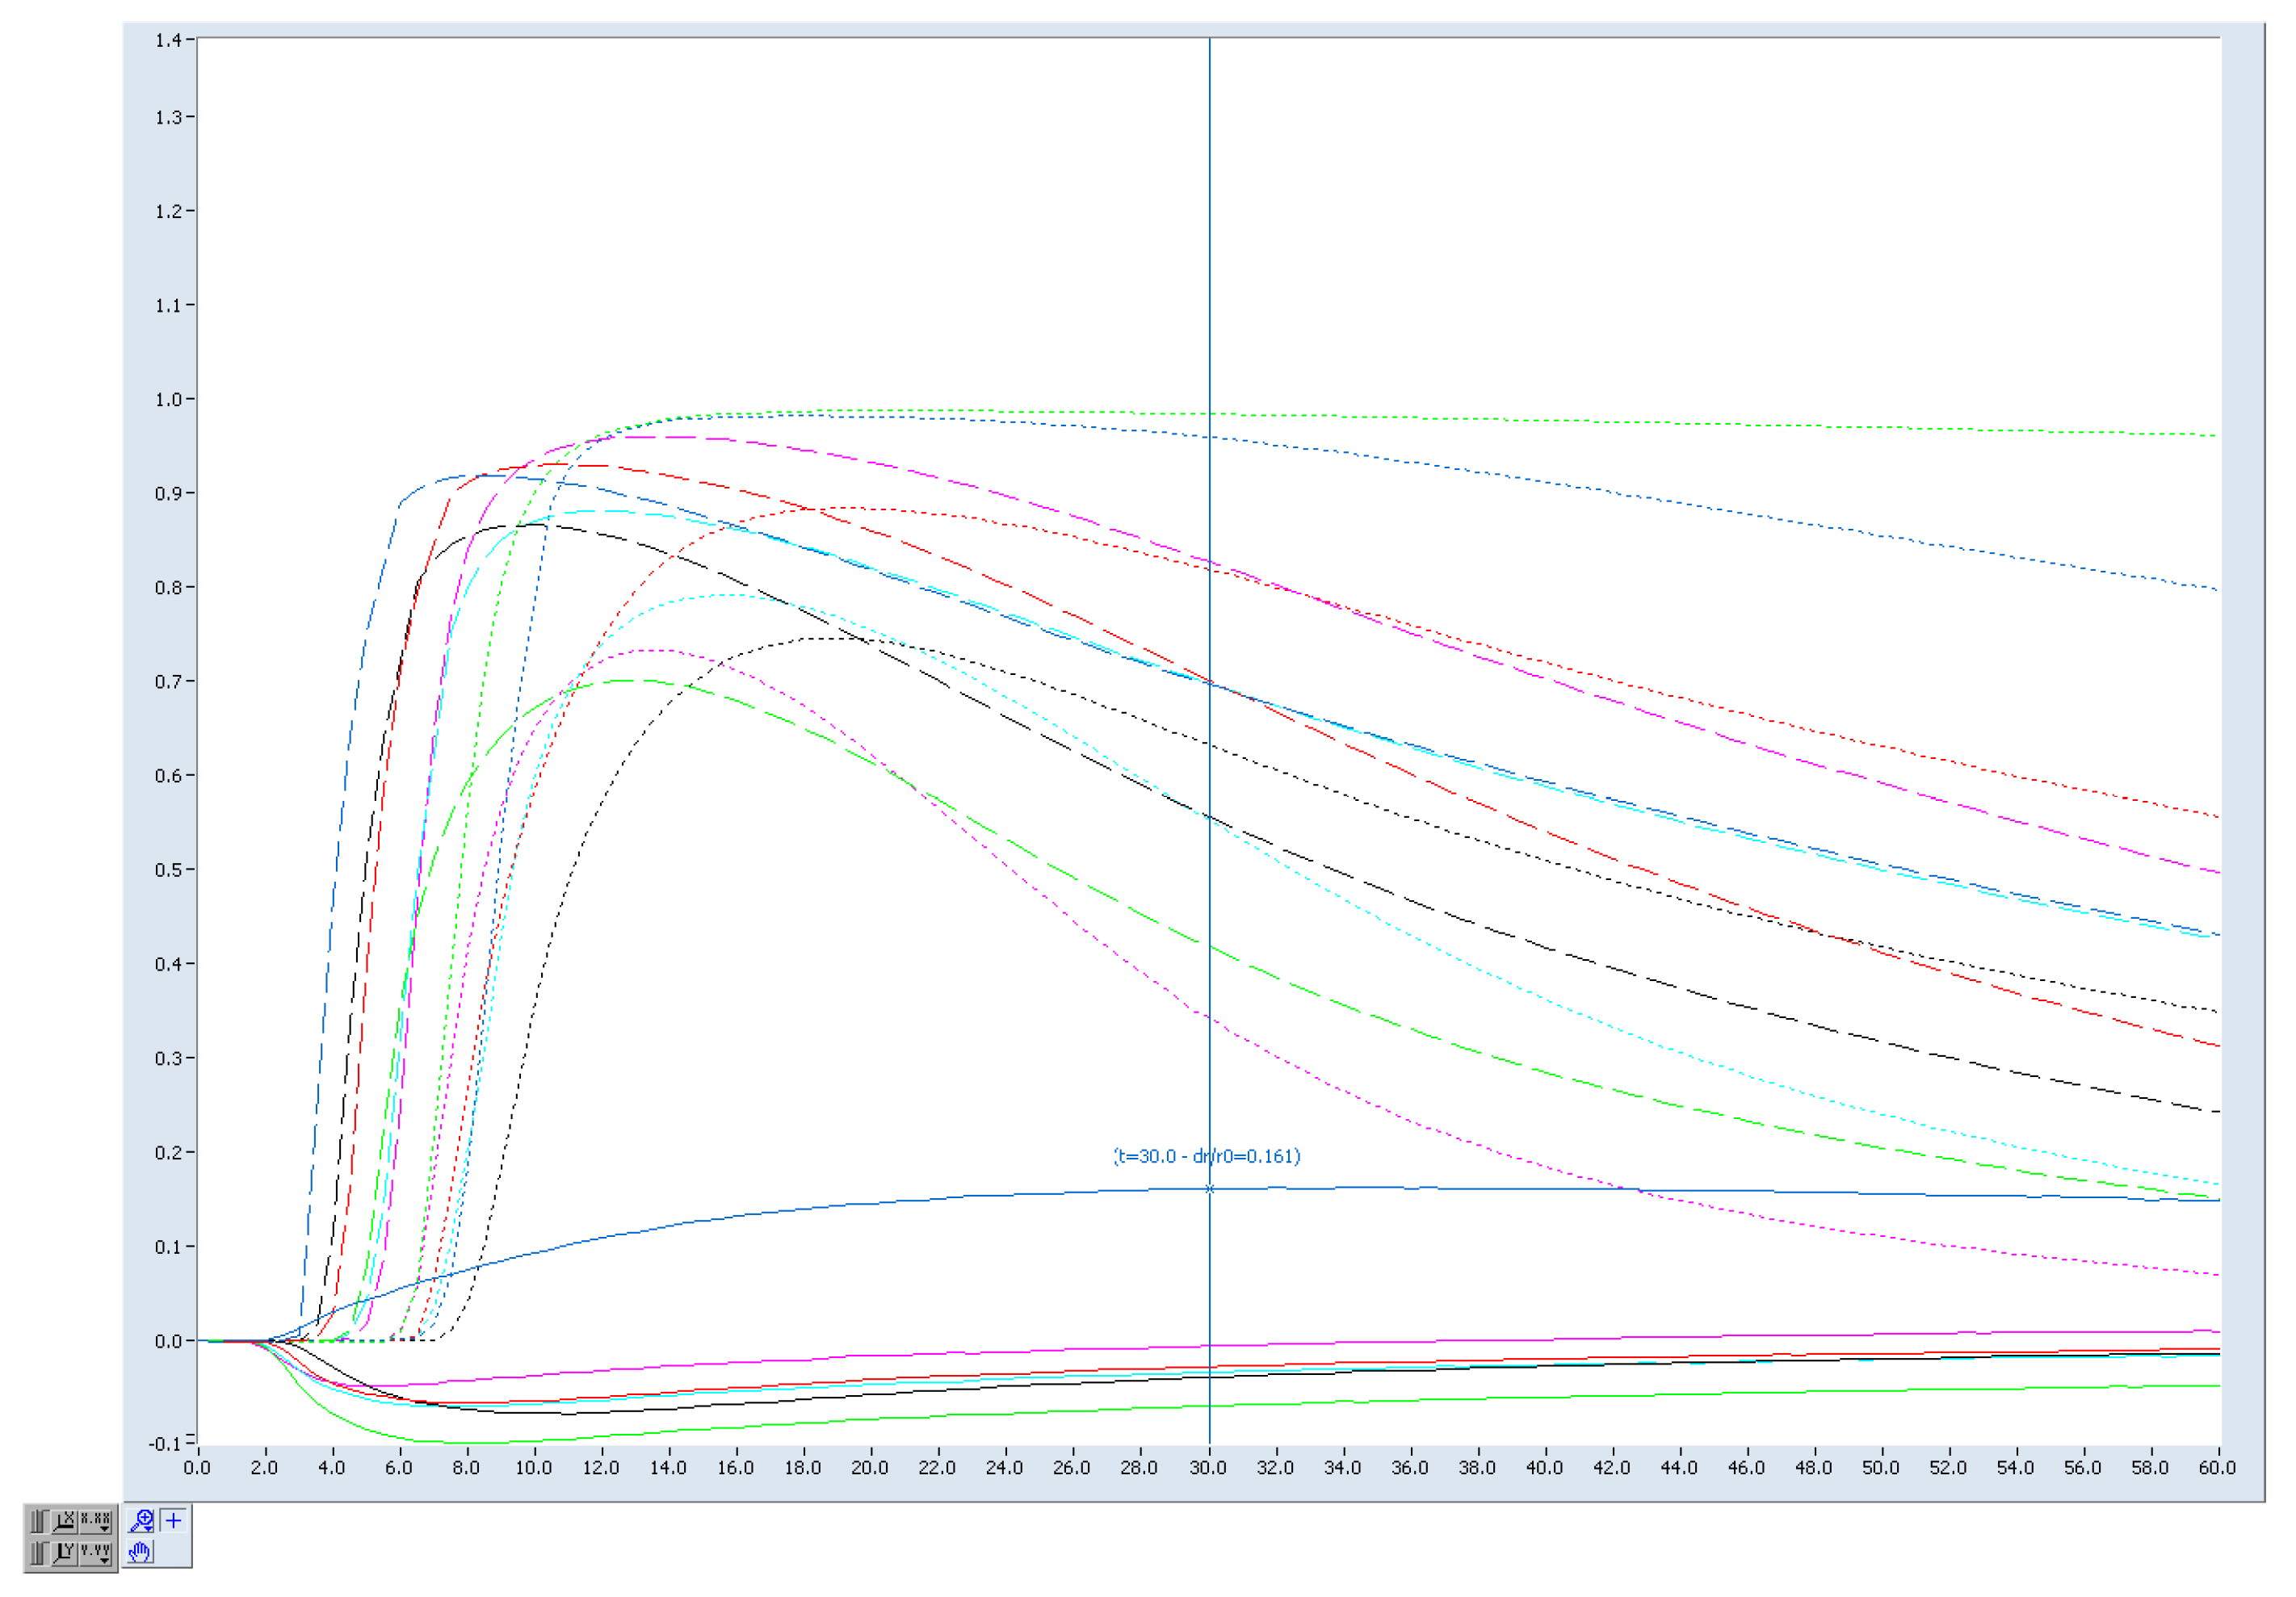
Figure 7.
PCA analysis of result obtained with e-Nose of analyzed samples.
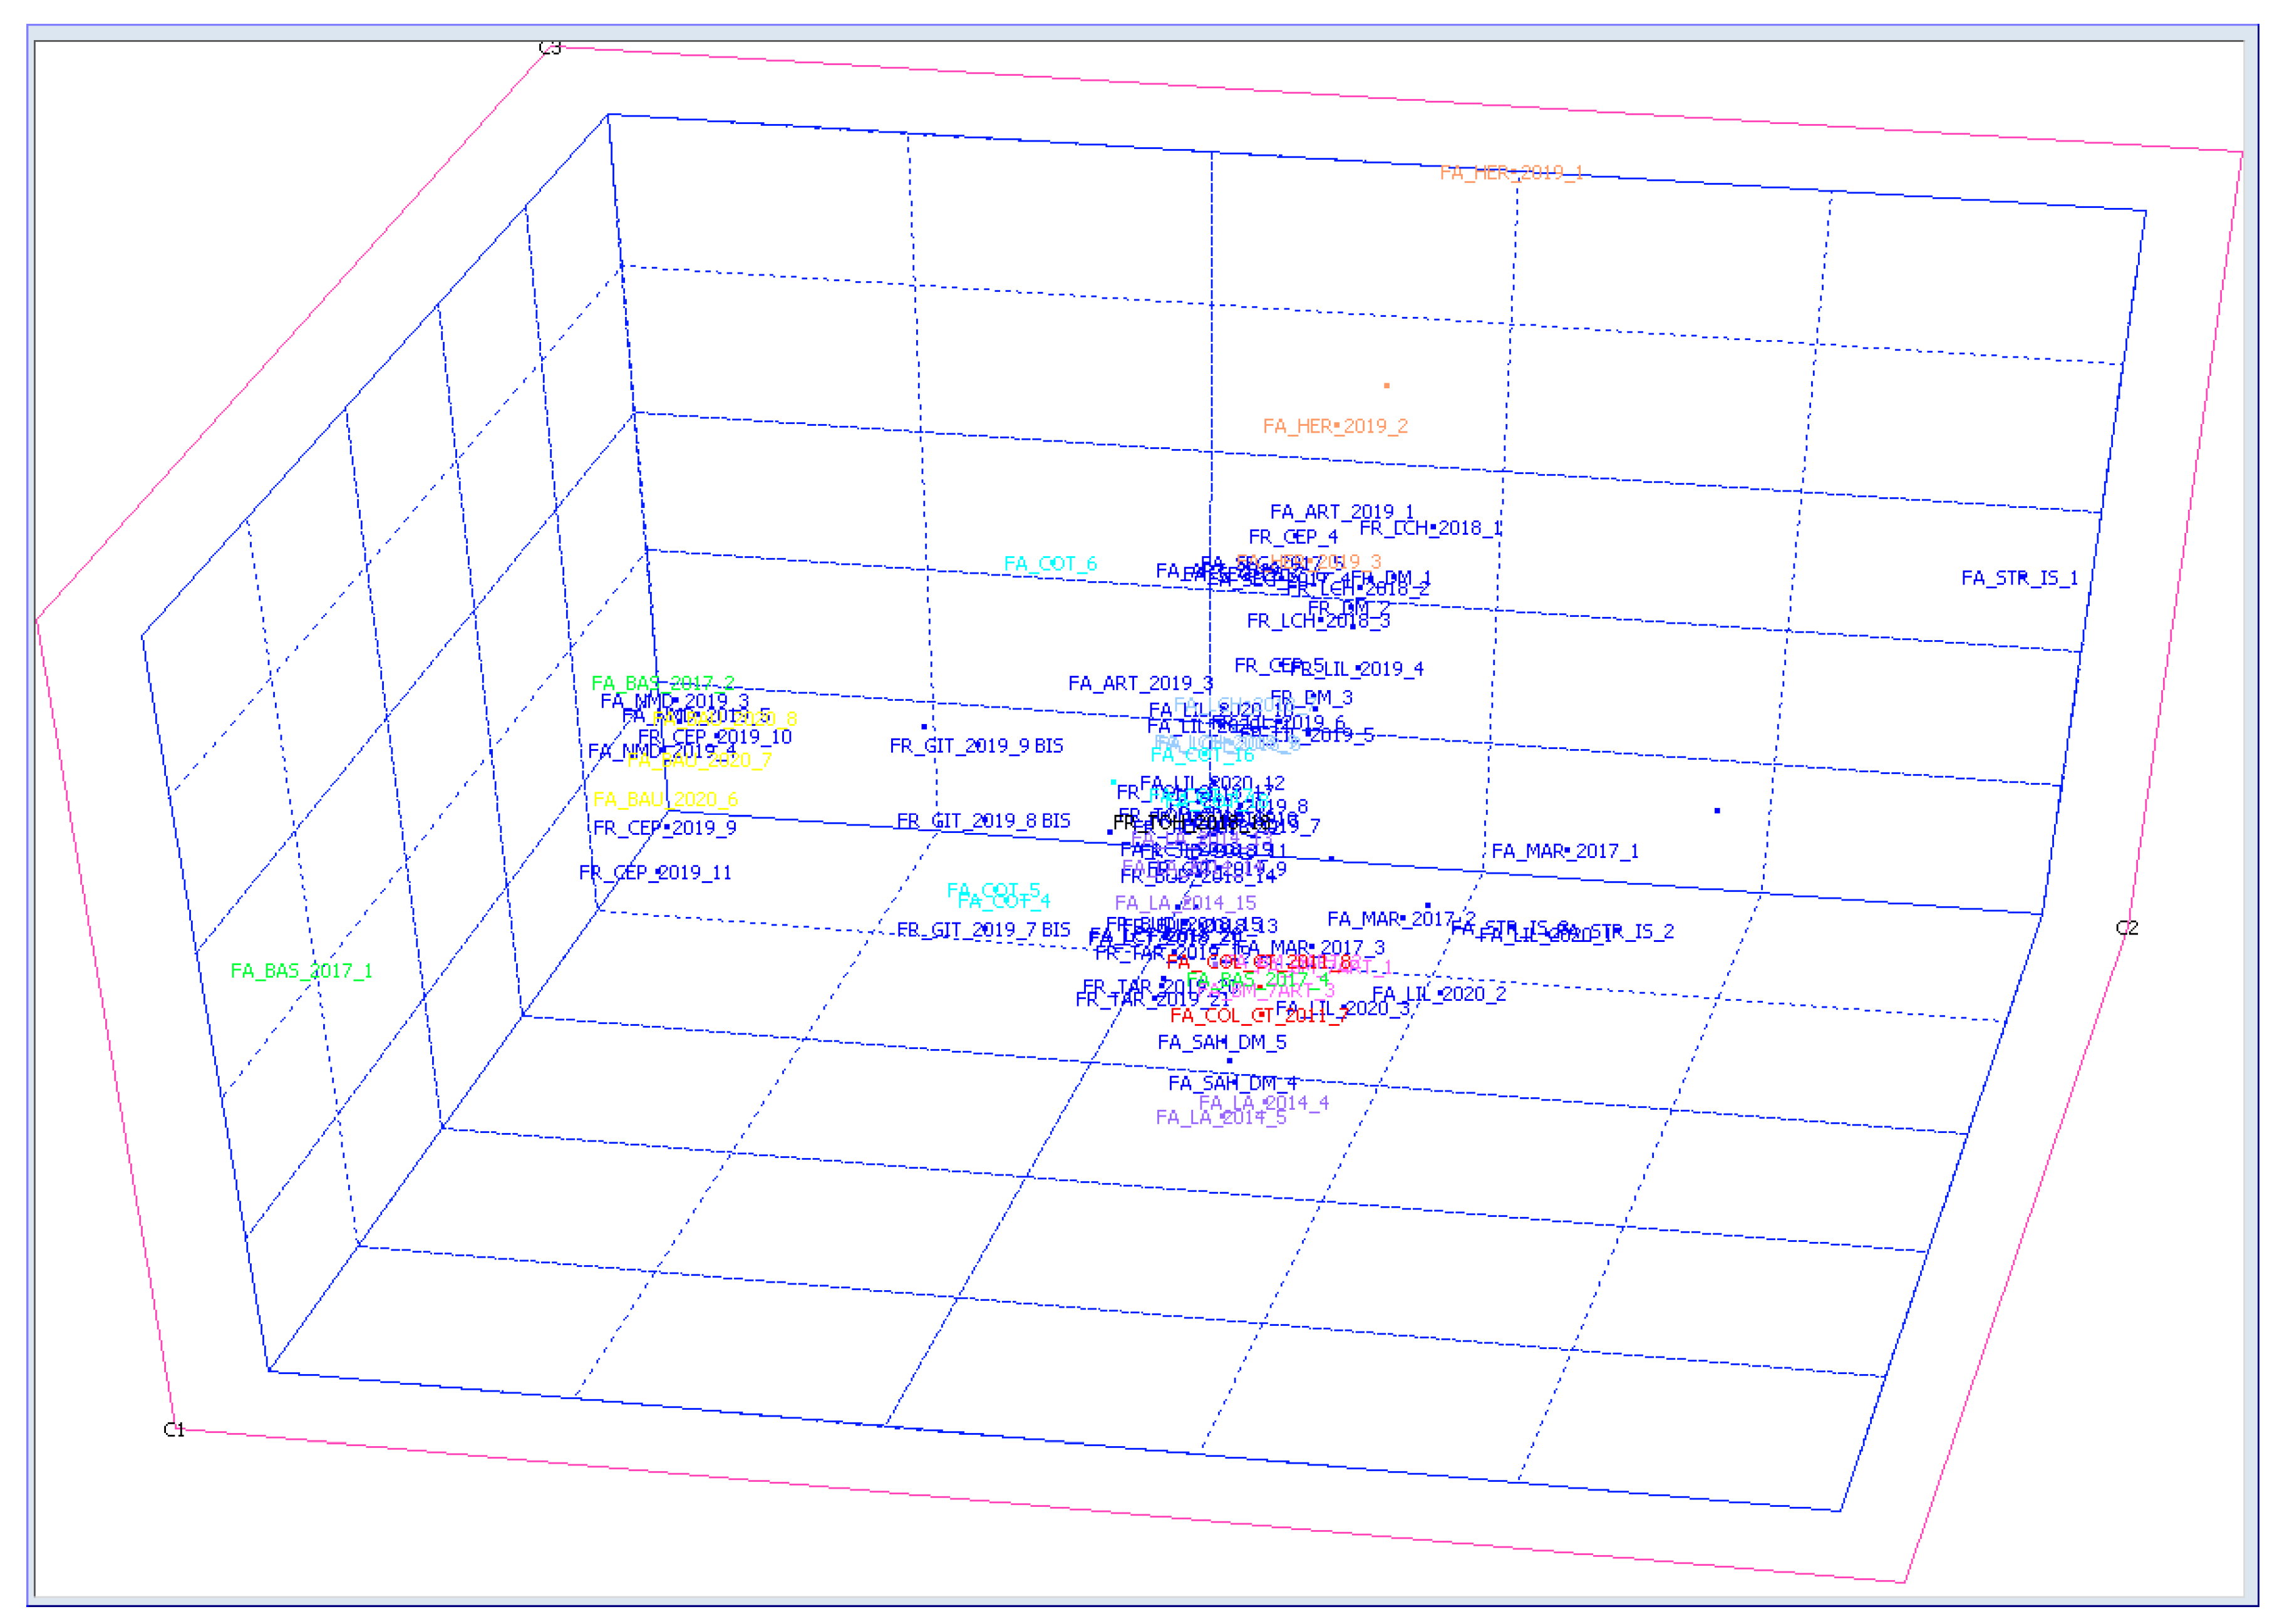
Figure 8.
Biplot representation for F1/F2 resulted after PCA analysis of FR and FA samples.
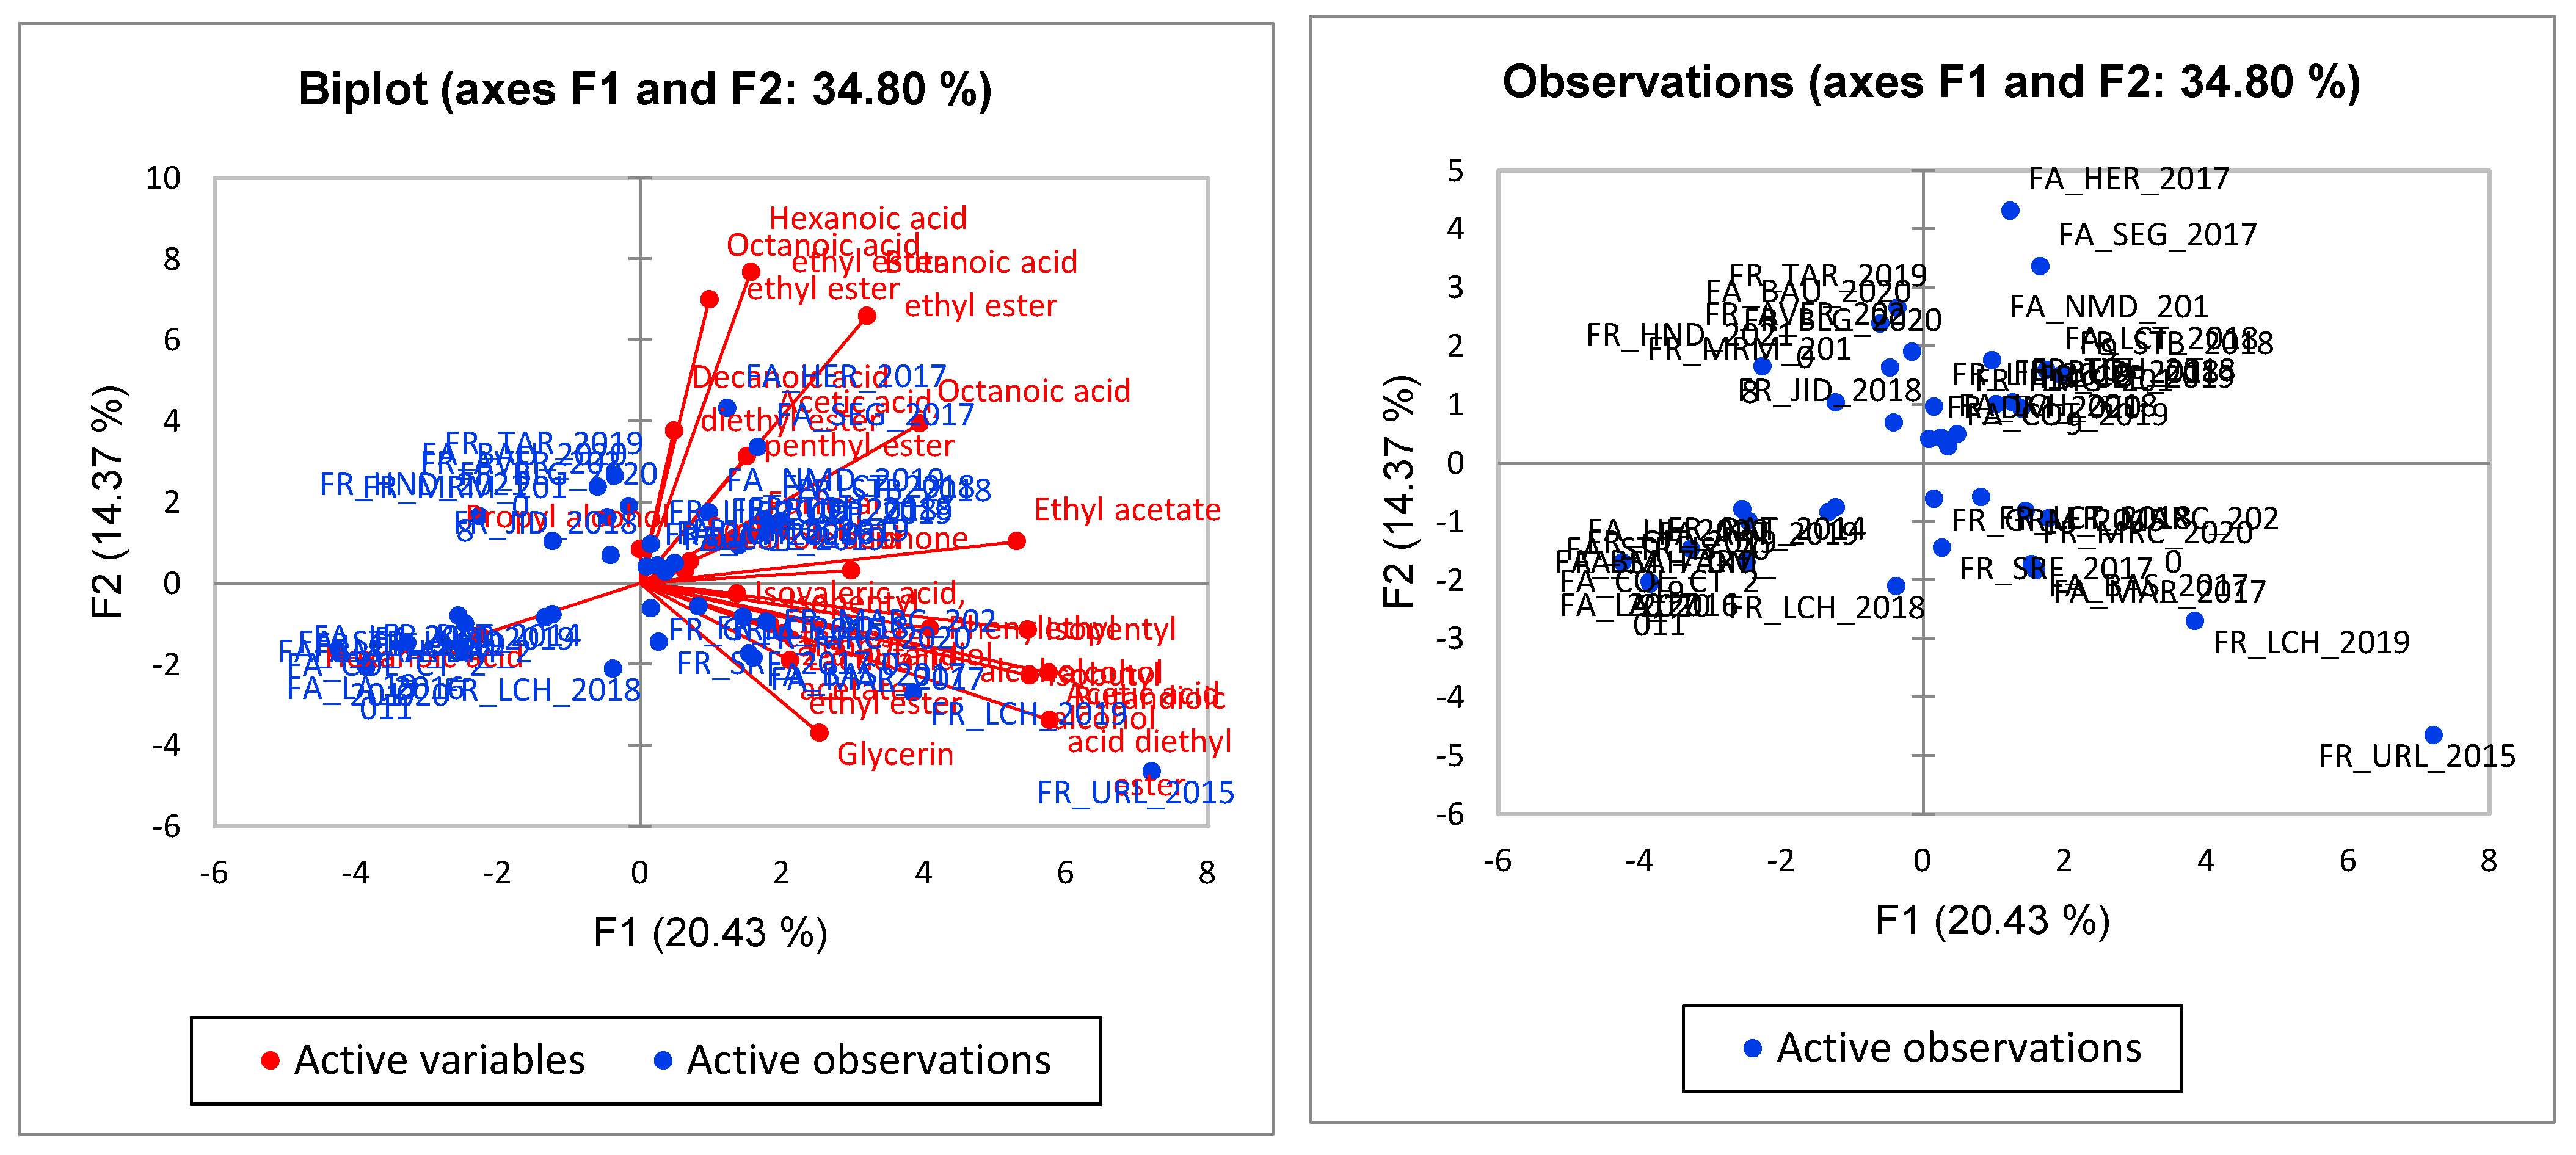
Figure 9.
Biplot representation for F1/F2 resulted after PCA analysis of FR wine samples.
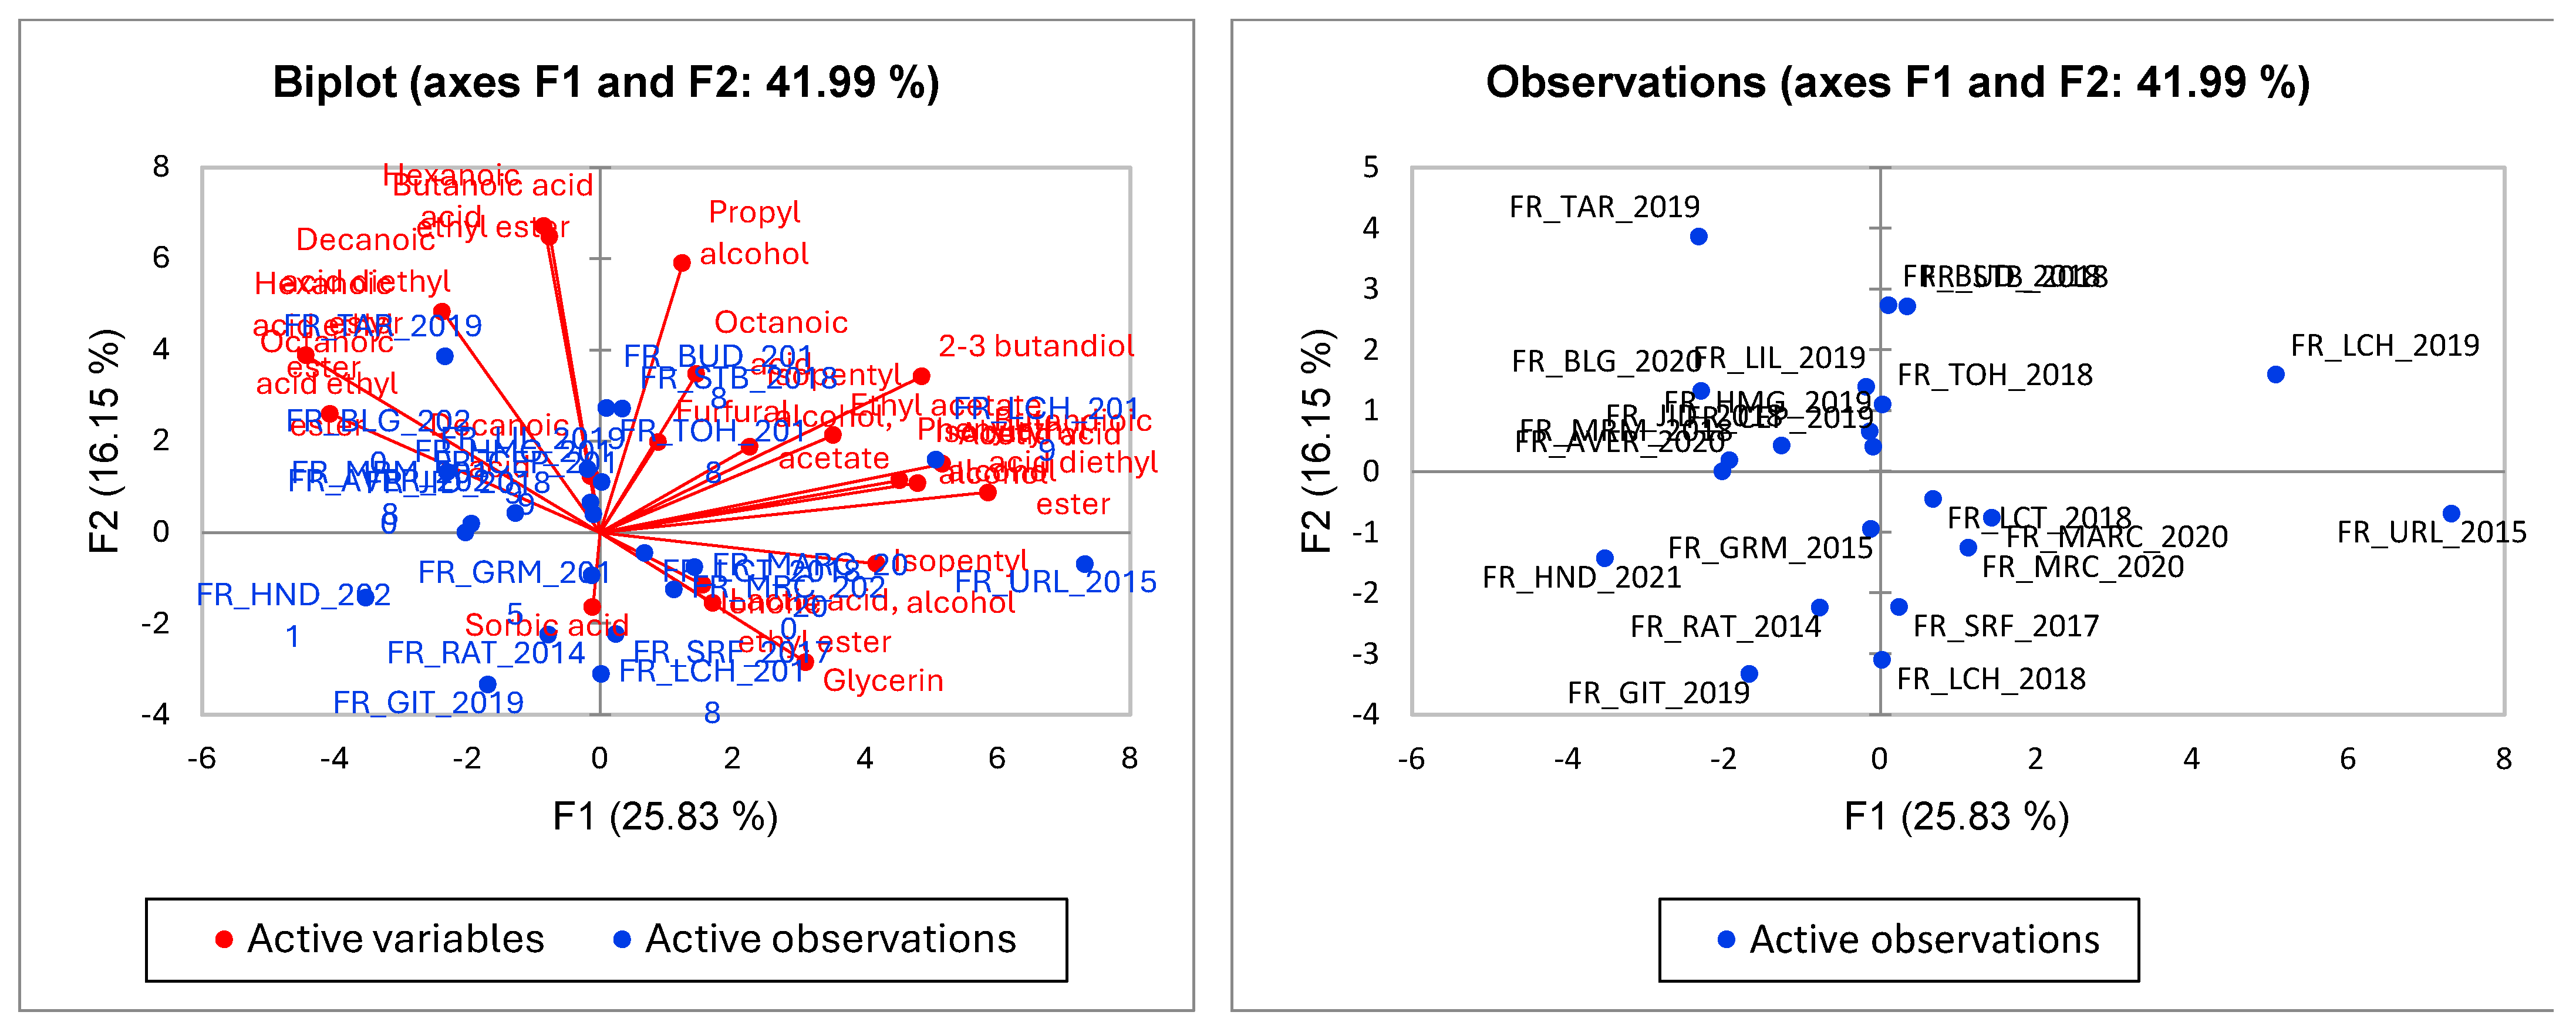
Figure 10.
Biplot representation for F1/F2 resulted after PCA analysis of FA wine samples.

Figure 11.
Dendrogram of the FA wine samples analyzed.
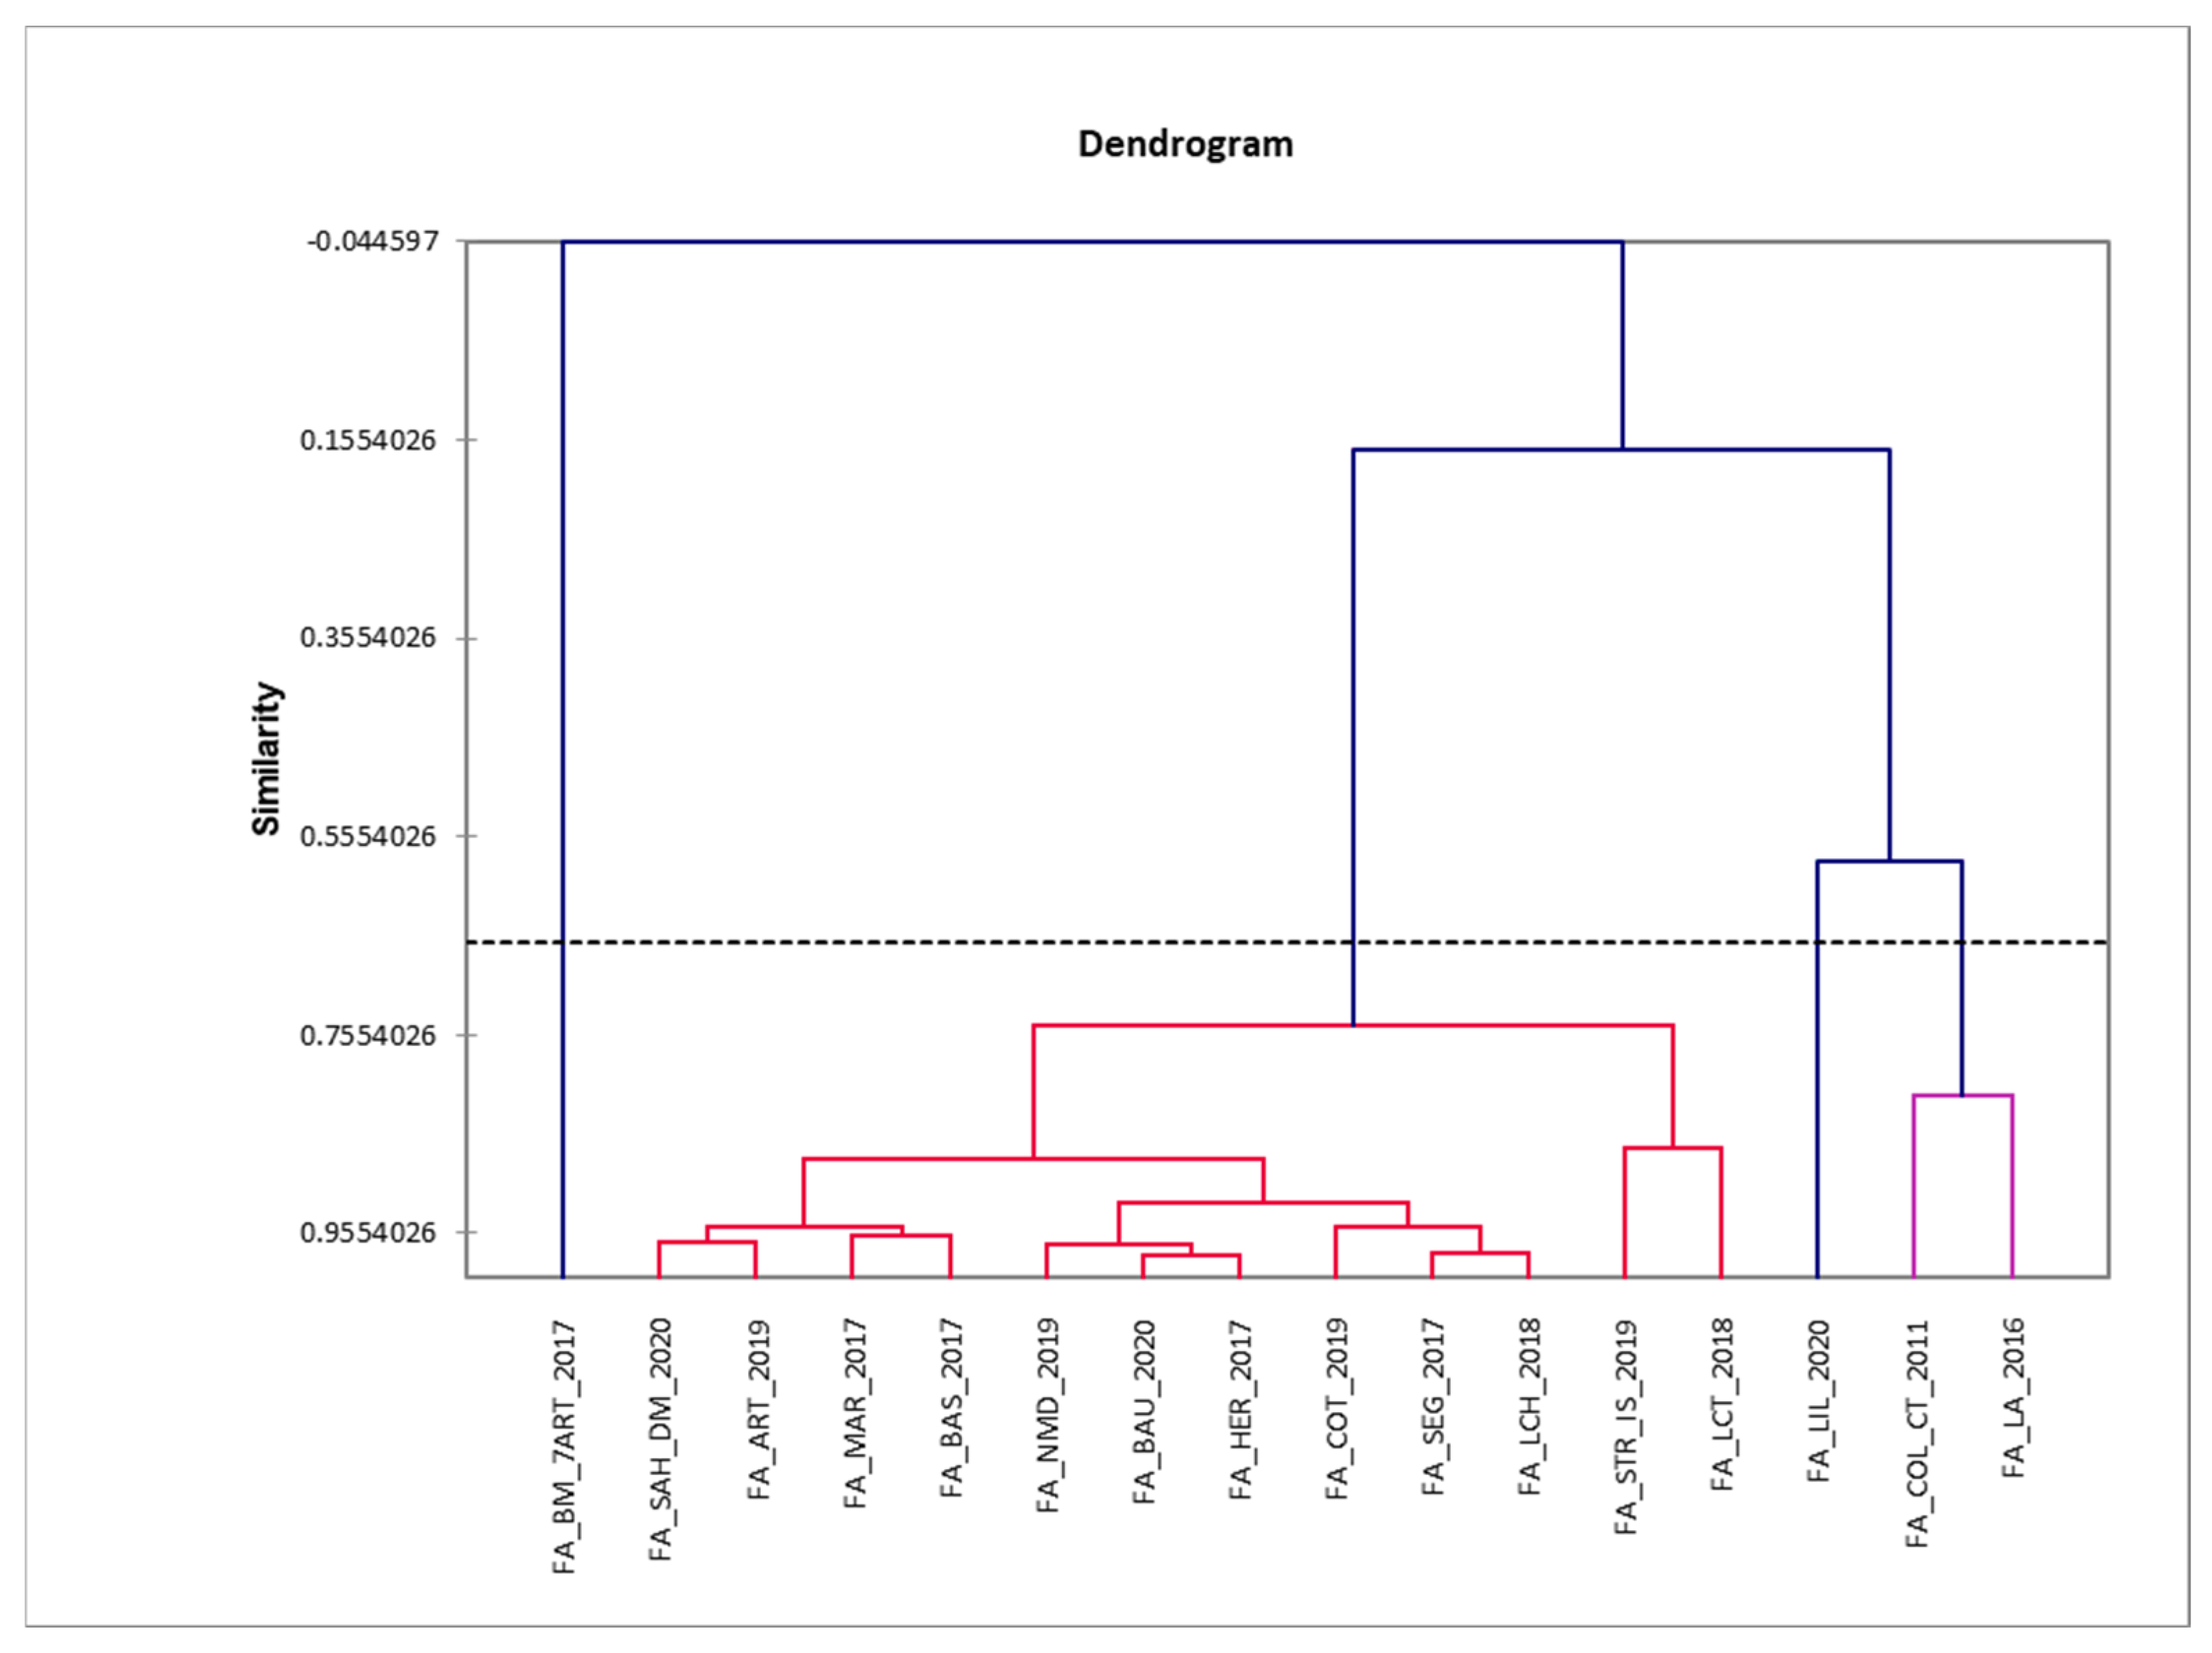
Figure 12.
Dendrogram of the FR wine samples analyzed.
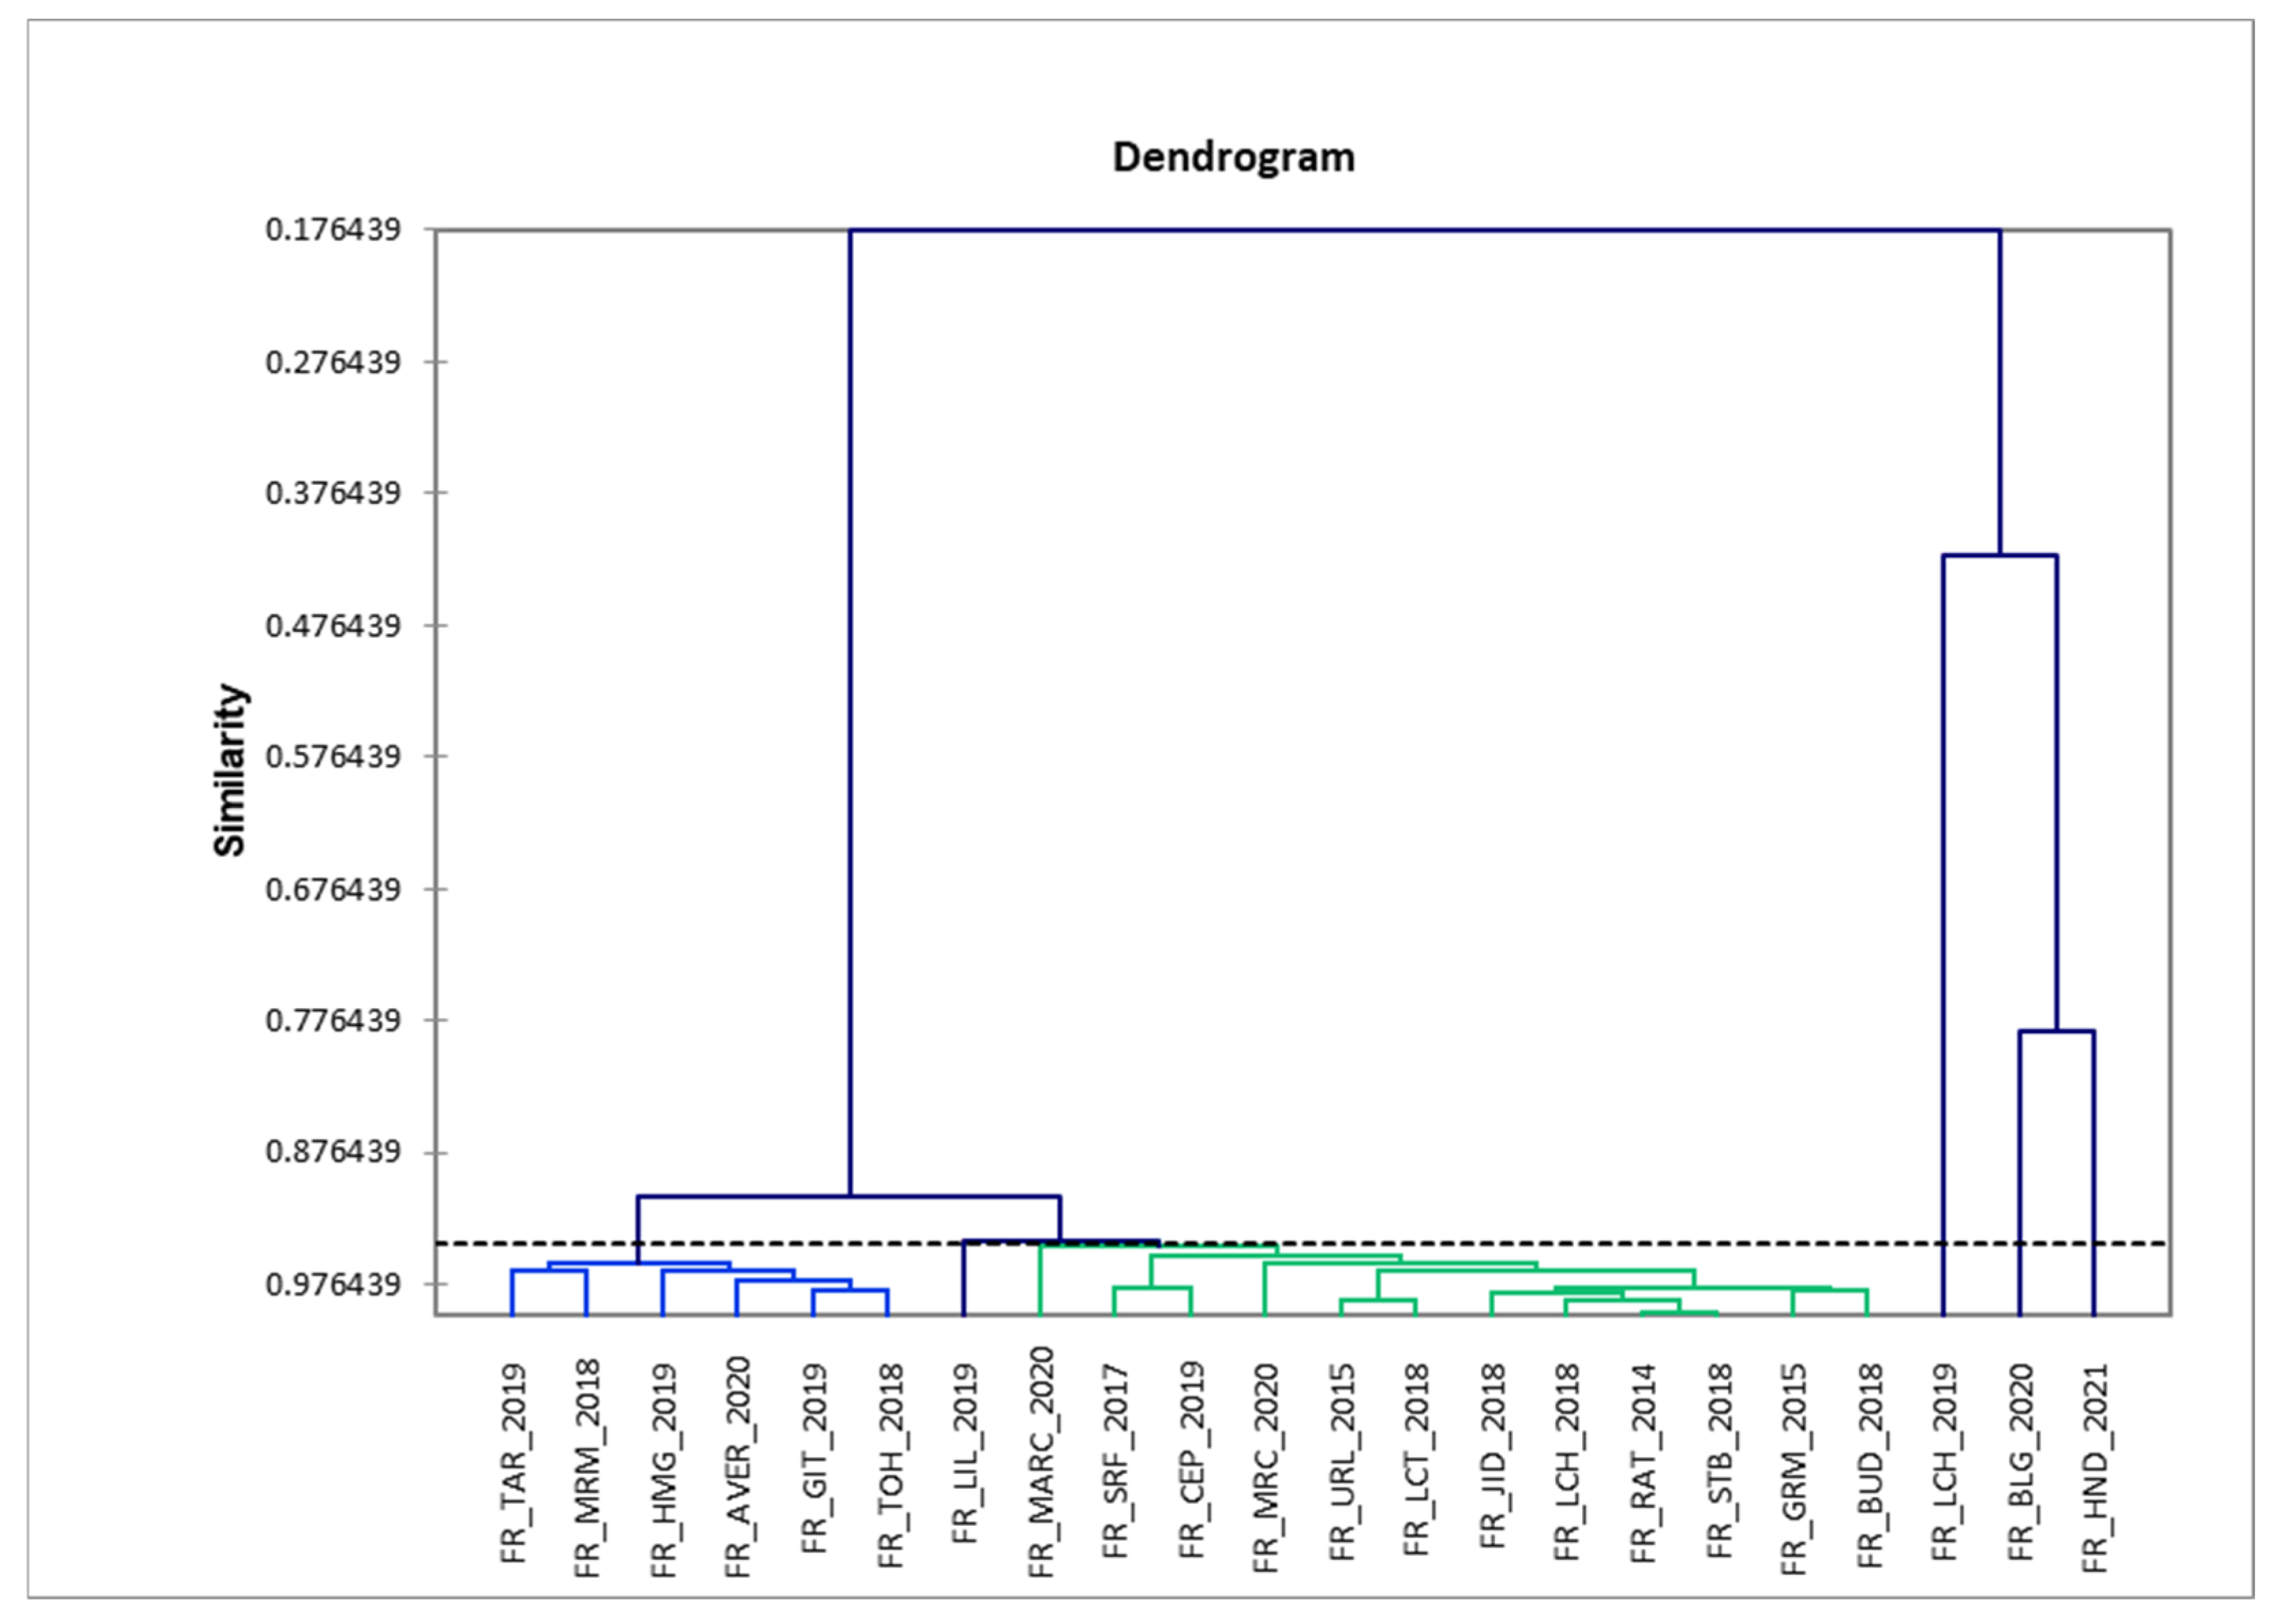
Table 1.
The winemaking region of Fetească wines analyzed in this study.
| Group | Growing Area | Samples Details | Sample Codification | Year of Production | pH * | Alc.% ** |
|---|---|---|---|---|---|---|
| Fetească albă | Muntenia | Dealu Mare (PH) | FA_LA_2014 | 2014 | 3.29 | 12.5 |
| D.O.C—C.M.D Ștefănești | FA_MAR _2017 | 2017 | 3.31 | 12.5 | ||
| Urlați (PH) | FA_BAS_2017 | 2017 | 3.51 | 13.0 | ||
| Dealu Mare (PH) | FA_NMD_2019 | 2019 | 3.39 | 10.0 | ||
| Dealu Mare (PH) | FA_ART_2019 | 2019 | 3.54 | 13.5 | ||
| Dealu Mare (PH) | FA_SAH_DM_2020 | 2020 | 3.73 | 14.3 | ||
| Oltenia | D.O.C—C.M.D Banu | FA_BM_7ART_2017 | 2017 | 3.35 | 13 | |
| Mărăcine, Craiova | FA_SEG_2017 | 2017 | 3.54 | 12 | ||
| D.O.C—C.M.D, Dolj Drăgășani, Vâlcea | FA_BAU_2020 | 2020 | 3.27 | 13 | ||
| Moldova | Cotnari (IS) | FA_COL_CT_2011 | 2011 | 3.54 | 13.5 | |
| Dealurile Moldovei (IS) | FA_STR_IS_2019 | 2019 | 3.59 | 12.5 | ||
| D.O.C—C.M.D, Cotnari (IS) | FA_COT_2019 | 2019 | 3.22 | 12.0 | ||
| D.O.C—C.M.D, Bivolari (IS) | FA_HER_2019 | 2019 | 3.57 | 13.2 | ||
| Transylvania | D.O.C—C.M.D, Lechința (BN) | FA_LCH_2018 | 2018 | 3.37 | 12.7 | |
| Valea Ascunsă, Teaca (BN) | FA_LCT_2018 | 2018 | 3.17 | 12.5 | ||
| D.O.C—C.M.D, Lechința (BN) | FA_LIL_2020 | 2020 | 3.29 | 12.5 | ||
| Fetească regală | Transylvania | Dealurile Crișanei (AL) | FR_RAT_2014 | 2014 | 3.19 | 13.9 |
| D.O.C—C.M.D, Târnave (AL) | FR_JID_2018 | 2018 | 3.28 | 12.0 | ||
| D.O.C—C.M.D, Jelba (BN) | FR_LCH_2018 | 2018 | 3.29 | 12.4 | ||
| D.O.C—C.M.D, Valea Ascunsă, Teaca (BN) | FR_LCT_2018 | 2018 | 3.05 | 13.5 | ||
| D.O.C—C.M.D, Târnava (MS) | FR_TAR_2019 | 2019 | 3.36 | 13.0 | ||
| D.O.C—C.M.D, Lechința (BN) | FR_LIL_2019 | 2019 | 3.14 | 12.5 | ||
| Muntenia | D.O.C—C.M.D, Lechința (BN) | FR_LCH_2019 | 2019 | 3.12 | 13 | |
| D.O.C—C.M.D, Dealu Mare, Urlați (PH) | FR_URL_2015 | 2015 | 3.06 | 13.5 | ||
| D.O.C—C.M.D, Mizil (PH) D.O.C—Dealu Mare, Gura Vadului (PH) | FR_SRF_2017 FR_BUD_2018 | 2017 2018 | 3.23 3.05 | 12 13 | ||
| Gura Vadului (PH) | FR_TOH_2018 | 2018 | 3.44 | 11 | ||
| D.O.C—C.M.D, Ceptura (PH) | FR_CEP_2019 | 2019 | 3.37 | 13 | ||
| Gura Vadului (PH) | FR_DM_2020 | 2020 | 3.34 | 13 | ||
| Ștefănești (AG) | FR_MRC_2020 | 2020 | 3.22 | 12 | ||
| Dealu Mare, Urlați (PH) | FR_BLG_2020 | 2020 | 3.6 | 13 | ||
| Moldova | Bucium (IS) | FR_GRM_2015 | 2015 | 3.23 | 12 | |
| Huși (VS) | FR_AVER_2020 | 2020 | 3.01 | 12.5 | ||
| Oltenia | Dealurile Olteniei | FR_STB_2018 | 2018 | 2.92 | 13.5 | |
| Dealurile Segarcea, Dolj | FR_MRM_2018 | 2018 | 3.48 | 12.2 | ||
| Dobrogea | Valea lui Traian (CT) | FR_GIT_2019 | 2019 | 3.22 | 13.5 | |
| Banat | Babadag (TL) | FR_HMG_2019 | 2019 | 3.43 | 13.5 | |
| Miniș-Măderat (AR) | FR_MARC_2020 | 2020 | 3.47 | 13.5 | ||
| Recaș (TM) | FR_HND_2021 | 2021 | 3.30 | 11.5 |
* Measured with a pH-meter, ** Alcohol content indicated on the label.
Table 2.
Volatile compounds extracted from Fetească albă sample (SAH_DM_ 2020).
| No.crt. | Compounds Name | RT | Molecular Formula | Molecular Weight, g/mol | Integrated Ions |
|---|---|---|---|---|---|
| 1. | Ethyl acetate | 4.02 | C4H8O2 | 88.11 | 43/61/45 |
| 2. | Butanoic acid ethyl ester | 8.5 | C6H12O2 | 116.16 | 71/43/29 |
| 3. | Propyl alcohol | 8.64 | C3H8O | 60.09 | 31/29/27 |
| 4. | Isobutyl alcohol | 10.41 | C4H10O | 74.13 | 43/41/42 |
| 5. | Acetic acid, pethyl ester | 11.39 | C7H14O2 | 130.19 | 43/70/42 |
| 6. | Isopentyl alcohol | 14.15 | C5H12O | 88.15 | 29/42/57 |
| 7. | Hexanoic acid ethyl ester | 14.95 | C8H16O2 | 144.21 | 88/29/43 |
| 8. | Lactic acid ethyl ester | 18.3 | C5H10O3 | 118.13 | 45/29/27 |
| 9. | 2-octanol | 20.25 | C8H18O | 130.23 | 45/55/41 |
| 10. | Octanoic acid ethyl ester | 20.7 | C10H20O2 | 172.27 | 88/101/57 |
| 11. | Acetic acid | 21.52 | C2H4O2 | 60.05 | 43/45/60 |
| 12. | Ionone | 23.25 | C13H20O | 192.30 | 121/93/136 |
| 13. | 2–3 butandiol | 23.52 | C4H10O2 | 90.12 | 45/43/57 |
| 14. | Decanoic acid, ethyl ester | 25.8 | C12H24O2 | 200.32 | 88/101/29 |
| 15. | Butandioic acid diethyl ester | 26.85 | C8H14O4 | 174.20 | 101/29/129 |
| 16. | Hexanoic acid | 30.7 | C6H12O2 | 116.16 | 60/73/41 |
| 17. | Phenylethyl alcohol | 32.19 | C8H10O | 122.16 | 91/92/65 |
| 18. | Octanoic acid | 35.05 | C8H16O2 | 144.21 | 60/73/43 |
RT—retention time, min
Disclaimer/Publisher’s Note: The statements, opinions and data contained in all publications are solely those of the individual author(s) and contributor(s) and not of MDPI and/or the editor(s). MDPI and/or the editor(s) disclaim responsibility for any injury to people or property resulting from any ideas, methods, instructions or products referred to in the content. |
© 2024 by the authors. Licensee MDPI, Basel, Switzerland. This article is an open access article distributed under the terms and conditions of the Creative Commons Attribution (CC BY) license (https://creativecommons.org/licenses/by/4.0/).
Share and Cite
MDPI and ACS Style
Manolache, F.-A.; Duță, D.-E.; Criveanu-Stamatie, G.D.; Iordache, T.-A.; Todașcă, M.-C. Decoding the Volatile Profile of White Romanian Fetească Wines. Separations 2024, 11, 141. https://doi.org/10.3390/separations11050141
AMA Style
Manolache F-A, Duță D-E, Criveanu-Stamatie GD, Iordache T-A, Todașcă M-C. Decoding the Volatile Profile of White Romanian Fetească Wines. Separations. 2024; 11(5):141. https://doi.org/10.3390/separations11050141
Chicago/Turabian StyleManolache, Fulvia-Ancuța, Denisa-Eglantina Duță, Gabriela Daniela Criveanu-Stamatie, Teodora-Alexandra Iordache, and Maria-Cristina Todașcă. 2024. "Decoding the Volatile Profile of White Romanian Fetească Wines" Separations 11, no. 5: 141. https://doi.org/10.3390/separations11050141
Note that from the first issue of 2016, this journal uses article numbers instead of page numbers. See further details here.