Communication

Screening and Evaluation of Variables for Determination of Sulfonylurea Herbicides in Water Samples by Capillary Zone Electrophoresis

by
Valeria Springer
*,
Carolina V. Di Anibal
and
Adriana G. Lista
INQUISUR (CONICET-UNS), Departamento de Química, Universidad Nacional del Sur, Alem Av. 1253, Bahía Blanca B8000CPB, Buenos Aires, Argentina
*
Author to whom correspondence should be addressed.
Separations 2016, 3(3), 22; https://doi.org/10.3390/separations3030022
Submission received: 18 May 2016 / Revised: 9 July 2016 / Accepted: 25 July 2016 / Published: 5 August 2016

Abstract

:
A simple and rapid capillary electrophoretic method was developed for the simultaneous determination of two sulfonylurea herbicides in water samples: metsulfuron-methyl (MSM) and nicosulfuron (NS). These herbicides are widely used in agricultural practices and their residues represent potential environment pollutants in waters and soils. The effect of the pH of the background electrolyte solution (BGE), the percentage of methanol in the BGE and the separation voltage were studied on the resolution of MSM and NS. A 23 factorial design was used to identify the main factors which significantly influenced the separation of these compounds. Other parameters were evaluated by the univariate method. The experimental results show that using a BGE composed of 25 mmol·L−1 sodium borate and 3% (v/v) of methanol at pH 8.5 and applying 15 kV, satisfactory analysis time and resolution between peaks can be obtained. The linear range for both analytes was 0.1–2.0 µg·mL−1. The detection limits were 0.034 µg·mL−1 for MSM and 0.044 µg·mL−1 for NS. Surface water and groundwater samples were analyzed applying the new method, and the obtained results presented satisfactory recovery percentages (82%–102%).

Graphical Abstract

1. Introduction

Sulfonylurea herbicides (SUs), which were first introduced in the 1980s, are selective systemic herbicides widely used as control chemicals for most broad-leaved weeds and grasses in agricultural crops, such as wheat, rice and soybean [1]. Due to the increase of the world population and the consequent demand for food, the use of these herbicides has become important for the development of agricultural production. Sulfonylurea herbicides also exhibit rather large residuality in soils [2]. In addition, they represent potential environment pollutants in surface water and soils and may produce damage to the environment and human health due to their toxicity and persistence [3]. Also, these herbicides can reach surface water sources due to the wastewater after spraying crops and inappropriate rinsing of containers. Several studies have demonstrated the effect of herbicides on the environment and their damage to human health and aquatic ecosystems due to exposition [4,5,6,7]. Taking this into account, the development of methods for monitoring these compounds in environmental samples is required to protect the environment and ensure human health. In Argentina, legislation is not restrictive about the use of such herbicides in crops as it is in other countries [8,9].
Various analytical methods have been developed to determine pesticides and herbicides in soils and water samples, including liquid and gas chromatography with different detectors [10], capillary electrophoresis, spectrophotometry, electroanalytical techniques, electrochemical sensors and biosensors, flow injection analysis and immunoassays [11]. Capillary electrophoresis (CE) is a separation technique that has become important in separation science because it offers various advantages such as faster separations, higher resolution power and smaller sample requirement amounts [12]. In CE, several chemical, physical and instrumental parameters should be controlled in order to obtain satisfactory analyses in terms of minimum analysis time and high resolution and sensitivity. The classical ‘univariate’ approach, widely employed for the development of CE separations, may offer advantages, but it fails to consider interactions between two or more factors. In the capillary zone electrophoresis (CZE) mode the separation of analytes is based on the differences in their charges and hydrodynamic radius; thus, all the relevant parameters affecting the ionization of the compound play a significant role in the analysis and must be evaluated. In particular, the type of electrolyte solution, pH, additives and separation voltage influence the migration velocity of the analytes, the separation efficiency and the peak shape.
On the other hand, the design of experiments (DoE) is a multivariate methodology of experimental research in which the variables under study are simultaneously changed within an experiment. In analytical chemistry, experimental design is used in optimization and validation steps by including a screening step that selects from a number of potential independent factors (studied at n levels) those that are significant. Full factorial design is commonly used for the study of the main factors and their interactions in order to predict how changes in variables (e.g., temperature, pH, buffer concentration, separation voltage, etc.) can affect several responses (e.g., migration time, peak area resolution, etc.) in a defined experimental region. Thus, it is possible to obtain a mathematical model describing in a provisional way the response variation in the experimental domain [13].
The aim of this work is to establish adequate experimental conditions in which metsulfuron-methyl (MSM) and nicosulfuron (NS) can be determined by CZE coupled to ultraviolet (UV) detection with maximum resolution and minimal analysis time. To this purpose, a full factorial design (23) was used for screening the effect of relevant electrophoretic factors on the electrophoretic peak resolution. In addition, other factors were optimized using the univariate method. Thus, a simple and fast CE method is proposed to determine both sulfonylurea herbicides in water samples, being a suitable method for monitoring these compounds.

2. Materials and Methods

2.1. Chemicals and Reagents

All reagents were of analytical grade and ultrapure water (>18 M·Ω·cm−1) was used. Metsulfuron-methyl (MSM) and nicosulfuron (NS) were purchased from Sigma-Aldrich (Munich, Germany). Acetonitrile was obtained from Baker (Griesheim, Germany). The background electrolyte solution (BGE) was daily prepared with sodium borate (Baker, Griesheim, Germany), HCl (Merck, Buenos Aires, Argentina) and methanol (Biopack, Buenos Aires, Argentina).
A 50 µg·mL−1 standard solution of each analyte was prepared in a 50:50 v/v mixture (ultrapure water:acetonitrile) and stored at 4 °C. These solutions are stable for two months. The standard working solutions were daily prepared by appropriate dilutions of the stock solutions in ultrapure water. For the screening process and the multivariate optimization an aqueous solution of both MSM and NS (2 µg·mL−1) was used.

2.2. Instrumentation and Software

A Beckman Coulter capillary electrophoresis instrument P/ACE™ MDQ equipped with a diode array detector (DAD) was used (Sciex, Redwood, CA, USA). The capillaries were also from Beckman System. Control and data processing were carried out with 32 Karat™ software (version 4) (Sciex, Redwood, CA, USA). Experimental design calculations and statistical analysis were performed using Matlab software (version 7.6.0.324) (MathWorks, Natick, MA, USA).

2.3. CE Analysis

CE separation was carried out in a fused-silica capillary (51 cm effective length, 62 cm total length, 75 µm i.d.) with a positive power supply of 15 kV at 25 °C. Sample injections were performed in hydrodynamic mode for 15 s at 0.5 psi. The BGE was 25 mmol·L−1 sodium borate with 3% v/v methanol at pH 8.5 adjusted with HCl 0.4 mol·L−1. The capillary was conditioned daily by flushing it with 0.1 mol·L−1 NaOH (5 min), ultrapure water (3 min) and buffer solution (5 min). Electropherograms were collected at 231 nm for both analytes. All solutions were filtered through a 0.45 µm filter (Gamafil, Buenos Aires, Argentina) prior to CE analysis.

2.4. Water Samples

Water samples were collected from the surrounding area of Bahía Blanca (Buenos Aires province, Argentina) where wheat fields are located. For surface and groundwater samples, a volume of 500 mL was taken and stored in glass bottles. Samples were filtered (80 µm filter paper) to remove major particles and stored at 4 °C in darkness until analysis. The pH of samples was between 6.0 and 7.0.

3. Results and Discussion

3.1. Preliminary Studies

Due to the fact that MSM and NS are weak acid compounds with pKa (25 °C) values of 3.75 and 4.22, respectively [14], these herbicides can be determined by CZE in their anionic form at pH values above 7.0. Thus, different BGE compositions were evaluated. Phosphate- and borate-based BGE and their mixtures are commonly used to separate SUs at pHs above 7.0 [15,16]; thus, they were tested in preliminary studies. From the obtained results, sodium borate–based BGE was selected for further analysis based on the migration times of the analytes and the electrical current during separation.

3.2. Method Optimization

The considered CE parameters were separation, sensitivity and migration time. Thus, resolution was used as the response for the optimization process. The resolution between peaks was calculated using Equation (1) where Rs is the resolution, tm is the migration time and w is the peak width.
Rs = 2 ( tm 1 tm 2 ) ( w 1 + w 2 )
According to preliminary studies, injection time and temperature were optimized by the univariate method, being studied in the range 5–20 s and 15–30 °C, respectively. In general, these are the most practicable ranges in CE analysis. Although a long injection time improved signals, a loss in resolution and peak distortion occurred, and thus 15 s was selected at 0.5 psi for better responses. No significant variations in migration times were observed when the temperature was varied above 25 °C; thus, this temperature was selected for analysis. Besides, the sodium borate concentration was evaluated between 20 mmol·L−1 and 50 mmol·L−1; higher concentrations are not generally recommended because of the Joule heating phenomenon within the capillary. From the obtained analytes’ peak shape and their mobility, 25 mmol·L−1 sodium borate was considered as the optimum concentration.

3.3. Screening Process

In the screening process, three variables were selected and a full factorial 23 was designed in order to evaluate whether the experimental domain was suitable for the parameters that could influence the electrophoretic separation of the two herbicides. The three studied variables are quantitative: pH of 8.5 (−) or 9.5 (+), voltage of 15 kV (−) or 25 kV (+) and percentage of methanol in the buffer of 3% (−) or 8% (+). The pH range was selected considering that the analytes are in their anionic form and the CE system is stable within this range; also, the percentage of methanol was required because this solvent allows us to improve the separation between peaks. Table 1 describes the experimental conditions of the experiments that were carried out using a 23 full factorial design, including three replicates of the central point, and the responses were expressed as peak resolution (Rs). All the experiments were randomly evaluated in order to eliminate the effect of undesirable variables. It can be observed that the maximum resolution was obtained in experiment no. 1: pH = 8.5%, 3% methanol and a voltage of 15 kV. The results are shown in Figure 1, where in the center of each square the response (Rs) has been represented at each pH to analyze the effect of the variables. It can be observed that better resolution values are obtained at lower pH values (pH = 8.5) and, in this case, there is not a significant improvement between low and high voltages. However, there is a slight improvement in resolution when lower percentages of methanol are included.
In order to identify the variables that are significant, the principal effects (Ef) and interactions coefficients were calculated using Equation (2) [17]:
Ef = y ( + 1 ) n   y ( 1 ) n
where y(+1) and y(−1) are the response values at the maximum and the minimum levels of an examined factor, respectively, and n is the number of variables at the same level. Figure 2 shows the main and interaction standardized factors in a Pareto chart, which are (A) pH, (B) percentage of methanol and (C) voltage.
The significance of the effects was evaluated and the vertical line corresponds to the critical values above the effects which are significant (level of significance, α = 0.05). The analysis of the effects shows that the most influential variable is pH (A) with a negative effect, which means that the resolution is higher at lower pH values. The resolution between MSM and NS is improved because the analytes have slightly different mobility at these pH values, considering that these compounds are present as anionic species at pH above these pKa values. The positive effect of % methanol (B) is less influential while voltage (C) is not significant. Otherwise, the statistically significant interaction between methanol/voltage (BC) and between pH/methanol (AB), is noticeable, and it can affect the analytes’ mobility due to the modifications on pH, electrical field strength and the BGE viscosity. This indicates that the response is affected in different ways by the interactions of the three variables, depending on the levels of the other variables, as was shown in Figure 1.
The linear equation obtained with the regression model describing the magnitude and direction of the main factors is defined as follows:
y = 3.90   +   0.82 A +   2.10 B +   0.75 C   0.27 AB   0.09 AC   0.14 BC + 0.02 ABC
where y is the resolution and the model coefficients are the estimation of the effects. The other terms in the linear equation are related to the interaction between factors. The interaction between pH and voltage (AC) and third-order interactions ABC were discarded because they were not significant for the statistical design.
Regarding the statistical analysis of the linear model with ANOVA, the correlation coefficient was 0.98, and the F-value was seven times higher than the tabulated value for a 95% confidence level. In addition, the percentage of maximum explicable variance was 98.97% and the percentage of explained variance was 98.53%. The closeness of such values indicates a good linear fit. The model was validated with the experimental points that were used to create the model along with the other three selected points within the experimental domain [18]. Figure 3 compares the experimental results with the predicted ones using the linear model. The obtained regression (y = 0.9835x + 0.0181) was statistically comparable with the ideal one (y = x) and had a significance of 5% according to a join test of slope 1 and a regression intercept of 0. Therefore, the first-order model fits the proposed screening process.
Surface response plots were evaluated and planar surfaces were obtained in all plots (not shown). Therefore, since we want to obtain the maximum resolution within the proposed ranges, curvature does not affect the optimization process. Finally, the best CE conditions for the separation of MSM and NS were achieved with a BGE composed of 25 mmol·L−1 sodium borate—3% v/v methanol at pH 8.5 (25 °C), applying 15 kV and the injection of samples for 15 s at 0.5 psi.

3.4. Analytical Performance

The analytical performance of the proposed CE method was evaluated in terms of the calibration range, sensitivity, reproducibility and precision. The calibration curves were y = (4396.22 ± 69.00)x + (210.96 ± 67.88) with r2 = 0.998 for NS, and y = (4845.10 ± 55.61)x + (211.75 ± 54.69) with r2 = 0.999 for MSM. Each point of the calibration graphs corresponds to the average of three individual measurements. The linear range for both analytes was 0.1–2.0 µg·mL−1. The limits of detection (LODs) calculated as three times Sy/x/slope [18] of the calibration graph were 0.034 µg·mL−1 for MSM and 0.044 µg·mL−1 for NS. The precision of the method was evaluated by analyzing six replicates of the standard solution containing 0.5 µg·mL−1 and the relative standard deviation (RSD) was 3.53% for NS and 3.24% for MSM.
As can be seen in Table 2, the performance obtained with the proposed CZE-UV method, in term of analysis time, is comparable with those reported in the literature for the determination of nicosulfuron and metsulfuron-methyl, even using a simple BGE solution with a minimal percentage of organic solvent. In addition, it could be possible to reach lower LODs if the proposed method is coupled with appropriate preconcentration techniques.

3.5. Analysis of Real Samples

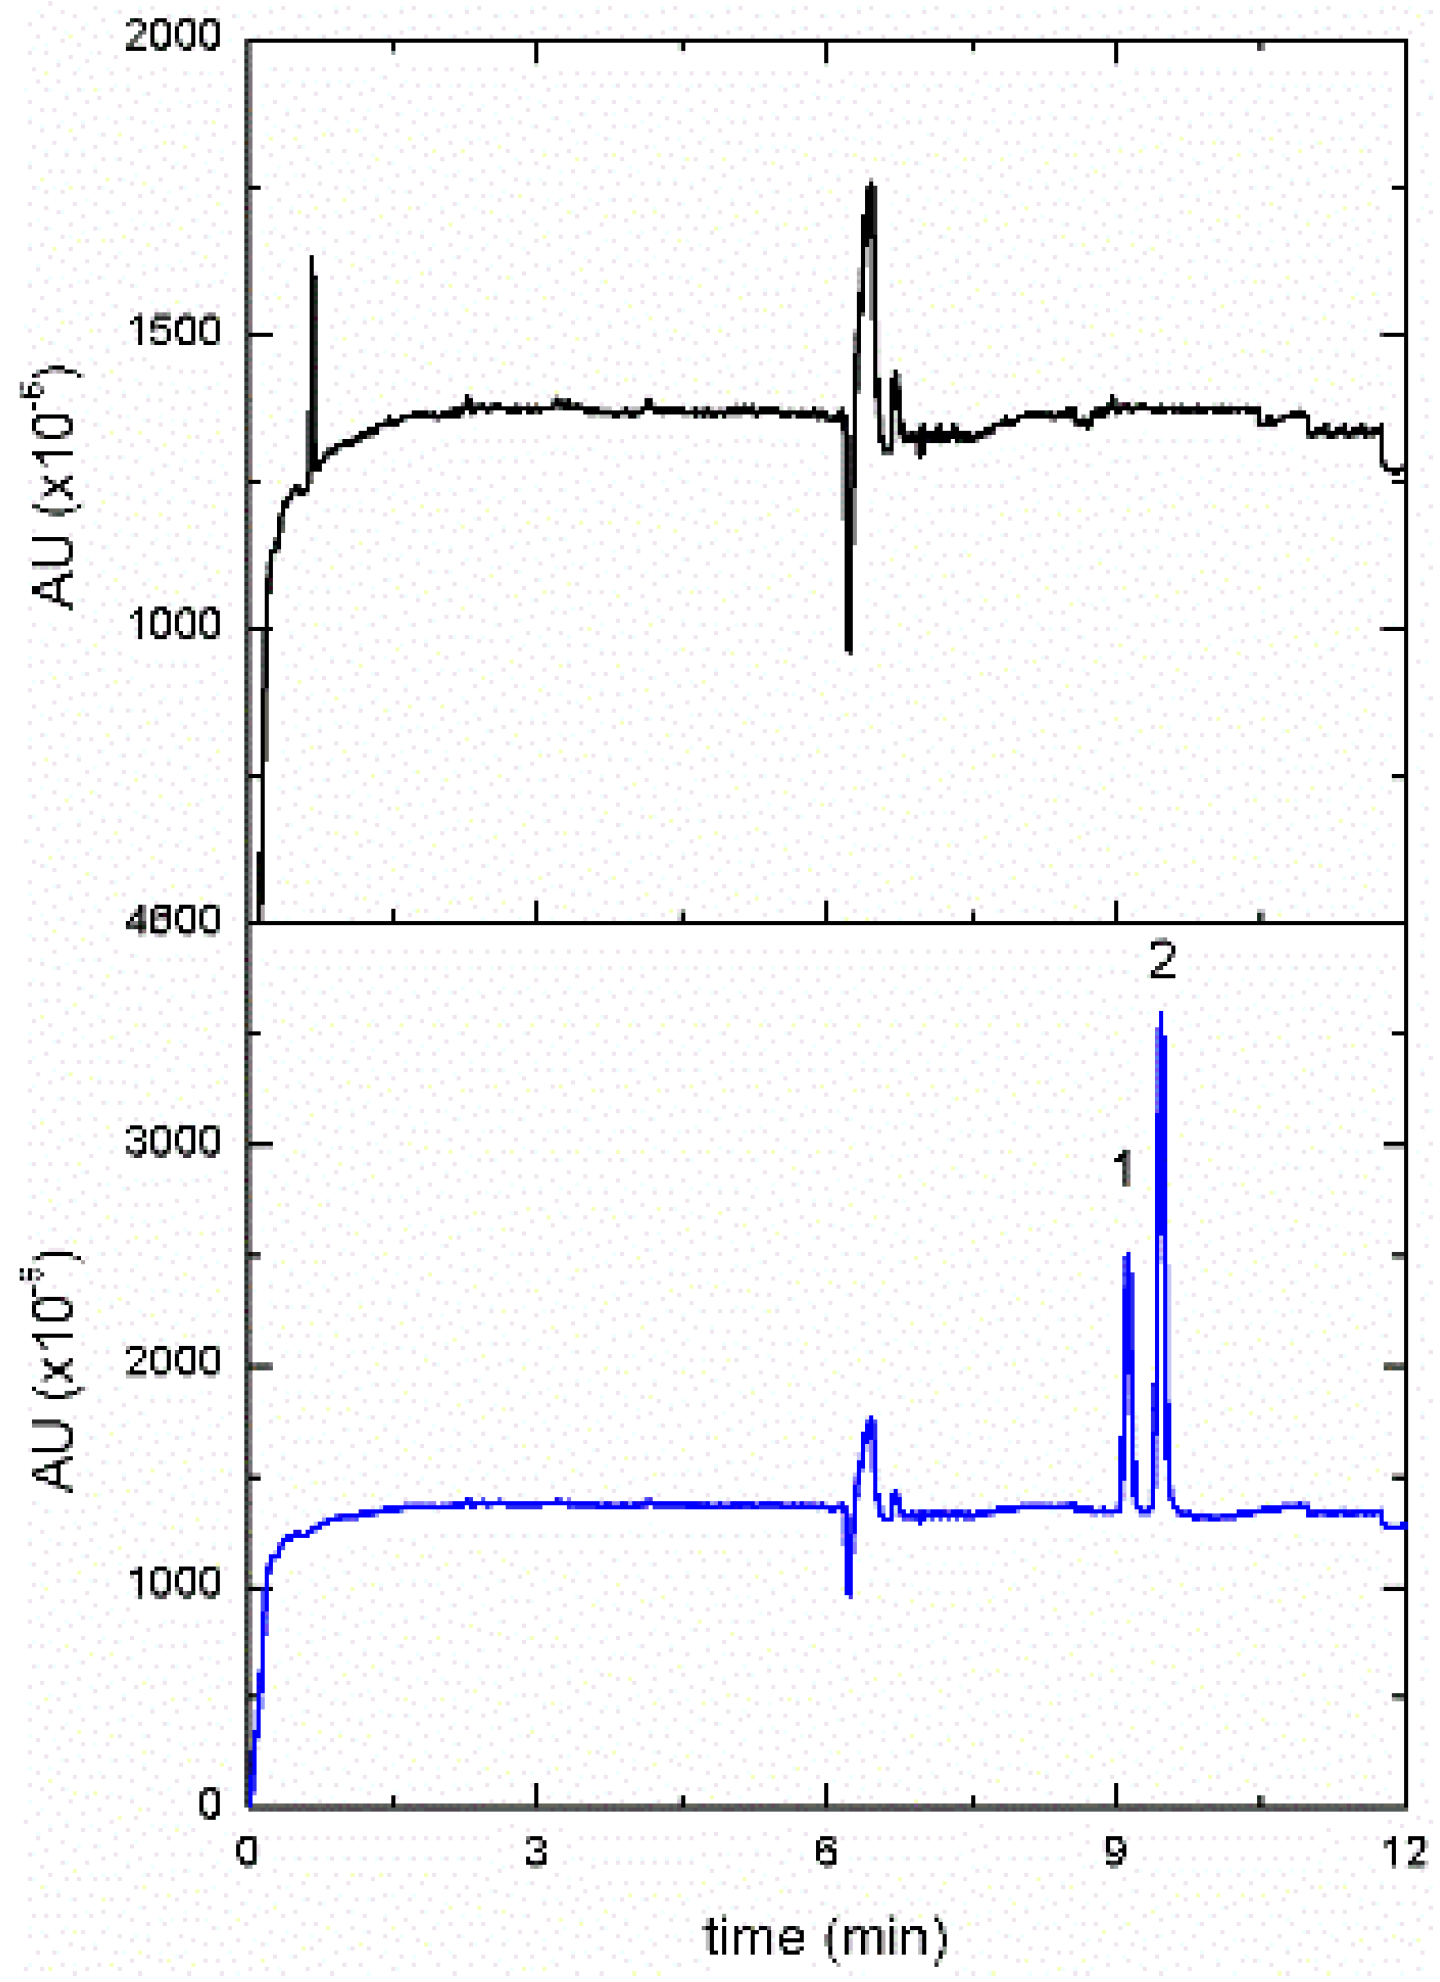
Surface water and groundwater samples were selected to evaluate the applicability of the proposed method for determining these herbicides in real samples as well as the presence of possible interferences. Neither MSM nor NS were detected in the analyzed samples at the studied concentration levels, so they were spiked with two different concentrations of analytes. Table 3 shows the obtained recovery percentages when the proposed method was applied to real samples. Figure 4 shows a typical electropherogram of a surface water sample spiked with 0.5 µg·mL−1 of each sulfonylurea.

4. Conclusions

In this study, a simple and rapid CE method was proposed for the simultaneous determination of nicosulfuron and metsulfuron-methyl in aqueous solution. A 23 factorial design was used as a quick screening tool to evaluate the CE separation of MSM and NS by changing different variables. Thus, it allowed the simultaneous evaluation of the critical parameters commonly involved in CE analysis with minimal experiments performed. Good results with respect to linearity, precision and selectivity were obtained in the studied concentration range. Additionally, the herbicides could be separated within a short analysis time compared to other electrophoretic and chromatographic methods pointed out in the literature. Future research will include an appropriate coupling between this CZE-UV method and preconcentration techniques to determine lower concentrations of these herbicides in environmental samples.

Acknowledgments

Financial support from the National University of the South (Bahía Blanca, Argentina) is gratefully acknowledged. C. Di Anibal and V. Springer would like to express their gratitude to the National Council of Scientific and Technical Research (CONICET, Argentina).

Author Contributions

Valeria Springer and Carolina V. Di Anibal conceived, designed and performed the experiments; Valeria Springer, Carolina V. Di Anibal and Adriana G. Lista analyzed the data, contributed reagents/materials/analysis tools and wrote the paper.

Conflicts of Interest

The authors declare no conflict of interest.

References

  1. Brown, H.M. Mode of action, crop selectivity, and soil relations of the sulfonylurea herbicides. Pestic. Sci. 1990, 29, 263–281. [Google Scholar] [CrossRef]
  2. Weber, J.B. Properties and behavior of pesticides in soil. In Mechanisms of Pesticide Movement into Groundwater; Honeycutt, R.C., Shabacker, D.J., Eds.; CRC Press Inc.: Boca Raton, FL, USA, 1994. [Google Scholar]
  3. Cessna, A.J.; Donald, D.B.; Bailey, J.; Waiser, M. Persistence of the Sulfonylurea Herbicides Sulfosulfuron, Rimsulfuron, and Nicosulfuron in Farm Dugouts (Ponds). J. Environ. Qual. 2015, 44, 1948–1955. [Google Scholar] [CrossRef] [PubMed]
  4. Piola, J.C.; Prada, D.B.; Ezpeleta, D.C. Rabdomiolisis aguda por exposición percutánea a un herbicida en dos pacientes en Rosario Argentina. Acta Toxicol. Argent. 1997, 7, 11–15. [Google Scholar]
  5. INVESTEA-Asociación para la investigación y educación ambiental y Didáctica ambiental S.L. ISSN: 1698-5893. Revista de Didáctica Ambiental n° 10; Colombia, 2011. Available online: http://www.didacticaambiental.com/revista (accessed on 5 July 2016).
  6. Yin, X.H.; Li, S.N.; Zhang, L.; Zhu, G.N.; Zhuang, H.S. Evaluation of DNA damage in Chinese toad (Bufo bufo gargarizans) after in vivo exposure to sublethal concentrations of four herbicides using the comet assay. Ecotoxicology 2008, 17, 280–286. [Google Scholar] [CrossRef] [PubMed]
  7. Cessna, A.J.; Donald, D.B.; Bailey, J.; Waiser, M.; Headley, J.V. Persistence of the Sulfonylurea Herbicides Thifensulfuron-Methyl, Ethametsulfuron-Methyl, and Metsulfuron-Methyl in Farm Dugouts (Ponds). J. Environ. Qual. 2006, 35, 2395–2401. [Google Scholar] [CrossRef] [PubMed]
  8. Argentine Legislation 24051 Decreto 831, Régimen de desechos peligrosos. Anexo II, Tabla I, 1991. Available online: http://www2.medioambiente.gov.ar/mlegal/residuos/dec831/dec831_anxII_t1.htm (accessed on 5 July 2016).
  9. Official Journal of European Communities, EU legislation: Maximum pesticide limits for food products for human consumption and animal feeding stuffs. Council Regulation (EC) No 396/2005. Available online: http://eur-lex.europa.eu/legal-content/EN/ALL/?uri=CELEX%3A32005R0396 (accessed on 5 July 2016).
  10. Andreu, V.; Pico, Y. Determination of pesticides and their degradation products in soil: Critical review and comparison of methods. TRACs Trends Anal. Chem. 2004, 23, 772–789. [Google Scholar] [CrossRef]
  11. Bhadekar, R.; Pote, S.; Tale, V.; Nirichan, B. Developments in Analytical Methods for Detection of Pesticides in Environmental Samples. Am. J. Anal. Chem. 2011, 2, 1–15. [Google Scholar] [CrossRef]
  12. Guzman, N.A. Capillary Electrophoresis Technology; Marcel Dekker Inc. Press: New York, NY, USA, 1993. [Google Scholar]
  13. Orlandini, S.; Gotti, R.; Furlanetto, S. Multivariate optimization of capillary electrophoresis methods: A critical review. J. Pharm. Biomed. Anal. 2014, 87, 290–307. [Google Scholar] [CrossRef] [PubMed]
  14. Volgas, G.C.; Downer, R.A.; Lopez, H.B. Pesticide Formulations and Application Systems, 23rd ed.; ASTM American Society for Testing and Materials International: West Conshohocken, PA, USA, 2003. [Google Scholar]
  15. Dinelli, G.; Vicari, A.; Brandolini, V. Detection and quantitation of sulfonylurea herbicides in soil at the ppb level by capillary electrophoresis. J. Chromatogr. A 1995, 700, 201–207. [Google Scholar] [CrossRef]
  16. El-Debs, R.; Nehmé, R.; Claude, B.; Motteau, S.; Togola, A.; Berho, C.; Morin, P. Coated capillaries with highly charged polyelectrolytes and carbon nanotubes co-aggregated with sodium dodecyl sulphate for the analysis of sulfonylureas by capillary electrophoresis. J. Chromatogr. A 2014, 1367, 161–166. [Google Scholar] [CrossRef] [PubMed]
  17. Morgan, E.D. Chemometrics: Experimental Design; ACOL and John Wiley and Sons Press: Chichester, UK, 1991. [Google Scholar]
  18. Massart, D.L.; Vandeginste, B.G.M.; Buydens, L.M.C.; De Jons, S.; Lewi, P.J.; Smeyers-Verbeke, J. Hanbook of Chemometrics and Qualimetrics: Part A; Elsevier Science B.V.: Amsterdam, The Netherlands, 1997. [Google Scholar]
  19. Menne, H.J.; Janowitz, K.; Berger, B.M. Comparison of capillary electrophoresis and liquid chromatography for determination of sulfonylurea herbicides in soil: Environmental Analysis Using Capillary Electrophoresis and Related Techniques, including Capillary Electrochromatography. J. AOAC Int. 1999, 82, 1534–1541. [Google Scholar]
  20. Berger, B.M.; Wolfe, N.L. Multiresidue determination of sulfonylurea herbicides by capillary electrophoresis for hydrolysis studies in water and sediments. J. Anal. Chem. 1996, 356, 508–511. [Google Scholar] [CrossRef] [PubMed]
  21. García, F.; Henion, J. Fast capillary electrophoresis—Ion spray mass spectrometric determination of sulfonylureas. J. Chromatogr. A 1992, 606, 237–247. [Google Scholar] [CrossRef]
  22. Guibiao, Y.; Wei, Z.; Xin, C.; Canping, P.; Shuren, J. Determination and Quantitation of Ten Sulfonylurea Herbicides in Soil Samples Using Liquid Chromatography with Electrospray Ionization Mass Spectrometric Detection. Chin. J. Anal. Chem. 2006, 34, 1207–1212. [Google Scholar]
  23. Fenoll, J.; Hellín, P.; Sabater, P.; Flores, P.; Navarro, S. Trace analysis of sulfonylurea herbicides in water samples by solid-phase extraction and liquid chromatography-tandem mass spectrometry. Talanta 2012, 101, 273–282. [Google Scholar] [CrossRef] [PubMed]
Figure 1. Screening results.
Separations 03 00022 g001
Figure 2. Pareto chart of the standardized effects in the 23 factorial design. The variables are: A (pH), B (percentage of methanol) and C (voltage).
Separations 03 00022 g002
Figure 3. Comparison of the measured vs. predicted results obtained from the linear model. Squares are the points used to elaborate the model and circles are external points.
Separations 03 00022 g003
Figure 4. Electropherogram of surface water blank sample (top) and the spiked sample with 0.5 µg·mL−1 (bottom). Peaks: NS (1), MSM (2).
Separations 03 00022 g004
Table 1. Screening experimental plan and responses applying full factorial design (23).
Factors
Exp.pHMethanol %(v/v)Voltage (kV)Resolution (Rs)
18.53152.29
29.53151.73
38.58151.99
49.58151.45
58.53252.07
69.53251.12
78.58252.11
89.58252.08
99.05.5201.60
109.05.5201.79
119.05.5201.78
Table 2. Comparison of the performance of the optimized capillary zone electrophoresis- ultraviolet (CZE-UV) with other methods in the literature. LC-UV: Liquid chromatography–ultraviolet detection; LC-ESI-MS: Liquid chromatography-electrospray ionization-mass spectrometry; LC-MS2: Liquid chromatography-tandem mass spectrometry; LOD: Limit of detection; SPE: Solid phase extraction.
AnalytesMethodDetection Time (min)Separation MediumLODsRef.
12 sulfonylurea compounds including Metsulfuron-methyl and NicosulfuronCZE-UV (λ: 239 nm)NS (25)50 mM acetate buffer, pH 4.761.0 µg·kg−1 soil (SPE included through C18 column)[19]
MSM (29)
12 sulfonylurea compounds including Metsulfuron-methyl and NicosulfuronLC-UV (λ: 226 nm)NS (13)mobile phase: acetonitrile–0.01M H3PO4 (gradient elution program)1.0 µg·kg−1 soil (SPE included through C18 column)[19]
MSM (21)
17 sulfonylurea compounds including Metsulfuron-methyl Nicosulfuron and degradation productsCZE-UV (λ: 239 nm)NS (12.9)25 mM acetic acid and 25 mM sodium acetate, pH 4.76, and 1.86 M acetonitrile in water0.1 µg·mL−1 (NS and MSM)[20]
MSM (14.8)
8 sulfonylurea compounds including Metsulfuron-methyl and NicosulfuronCZE-UV (λ: 254 nm)NS (6)5 mM ammonium acetate-acetonitrile (75:25), pH 5-[21]
MSM (8)
10 sulfonylurea compounds including Metsulfuron-methyl and NicosulfuronLC-ESI-MSNS (10.7)mobile phase: acetonitrile/methanol–0.2% (v/v) acetic acid in water (gradient elution program)3.5 µg·mL−1 (NS), 1.5 µg·mL−1 (MSM)[22]
MSM (11.5)
30 sulfonylurea compounds including Metsulfuron-methyl and NicosulfuronLC-MS2NS (14.2)Mobile phase: acetonitrile–0.1% formic acid (gradient elution program)6.10−7µg·mL−1 (NS)
3.10−7µg·mL−1 (MSM) (SPE included through Oasis HLB cartridges)
[23]
MSM (15.5)
Nicosulfuron and metsulfuron-methylCZE-UV (λ: 231 nm)NS (9.1)25 mM sodium borate, 3% v/v methanol, pH 8.50.044 µg·mL−1 (NS)
0.034 µg·mL−1 (MSM)
This work
MSM (9.8)
Table 3. Recovery study by applying the proposed CZE-UV method. *: Mean of three replicates (n = 3); SD: Standard deviation.
Sample Added (µg·mL−1)Found (µg·mL−1) * ± SDRSD (%)Recovery (%)
Groundwater
NS0.10.092 ± 0.0022.292.0
0.50.455 ± 0.0071.592.0
MSM0.10.082 ± 0.0022.482.0
0.50.499 ± 0.0040.899.8
Surface
NS0.10.102 ± 0.0065.8102
0.50.471 ± 0.0030.694.2
MSM0.10.097 ± 0.0033.197.0
0.50.500 ± 0.0091.8100