Article

Comparison of Miniaturized and Conventional Asymmetrical Flow Field-Flow Fractionation (AF4) Channels for Nanoparticle Separations

1
Federal Institute for Materials Research and Testing (BAM), Richard-Willstätter-Street 11, D-12489 Berlin, Germany
2
Postnova Analytics GmbH, Max-Planck-Street 14, D-86899 Landsberg am Lech, Germany
*
Author to whom correspondence should be addressed.
Separations 2017, 4(1), 8; https://doi.org/10.3390/separations4010008
Submission received: 2 December 2016 / Revised: 19 December 2016 / Accepted: 8 March 2017 / Published: 18 March 2017
(This article belongs to the Special Issue Size Separation Techniques)

Abstract

:
The performance of a miniaturized channel for the separation of polymer and metal nanoparticles (NP) using Asymmetrical Flow Field-Flow Fractionation (AF4) was investigated and compared with a conventional AF4 system. To develop standard separation methods, experimental parameters like cross flow, gradient profile and injection time were varied and optimized. Corresponding chromatographic parameters were calculated and compared. Our results indicate that the chromatographic resolution in the miniaturized channel is lower, whereas significantly shorter analyses time and less solvent consumption were obtained. Moreover, the limit of detection (LOD) and limit of quantification (LOQ) obtained from hyphenation with a UV-detector are obviously lower than in a conventional channel, which makes the miniaturized channel interesting for trace analysis.

Graphical Abstract

1. Introduction

Nowadays, nanoparticles are playing an increasingly important role in our daily lives. By definition, they are microscopic particles with at least one dimension less than 100 nm [1]. Different nanoparticles have been developed for commercial applications. For example, silver nanoparticles are used in textiles, fridges or washing machines, due to their antibacterial properties [2]. Titanium dioxide nanoparticles are used in sunscreens in order to achieve a better protection from UV radiation, and in hydraulic fracturing fluids for oil recovery [3]. Since data on toxicity are barely available, their increasing application in cosmetic products, food and their release in the environment might cause severe problems. For example, some data indicate that fullerene nanoparticles may trigger extensive brain damage to fish [4]. Others reported the release of reactive oxygen species by titanium dioxide nanoparticles causing an immediate “oxidative burst” response in microglia, but also interferences with the mitochondrial energy production [5]. Thus, an accurate separation, identification and characterization of nanoparticles becomes increasingly important.
A common method for nanoparticle separation, which was introduced in 1976 by Giddings, represents field-flow fractionation (FFF) [6,7]. Since FFF is a flow-based separation methodology utilizing an open separation channel, the typically obtained blocking of columns, when separating particulate analytes, is avoided. FFF techniques can be applied to particles over a wide size range. The retention and separation in FFF is caused by an external field. Depending on the applied field, FFF can be classified into different types, like Thermal Field-Flow Fractionation (ThF3), Centrifugal Field-Flow Fractionation (CF3), Flow Field-Flow Fractionation (F4) and others. Amongst them, the Asymmetrical Flow Field-Flow Fractionation (AF4) represents one of the most universal FFF techniques [7]. Initially, AF4 was used for the analysis of gelatine nanoparticles in drug carrier systems [8,9]. Afterwards, various groups reported its use for the separation of gold nanoparticle mixtures [10,11]. With this regard, the method development, applicability and limitations was investigated in a multi-detector approach. Gray et al. compared the separation of gold nanoparticles in the AF4 with Hydrodynamic Chromatography (HDC). The detection limits, resolution, and recoveries for both techniques were determined. The AF4 method showed a significantly more enhanced resolution than HDC, but also revealed lower recovery rates [12]. Another problem arises from difficulties of separating nanoparticles from various organic matrices, like food or environmental samples [11,13,14,15]. Since the number of nanoparticles in those matrices is low, high recovery rates are essential. AF4 has been shown to be an efficient method to separate nanoparticles in such organic matrices and has been used to separate nanoparticles in chicken meat [16], seawater [17], river water [18] and soil [19]. However, the application of AF4 in the routine analysis has been limited, amongst others, due to the large size of the separation channel, which results in long analysis time and excessive sample and solvent consumption. The miniaturization of the channel size represents one possibility to reduce the aforementioned channel specific effects. By reducing the conventional channel dimensions, the sample and solvent demand will consequently be reduced and the separation speed can be increased without changing the migration flow rate.
The first attempt of channel miniaturization was reported by Kang and Moon in 2004. In this work, a miniaturized AF4 channel with inlet frit was constructed and tested for its applicability for protein separation [20]. Afterwards, a miniaturized AF4 channel without inlet frit was introduced by Riekkola et al. in 2006. It was demonstrated that this miniaturized channel was suitable for protein standard separation and was comparable to the conventional channel [21]. In 2011, Kim et al. developed a new chip-type AF4 channel design, which was assembled by stacking multilayers of thin stainless steel plates and a frit. The influence of the channel length was examined with the separation of protein standards by changing the flow rate [22]. Recently, Müller et al. developed a new miniaturized AF4 channel for wide application and characterized its separation performance using nanoparticles [23]. These investigations showed that, with a miniaturized channel, elution time and sample/solvent consumption can be substantially reduced. However, a systematic approach in order to comprehensively characterize the performance of a miniaturized channel including the development of standard separation methods and the investigation of critical parameters such as recovery rates, limit of detection (LOD) and limit of quantification (LOQ) has not yet been reported. In this paper, standard separation methods for a conventional and a miniaturized channel were developed both using organic (polymer) and inorganic nanoparticles. Corresponding chromatographic parameters were calculated and compared, and both advantages and disadvantages of the miniaturized channel were discussed.

2. Materials and Methods

Carboxyl-stabilized polystyrene nanoparticle standards with average diameters of 50, 100 and 400 nm (PPs-0.05 COOH, PPs-0.1 COOH and PPs-0.4 COOH) were purchased from Kisker Biotech GmbH & Co. KG (Steinfurt, Germany). Gold nanoparticle standards with certified diameter of 13.5 ± 0.1 nm, 28.6 ± 0.9 nm and 56.6 ± 1.4 nm were purchased from the National Institute of Standards and Technology (NIST, Gaithersburg, MD, USA). Size distributions are based on dynamical light scattering measurements. Prior to the analysis, all suspensions were diluted to suitable concentrations with filtrated ultrapure water (Whatman cellulose ester membrane, 0.1 µm pore size, Sigma-Aldrich Chemie GmbH, Taufkirchen, Germany; MilliQ, Billerica, MA, USA). Nanoparticle mixtures were prepared by adding the corresponding volume of each individual nanoparticle solutions (v/v), which were sonicated (10 min) before use. For the separation of the polystyrene nanoparticles, filtrated ultrapure water containing 0.1% sodium dodecylsulfate (SDS, AppliChem GmbH, Darmstadt, Germany) and 0.01% sodium azide (Sigma-Aldrich Chemie GmbH, Taufkirchen, Germany) was used. The eluent for the analysis of the gold nanoparticles consisted of filtrated ultrapure water containing 0.01% sodium azide.
All measurements were performed using an AF2000 system (Postnova Analytics GmbH, Landsberg am Lech, Germany) equipped with an ultraviolet (UV) (PN3211) and a 21-angle multi-angle laser light scattering (MALS) (PN3621) detector. UV detection was performed at 280 nm for the polystyrene and at 530 nm for the gold nanoparticles. The AF2000 control unit software was used for the data acquisition and evaluation. The dimension of the conventional AF4 channel was 33.5 cm × 6 cm, which results in an effective separation area of 32.8 cm2. A spacer of 350 µm was used for all measurements. The miniaturized AF4 channel was similar in its asymmetric design to the conventional AF4 channel, but showed reduced dimensions of 8 cm × 2 cm. The spacer used in the miniaturized AF4 channel was also 350 µm. Hence, the effective separation area of 4.3 cm2 was eight times smaller than that of the conventional channel. Polyether sulfone (PES) and regenerated cellulose (RC) membranes with an exclusion limit of 10 kDa (Postnova Analytics GmbH, Landsberg am Lech, Germany) were used in both channels. The injection volume was 20 µL. AF 2000 Control (2.0.0.1) was used for recording and the evaluation of data.
Using the Rayleigh ratio and the obtained analyte concentration, the gyration radius Rg of the analyte can be determined using the Zimm equation [24]. Details are given in the Supplementary Information.

3. Results and Discussion

In order to theoretically describe the separation performance of the AF4 channels, different chromatographic parameters were determined and compared, e.g., retention ratio (R), resolution (Rs) and theoretical plate numbers (N). The retention ratio describes the retention of an analyte zone caused by the external field. It can be calculated using Equation (1):
R = t M t R
with R—retention ratio, tR—retention time and tM—void time.
The resolution Rs (see Equation (2)) is used to describe how well two peaks are separated from each other. At Rs ≥ 1.5 the area or height of two adjacent peaks can be accurately measured, which means that particles are sufficiently well baseline-separated.
R S = 2 ( t R 2 t R 1 ) w 1 w 2
with Rs—resolution, tR—retention time, w— peak width.
The plate number N determines the number of theoretical plates, which indicates the separation efficiency. The higher the plate number, the better the separation efficiency will be. The plate number N was calculated with Equation (3):
N = 16   ( t R w ) 2
with N—plate number, tR—retention time, w—peak width.
Since an adsorption of particles onto the membrane surface, especially at higher cross flow rates, may not be excluded, the recovery rate represents another important parameter that has to be considered. Hereby, the UV-Vis detector signal was used, which is proportional to the particle amount. Initially, particles were injected at a constant detector flow rate without cross and focus flow. Under these conditions the sample elutes without being affected by any separation force and virtually any membrane interaction. For reproducibility reasons, five injections were performed successively. As described in Equation (4), the recovery rate can be easily calculated from the ratio of the peak areas determined either with or without cross/focus flow.
R e = x 1 x 2
with Re—recovery rate, x1—peak area determined with cross/focus flow, x2—peak area determined without cross/focus flow.

3.1. Separation of Polystyrene Nanoparticles

Our investigations started with the optimization of separation conditions for polystyrene (PS) nanoparticles in a conventional AF4 channel. A polystyrene nanoparticles standard mixture was used for the separation (50 nm, 0.80 mg·mL−1; 100 nm, 0.16 mg·mL−1 and 400 nm, 0.04 mg·mL−1). Several parameters were considered: the cross flow, the elution exponent and the injection time. The cross flow is the part of the main or channel flow that passes the membrane perpendicular to the channel flow. It represents the main force that is responsible for the separation. The elution exponent characterizes the rate at which the cross flow decreases. It can be described by Equation (5):
V x ( t ) = V x , i V x , i V x , f ( t f t i ) n   ( t t i ) n
with Vx(t)—cross flow at given time, Vx,i—initial cross flow, Vx,f—final cross flow, ti—start time of cross flow, tf—end time of crossflow, n—elution exponent.
Since a constant (high) cross flow would result in long retention times mainly of larger particles, a decrease of the separation force during the elution has to be enabled. In our experiments, different cross flow rates and elution exponents were applied. Moreover, the injection time was varied. This parameter plays an important role. Particles need sufficient time to get equilibrated while focusing in the injection zone, whereas too long injection times are supposed to induce aggregation or at least agglomeration.
By means of these parameters, summarized in Table 1, Table 2 and Table 3, a better description of the separation performance of the AF4 system can be given. The results in Table 1 indicate that the highest channel resolution can be achieved at higher cross flows. However, at these conditions the lowest recovery rates were obtained, which might be attributed to an adsorption of nanoparticles on the membrane and/or by irreversible diffusion into membrane pores. Simultaneously, the time for an analysis increases up to 60 min. Lower cross flow rates (e.g., 1.0 mL·min−1) significantly increase the recovery rates to above 90%, but on the other hand decrease peak resolution. As shown in Table 2 and Table 3, the influence of the elution exponent and the injection time on the separation parameters is comparatively small. To keep the resolution and recovery rates sufficiently high, the following standard separation method for the conventional channel was used: cross flow 2.5 mL·min−1, injection time 4 min, elution exponent 0.2, total elution time 60 min.
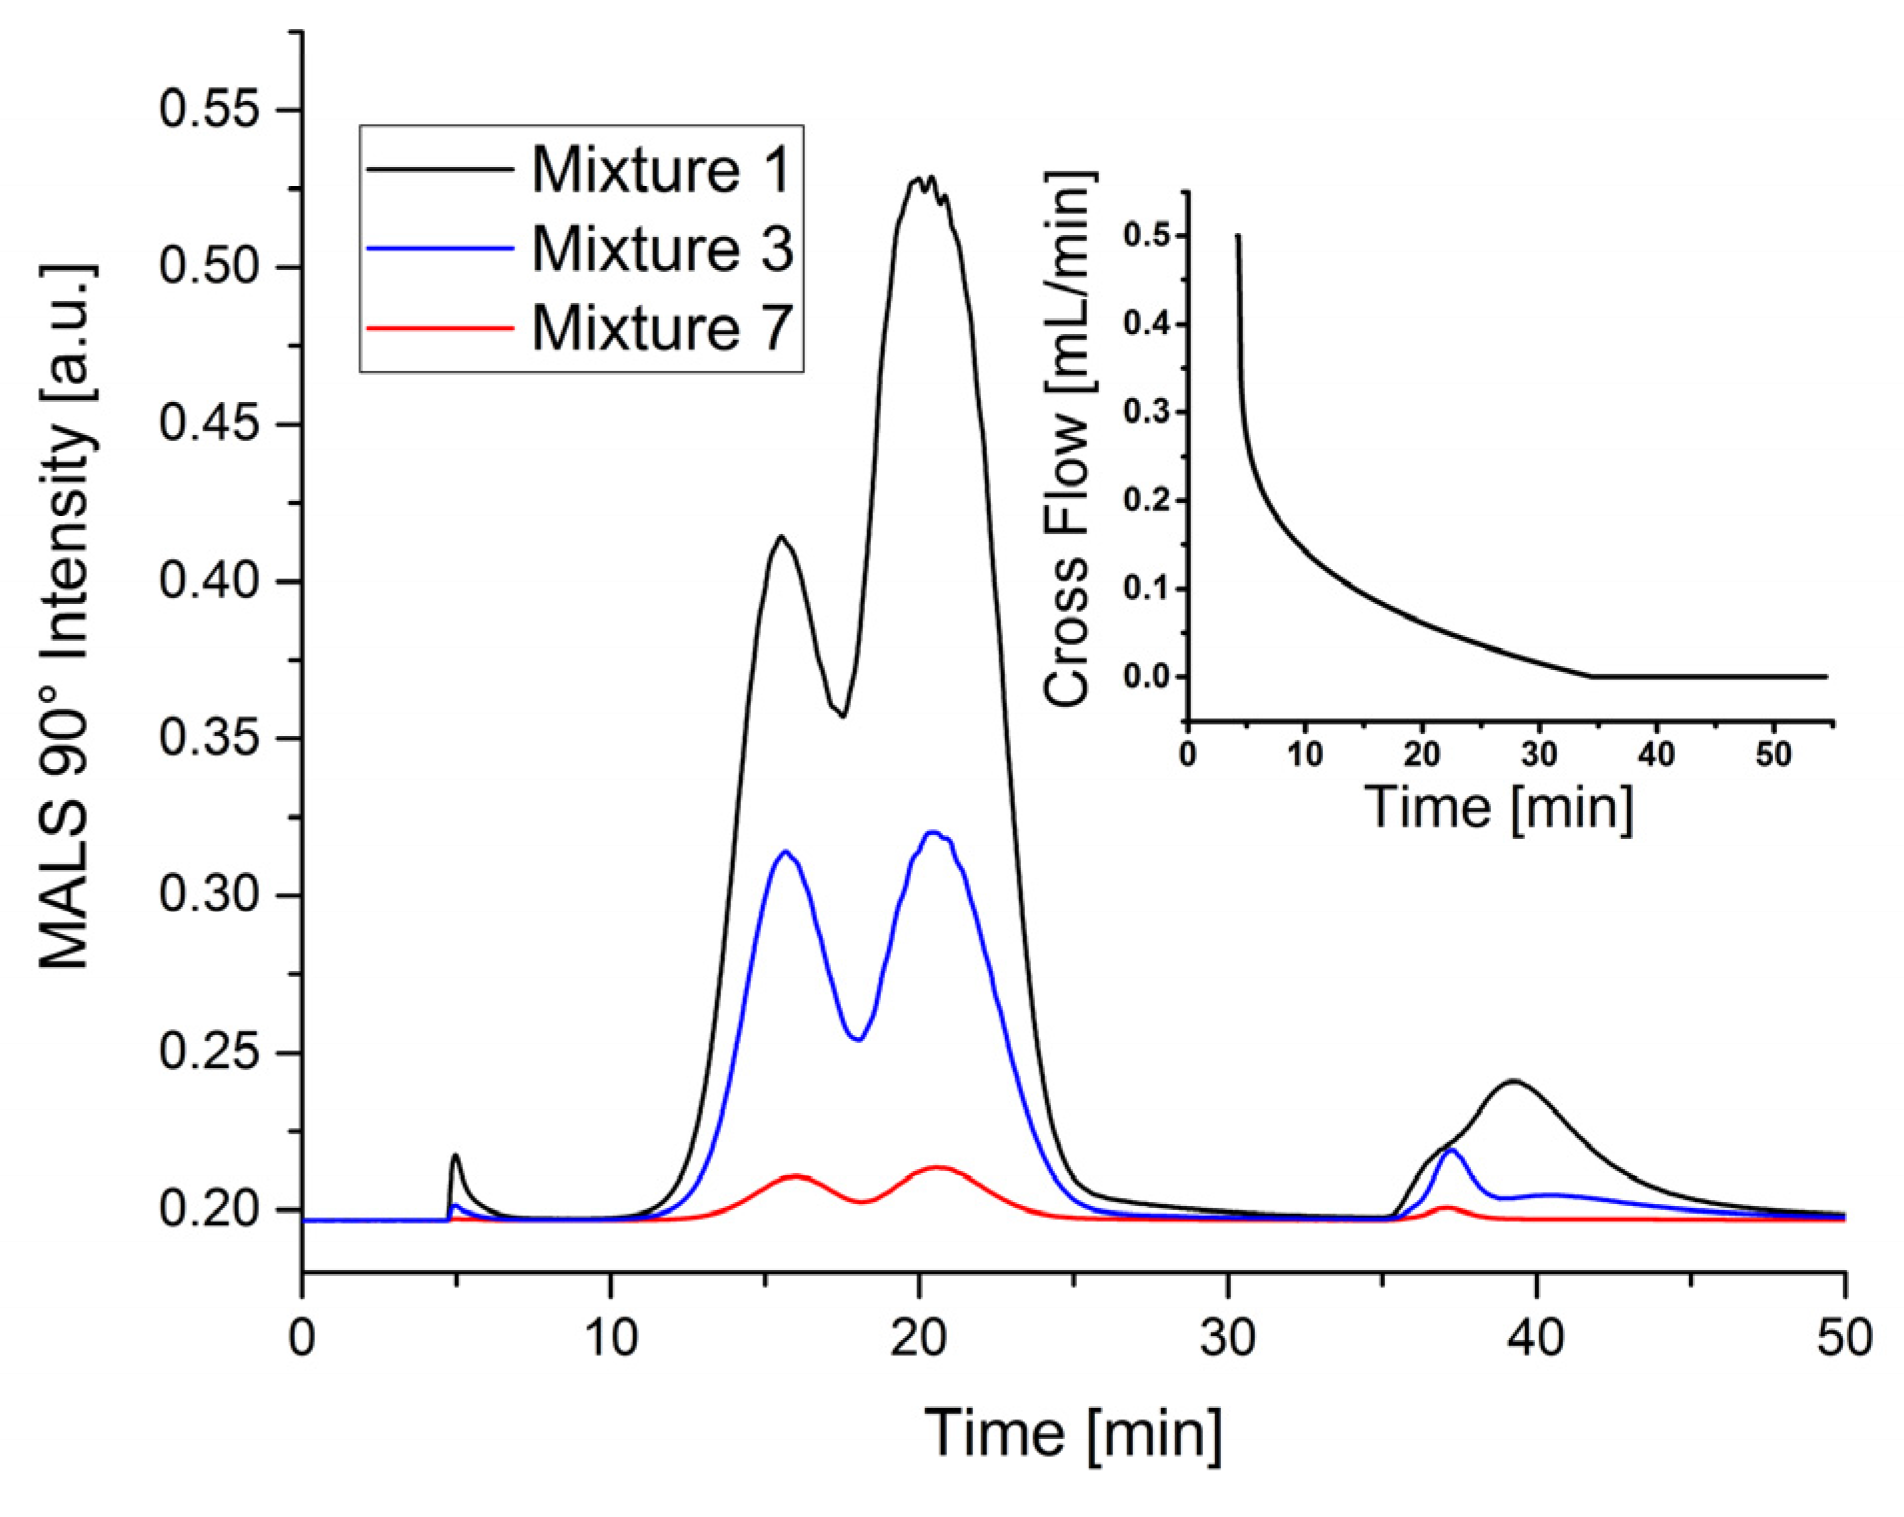
In order to evaluate the suitability of a miniaturized channel design to separate nanoparticle mixtures, an optimization on the basis of available literature was performed. Since the miniaturized channel was expected to be very sensitive to overloading, suitable particle concentrations had to be found first. Therefore, different mixtures of three polystyrene nanoparticles with a size of 50, 100 and 400 nm were applied for separation under the following conditions: cross flow 0.5 mL·min−1, injection time 4 min, elution exponent 0.2. The results of the calculation of the separation parameters are listed in Table 4. Three representative fractograms are shown in Figure 1. In particular, the measurement performed with latex mixture 1 reveals both a low resolution and a low plate number compared to other measurement data, and clearly shows that the amount of particles has a pronounced influence on the fractograms, when a critical limit is exceeded.
Overloading might also be one reason for the long tailing of 400 nm particles (Figure 1 at 40 min). Since the radius of gyration Rg of this peak determined by a MALS detector is around 155 nm corresponding to a geometric diameter of 400 nm, when assuming a spherical shape, this tailing cannot be attributed to agglomerates (see Figure S1 in Supplementary Information). The measurements performed with latex mixture 3 (mixture used for the conventional channel) and 7 (blue and red lines in Figure 1) were less influenced by overloading than it could be seen for mixture 1. As a result, the peak at 37 min is only slightly deformed. Similar effects are revealed considering the plate number. Overloading drastically reduces the number of theoretical plates. Thus, to achieve better separation efficiency using the miniaturized AF4 channel, measurements have to be performed with considerably lower particle concentrations. The difference of the concentration between mixture 3 and 7 also correlates with the significantly smaller separation area of the miniaturized channel.
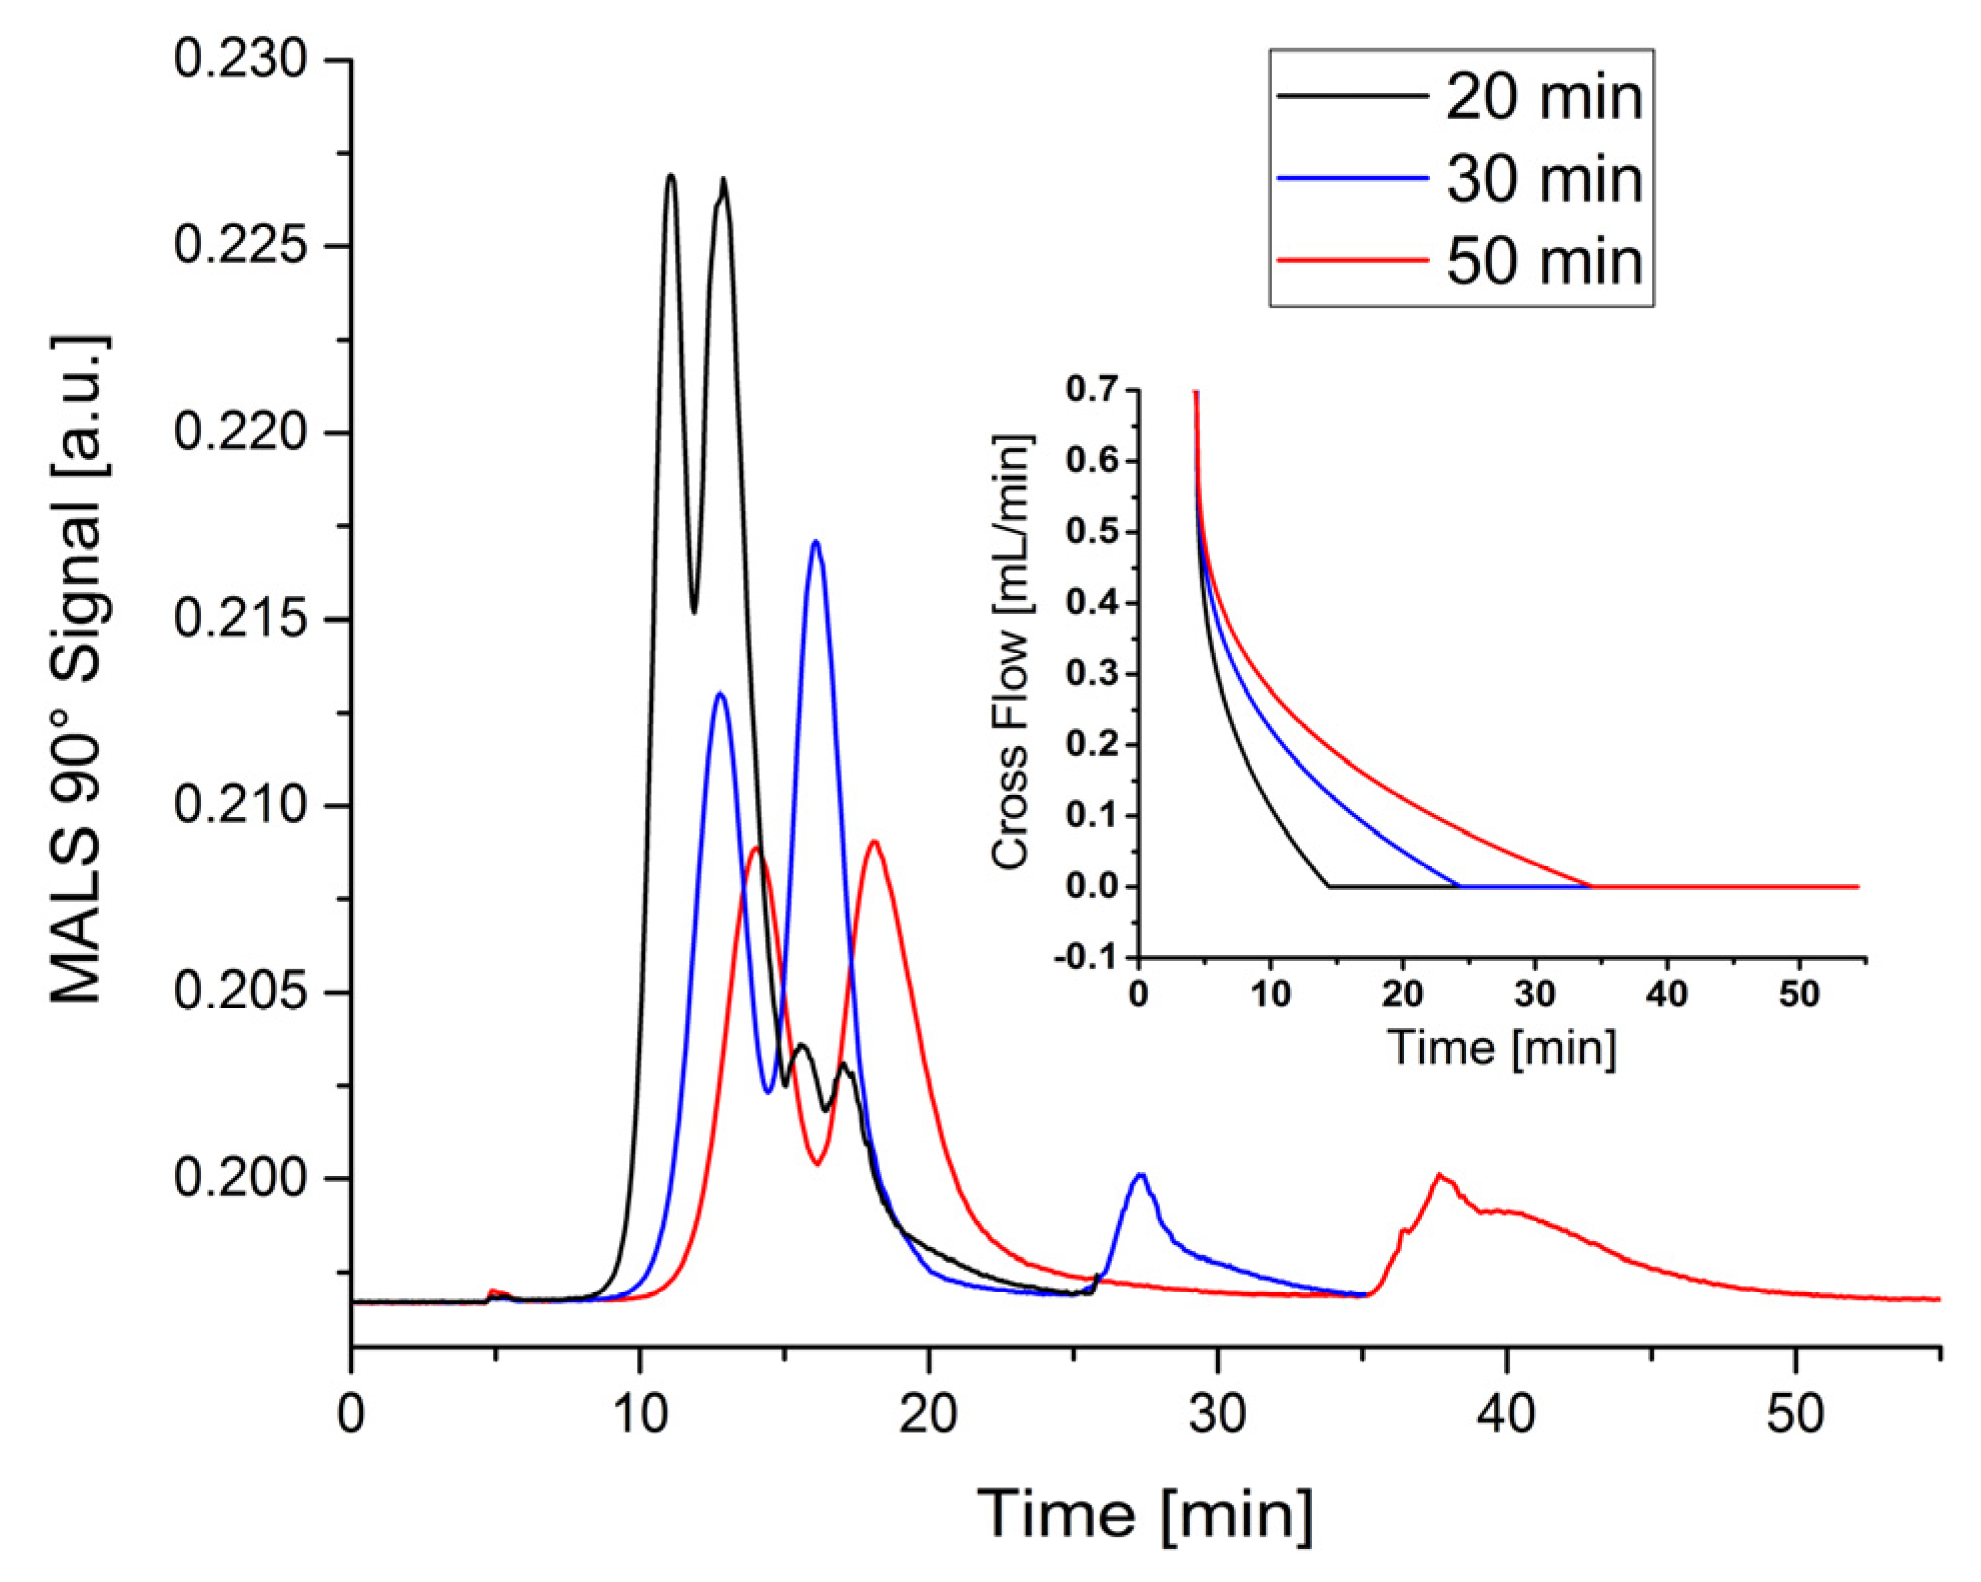
Therefore, mixture 7 was used for the separation in the miniaturized channel. One major advantage of this channel was supposed to be a significantly shorter analysis time accompanied by less solvent consumption. Thus, the whole elution process was improved based on the previously determined chromatographic parameters. The procedure consisted of three steps. In the first step, the cross flow remained constant for 0.2 min, while the focus flow was gradually reduced to zero mL·min−1. This was followed by a decrease of the cross flow to zero mL·min−1 simultaneously with the elution progress. During this step, the 50 nm and 100 nm particles eluted. The ‘no cross flow’ conditions were kept constant for additional 10 min in order to ensure that the 400 nm particles can elute completely (see insert in Figure 2). In other words, the time of the second elution step was varied, whereas both the elution exponent (0.3), and the cross flow (0.7 mL·min−1) were kept constant for all measurements. The obtained fractograms are shown in Figure 2 and the corresponding chromatographic parameters are listed in Table 5. The results show that with shorter elution time the retention ratio increases, which indicates that particles elute faster. However, it can be simultaneously observed that the resolution and the plate number decrease with decreasing elution times. These assumptions are supported by Figure 2, where the peaks of the 50 nm and 100 nm particles can hardly be separated using an elution time of 20 min. In order to perform the separation reasonably fast and to keep the resolution high, a total elution step of 30 minutes was supposed to be the best value for the separation of latex mixtures in a miniaturized channel.
From our previous data (Table 3), it was concluded that the injection time does not have much influence on the separation. Thus, only the cross flow rates and the elution exponent were further optimized. Finally, a standard separation method was obtained using the miniaturized channel (cross flow 0.7 mL·min−1, injection time 4 min, elution exponent 0.3, total elution time 30 min).
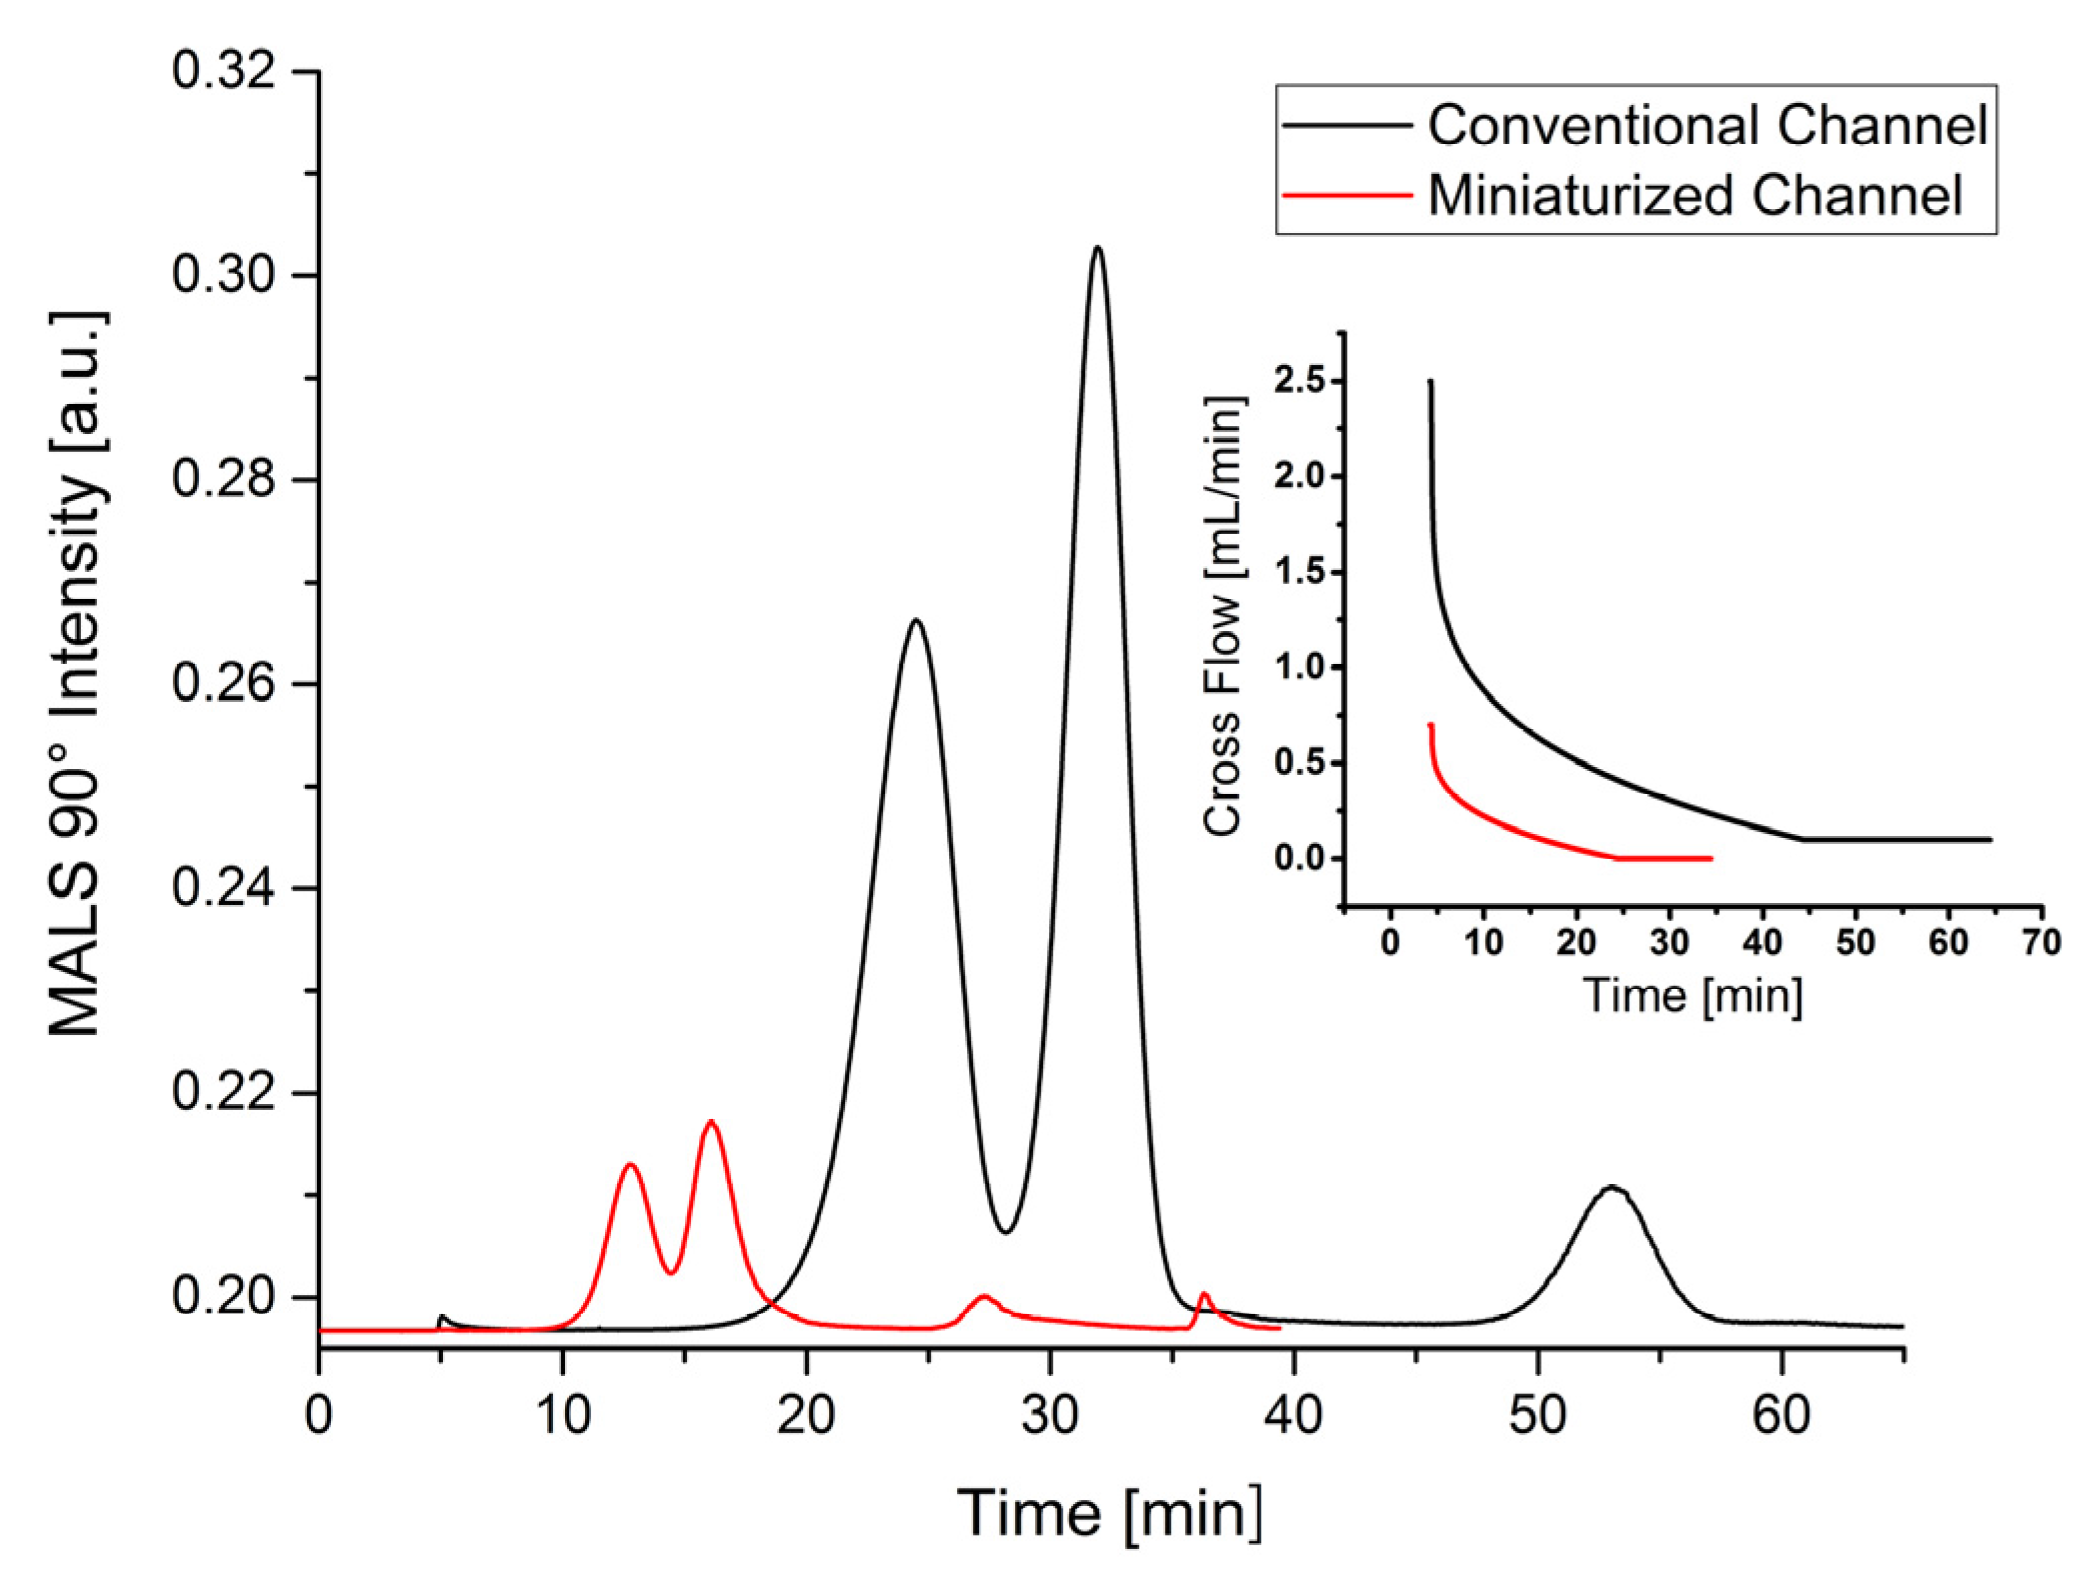
The chromatographic parameters and fractograms obtained with both standard separation methods are compared in Table 6 and Figure 3. It can be shown that both elution times (60 min to 30 min) and solvent consumption (from 71.5 mL to 21 mL) can be reduced to at least 50%. This is accompanied by a significantly reduced sample consumption of approximately 87.5%. The chromatographic data also reveal that after minor optimization polystyrene nanoparticles can be almost baseline separated using the conventional channel (Rs = 1.2). Simultaneously, the recovery rate is between 70%–90%. Using a miniaturized channel, the peak resolution is significantly lower (−28%), which might result from the shorter elution process. The recovery rates obtained with a miniaturized channel were also lower as with a conventional channel.
The reproducibility of channel membranes was checked by comparative measurements of polystyrene nanoparticle mixture 7 performed by triplicate runs on one 10 kDa Polyether sulfone (PES) membrane and between three 10 kDa PES membranes (see Supplementary Information, Figure S2). These results clearly show a high reproducibility of repetitive measurements both in the conventional and the miniaturized channel. In contrast to that, the comparison of measurements performed on different membranes shows a shift of retention times of smaller NPs, whereas their peak resolution remains almost constant (see Supplementary Information, Table S1). Moreover, the separation of larger NPs also seems to be affected, since one experiment shows a strong tailing at 40 min retention time. In this particular case, there might obviously be a quality issue regarding the membrane material. In the production process, membranes might have ‘micro-crevices’ on their surface, which can trap the nanoparticles and prolong the retention time [25]. Moreover, compression of the membrane and the spacer can result in different effective channel thicknesses, which can change retention times accordingly [22].

3.2. Separation of Gold Nanoparticles

The previously chosen conditions (cross flow 2.0 mL·min−1, injection time 6 min, elution exponent 0.2) were checked for their suitability to separate a gold nanoparticle mixture (I) containing particles with three different sizes (10 nm, 17.2 µg·mL−1; 30 nm, 16.08 µg·mL−1 and 60 nm, 17.28 µg·mL−1) in a conventional channel. The fractogram is shown in Figure 4 (black line). The calculated separation parameters are listed in 
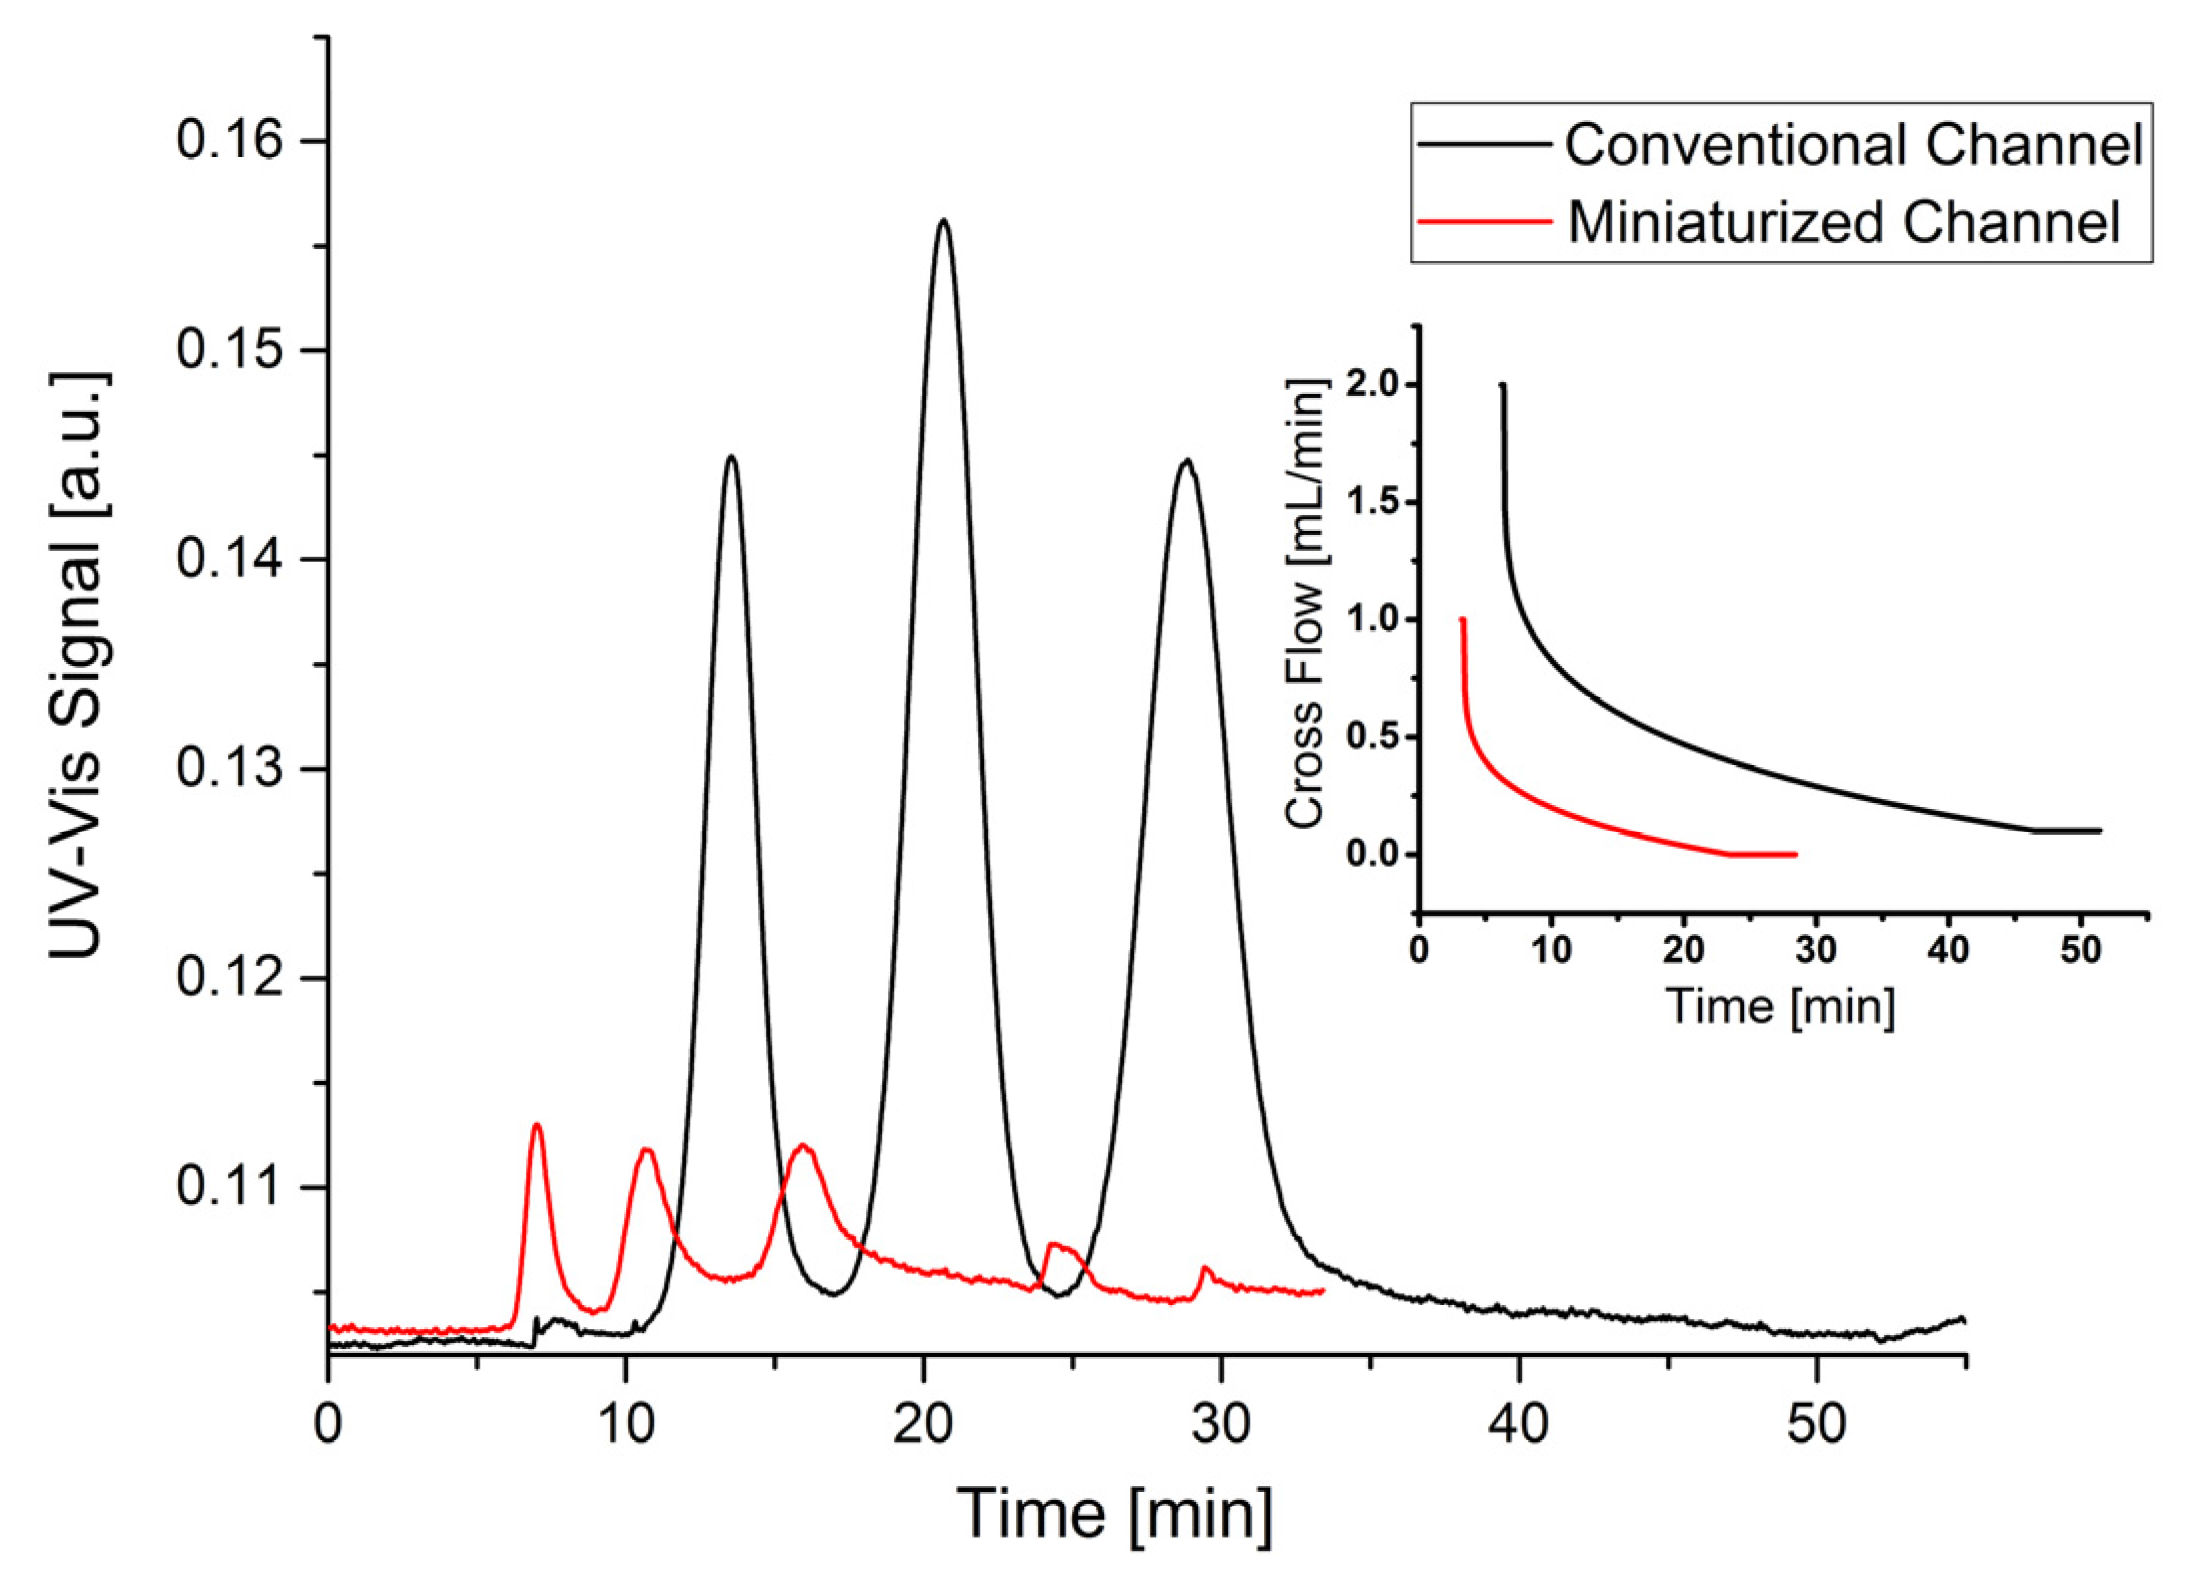
Table 7. It can be seen that the gold nanoparticle mixture can be almost baseline separated. The recovery rates of the particles are between 70%–80%, whereby the value for the 60 nm particles is slightly lower than those of the smaller particles. A possible reason might be that the larger particles could be compressed closer to the membrane, because of the weaker diffusion force that retracts particles from the membrane throughout the elution. Therefore, the unwanted interaction between 60 nm particles and the membrane might also be slightly stronger. The retention times are comparable to those of the polystyrene latex particles (28.7 min for 60 nm Au and 24.6 min for 50 nm PS). These results also indicate that after some minor optimization both polystyrene and gold nanoparticle mixtures could be almost baseline separated using a conventional AF4 channel. The major drawback, however, is the long analysis time of 50–60 min accompanied by a comparatively large solvent consumption of more than 60 mL per analysis.
These optimized conditions (cross flow 1.0 mL·min−1, injection time 3 min, elution exponent 0.2) were used for the separation of a gold nanoparticle mixture in a miniaturized channel. For this purpose the gold nanoparticle mixture I was diluted (1:8 v:v), which resulted in the following nanoparticle concentrations: 10 nm, 2.15 µg·mL−1; 30 nm, 2.01 µg·mL−1 and 60 nm, 2.16 µg·mL−1 (gold nanoparticle mixture (II)). The fractogram is shown in Figure 4 (red line). As already shown for the polystyrene latex particles, the separation of gold nanoparticles in the miniaturized channel proceeded much faster. However, it can also be seen from the data in Table 7 that the peak resolution and the recovery rates of the miniaturized channel are lower than those of the conventional channel. A possible reason could be the comparatively high cross flow, which on the one hand improves the resolution, but on the other hand may induce agglomeration of particles. This assumption is supported by additional peaks at 25 min (see Figure 4). The calculated radius of gyration (Rg) was in a range from 40.2 to 87.4 nm, which corresponds to diameters of agglomerates from 103.7 to 225.5 nm. In order to exclude any additional contribution from plasmon resonance, the AF4-UV-Vis-MALS system was calibrated and normalized with certificated 10, 30 and 60 nm NIST Au nanoparticles before (calibration curve, see Figure S3 in Supplementary Information).
The limit of detection (LOD) and limit of quantification (LOQ) of gold nanoparticles in a conventional and a miniaturized channel were determined by measuring the signal to noise ratio (S/N) of the UV-Vis signals. For this purpose, the concentration of gold nanoparticles was diluted stepwise and applied for separation with the standard method. The concentrations at which the S/N ratios are equal to 3 and 10, respectively, were defined as LOD and LOQ. Since standard NIST gold nanoparticles were measured, the corresponding particle concentration can be calculated according to their certified particle size. The obtained LOD and LOQ for both channels are listed in Table 8. An example fractogram of LOD and LOQ determination is shown in Figure S4 in Supplementary Information.
Our results indicate that the LOD and LOQ obtained with a miniaturized channel are nearly 50% lower than those of a conventional channel. The peak width obtained using a miniaturized channel is narrower, which causes particles to pass the detector cell within a shorter time span. This results in a higher concentration in a certain time, which increases the S/N ratio.

4. Conclusions

In the current study, the separation performances of a conventional and a miniaturized AF4 channel were compared using polystyrene and gold nanoparticle mixtures. Standard separation methods for both channels were developed by variation of various separation parameters, such as cross flow, injection time and elution exponent. The corresponding chromatographic parameters, e.g., resolution, recovery rate, LOD and LOQ, were calculated. Compared to a conventional channel, the elution times and solvent consumption in a miniaturized channel could be reduced by at least 50%, whereas the sample consumption decreased by 87.5%. Since the limit of detection (LOD) and quantification (LOQ) obtained using the miniaturized channel could be at least halved in comparison to the conventional channel, the possibility for trace analysis of particles with low concentration is offered. On the other hand, the above-mentioned improvements in terms of solvent and sample consumptions as well as reduced analysis times are partially at the expense of a lower peak resolution. Overall, the miniaturized AF4 channel has the potential to be used in routine analysis, where a high peak resolution is not necessary and cheaper operational costs are advantageous. Moreover, it can be used as an efficient pre-treatment method, e.g., in two-dimensional separation approaches. Since the miniaturized AF4 channel shows lower LOD and LOQ, it might also be suitable for trace analysis, e.g., of particles in environmental matrices.

Supplementary Materials

The following are available online at https://www.mdpi.com/2297-8739/4/1/8/s1.

Acknowledgments

The authors would like to thank the Federal Institute for Materials Research and Testing for financial and Postnova Analytics GmbH for technical support.

Author Contributions

Z.Y., F.M. and S.W. conceived and designed the experiments; Z.Y. performed the experiments and analyzed the data; F.M. contributed the miniaturized channel; Z.Y. and S.W. wrote the paper.

Conflicts of Interest

The authors declare no conflict of interest. The founding sponsors had no role in the design of the study; in the collection, analyses, or interpretation of data; in the writing of the manuscript, and in the decision to publish the results.

References

  1. McNaught, A.D.; Wilkinson, A. IUPAC. Compendium of Chemical Terminology, 2nd ed.; the “Gold Book”; Blackwell Scientific Publications: Oxford, UK, 1997. [Google Scholar]
  2. Chen, X.; Schluesener, H.J. Nanosilver: A nanoproduct in medical application. Toxicol. Lett. 2008, 176, 1–12. [Google Scholar] [CrossRef] [PubMed]
  3. Hurnaus, T.; Plank, J. Behavior of titania nanoparticles in cross-linking hydroxypropyl guar used in hydraulic fracturing fluids for oil recovery. Energy Fuel 2015, 29, 3601–3608. [Google Scholar] [CrossRef]
  4. Oberdorster, G.; Oberdorster, E.; Oberdorster, J. Nanotoxicology: An emerging discipline evolving from studies of ultrafine particles. Environ. Health Perspect. 2005, 113, 823–839. [Google Scholar] [CrossRef] [PubMed]
  5. Long, T.C.; Saleh, N.; Tilton, R.D.; Lowry, G.V.; Veronesi, B. Titanium dioxide (P25) produces reactive oxygen species in immortalized brain microglia (BV2): Implications for nanoparticle neurotoxicity. Environ. Sci. Technol. 2006, 40, 4346–4352. [Google Scholar] [CrossRef] [PubMed]
  6. Giddings, J.C.; Yang, F.J.F.; Myers, M.N. Flow field-flow fractionation—Versatile new separation method. Science 1976, 193, 1244–1245. [Google Scholar] [CrossRef] [PubMed]
  7. Giddings, J.C. Field-flow fractionation—Analysis of macromolecular, colloidal, and particulate materials. Science 1993, 260, 1456–1465. [Google Scholar] [CrossRef] [PubMed]
  8. Fraunhofer, W.; Winter, G.; Coester, C. Asymmetrical flow field-flow fractionation and multiangle light scattering for analysis of gelatin nanoparticle drug carrier systems. Anal. Chem. 2004, 76, 1909–1920. [Google Scholar] [CrossRef] [PubMed]
  9. Zillies, J.C.; Zwiorek, K.; Winter, G.; Coester, C. Method for quantifying the pegylation of gelatin nanoparticle drug carrier systems using asymmetrical flow field-flow fractionation and refractive index detection. Anal. Chem. 2007, 79, 4574–4580. [Google Scholar] [CrossRef] [PubMed]
  10. Calzolai, L.; Gilliland, D.; Garcia, C.P.; Rossi, F. Separation and characterization of gold nanoparticle mixtures by flow-field-flow fractionation. J. Chromatogr. A 2011, 1218, 4234–4239. [Google Scholar] [CrossRef] [PubMed]
  11. Hagendorfer, H.; Kaegi, R.; Traber, J.; Mertens, S.F.L.; Scherrers, R.; Ludwig, C.; Ulrich, A. Application of an asymmetric flow field flow fractionation multi-detector approach for metallic engineered nanoparticle characterization—Prospects and limitations demonstrated on au nanoparticles. Anal. Chim. Acta 2011, 706, 367–378. [Google Scholar] [CrossRef] [PubMed]
  12. Gray, E.P.; Bruton, T.A.; Higgins, C.P.; Halden, R.U.; Westerhoff, P.; Ranville, J.F. Analysis of gold nanoparticle mixtures: A comparison of hydrodynamic chromatography (HDC) and asymmetrical flow field-flow fractionation (AF4) coupled to ICP-MS. J. Anal. At. Spectrom. 2012, 27, 1532–1539. [Google Scholar] [CrossRef]
  13. Baalousha, M.; Stolpe, B.; Lead, J.R. Flow field-flow fractionation for the analysis and characterization of natural colloids and manufactured nanoparticles in environmental systems: A critical review. J. Chromatogr. A 2011, 1218, 4078–4103. [Google Scholar] [CrossRef] [PubMed]
  14. Schmidt, B.; Loeschner, K.; Hadrup, N.; Mortensen, A.; Sloth, J.J.; Koch, C.B.; Larsen, E.H. Quantitative characterization of gold nanoparticles by field-flow fractionation coupled online with light scattering detection and inductively coupled plasma mass spectrometry. Anal. Chem. 2011, 83, 2461–2468. [Google Scholar] [CrossRef] [PubMed] [Green Version]
  15. Laborda, F.; Ruiz-Begueria, S.; Bolea, E.; Castillo, J.R. Study of the size-based environmental availability of metals associated to natural organic matter by stable isotope exchange and quadrupole inductively coupled plasma mass spectrometry coupled to asymmetrical flow field flow fractionation. J. Chromatogr. A 2011, 1218, 4199–4205. [Google Scholar] [CrossRef] [PubMed]
  16. Loeschner, K.; Navratilova, J.; Kobler, C.; Molhave, K.; Wagner, S.; von der Kammer, F.; Larsen, E.H. Detection and characterization of silver nanoparticles in chicken meat by asymmetric flow field flow fractionation with detection by conventional or single particle ICP-MS. Anal. Bioanal. Chem. 2013, 405, 8185–8195. [Google Scholar] [CrossRef] [PubMed] [Green Version]
  17. Hassellov, M. Relative molar mass distributions of chromophoric colloidal organic matter in coastal seawater determined by flow field-flow fractionation with uv absorbance and fluorescence detection. Mar. Chem. 2005, 94, 111–123. [Google Scholar] [CrossRef]
  18. Baalousha, M.; Kammer, F.V.D.; Motelica-Heino, M.; Hilal, H.S.; Le Coustumer, P. Size fractionation and characterization of natural colloids by flow-field flow fractionation coupled to multi-angle laser light scattering. J. Chromatogr. A 2006, 1104, 272–281. [Google Scholar] [CrossRef] [PubMed]
  19. Dubascoux, S.; Von Der Kammer, F.; Le Hecho, I.; Gautier, M.P.; Lespes, G. Optimisation of asymmetrical flow field flow fractionation for environmental nanoparticles separation. J. Chromatogr. A 2008, 1206, 160–165. [Google Scholar] [CrossRef] [PubMed]
  20. Kang, D.J.; Moon, M.H. Miniaturization of frit inlet asymmetrical flow field-flow fractionation. Anal. Chem. 2004, 76, 3851–3855. [Google Scholar] [CrossRef] [PubMed]
  21. Yohannes, G.; Sneck, M.; Varjo, S.J.; Jussila, M.; Wiedmer, S.K.; Kovanen, P.T.; Oorni, K.; Riekkola, M.L. Miniaturization of asymmetrical flow field-flow fractionation and application to studies on lipoprotein aggregation and fusion. Anal. Biochem. 2006, 354, 255–265. [Google Scholar] [CrossRef] [PubMed]
  22. Kim, K.H.; Moon, M.H. Chip-type asymmetrical flow field-flow fractionation channel coupled with mass spectrometry for top-down protein identification. Anal. Chem. 2011, 83, 8652–8658. [Google Scholar] [CrossRef] [PubMed]
  23. Muller, D.; Cattaneo, S.; Meier, F.; Welz, R.; de Mello, A.J. Nanoparticle separation with a miniaturized asymmetrical flow field-flow fractionation cartridge. Front. Chem. 2015, 3, 45. [Google Scholar] [CrossRef] [PubMed]
  24. Zimm, B.H. The dependence of the scattering of light on angle and concentration in linear polymer solutions. J. Phys. Colloid Chem. 1948, 52, 260–267. [Google Scholar] [PubMed]
  25. Kirkland, J.J.; Dilks, C.H.; Rementer, S.W.; Yau, W.W. Asymmetric-channel flow field-flow fractionation with exponential force-field programming. J. Chromatogr. 1992, 593, 339–355. [Google Scholar] [CrossRef]
Figure 1. Fractograms of polystyrene nanoparticle mixtures (50, 100 and 400 nm) with three different particle concentrations (see Table 4) using the miniaturized channel. Insert shows cross flow profile, MALS 90° detector.
Separations 04 00008 g001
Figure 2. Fractograms of polystyrene nanoparticle mixture 7 (see Table 4) recorded at different elution times using the miniaturized channel. Insert shows cross flow profiles, MALS 90° detector.
Separations 04 00008 g002
Figure 3. Comparison of fractograms of mixtures of polystyrene nanoparticles in a conventional (black line, mixture 3, Table 4) and a miniaturized AF4 channel (red line, mixture 7, Table 4, sample dilution 1:8) at previously optimized conditions. Insert shows cross flow profile, MALS 90° detector.
Separations 04 00008 g003
Figure 4. Comparison of fractograms of mixtures of gold nanoparticles in a conventional (black line, gold nanoparticle mixture I) and a miniaturized AF4 channel (red line, gold nanoparticlemixture II, sample dilution 1:8) at previously optimized conditions. Insert shows cross flow profile, UV-Vis detector.
Separations 04 00008 g004
Table 1. Chromatographic parameters for the separation of a polystyrene nanoparticlemixture (50 nm, 0.80 mg·mL−1; 100 nm, 0.16 mg·mL−1 and 400 nm, 0.04 mg·mL−1) at different cross flows.
Cross Flow (mL·min−1)Retention Time tR50nmRetention Ratio R50nmResolution RsPlate Number N50nmRecovery Rate Re (%)
50 nm100 nm400 nm
0.513.50.370.3712.478.572.978.4
117.60.280.8148.085.992.695.1
1.520.90.241.0889.178.288.285.1
222.60.221.1396.373.481.284.2
2.524.40.201.18116.273.181.079.0
325.80.191.21152.469.479.480.0
3.527.50.181.2715467.277.277.3
Table 2. Chromatographic parameters for the separation of a polystyrene nanoparticle mixture (50 nm, 0.80 mg·mL−1; 100 nm, 0.16 mg·mL−1 and 400 nm, 0.04 mg·mL−1) at different elution exponents.
Elution ExponentRetention Time tR50nmRetention Ratio R50nmResolution RsPlate Number N50nmRecovery Rate Re (%)
50 nm100 nm400nm
0.222.60.201.18116.273.181.079.0
0.325.20.201.22126.372.780.485.1
0.426.60.181.22125.968.579.279.0
Table 3. Chromatographic parameters for the separation of a polystyrene nanoparticle mixture (50 nm, 0.80 mg·mL−1; 100 nm, 0.16 mg·mL−1 and 400 nm, 0.04 mg·mL−1) at different injection times.
Injection Time (min)Retention Time tR50nmRetention Ratio R50nmResolution RsPlate Number N50nmRecovery Rate Re (%)
50 nm100 nm400 nm
321.60.201.15114.271.378.877.4
422.60.201.18116.273.181.079.2
624.60.201.14118.972.780.180.0
826.60.201.17119.272.980.178.9
Table 4. Chromatographic parameters for the separation of mixtures of 50, 100 and 400 nm polystyrene nanoparticles with different particle concentrations.
Particle MixtureC50nmC100nm mg·mL−1C400nmRetention Time tR50nmRetention Ratio R50nmResolution RsPlate Number N50nm
11.60.480.0215.60.320.6436.6
21.20.320.0215.60.320.7250.8
30.80.160.0415.70.320.7350.1
40.40.080.0415.70.320.7987.4
50.20.040.0215.80.320.7390.0
60.20.040.0116.00.320.7594.3
70.10.020.0116.00.320.7996.3
80.10.020.00516.00.320.7695.7
Table 5. Chromatographic separation parameters at different elution times (single measurement).
Total Elution Time (min)Retention Time tR0nmRetention Ratio R50nmResolution RsPlate Number N50nm
5015.50.350.95117.4
3014.30.380.8668.4
2513.40.410.7554.1
2012.50.450.4851.8
Table 6. Comparison of chromatographic parameters of a polystyrene nanoparticle mixture obtained with both channels (single measurement).
Channel TypeParticle Diameter (nm)Retention Time tR (min)Retention Ratio RPlate Number NResolution RsRecovery Rate Re (%)
Conventional5024.40.20116.21.273.1
10031.90.16411.71.2/1.581.0
40052.90.10727.91.588.0
Miniaturized5012.50.3868.40.8663.5
10015.80.31152.70.86/1.579.8
40026.90.18514.41.582.4
Table 7. Comparison of chromatographic parameters of a gold nanoparticle mixture obtained with both channels (single measurement).
Channel TypeParticle Diameter (nm)Retention Time tR (min)Retention Ratio RPlate Number NResolution RsRecovery Rate Re(%)
Conventional1013.30.4552.61.5677.9
3020.50.30146.31.56/1.3980.9
6028.70.28200.31.3972.1
Miniaturized107.10.5945.51.2450.2
3011.60.36160.11.24/1.0448.6
6016.50.25126.21.0445.9
Table 8. Comparison of LOD and LOQ for gold nanoparticle mixture obtained with both channels (single measurement).
Channel TypeParticle Diameter (nm)LOD mass concentration (µg·L−1)LOD number concentration (particle·L−1)LOQ mass concentration (µg L−1)LOQ number concentration(particle·L−1)
Conventional100.454.5 ×10101.21.2 × 1011
300.351.6 × 1091.04.5 × 109
600.33 × 1080.99 × 108
Miniaturized100.22 × 10100.77 × 1010
300.156.8 × 1080.62.7 × 109
600.151.5 × 1080.555.5 × 108

