
Test of an Improved DNA and RNA Purification Protocol—Importance of Proteinase K and Co-Purified Small RNAs


Department of Pathology, Copenhagen University Hospital, 2730 Herlev, Denmark
*
Author to whom correspondence should be addressed.
Separations 2022, 9(11), 324; https://doi.org/10.3390/separations9110324
Submission received: 30 August 2022
/
Revised: 19 October 2022
/
Accepted: 19 October 2022
/
Published: 22 October 2022
(This article belongs to the Special Issue Exclusive Papers Collection of Scholars Invited by Editorial Board Members of Separations)
Abstract
:Optimized and reliable DNA/RNA extraction protocols are a vital tool in clinical practice in the context of molecular testing. Here, we present our successful attempt to enhance the quantity of RNA isolated from clinical specimens, which we originally found challenging (breast and testis). We compared several purification methods with special focus on two AllPrep system-based protocols (QIAGEN). Our data suggest that addition of proteinase K may markedly increase RNA and, in some cases, also DNA yield. The extraction kit used, AllPrep DNA/RNA/miRNA universal kit, provides RNA amounts comparable with the phenol-chloroform extraction method; however, part of the final yield consisted of small RNAs, visible as a thick band in the bioanalyzer gel-like image (5S peak). The 5S peak, albeit in some cases dominating the bioanalyzer image, plays only a small role in RT-qPCR analysis, and Qubit or NanoDrop measurements can still be used as a reliable estimate of starting amounts of mRNA for downstream analyses. In conclusion, we showed that implementing a protocol containing a step of proteinase K digestion markedly increases RNA yield. The AllPrep DNA/RNA/miRNA Universal Kit can be successfully used for simultaneous extraction of DNA and total RNA, irrespective of the tissue of origin, and does not present inconveniences related to phenol-chloroform extraction.
1. Introduction
The availability of high-quality genetic material is necessary in paraclinical settings for reliable diagnosis, prognostics, and treatment and is especially relevant in the era of precision medicine. Validated, reliable purification protocols ensuring high RNA and/or DNA amounts for molecular testing are important, especially in clinical contexts where the patient material is often both scarce and unique and where the assay result impacts patient diagnosis and treatment.
An RNA/DNA purification protocol consists of four steps: effective tissue disruption, denaturation of nucleoprotein complexes, inactivation of nucleases, and removal of contaminants. Methods allowing nucleic acid extraction can be divided into solution-based, which is currently rarely used, column-based or involving magnetic separation [1,2]. Current trends in molecular biology include increasing automation of the extraction process and options such as all-in-one commercial kits, allowing simultaneous extraction of RNA and DNA often along with protein [1].
Numerous high-quality DNA and RNA purification kits manufactured by different providers and suitable for various types of starting material are currently available on the market. Studies comparing their performance have previously been attempted, and they rarely demonstrate that one product clearly outperforms others in the panel [3,4,5,6]. However, only a few providers offer the option of simultaneous extraction of DNA and RNA from the same fraction of starting material. This solution may be advantageous when working with small amounts of starting material or to account for possible sample heterogeneity and ensure that both DNA and RNA come from an area with similar cell composition (as underlined by Pena-Llopis and Brugarolas, [7]).
It should also be stressed that working with clinical specimens presents additional challenges in terms of standardization, as compared to, for instance, purification of DNA/RNA from pure cell lines. In the latter case, it is theoretically possible to relate the actual nucleic acid yield to the predicted content. In the case of tissue samples, DNA/RNA extraction efficiency often varies substantially, which may result from the properties of tissue (fibrous, with low cellularity or high fat content) but also from the clinical state (ischemia, apoptosis, necrosis) [8,9,10]. We have also observed this in our experimental and clinical routine setting and have found that especially breast and testis tissue samples may be challenging in regard to nucleic acid extraction. Thus, our objective was to improve the nucleic acid extraction and ensure sufficient amounts of high-quality RNA and DNA, irrespective of the tissue of origin and preferably using the same fraction of starting material for simultaneous extraction of both molecules. The procedure should be easy to perform as a standard laboratory procedure and does not present a health hazard. We achieved this by identifying an extraction kit that would perform well in challenging samples.
2. Results
2.1. Different Tissue Types May Present a Challenge When Extracting Total RNA
We extracted total RNA and DNA from several fresh-frozen biospecimens derived from various organs. We employed the AllPrep DNA/RNA Mini Kit (ref# 80204, Qiagen) (referred to as Protocol_O). This kit allows simultaneous extraction of total RNA and DNA from the same tissue specimen. In total, we processed 84 cancer samples and observed that the RNA yield in some of the samples was low, often even below the detection threshold (Table 1).
This was especially observed for RNA yield from breast cancer tissue, where 20 out of 44 biopsies gave an RNA yield below 4 ng/µL (i.e., below the lower detection limit of Qubit apparatus; Table 1). Originally, we suspected that the low yield may be either due to RNA degradation or the tissue properties (necrotic, calcified). However, when performing RNA isolation from some of the low-yield samples using phenol-chloroform extraction followed by processing the aqueous phase with the #80204 kit (Protocol_PC+O), we obtained high RNA amounts (Table 2). Extracting RNA from testis cancer samples also seemed challenging, with 3 out of 4 samples failing to provide measurable amounts of RNA (Table 1), though in this case we ascribed the poor outcome to low tissue cellularity. Of note, samples resulting in low RNA yield were not restricted to one freezing method.
It has been demonstrated that the tissue disruption method may influence the amounts of extracted nucleic acids [11]. However, in our case, implementing TissueLyser instead of pestle gridding did not ensure high RNA yield. Our earlier preliminary experiments (Supplementary Table S1) repeatedly resulted in very low RNA yield when the tissue was homogenized in RLT buffer rather than in QIAzol. Therefore, we decided not to alter the tissue disruption procedure, as the one we implemented originally (pestle) is fast, easy, and does not require additional equipment.
Since changing the protocol chemistry markedly improved the results, we ruled out that the tissue properties were responsible for poor RNA yield. However, due to the known toxicity of phenol-based reagents, we sought to employ an alternative protocol.
2.2. RNA Yield May Be Enhanced by Proteinase K Digestion
We tested another AllPrep-type kit, namely AllPrep DNA/RNA/miRNA Universal kit #80224 (later referred to as Protocol_P). The main differences between the procedure in Protocol_O and Protocol_P were that the latter (1) included an additional digestion step with proteinase K, (2) included an on-column digestion step with DNaseI, and (3) supported purification of low molecular RNA. Otherwise, these two protocols were similar. Another modification we tested was introducing a QIAshredder homogenization step (Protocol_P+Q). Briefly, the QIAshredder homogenizer consists of a biopolymer-shredding system in a microcentrifuge spin-column format. It filters out insoluble debris and reduce sample viscosity, contributing to increased RNA yield.
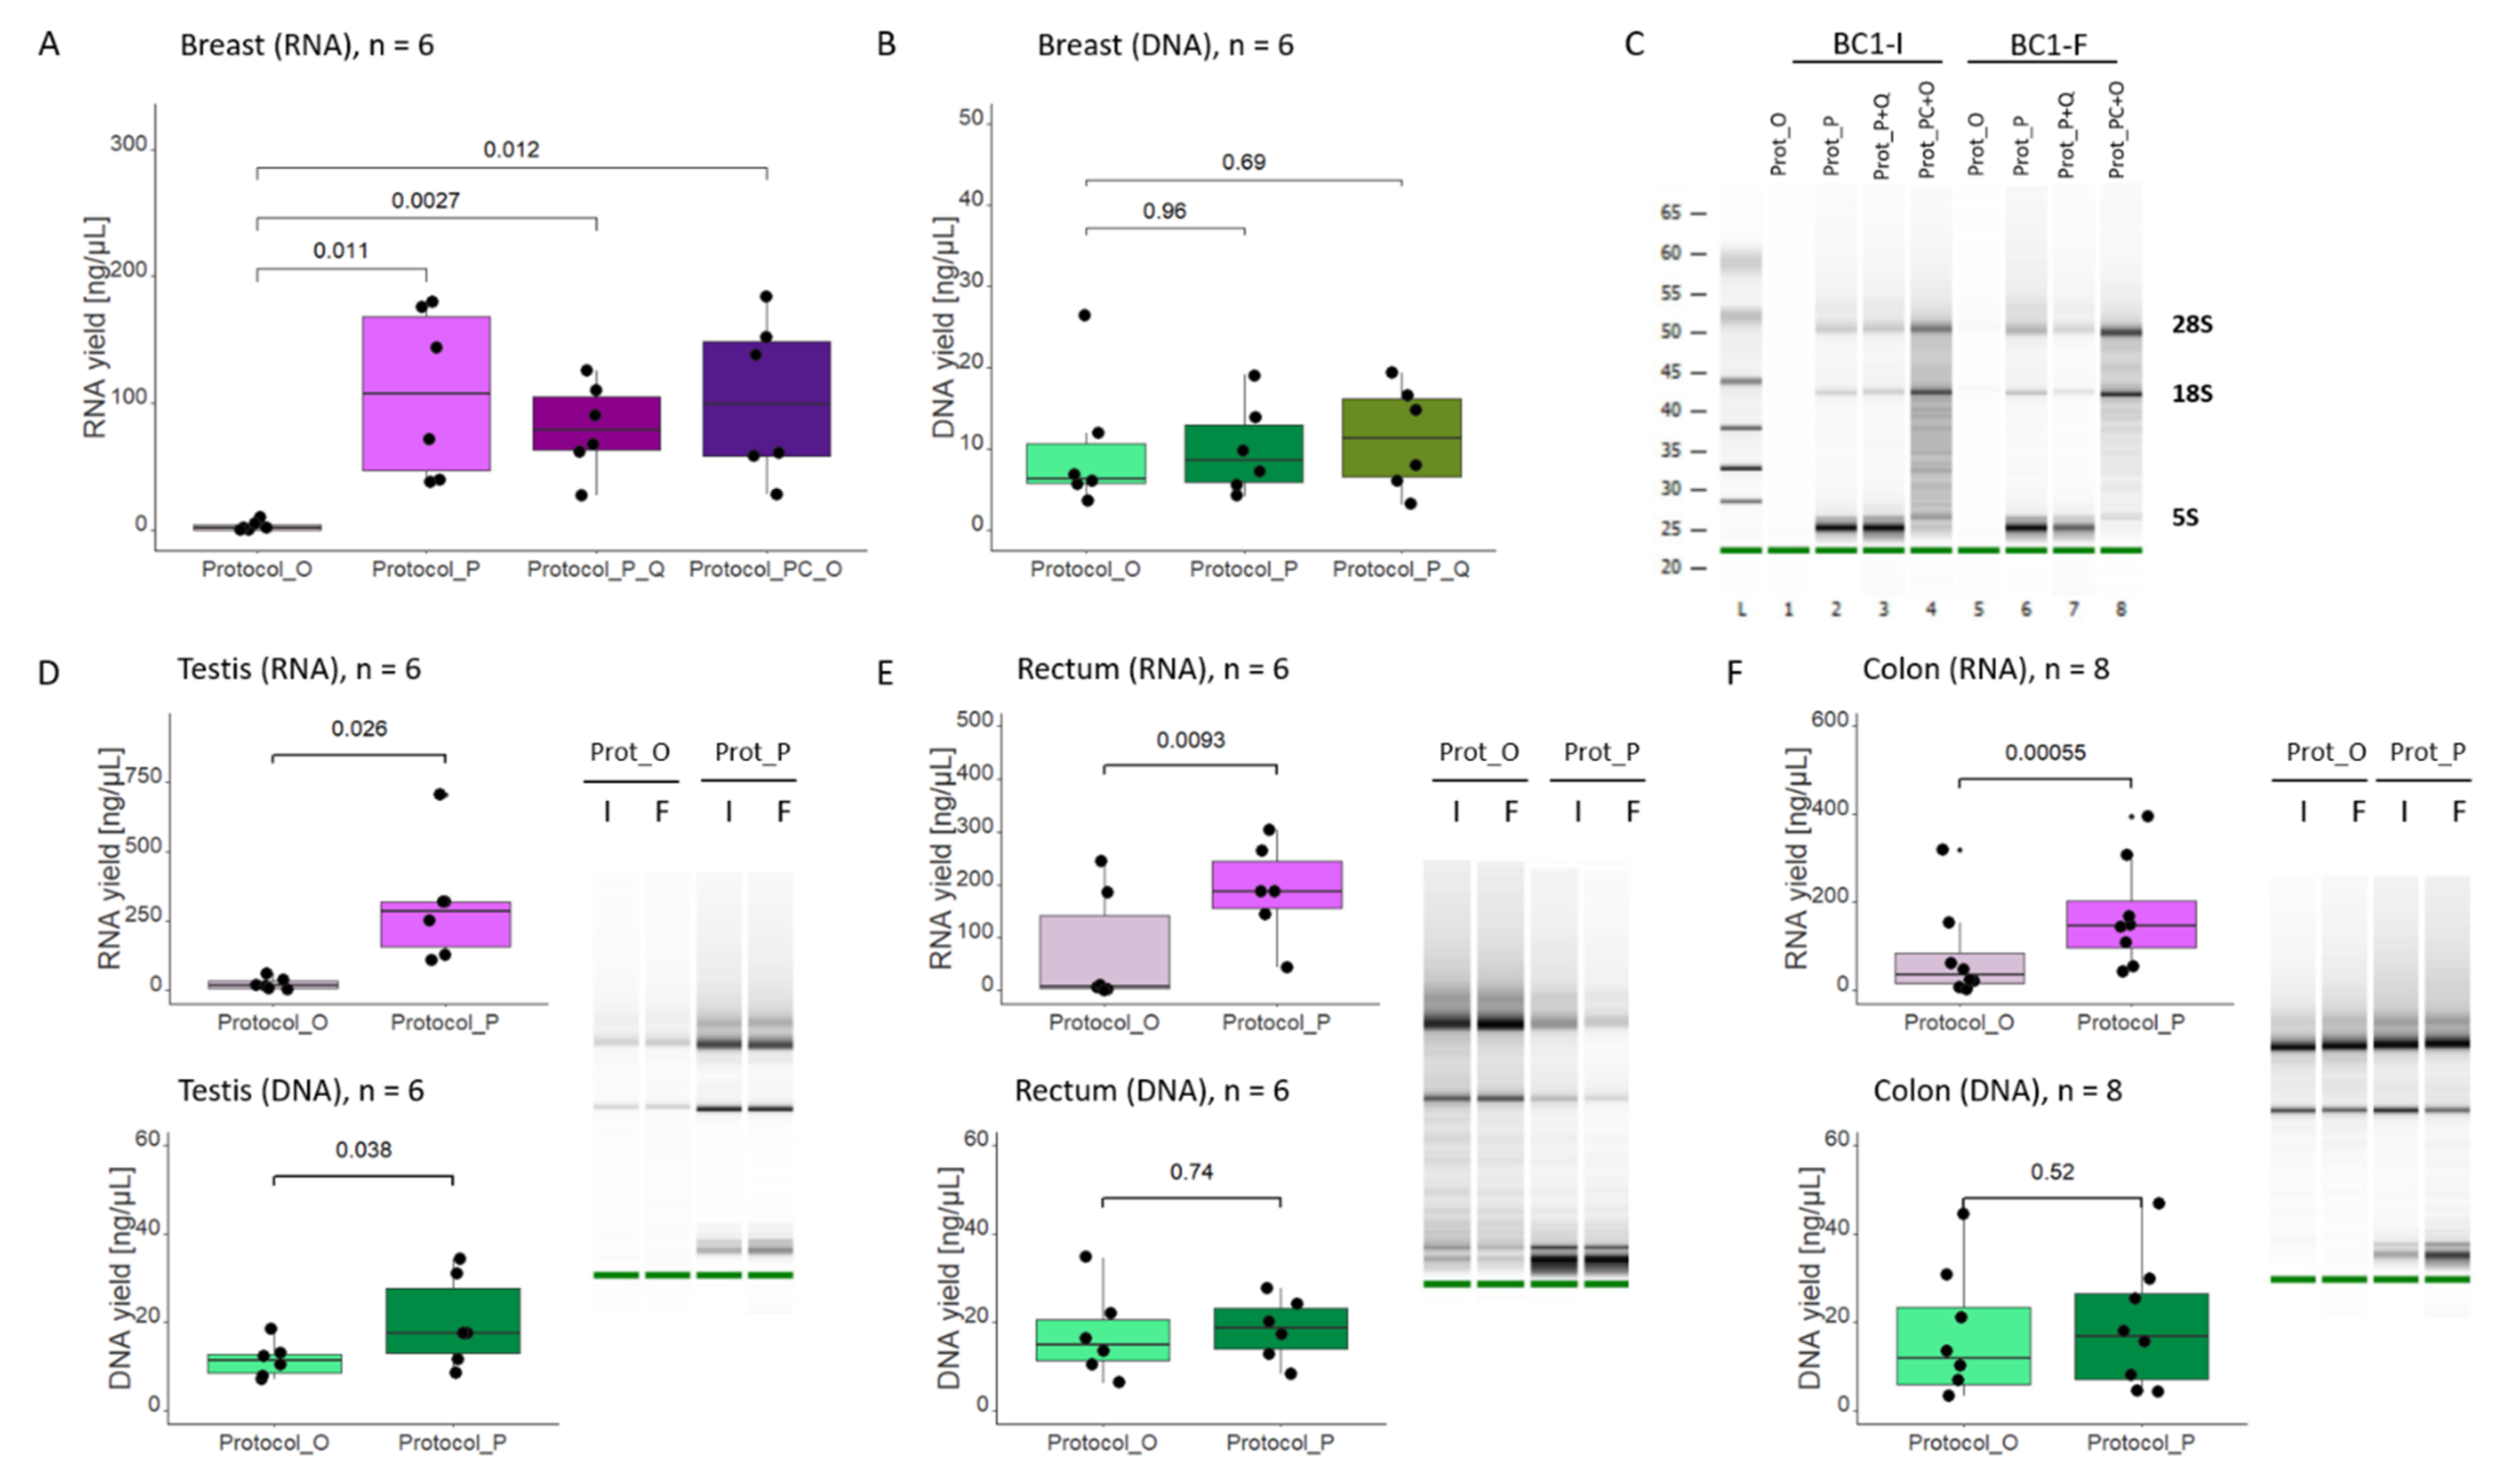
Processing breast cancer tissue with Protocols P and P+Q gave RNA yields similar to those obtained with the phenol-chloroform (PC+O) method and significantly higher (p = 0.012) than with Protocol_O (Figure 1A). Notably, albeit Protocol_P performed markedly better, we did not observe any further improvement resulting from the use of QIAshredder (Figure 1A). Therefore, we used only Protocol_P, without further modifications. As far as the DNA yield was concerned, Protocol_P was not superior to Protocol_O, and adding the homogenization step did not influence the amount of DNA extracted from breast cancer samples (Figure 1B). Regarding the nucleic acid purity, the 260/280 ratio was similar both for RNA and DNA (Table 3), and all protocols were comparable, indicating no protein contamination.
To evaluate the quality of RNA extracted from breast cancer samples using different protocols, we performed microcapillary electrophoresis on a Bioanalyzer apparatus. Figure 1C presents a schematic gel-like image of RNA isolated from two challenging breast tissue specimens. Lanes 1 and 5 correspond to RNA isolated using the original Protocol_O and remain, as expected, practically blank. Results for RNA isolation using Protocol_P (lanes 2 and 6) and Procotol_P+Q (lanes 3 and 7) are markedly better and largely similar to one another. High RNA yield is also visible in lanes 4 and 8, corresponding to phenol-chloroform extraction (Procotol_PC+O). Distinct 18S and 28S bands are visible in all samples, with the exception of 1 and 5. Interestingly, RNA-integrity numbers (RIN) could only be calculated for phenol-chloroform samples, despite the fact that the Protocol_P and Protocol_P+Q lanes looked clean (visibly cleaner than Protocol_PC+O). However, these four samples are characterized by a very thick band corresponding to low molecular weight RNA. Presence of this band (5S peak) can most probably be explained by the fact that the chemistry of the AllPrep #80224 (Protocol_P) kit (higher ethanol concentration, use of FRN rather than RW1 buffer) also supports extraction of low molecular weight RNA. Presence of a band/peak in the 5S region impedes RIN calculations; therefore, for the analysis of RNA integrity, a ratio of 28S to 18S, rather than RIN, was used.
Similarly, we obtained better results using Protocol_P for RNA extraction from testis (13-fold increase of the mean yield, from 23.3 to 305 ng/µL, p = 0.026; Figure 1D). However, in case of tissue samples, which previously gave high RNA yield, the relative gain was lower. We observed an average increase in RNA yield between 2- and 3-fold when comparing Protocol_O and Protocol_P for colon (from 79.3 to 171.5 ng/µL, p = 0.00055) and rectum (from 74.6 to 188.7 ng/µL, p = 0.0093) samples. The 5S peak can also be seen in samples from all other organs, suggesting the presence of low molecular weight RNA (Figure 1D–F).
DNA yield in most samples was similar for protocols O and P (Figure 1B,E,F). Only for the testis cancer samples the DNA yield obtained using Protocol_P was significantly higher than with Protocol_O (11.5 ng/µL vs. 20 ng/µL, p = 0.04; Figure 1D).
We measured RNA and DNA concentration using both Qubit and NanoDrop, since these two methods differ in their mechanism. While Qubit measurement can distinguish between DNA and RNA in a sample, the UV absorbance reading (such as by NanoDrop) cannot. On the other hand, the Qubit™ RNA HS assay is intended for total RNA, rRNA, or large mRNA, rather than for small RNA (∼20 nt or bp; manufacturer’s declaration). Basing on our Bioanalyzer analysis, we expected small RNA to be present in the sample, and therefore we supplemented the Qubit measurement with NanoDrop. Measurements with both methods showed high correlation, irrespective of the extraction protocol used (Pearson correlation coefficient equal to ca. 0.98 for RNA and ca. 0.89 for DNA; Supplementary Figure S1).
The 260/230 ratios differed greatly, as previously demonstrated for extraction methods using guanidine thiocyanate (see Discussion for details), and we found no difference between the two extraction protocols (Supplementary Data, Figure S2).
2.3. RNA Integrity Data
Systematic analysis of RNA integrity on the Bioanalyzer demonstrated that using either protocol (O and P) results in RNA of similar quality. We compared the ratio of 28S and 18S peaks in 28 biospecimens isolated either with Protocol_O or Protocol_P. In 14 out of 28 cases, Protocol_O resulted in RNA amounts too low to identify the rRNA peaks. At the same time, we were not able to identify the peaks in 9 out of 28 Protocol_P samples. In case of the latter, the RNA concentration, as measured by Qubit, seemed satisfactory; however, in the Bioanalyzer image, only the 5S peak was visible, and the lanes were otherwise practically blank. The problematic samples mostly overlapped, i.e., problems visualizing rRNA bands in Protocol_P mostly (in 8 out of 9 cases) concerned samples that resulted in low yield when extracted with Protocol_O. For samples where the rRNA peaks were easily identifiable (n = 13 pairs), the 28S/18S ratio between protocols was not statistically different (Figure 2A,B).
We also observed that there was a strong negative correlation (R = −0.8287) between RNA yield, as extracted by Protocol_P, and the percentage share of the 5S peak in the Bioanalyzer profile. In other words, the 5S peak dominated in samples that otherwise gave low RNA yield (Figure 2C). This can be explained by small RNAs being easier to isolate than RNAs with higher molecular weight.
2.4. Using Protocol_P Resulted in Co-Extraction of Small RNA, Which Did Not Interfere with RT-qPCR Analysis
To explore if the high level of small RNAs in the samples purified with Protocol_P affected downstream analyses, we performed RT-qPCR analysis with RNA extracted using Protocol_P versus Protocol_PC+O (phenol-chloroform extraction; for breast cancer samples only) and Protocol_P versus Protocol_O. The same amounts of RNA, as measured by Qubit, were used for cDNA synthesis for corresponding samples, and expression of glyceraldehyde-3-phosphate dehydrogenase (GAPDH) was measured (see an example of RT-qPCR settings in Table 4). We expected that corresponding samples extracted with different protocols would perform similarly in RT-qPCR and result in similar threshold cycle (Ct) values.
We saw that samples isolated with Protocol_PC+O had lower Ct values (on average by 1.6 cycles, Figure 3A; p-value = 0.004) than samples extracted by Protocol_P. This effect was also found, but less pronounced, when Protocol_O and Protocol_P were compared (which on average differed by 1.1 cycles, p = 0.01). However, this trend was not observed across all samples (Figure 3B). At the same time, we noticed a significant positive linear relation (R = 0.58, p = 0.007) between the percent share of peak 5S and the difference between Ct for both extraction protocols (Figure 3C). In 6 out of 20 samples, the difference exceeded two cycles, and in all these cases, percent share of 5S peak for Protocol_P was at least 70%. In five out of these six samples, RNA yield for Protocol_O was below 25 ng/µL. However, when comparing samples where the yield for both Protocol_O and Protocol_P was at least 25 ng/ul, the Ct difference between protocols dropped by one-fourth (from 1.06 to 0.77; n = 10, p = 0.017) and only in one case exceeded 1.5 cycles.
We verified the above findings by measuring the expression levels of another housekeeping gene, β-actin (ACTB), in the same samples (Supplementary Figure S3). For this gene, we did not observe a difference between protocols P and PC+O (p =0.98), while protocols O and P differed on average by 1.33 Ct (p = 0.012) or by 0.71 Ct for samples where the concentration was above 25 ng/µL (p = 0.013). The relation between the percent share of peak 5S and the difference between Ct values for both extraction protocols was even more pronounced (R = 0.678 and p = 0.001; Supplementary Figure S3). Moreover, we compared gene expression levels of several lower expressed genes (Supplementary Table S2). Since the input amount of RNA (used for cDNA synthesis) was limited by the low yield obtained with Protocol_O, analysis of these transcripts was challenging (Supplementary Table S2). Notwithstanding this, the data indicate that both protocols give comparable results (Supplementary Figure S4 and Supplementary Table S3).
Overall, these data suggest that RNA isolated with both protocols can be used for RT-qPCR, and the Qubit concentration measurement gives a good estimate of the amount of starting material, despite the 5S peak contributing significantly to the overall RNA yield. However, the strength of Protocol_P is the ability to extract higher amounts of RNA from challenging samples. With the use of Protocol_O, an RT-qPCR analysis of low abundant transcripts would not always be possible.
2.5. On-Column DNA Digestion Is Necessary Due to Incomplete DNA/RNA Separation
Moreover, we checked if the on-column DNAseI digestion step may affect the contamination of RNA samples with genomic DNA. To verify this, we performed a qPCR reaction on RT(-) RNA samples, i.e., RNA samples that did not undergo reverse transcription (RT) and theoretically should not contain DNA. The TaqMan GAPDH and ACTB gene expression assays are designed to specifically amplify cDNA, synthetized based on messenger RNA (mRNA) but not genomic DNA. Therefore, we used the internal control gene analysis in the Entrogen BRAF mutation detection kit to test for genomic DNA contamination. In RNA samples purified with Protocol_P, this reaction was either negative (4 out of 8; marked as Ct = 42) or gave a 10–100 weaker signal than in corresponding samples extracted with Protocol_O (difference of 3–6.7 cycles; p = 0.008; Figure 3D).
These results emphasize the importance of the on-column DNAseI digestion step, which is an integral part of kit #80224 (Protocol_P) but only optional in kit #80204 (Protocol_O; appendix E of the manufacturer’s protocol).
2.6. Protocol_P and Protocol_O Result in Extraction of DNA Similar to qPCR Analysis
Finally, we tested whether the protocols provide DNA of similar quality, suitable for downstream assays. As mentioned above, both protocols gave similar results in terms of DNA concentration and purity (see Figure 1 and Table 3). DNA performance in PCR was estimated using BRAF Codon 600 Mutation Analysis Kit II (EntroGen). Ten sample pairs were included (breast: n = 2, colon: n = 2, testis: n = 2, rectum: n = 2, and uterus: n = 2). We focused on the amplification of the internal control gene (BRAF mutation was not detected in any of the tested samples). We performed four 10-fold serial dilutions of each sample, calculated the linearity (R2 coefficient) and efficiency (E = −1 + 10(−1/slope)) of PCR reaction for each sample, and compared Ct values for each pair of samples for the highest amount of starting material (40 ng DNA per reaction).
Ct values for corresponding samples with the highest DNA concentration extracted with protocols O versus P were similar (24.4 ± 0.3 and 24.7 ± 0.3 cycles, respectively; mean absolute difference of Ct values between pairs: 0.3 cycles; p = 0.19; Figure 4A). The PCR signal in all samples showed a steady linearity, with the coefficient of determination R2 exceeding 0.97 in all cases. Efficiency of amplification did not differ between extraction protocols. Only one sample (same as above) performed poorly (efficiency 46%), but otherwise the results were satisfactory (82.3 ± 14.4% and 90.6 ± 10.3% for protocols O and P respectively, p = 0.21; Figure 4B), indicating the absence of PCR reaction inhibitors.
3. Discussion
The availability of a good quality biological material is a prerequisite of obtaining credible results in molecular diagnostics. To ensure reliable data, both RNA and DNA should be intact (undegraded), clean (i.e., devoid of potential inhibitors of downstream processes) [12], and present in sufficient amounts.
Choice of tissue disruption method and the appropriate lysis buffer is crucial for the first steps of nucleic acid purification. Tissue homogenization must be thorough to ensure high yield whilst not damaging the material. Nouvel et al. compared various tissue disruption techniques and found that they may affect not only RNA yield but also some of the RNA integrity markers, with 28S rRNA being especially sensitive to mechanical shearing. We chose a relatively gentle homogenization method, which was sufficient for the biospecimens included in our study. However, since skin is reportedly difficult to disrupt, more harsh methods (such as bead-beating) may be necessary for this sample type [10,13].
Tissue disruption should also be fast to prevent enzymatic degradation of nucleic acids by nucleases. RNA digestion by RNases is an especially common pitfall. Prolonged time until freezing or until placing in a solution containing RNase inhibitors, designed either to preserve (RNAlater) or to lyse the sample (RLT, QIAzol), may significantly affect RNA integrity. Moreover, if the perfusion of the preserving/lysing solution is not fast enough (like in dense samples rich in connective tissue), RNA degradation can be more pronounced [10].
One of the strategies for successful RNA isolation, especially from RNase-rich tissues, is the use of proteinase K. Proteinase K may be added either at the initial steps, directly to the cell/tissue homogenate, where its role is to facilitate sample digestion (for example, when working with highly fibrous tissue) or, as in our case (Protocol_P, #80224), to the lysate devoid of tissue debris. In such a scenario, the role of proteinase K is to inactivate nucleases that could degrade RNA (or DNA) during purification and to digest proteins, thus freeing RNA from RNA-protein complexes and decreasing sample contamination [14]. In our case, using an extraction kit containing proteinase K ensured high RNA yield, even from samples regarded as “difficult”. Another approach that, in our experimental setting, ensured high RNA yield, was tissue disruption in QIAzol reagent, followed by phenol-chloroform extraction and subsequent processing of the aqueous phase with the #80204 kit (Protocol_PC+O). QIAzol ensures efficient tissue lysis, though the method has two major drawbacks. First, phenol-based reagents (such as TRIzol or QIAzol) are toxic, and working with them presents a certain health hazard. Then, unlike the AllPrep protocol, phenol-chloroform extraction only supports RNA isolation. This would mean the necessity of using two different methods, depending on the desired outcome. Therefore, instead of resorting to phenol-chloroform extraction, we settled on using Protocol_P (#80224), which also resulted in high yield of RNA and moreover allowed simultaneous extraction of both RNA and DNA.
At the same time, we observed high amounts of low molecular weight rRNA being co-purified when using Protocol_P (#80224). The extraction is facilitated by ethanol concentration and buffer composition (FRN instead of RW1), not using proteinase K. Therefore, the desired outcome would be to optimize the Protocol_O (#80204) so that it includes a proteinase K digestion step, without co-extracting small RNA. To our knowledge, so far, the chemistry of the RLT Plus buffer does not allow this (QIAGEN, personal communication).
The suitability of extracted RNA and DNA for downstream applications is regarded in terms of integrity and purity. Assessment of RNA integrity is commonly made using the RIN parameter, designed for unambiguous and user-independent interpretation of RNA quality. It considers the whole electropherogram, rather than 18S and 28S rRNA peaks alone, and is more robust to sample dilution and inter-instrument variability than the 28S/18S ribosomal ratio [15]. However, presence of unexpected peaks (such as a very high peak is 5S region, as we observed) may impede RIN calculation. We discussed this finding with both QIAGEN and Agilent customer service. They supported our conclusions and agreed that the flat baseline between 5S and ribosomal peaks suggests that the observed peak is due to the presence of small RNA, rather than RNA degradation (QIAGEN and Agilent customer service, personal communication). In such a case, the 28S/18S ribosomal ratio is the parameter of choice, and a significant positive correlation between ribosomal ratio and RIN values has been shown previously [10].
It must be stressed that the Bioanalyzer images, unless using specifically mRNA-enriched or ribo-depleted samples, only give information about the integrity of ribosomal RNA. mRNA constitutes around 4% of total RNA [16] and is not visible on Bioanalyzer electropherograms. Therefore, Bioanalyzer data only allow to infer about mRNA integrity based on the rRNA quality, and RINs serve as a surrogate parameter. Of note, only samples with a RNA concentration exceeding 25 ng/µL can be accurately measured using the Bioanalyzer [15], though samples with lower RNA content can potentially still be used in downstream applications. In our study, we successfully performed RT-qPCR on breast and testis samples with concentrations below 10 ng/µL (as low as 1.3 ng/µL or 8 ng RNA per cDNA reaction), for which Bioanalyzer electropherograms were blank.
Analysis of Bioanalyzer images provided information both about RNA integrity and RNA size distribution. The peak/band of small RNA in the 5S region of the Bioanalyzer electrogram constituted from 20 to even 80% of the total RNA profile. We were primarily interested in gene expression assays and therefore in obtaining good quality mRNA defined as fragments composing several hundred nucleotides. Therefore, our concern was that the high share of small RNA would interfere with the assay and, at best, only make our concentration measurement (by Qubit or NanoDrop) imprecise. When we compared the Ct values for samples isolated either with Protocol_O or Protocol_P, we observed that Protocol_P samples tend to have higher Ct values, which would confirm our hypothesis that part of the Qubit/NanoDrop measurement comes from small RNA. However, the differences were typically around 1 Ct, which means that the Qubit/NanoDrop measurement still gives a relatively good estimate of the amount of mRNA starting material.
Nucleic acid purity is another factor that may influence their performance in downstream experiments. Several classes of substances may potentially act as PCR inhibitors (reviewed by Shrader et al.; [12]). Contaminants may originate from the specimen itself (polysaccharides, bile salts, various proteins) or be introduced during purification (phenols). Two parameters (purity ratios) are commonly used to estimate the presence of contaminants: relative absorbance at 280 nm (260/280 ratio) and at 230 nm (260/230 ratio). The first parameter informs about protein contamination (optimal values are around 1.8 for DNA and 2 for RNA). The second parameter (optimal values are in the range of 1.8–2.2) may be affected by the presence of various organic compounds, such as peptides, carbohydrates, or phenols [17]. An example of a compound absorbing very strongly at 230 nm is guanidine thiocyanate, and it is present in high amounts in lysis buffers (including RLT) or extraction reagents such as TRIzol or QIAzol. Guanidine thiocyanate is therefore regarded as the main culprit responsible for low 260/230 ratios; several studies report that even very low 260/230 ratios do not affect performance of downstream applications, including RT-PCR, multiplex PCR, NGS, and microarray [18,19,20].
The AllPrep system launched by QIAGEN allows simultaneous extraction of DNA and RNA from the entire sample. Another commonly used option is to divide the sample or already purified nucleic acids into two and process them separately (for example, by adding RNase to one and DNase to the other part). However, half of the material is lost. The protocol implemented by QIAGEN allows separation into DNA and RNA fractions, based on selective properties of AllPrep DNA Mini Spin Columns. The separation is not perfect, and the genomic DNA, albeit in small amounts (Ct values > 34), can still be detected in the RNA fraction (see Figure 3D).
Furthermore, we demonstrated that the AllPrep DNA/RNA/miRNA Universal kit has a clear advantage over the AllPrep DNA/RNA Mini kit in terms of RNA yield, which most likely can be ascribed to the proteinase K digestion step.
In summary, we successfully improved our extraction procedure, demonstrating that good quality RNA and DNA may be purified simultaneously, even from samples previously regarded as problematic, and avoiding the health hazard posed by using phenol-chloroform extraction. Our new protocol of choice, involving the use of the AllPrep DNA/RNA/miRNA Universal kit #80224, ensures high amounts of broad-range molecular weight RNA, and though 5S RNA peak obscures Bioanalyzer analysis, Qubit/NanoDrop measurements still provide a good estimate of the amount of starting material for downstream analyses such as RT-qPCR.
4. Materials and Methods
4.1. Human Tissue Samples
The material used in this study consisted of fresh-frozen tissue cancer specimens, obtained for diagnostic purposes by the Department of Pathology, Herlev and Gentofte Hospital, Denmark, and stored at the Danish CancerBiobank (part of the Bio- and Genome Bank Denmark; RBGB). All specimens were collected and handled according to strict standard operating procedures. Tissue samples from the following organs were included: breast, colon, testis, rectum, uterus, adrenal gland, and kidney. Samples were snap-frozen upon collection either in dry-ice cooled isopentane (VWR Chemicals, Solon, OH, USA) or using a FlashFREEZE benchtop unit (Milestone Medical, Sorisole, Italy); two specimens, frozen according to two different methods, were available from each subject.
When comparing extraction protocols, each specimen was divided into smaller samples, which were then processed in parallel.
The overview of all samples, including the tissue of origin and the analysis employed, is gathered in Table 5.
4.2. Nucleic Acid Extraction
Altogether, for comparative purposes, we implemented four purification protocols, referred to as Protocol_O, Protocol_P, Protocol_P+Q, and Protocol_PC+O, as described below.
In all protocols, apart from the guanidine thiocyanate-phenol-chloroform (PC+O) method, tissue was disrupted in RLT Plus buffer (QIAGEN, Hilden, DE, USA). Briefly, fragments of fresh-frozen specimens (not exceeding 3 mm3 or 20 mg) were cut into smaller pieces with a scalpel, immediately immersed in 200 µL RLT Plus buffer containing 0.1% v/v β-mercaptoethanol, and disrupted using a pestle (Thermo Fisher Scientific, Waltham, MA, USA). When processed, tissue specimens were kept on dry ice util lysis. Visually, all samples had similar size.
After initial disruption, 400 µL RLT Plus Buffer was added, and samples were lysed for an additional 5 min before continuing with one of the two commercial kits. The different protocols employed in our settings are described below:
Protocol_O—(originally implemented protocol). After tissue disruption in RTL Plus Buffer, samples were centrifugated at maximum speed for 3 min, and the supernatant was further processed as instructed by the manufacturer using the AllPrep DNA/RNA Mini Kit, #80204 kit (QIAGEN).
Protocol_P (proteinase K)—Analogous to Protocol_O, except for implementing a different kit, namely AllPrep DNA/RNA/miRNA Universal kit #80224 (QIAGEN) containing proteinase K and an on-column DNAseI digestion step, as instructed by the manufacturer.
Protocol_P+Q (proteinase K + QIAshredder)—Analogous to Protocol_P, with the only difference being the use of QIAshredder columns (QIAGEN, cat. No. 79656). Immediately after lysis in RLT Plus Buffer, samples were centrifugated in QIAshredder columns instead of 1.5 mL Eppendorf tubes.
Protocol_PC+O—tissue specimens were disrupted in 200 µL QIAzol reagent (QIAGEN) instead of RLT Plus Buffer. After tissue disruption, 800 µL of QIAzol was added to the sample (up to 1 mL) and mixed with 200 µL chloroform. The tube was shaken vigorously for 15 s and incubated at room temperature for 2–3 min, followed by centrifugation of the lysate at 12,000 g for 15 min. Then, the upper, aqueous phase was transferred into a fresh tube, and the isolation continued using AllPrep DNA/RNA Mini Kit, #80204 kit (QIAGEN; Protocol_O), as instructed by the manufacturer. Elution in all protocols was done with 24 µL water for RNA extraction and 100 µL EB buffer for DNA extraction.
The protocol names we use throughout the text are for readers’ convenience, to avoid repeating product names or using unintuitive product catalogue numbers. However, it should be noted that Protocol_O and Protocol_P, apart from the method suggested for tissue disruption herein (pestle), refer to original QIAGEN procedures.
4.3. Evaluation of DNA/RNA Quantity and Purity
Nucleic acid concentration was quantified by a Qubit® 2.0 Fluorometer with Qubit™ dsDNA HS Assay Kit for DNA and Qubit™ RNA HS Assay Kit for RNA and with NanoDrop™ One. Sample purity (260 nm/280 nm and 260 nm/230 nm absorbance ratios) was evaluated by NanoDrop™ One (all from Thermo Fisher Scientific). All samples were measured in a 1:200 dilution according to the manufacturer’s procedures, leading to a limit of quantification of 4 ng/µL for RNA and 0.5 ng/µL for DNA. In a few samples, a lower dilution was used in order to detect lower levels.
4.4. Analysis of RNA Integrity
RNA integrity was evaluated by microcapillary electrophoresis using an Agilent 2100 Bioanalyzer with an Agilent RNA 6000 Nano Kit (Agilent technologies, Santa Clara, CA, USA). One microliter of undiluted sample was subjected to the analysis according to manufacturer’s instructions. RNA integrity was expressed as 28S/18S ribosomal peak ratio. The 28S/18S peak ratio and the percentage share of 5S peak were calculated using Bioanalyzer 2100 Expert software (Agilent).
4.5. Reverse Transcription—Quantitative Polymerase Chain Reaction (RT-qPCR) on RNA
RNA was transcribed into cDNA using the AffinityScript QPCR cDNA Synthesis Kit and oligo(dT) primers according to the manufacturer’s protocol (Agilent Technologies, Santa Clara, CA, USA). For each sample pair (purified with different protocols), the amount of total RNA used as input for cDNA synthesis was identical. Real-time measurement of mRNA levels was performed with the Stratagene 3005P qPCR System (Agilent Technologies) using TaqMan® Gene Expression Assays (Applied Biosystems, Foster City, CA, USA) specific for GAPDH (assay ID: Hs02758991_g1) and ACTB (assay ID: Hs99999903_m1). Threshold cycle (Ct) values for each sample were collected and compared between protocols.
4.6. Quantitative Polymerase Chain Reaction (qPCR) on DNA
DNA performance in qPCR was estimated using BRAF mutation detection kits (EntroGen, Woodland Hills, CA, USA) and analyzed on the ABI 7500 Fast Real Time PCR system.
Briefly, four 10-fold DNA serial dilutions were prepared (40, 4, 0.4, and 0.04 ng DNA per sample), and the qPCR reaction was carried out according to manufacturer’s protocol (EntroGen). Linearity and efficiency of the PCR amplification reactions were evaluated as follows. The lm (linear model) function (package stats, R version 3.6.1) was used to find the linear relation between the DNA input (log10 of DNA concentration) and Ct values. Since no mutations were detected, we collected the signal for internal control (housekeeping gene). Two parameters: coefficient of determination (R2), measuring the goodness-of-fit in a linear regression, and the slope were extracted. The slope was subsequently used to calculate the PCR reaction efficiency (E), using the formula: E = −1 + 10(−1/slope).
4.7. Genomic DNA Contamination Analysis
The BRAF mutation detection kit (EntroGen) was used for analysis of the presence of contaminating DNA in RNA samples. The input material consisted of purified RNA samples and amounts of total RNA corresponding to amounts used for cDNA synthesis (see RT-qPCR).
4.8. Statistical Analysis
Samples extracted with Protocol_O were compared with corresponding samples extracted with Protocol_P or with one of the protocols used in the first part of the project (protocols P+Q and PC+O) using the two-sided t-test or Wilcoxon signed rank (for non-Gaussian distributions) with a significance level alpha = 0.05. Data distributions were tested for normality using a quantile–quantile plot. Correlation between two variables was estimated by Pearson correlation, and two parameters, correlation coefficient and p-value, were collected. Statistical analysis and graph preparation were performed in R programming language (version 3.6.1).
Supplementary Materials
The following supporting information can be downloaded at: https://www.mdpi.com/article/10.3390/separations9110324/s1, Supplementary figures: Figure S1: Two techniques of quantification of nucleic acid concentration—fluorometric based using Qubit and spectrophotometric using NanoDrop—give similar results for both RNA and DNA irrespective of extraction method.; Figure S2: 260/230 ratio does not differ between samples isolated with protocols O and P, and is positively correlated with amounts of purified nucleic acids. Figure S3: Suitability of samples extracted with Protocol_P for RT-qPCR. Supplementary figure S4. Analysis of levels of low-abundant transcripts, using RNA extracted with Protocol_O versus Protocol_ P. Supplementary tables: Supplementary Table S1: RNA yield obtained from various types of tissue when using TissueLyser rather than pestle grinding. Supplementary Table S2: List of TaqMan gene expression assays, used in the analysis of low abundant transcripts. Supplementary Table S3: Analysis of low-abundant transcripts in samples extracted with Protocol_O and Protocol_P.
Author Contributions
Conceptualization, E.B and E.H.; methodology, E.B., L.S., D.N.P.d.O., E.H.; formal analysis, E.B.; investigation, E.B.; writing—original draft, E.B.; writing—review and editing, E.B., L.S., D.N.P.d.O., E.H.; visualization, E.B., L.S., D.N.P.d.O., E.H.; supervision, E.H.; funding acquisition, E.H. All authors have read and agreed to the published version of the manuscript.
Funding
This research received no external funding.
Institutional Review Board Statement
Not applicable.
Informed Consent Statement
Not applicable.
Data Availability Statement
Not applicable.
Acknowledgments
The authors would like to thank the Department of Dermatology, Bispebjerg Hospital, Copenhagen, for permission to use their facilities and QIAGEN for technical consultations.
Conflicts of Interest
The authors declare no conflict of interest.
References
- Tan, S.C.; Yiap, B.C. DNA, RNA, and Protein Extraction: The Past and the Present. J. Biomed. Biotechnol. 2009, 2009, 574398. [Google Scholar] [CrossRef] [PubMed] [Green Version]
- Husakova, M.; Kralik, P.; Babak, V.; Slana, I. Efficiency of DNA Isolation Methods Based on Silica Columns and Magnetic Separation Tested for the Detection of Mycobacterium Avium Subsp. Paratuberculosis in Milk and Faeces. Materials 2020, 13, 5112. [Google Scholar] [CrossRef] [PubMed]
- Claassen, S.; du Toit, E.; Kaba, M.; Moodley, C.; Zar, H.J.; Nicol, M.P. A Comparison of the Efficiency of Five Different Commercial DNA Extraction Kits for Extraction of DNA from Faecal Samples. J. Microbiol. Methods 2013, 94, 103–110. [Google Scholar] [CrossRef] [PubMed]
- Sellin Jeffries, M.K.; Kiss, A.J.; Smith, A.W.; Oris, J.T. A Comparison of Commercially-Available Automated and Manual Extraction Kits for the Isolation of Total RNA from Small Tissue Samples. BMC Biotechnol. 2014, 14, 94. [Google Scholar] [CrossRef] [PubMed] [Green Version]
- Hart, M.L.; Meyer, A.; Johnson, P.J.; Ericsson, A.C. Comparative Evaluation of DNA Extraction Methods from Feces of Multiple Host Species for Downstream Next-Generation Sequencing. PLoS ONE 2015, 10, e0143334. [Google Scholar] [CrossRef] [PubMed] [Green Version]
- Patel, P.G.; Selvarajah, S.; Guérard, K.P.; Bartlett, J.M.S.; Lapointe, J.; Berman, D.M.; Okello, J.B.A.; Park, P.C. Reliability and Performance of Commercial RNA and DNA Extraction Kits for FFPE Tissue Cores. PLoS ONE 2017, 12, e0179732. [Google Scholar] [CrossRef] [PubMed] [Green Version]
- Peña-Llopis, S.; Brugarolas, J. Simultaneous Isolation of High-Quality DNA, RNA, MiRNA and Proteins from Tissues for Genomic Applications. Nat. Protoc. 2013, 8, 2240–2255. [Google Scholar] [CrossRef] [PubMed] [Green Version]
- Hemmrich, K.; Denecke, B.; Paul, N.E.; Hoffmeister, D.; Pallua, N. RNA Isolation from Adipose Tissue: An Optimized Procedure for High RNA Yield and Integrity. Lab. Med. 2010, 41, 104–106. [Google Scholar] [CrossRef] [Green Version]
- Hong, S.H.; Baek, H.A.; Jang, K.Y.; Chung, M.J.; Moon, W.S.; Kang, M.J.; Lee, D.G.; Park, H.S. Effects of Delay in the Snap Freezing of Colorectal Cancer Tissues on the Quality of DNA and RNA. J. Korean Soc. Coloproctol. 2010, 26, 316–323. [Google Scholar] [CrossRef] [PubMed]
- Lococo, P.M.; Boyd, J.T.; Espitia Olaya, C.M.; Furr, A.R.; Garcia, D.K.; Weldon, K.S.; Zou, Y.; Locke, E.; Tobon, A.; Lai, Z.; et al. Reliable Approaches to Extract High-Integrity RNA from Skin and Other Pertinent Tissues Used in Pain Research. Pain Rep. 2020, 5, e818. [Google Scholar] [CrossRef] [PubMed]
- Nouvel, A.; Laget, J.; Duranton, F.; Leroy, J.; Desmetz, C.; Servais, M.D.; de Préville, N.; Galtier, F.; Nocca, D.; Builles, N.; et al. Optimization of RNA Extraction Methods from Human Metabolic Tissue Samples of the COMET Biobank. Sci. Rep. 2021, 11, 20975. [Google Scholar] [CrossRef] [PubMed]
- Schrader, C.; Schielke, A.; Ellerbroek, L.; Johne, R. PCR Inhibitors—Occurrence, Properties and Removal. J. Appl. Microbiol. 2012, 113, 1014–1026. [Google Scholar] [CrossRef] [PubMed]
- Reimann, E.; Abram, K.; Kõks, S.; Kingo, K.; Fazeli, A. Identification of an Optimal Method for Extracting RNA from Human Skin Biopsy, Using Domestic Pig as a Model System. Sci. Rep. 2019, 9, 20111. [Google Scholar] [CrossRef] [PubMed] [Green Version]
- Ñique, A.M.; Coronado-Marquina, F.; Rico, J.A.M.; Mendoza, M.P.G.; Rojas-Serrano, N.; Simas, P.V.M.; Sanchez, C.C.; Drexler, J.F. A Faster and Less Costly Alternative for RNA Extraction of SARS-CoV-2 Using Proteinase k Treatment Followed by Thermal Shock. PLoS ONE 2021, 16, e0248885. [Google Scholar] [CrossRef] [PubMed]
- Mueller, O.; Lightfoot, S.; Schroeder, A. RNA Integrity Number (RIN)-Standardization of RNA Quality Control. Application 2014, 1, 1–8. [Google Scholar]
- Wu, J.; Xiao, J.; Zhang, Z.; Wang, X.; Hu, S.; Yu, J. Ribogenomics: The Science and Knowledge of RNA. Genom. Proteom. Bioinform. 2014, 12, 57–63. [Google Scholar] [CrossRef] [PubMed] [Green Version]
- Scientific, T.F. Nucleic Acid Thermo Scientific NanoDrop Spectrophotometers. Nucleic Acid 2010, 11, 1–30. [Google Scholar]
- Von Ahlfen, S.; Schlumpberger, M. Effects of Low A260/A230 Ratios in RNA Preparations on Downstream Applications. QIAGEN Newsl. 2010, 15, 7–8. [Google Scholar]
- Mathot, L.; Wallin, M.; Sjöblom, T. Automated Serial Extraction of DNA and RNA from Biobanked Tissue Specimens. BMC Biotechnol. 2013, 13, 66. [Google Scholar] [CrossRef] [PubMed] [Green Version]
- Amorim, L.M.; Santos, T.H.S.; Hollenbach, J.A.; Norman, P.J.; Marin, W.M.; Dandekar, R.; Ribeiro, E.M.S.F.; Petzl-Erler, M.L.; Augusto, D.G. Cost-Effective and Fast KIR Gene-Content Genotyping by Multiplex Melting Curve Analysis. HLA 2018, 92, 384–391. [Google Scholar] [CrossRef] [PubMed]
Figure 1.
Optimization of total RNA and DNA extraction protocol. (A) Comparison of total RNA yield extracted from breast cancer samples using various protocols. (B) Comparison of DNA yield extracted from breast cancer samples using various protocols. (C) Bioanalyzer gel-like image, illustrating RNA quality extracted from two breast cancer samples. (D–F) Comparison between Protocol_O and Protocol_P in regard to RNA yield, DNA yield, and RNA integrity in various Protocol_P markedly enhances yield of RNA extracted from other tissue types, namely testis cancer (n = 6; D), rectum cancer (n = 6; E), and colon cancer (n = 8; F). BC—breast cancer; I—samples frozen with isopentane; F—samples frozen with FlashFREEZE; L—marker (Agilent RNA 6000 Nano Ladder); numbers refer to time of electrophoretic run (in seconds); range: 25–4000 nt. Dots refer to biological replicates.
Figure 2.
RNA integrity analysis. (A) Comparison between 28S/18S ratios for RNA isolated with Protocol_O vs. Protocol_P. (B) Numeric data and statistics for samples presented in 1A. (C) Negative linear correlation between the percentage share of 5S peak and the RNA yield.
Figure 2.
RNA integrity analysis. (A) Comparison between 28S/18S ratios for RNA isolated with Protocol_O vs. Protocol_P. (B) Numeric data and statistics for samples presented in 1A. (C) Negative linear correlation between the percentage share of 5S peak and the RNA yield.

Figure 3.
Suitability of samples extracted with Protocol_P in RT-qPCR. Comparison of expression of GAPDH using RNA extracted with (A) Protocol_P versus Protocol_PC+O (phenol-chloroform extraction) and (B) Protocol_P versus Protocol_O. (C) Linear correlation between the percentage share of 5S peak and the difference between RT-qPCR outcome (Ct) between samples isolated with Protocol_O versus Protocol_P. (D) Genomic contamination in samples isolated with Protocol_O versus Protocol_P.
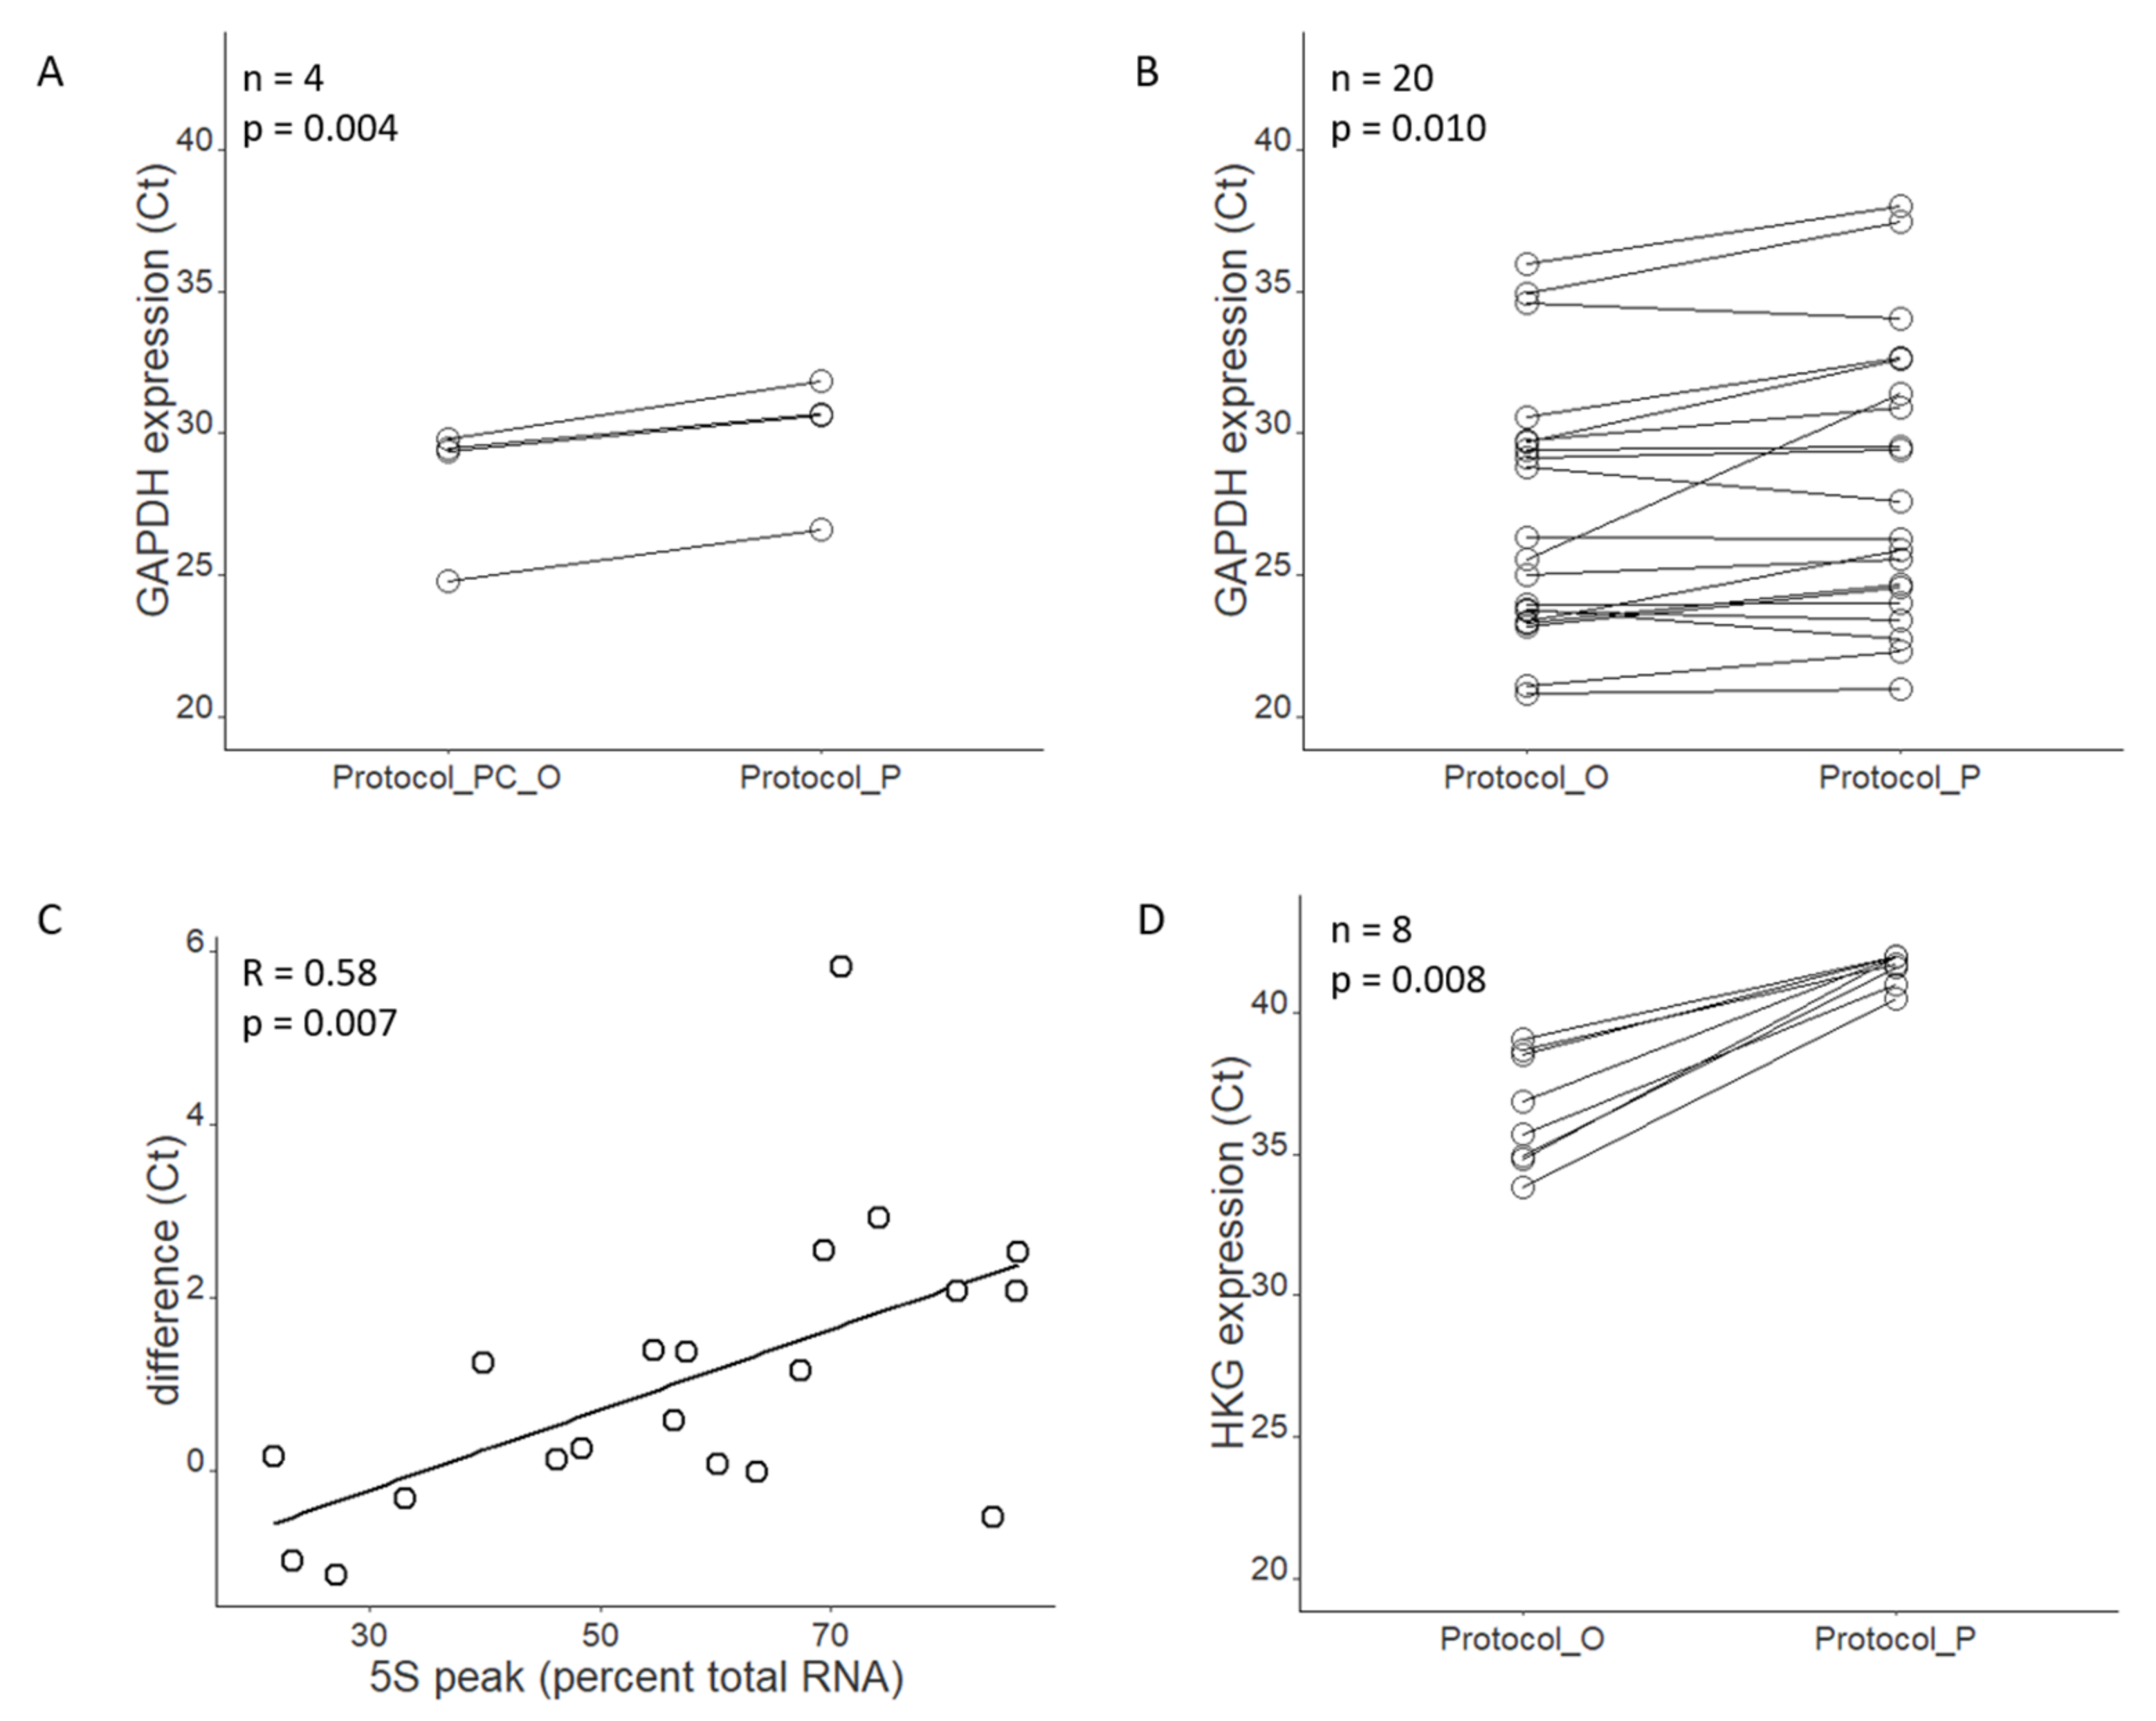
Figure 4.
DNA extracted with either protocol performs similarly in qPCR. (A) Comparison of threshold cycle (Ct) values; paired t-test. (B) Comparison of the qPCR reaction efficiency; Wilcoxon signed rank. HKG—housekeeping gene (internal control provided by the kit manufacturer).
Figure 4.
DNA extracted with either protocol performs similarly in qPCR. (A) Comparison of threshold cycle (Ct) values; paired t-test. (B) Comparison of the qPCR reaction efficiency; Wilcoxon signed rank. HKG—housekeeping gene (internal control provided by the kit manufacturer).


Table 1.
Number of samples that yielded at least 4 ng/µL RNA or DNA in the initial purifications with Protocol_O.
Table 1.
Number of samples that yielded at least 4 ng/µL RNA or DNA in the initial purifications with Protocol_O.
| Tissue of Origin | RNA | DNA |
|---|---|---|
| Breast | 24/44 | 39/44 |
| Colon | 23/24 | 24/24 |
| Testis | 1/4 | 4/4 |
| Rectum | 4/4 | 4/4 |
| Corpus uteri | 4/4 | 4/4 |
| Adrenal glands | 2/2 | 2/2 |
| Kidney | 2/2 | 2/2 |
Table 2.
Using phenol-chloroform extraction allows successful RNA isolation from samples, where RNA isolation by Protocol_O alone previously failed. RNA yield is given in ng/µL. BC—breast cancer tissue, CC—colon cancer tissue, I—isopentane, F—FlashFREEZE, N/A—the concentration was too low to be measured.
| Sample ID | Protocol_O (AllPrep #80204) | Protocol_PC+O (Phenol-Chloroform + AllPrep #80204) |
|---|---|---|
| BC1-I | N/A | 166.0 |
| BC1-F | N/A | 150.0 |
| CC1-I | N/A | 78.6 |
| CC1-F | 14.1 | 98.8 |
Table 3.
Purity of RNA and DNA isolated using various protocols, expressed as mean 260/280 ratio ± SD. The 260/280 ratio was only collected for samples whose concentration exceeded 2 ng/µL, and if the estimate was not available, the number of samples included in the analysis is given in brackets. Only two uterus samples were included, and in only two breast cancer samples (extracted with Protocol_O) the 260/280 was available; therefore, in these cases, separate values rather than mean ± SD are given.
| Tissue | Breast | Testis | Rectum | Colon | Corp Uteri | ||
|---|---|---|---|---|---|---|---|
| Protocol | |||||||
| RNA | O | 1.99, 2.13 (2/6) | 1.95 ± 0.08 (5/6) | 1.92 ± 0.04 (5/6) | 2.15 ± 0.27 (7/8) | 2.00; 2.03 n = 2 | |
| P | 1.94 ± 0.04 | 1.95 ± 0.03 | 1.98 ± 0.04 | 1.96 ± 0.06 | 1.98; 2.00 n = 2 | ||
| P+Q | 1.91 ± 0.09 | ||||||
| PC+O | 1.65 ± 0.31 | ||||||
| DNA | O | 1.80 ± 0.17 | 2.06 ± 0.25 | 1.83 ± 0.13 | 1.96 ± 0.14 | n = 2 1.97; 1.97 | |
| P | 1.66 ± 0.08 | 1.75 ± 0.14 | 1.76 ± 0.12 | 1.85 ± 0.13 | n = 2 1.82; 1.82 | ||
| P+Q | 1.67 ± 0.10 | ||||||
Table 4.
An example of RT-qPCR settings used for a testis sample, extracted either with Protocol_O or Protocol_P.
Table 4.
An example of RT-qPCR settings used for a testis sample, extracted either with Protocol_O or Protocol_P.
| Protocol_O | Protocol_P | |
|---|---|---|
| RNA yield (ng/µL) | 1.9 * | 108 |
| Amount used for cDNA synthesis (ng/reaction) ** | 11.5 | 11.5 |
| Volume used for cDNA synthesis (µL) | 6 | 0.1 *** |
| Ct value (GAPDH) | 29.7 | 30.9 |
* Approximate value; concentrations below 4 ng/µL cannot be measured using standard Qubit settings. ** Input amounts suggested by the manufacturer are in the range 3 pg to 3 µg. Same amount used in Protocol_O and Protocol_P. *** Sample had to be diluted prior to adding to the reaction mix.
Table 5.
Overview of the experiments performed and the number of samples used at each step.
| Total | Breast | Colon | Testis | Rectum | Uterus | Adr glands | Kidney | |
|---|---|---|---|---|---|---|---|---|
| Initial experiments with Protocol_O | 44 | 24 | 4 | 4 | 4 | 2 | 2 | |
| Control exp—confirming that PC+O protocol works | 2 | 2 | ||||||
| Optimization—comparison of 4 protocols | 6 | 6 | ||||||
| Verification—Protocol_O vs. Protocol_P | 22 | 8 | 6 | 6 | 2 | |||
| RNA integrity—Bioanalyzer | 28 | 6 | 8 | 6 | 6 | 2 | ||
| RT-qPCR (RNA)—Protocol_PC+O vs. Protocol_P | 4 | 4 | ||||||
| RT-qPCR (RNA)—Protocol_O vs. Protocol_P | 20 | 4 | 6 | 6 | 2 | 2 | ||
| Genomic DNA contamination exp—Protocol_O vs. Protocol_P | 8 | 2 | 2 | 2 | 2 | |||
| qPCR (DNA)—Protocol_O vs. Protocol_P | 10 | 2 | 2 | 2 | 2 | 2 |
Publisher’s Note: MDPI stays neutral with regard to jurisdictional claims in published maps and institutional affiliations. |
© 2022 by the authors. Licensee MDPI, Basel, Switzerland. This article is an open access article distributed under the terms and conditions of the Creative Commons Attribution (CC BY) license (https://creativecommons.org/licenses/by/4.0/).
Share and Cite
MDPI and ACS Style
Biskup, E.; Schejbel, L.; Oliveira, D.N.P.d.; Høgdall, E. Test of an Improved DNA and RNA Purification Protocol—Importance of Proteinase K and Co-Purified Small RNAs. Separations 2022, 9, 324. https://doi.org/10.3390/separations9110324
AMA Style
Biskup E, Schejbel L, Oliveira DNPd, Høgdall E. Test of an Improved DNA and RNA Purification Protocol—Importance of Proteinase K and Co-Purified Small RNAs. Separations. 2022; 9(11):324. https://doi.org/10.3390/separations9110324
Chicago/Turabian StyleBiskup, Edyta, Lone Schejbel, Douglas Nogueira Perez de Oliveira, and Estrid Høgdall. 2022. "Test of an Improved DNA and RNA Purification Protocol—Importance of Proteinase K and Co-Purified Small RNAs" Separations 9, no. 11: 324. https://doi.org/10.3390/separations9110324
Note that from the first issue of 2016, this journal uses article numbers instead of page numbers. See further details here.