Article

Gas Chromatography—High-Temperature Proton-Transfer Reaction Mass Spectrometry as a Novel Tool for Forensic Drug Testing

1
Institute of Legal Medicine and Core Facility Metabolomics, Medical University of Innsbruck, 6020 Innsbruck, Austria
2
IONICON Analytik, 6020 Innsbruck, Austria
*
Author to whom correspondence should be addressed.
Separations 2022, 9(11), 328; https://doi.org/10.3390/separations9110328
Submission received: 10 September 2022 / Revised: 6 October 2022 / Accepted: 9 October 2022 / Published: 26 October 2022
(This article belongs to the Special Issue Feature Papers in Separations from Editorial Board Members)

Abstract

:
Proton-transfer reaction mass spectrometry (PTR-MS) is a versatile tool for the mass spectrometric analysis of organic molecules in gaseous samples. Due to its operation principle, PTR-MS is a soft ionization technique generating spectral data typically rich in protonated molecule information. Most of the currently reported PTR-MS applications are designed to determine volatile compounds. Herein, we present a redesigned instrumental setup termed “high-temperature (HT)-PTR-MS” with improved capabilities for the analysis of low-volatile compounds. The developed HT-PTR-MS prototype was successfully hyphenated with gas chromatography (GC) to enable qualitative and quantitative analysis of licit and illicit drugs in human blood/plasma samples. Different kinds of spiked and authentic samples were used to evaluate the performance of the GC-HT-PTR-MS in forensic drug testing. Benchmarking against GC-MS with electron ionization demonstrated the improved detection capabilities of GC-HT-PTR-MS in screening applications. On average, one order of magnitude lower limits of detection/identification were reached. Clearly, GC-HT-PTR-MS has the vast potential to complement or even replace established mass spectrometric techniques in forensic drug analysis.

1. Introduction

Proton-transfer reaction mass spectrometry (PTR-MS) is a versatile analytical technique developed almost exclusively for the detection of volatile organic compounds [1,2,3]. PTR-MS was first introduced in the mid-1990s [4] and has seen an enormous growth in use in the past decades [5,6,7,8]. The modus operandi of PTR-MS is the chemical ionization, by proton transfer, of a gas sample inside a chemical ionization reactor (“drift tube”). The proton source is normally H3O+. In the most widely used type of PTR-MS instruments, air is directly introduced into the reactor via an inlet capillary system. The reactor has a volumetric exchange time of ~0.1 s enabling standard PTR-MS analyzers to measure at a frequency of 10 Hz [9].
PTR-MS is perfectly suited for online and real-time measurements of trace-level volatile organic compounds in gaseous samples. Performance, however, deteriorates if “sticky” or low-volatility analytes are analyzed that readily adsorb or condense onto surfaces [9,10]. The combination of a low sampling flow through the drift tube (15–20 mL/min), stainless steel surfaces in the inlet and in the drift tube, and a relatively low maximum continuous operating temperature (120 °C) promote surface losses and memory effects. To overcome these limitations, we present a redesigned instrumental setup termed “high-temperature (HT)-PTR-MS”. Modifications included (1) replacement of the drift tube by a high-temperature-sintered stacked ensemble of alternating Kovar and ceramic rings including new manufactured in- and outlet rings, (2) passivation of the drift section with a chemical vapor deposition process, and (3) installing new heating capabilities in the transfer, inlet, and drift chamber regions. With the improved capabilities of HT-PTR-MS in the analysis of semi-volatile compounds, this technique has the vast potential to become a versatile detection method for gas chromatography (GC).
In GC-MS, electron ionization (EI) is the most commonly applied ionization technique. EI is regarded a hard ionization technique giving rise to extensive fragmentation. The total number of molecules is distributed between multiple fragmentation reactions, which has a negative effect on detection sensitivity, and for many compounds the highly diagnostic molecular ion is often absent. To overcome these limitations of EI, atmospheric pressure ionization techniques were developed [11,12] that enable ionization at low energy (soft), generating spectral data typically rich in molecular or protonated molecule information.
With this proof-of-concept study, we introduce HT-PTR-MS as a potentially useful soft ionization method for GC-MS applications. The opportunities and currently existing limitations of the hyphenated method for the analysis of low-volatile organic compounds are evaluated using forensic drug analysis as an example application. Workflows are presented that enable the qualitative and quantitative analysis of important licit and illicit drugs in human blood/plasma samples. For benchmarking, established and routinely applied GC-EI-MS and liquid chromatography-tandem mass spectrometry (LC-MS/MS) workflows are used.

2. Materials and Methods

2.1. Chemicals

Methanol, acetonitrile, water, and ethyl acetate were purchased from Honeywell (Seelze, Germany). Formic acid, acetic anhydride, and pyridine were purchased from Sigma-Aldrich (St. Louis, MO, USA). Silyl-991 was purchased from Macherey-Nagel (Düren, Germany).
Reference standards of drugs were provided by Lipomed (Arlesheim, Switzerland), Cerilliant (Round Rock, TX, USA), or Sigma-Aldrich. Detailed information on the compounds is provided in Supplementary Material Tables S1 and S2.
The following isotopically labelled analogues were used as internal standards: amphetamine-D3, 3,4-methylenedioxyamphetamine (MDA)-D5, 3,4-methylenedioxymethamphetamine (MDMA)-D5, methamphetamine-D5, cocaine-D3, methadone-D3, Δ9-tetrahydrocannabinol (THC)-D3, codeine-D6, dihydrocodeine-D3, 2-ethylidene-1,5-dimethyl-3,3-diphenylpyrrolidine (EDDP)-D3, 6-O-acetylmorphine (6-AM)-D6, and morphine-D3 These standards were obtained either from Lipomed or Cerilliant.

2.2. Samples

A pooled plasma sample was kindly donated by the blood bank of the Medical University of Innsbruck (Innsbruck, Austria). This blank plasma sample was used to prepare samples spiked with reference standards at different concentration levels for evaluating the capabilities of GC-HT-PTR-MS in qualitative and quantitative drug analysis. For determining the limits of identification of 106 compounds, blank plasma samples were donated with the corresponding reference standards at 1.0 ng/mL, 2.5 ng/mL, 5.0 ng/mL, 10 ng/mL, 25 ng/mL, 50 ng/mL, 100 ng/mL, and 250 ng/mL. Quantitative analysis was accomplished for MDA, MDMA, amphetamine, methamphetamine, cocaine, THC, methadone, EDDP, morphine, codeine, and dihydrocodeine employing isotopically labelled analogues as internal standards (22 ng/mL each). Blank samples spiked with 5.0 ng/mL, 10 ng/mL, 25 ng/mL, 50 ng/mL, 100 ng/mL, 250 ng/mL, and 500 ng/mL of each compound served as calibration standards.
Authentic blood samples (N = 20) were collected as evidence in forensic casework at the Institute of Legal Medicine of the Medical University of Innsbruck during autopsies. Plasma samples were obtained by separating the liquid layer form cellular material from the lighter via centrifugation (20 °C, 5 min, 8000× g). All samples were stored at −20 °C until analysis.
For cocaine analysis, blood/plasma samples were stabilized with the pseudocholinesterase inhibitor sodium fluoride to inhibit enzymatic hydrolysis.

2.3. Extraction and Sample Processing

Solid-phase extraction (SPE) with STRATA-X columns (200 mg/3 mL, Phenomenex, Aschaffenburg, Germany) was used for sample processing. The cartridges were equilibrated with two times 750 µL acetonitrile/formic acid (v/v; 98/2), 2 mL methanol, and 2 mL water. After the application of the 900 µL sample, the cartridges were washed with 3 mL water and 2 mL MeOH/water (v/v; 5/95) and dried for 20 min. Two times 750 µL acetonitrile/formic acid (v/v; 98/2) were used for elution. The eluate was then split into three fractions (500 µL each) and evaporated to dryness at room temperature employing a stream of nitrogen. The first fraction was reconstituted in 30 µL ethyl acetate. The second fraction was reconstituted in 50 µL pyridine and in 100 µL acetic anhydride. The solution was kept at 60 °C for one hour before evaporation to dryness (nitrogen, room temperature). The residue was reconstituted in 30 µL ethyl acetate. The third extract was reconstituted in 50 µL acetonitrile and 50 µL Silyl-991 and kept at 60 °C for 30 min. The extract was evaporated (nitrogen, room temperature) to dryness and reconstituted in 30 µL of ethyl acetate. All three fractions were submitted to GC-HT-PTR-MS analysis.

2.4. Instrumental Setup and Settings

A schematic drawing of the developed GC-HT-PTR-MS setup is shown in Figure 1.
Chromatographic separations were accomplished on an AutoSystem XL GC (Perkin Elmer, Waltham, MA, USA) using a DB-5 (Agilent Technologies, 30 m × 0.530 mm, film thickness: 0.25 µm) column as the stationary phase and nitrogen as the mobile phase. The carrier gas flow rate was set to 15 mL/min. The injection volume was 3.0 µL (splitless). The injection temperature was 250 °C. The column oven was held at 60 °C for 2 min and the temperature was increased by 25 °C/min steps to 300 °C and held for 8 min. Instrumental control was accomplished with TotalChrom Workstation software (Perkin Elmer).
The chromatographic system was hyphenated to a modified HT-PTR-MS system (PTR-TOF 4000, Ionicon, Innsbruck, Austria). A 50 cm long 0.32 mm i.d. Siltek Guard Column (Restek, Bellefonte, PA, USA) served as the transfer line. The guard column was heated with a custom-made heating hose (Hasfeld Industrie-Heizungen, Waghäusel, Germany). A deactivated fused silica tubing (5 cm length, 1/32” o.d., 200 µm i.d., Polymicro Technologies, Phoenix, AZ, USA) was used to connect the transfer line with the drift tube.
The inlet system of the PTR-TOF system was rebuilt to cope optimally with high temperatures to be applied. Firstly, the original drift chamber was replaced by a high-temperature-sintered stacked ensemble of alternating Kovar and ceramic rings (26/24 pieces), including newly manufactured in- and outlet rings. The sintered drift chamber had a length of 9.4 cm and an i.d. of 1.2 cm. Secondly, the whole drift section was passivated with a chemical vapor deposition process. Thirdly, the inlet and the drift chamber were equipped with additional heating capabilities so that for those sections the temperatures could be adjusted individually.
Settings of the PTR-MS were optimized toward the highest sensitivity, a low fragmentation, and a minimal peak dispersion. The temperatures were set to 240 °C for the transfer line, 200 °C for the transfer region, and 150 °C for the drift chamber. For a drift tube chamber pressure of 3.5 mbar, 30 mL/min of nitrogen was added to 15 mL/min GC flow via a T-piece. The applied drift voltage of 350 V resulted in a reduced electric field (E/N, with E being the electric field strength and N the gas number density) of 63 Townsend (Td, 1 Td = 10−17 Vcm2).
The scan range was m/z 15–700 with an accumulation time of 100 ms. The mass resolution was 4000 (full width at half maximum, FWHM).
Instrumental control and data acquisition were accomplished with ioniTOF software (Ionicon). For data visualization, including the extraction of selected ion chromatograms at the m/z of target ions (window size ± 0.1), PTR-MS Viewer (Ionicon) and IONICON Trace Analyzer (Ionicon) were used.

2.5. Other Workflows Used

Detailed descriptions of the qualitative and quantitative workflows used to benchmark GC-HT-PTR-MS in forensic drug analysis are provided in the Supplementary Material.

3. Results and Discussion

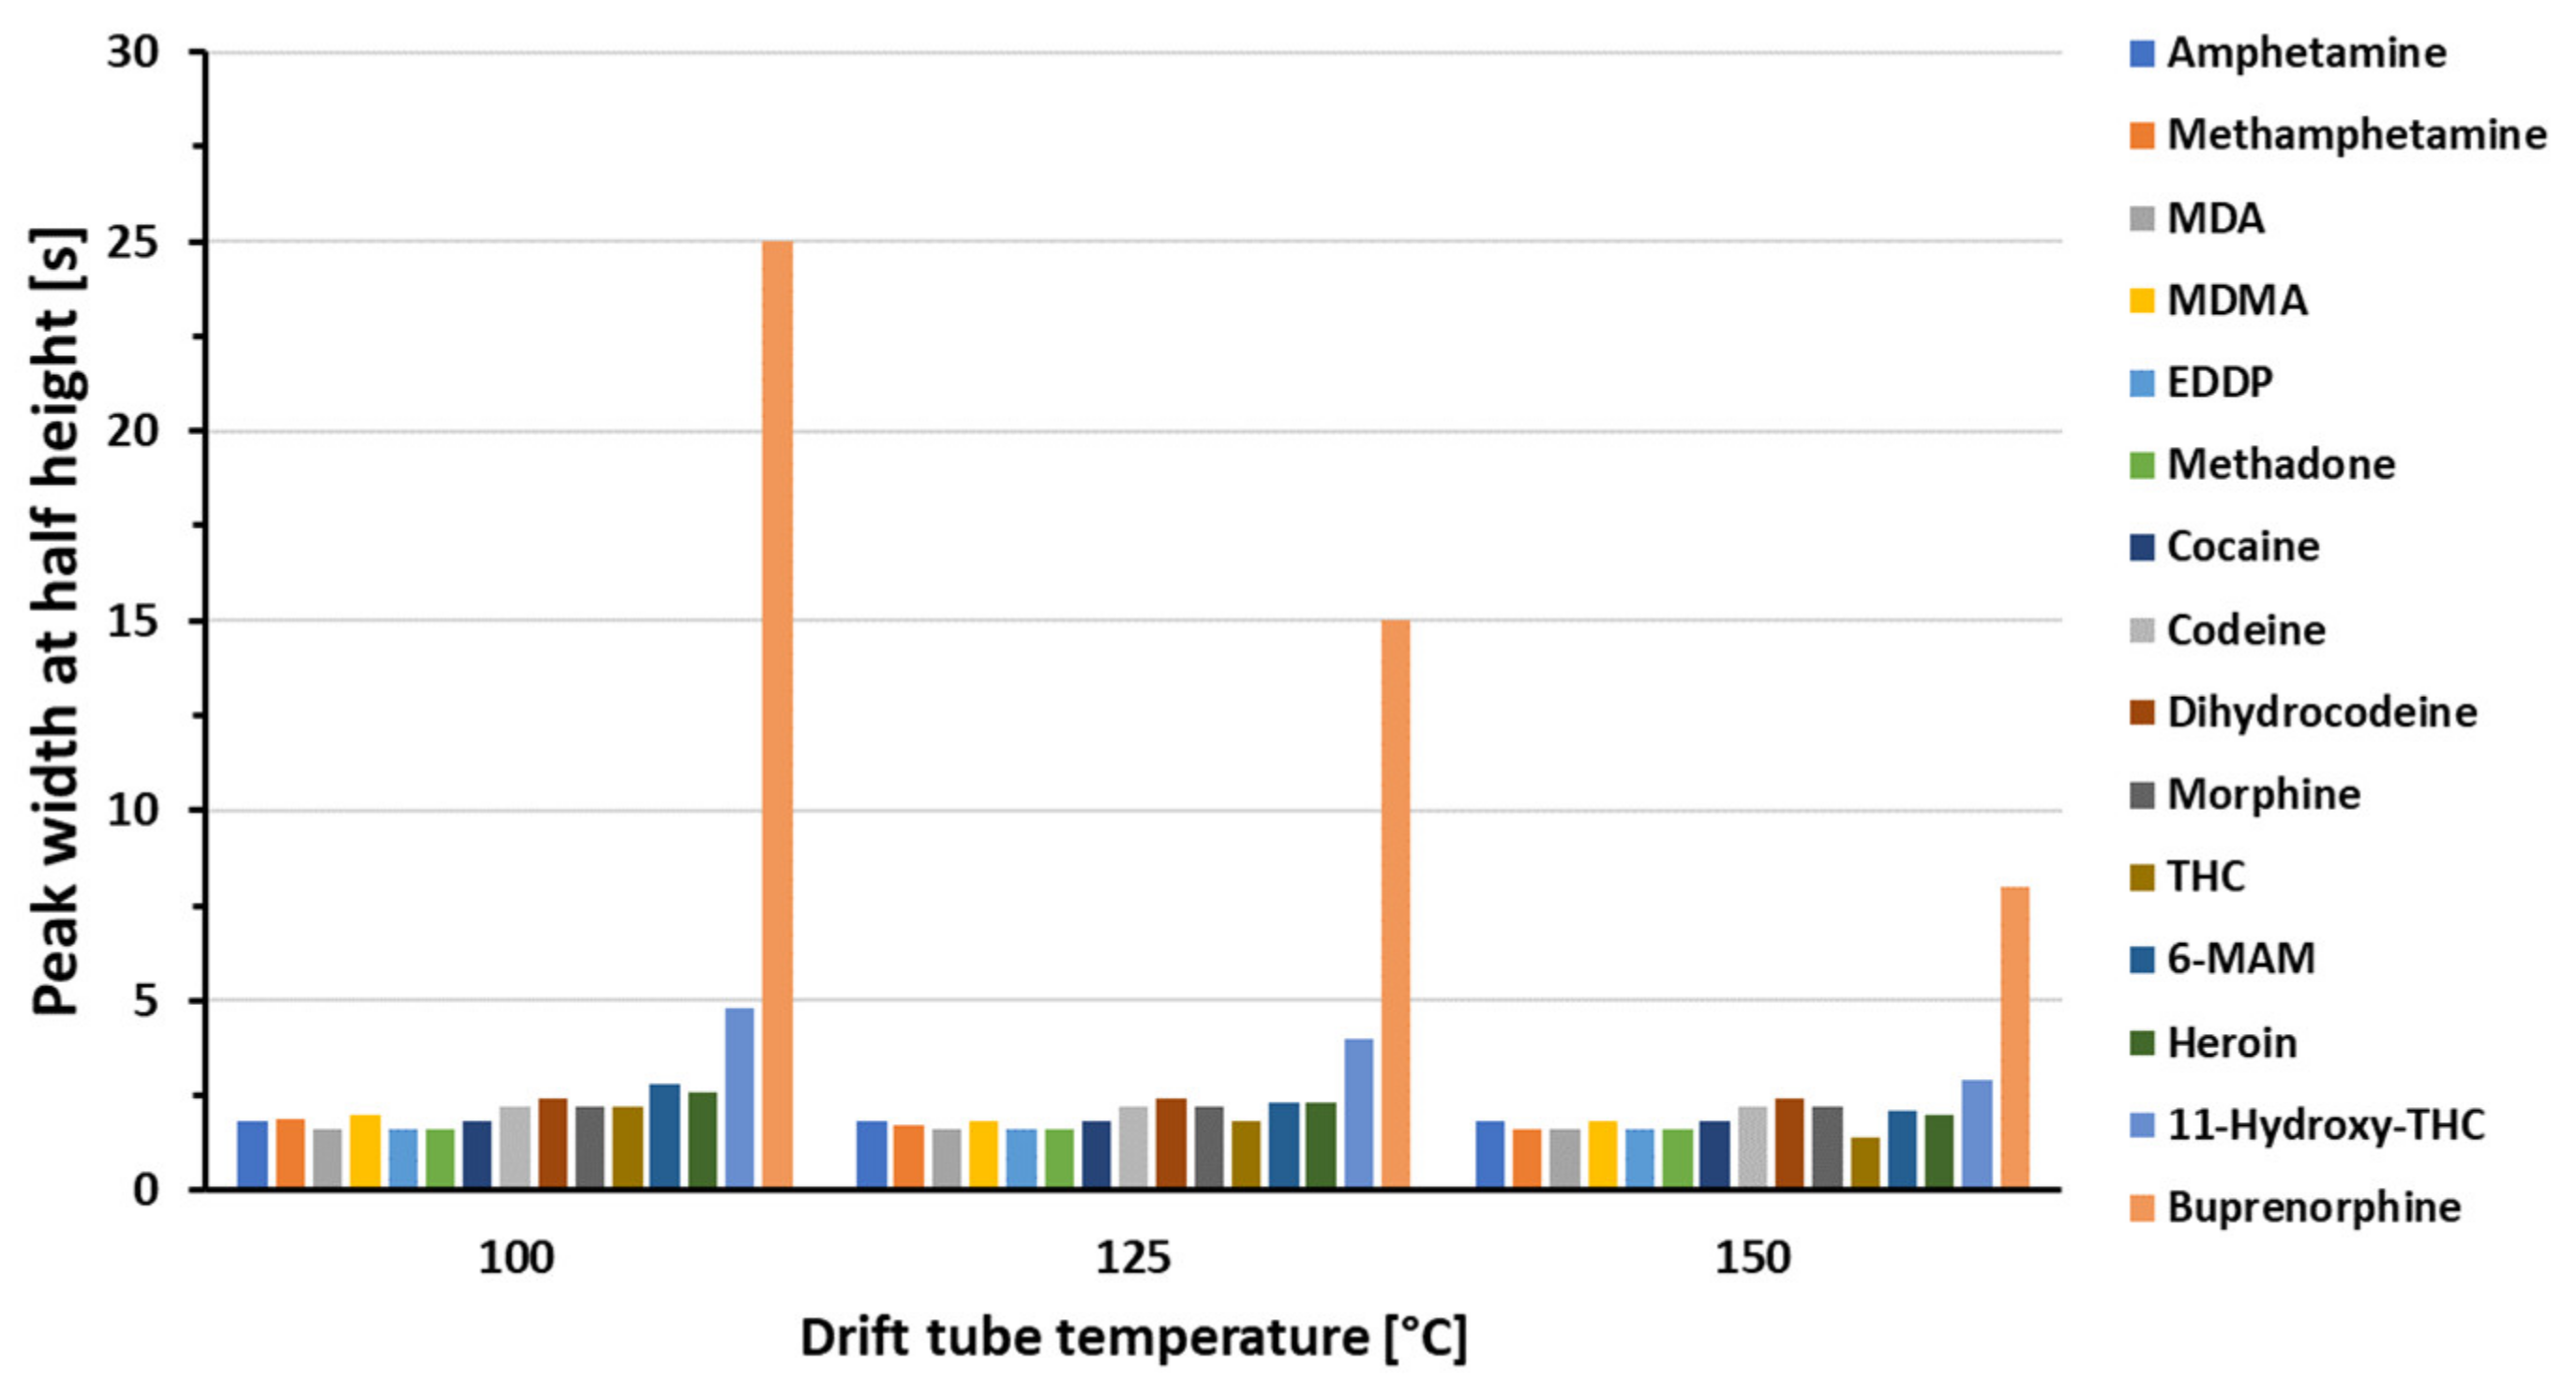
3.1. Optimization of the GC-HT-PTR-MS Setup

Several instrumental parameters with an impact on the achieved chromatographic and/or mass spectrometric performance (i.e., temperatures in the transfer region, the inlet region and the drift tube; drift tube chamber pressure; reduced electric field strength) were optimized employing a mixture of 15 drug compounds commonly observed in forensic drug testing. The test compounds included amphetamine, methamphetamine, MDA, MDMA, EDDP, methadone, cocaine, codeine, dihydrocodeine, morphine, THC, 6-MA, heroin, 11-hydroxy-THC, and buprenorphine. The compounds were analyzed in their native form and detected as protonated molecular ions.
Representative extracted ion chromatograms of the compounds included in the test mixture are shown in Figure 2. The compounds eluted between 5.2 and 14.2 min, which equals to column oven temperatures ranging 140–300 °C; amphetamine eluted first and buprenorphine last. The peak widths at half height (b0.5) ranged from 1.4 to 2.9 s for all compounds except buprenorphine, which eluted in a broader peak (b0.5 = 8.0 s).
Cold spots in the transfer region, the inlet region or the drift tube can have a negative effect on chromatographic performance. Operating these parts of the instrument at elevated temperatures is of utmost importance to prevent peak broadening. The temperatures of the different regions were controlled independently from one another. The maximum temperature of the column oven was 300 °C. The transfer line, the transfer region, and the drift tube were heated to 240 °C, 200 °C, and 150 °C, respectively. These were the maximum temperatures obtainable with the current instrumental setup.
To exemplify the impact of lower temperatures on chromatographic performance, the impact of three different drift tube temperatures on b0.5-values were investigated. The results obtained for amphetamine, cocaine, heroin, 11-hydroxy-THC, and buprenorphine are shown in Figure 3. A significant deteriorating effect of the drift tube temperature on peak width was observed for the late eluting compounds. For instance, reducing the temperature from 150 °C to 100 °C, increased the b0.5-values of buprenorphine from 8.0 to 25 s and the b0.5-values of 11-hydroxy-THC from 2.9 to 4.8 s. Changes of the peak widths observed for other test compounds (i.e., heroin, 6-AM, THC) were smaller than 1.0 s.
A parameter with an impact on mass spectrometric performance is the drift tube chamber pressure. For reaching an optimal drift tube chamber pressure of 3.5 mbar [13], 30 mL/min of make-up gas was added to 15 mL/min of GC flow via a T-piece. Nitrogen served as the make-up gas.
To exemplify the impact of the make-up gas flow on mass spectrometric performance, the impact of four different flow rates were investigated. The results obtained are summarized in Figure 4. Reduced flow rates led to reduced peak heights for all compounds tested. The peak height decreased linearly with decreasing flow rate. At 10 mL/min, 55 ± 13% of the initial peak heights were observed.
Another parameter with an impact on mass spectrometric performance is the reduced electric field strength applied in the drift tube. Decreasing E/N increases the likelihood of cluster formation. Increasing the electric field in the drift tube increases the kinetic energy, which may lead to increased product ion formation. Cluster formation and fragmentation might be of analytical advantage for the differentiation of isobaric and isomeric species.
For 9 out of 15 compounds tested, fragmentation reactions were observed, including loss of H2O (buprenorphine, 11-hydroxy-THC, dihydrocodeine, codeine and morphine), loss of C2H4O2 (heroin and 6-AM), and loss of NH3 (amphetamine and MDA). At E/N of 62.5 Td, the relative abundances of the fragment ions in comparison to the corresponding protonated molecular ions ranged from 15–200%. Increasing E/N to 80.2 Td and 98.0 Td, respectively, by changing the drift voltage had hardly any effect on the relative abundances of the fragment ions. Only, more extended deamination was observed (Figure 5).
Despite considerable success in analyzing semi-volatile organic molecules with the developed prototype, peak tailing discernible on the bases of all peaks (Figure 2) indicated the presence of chemical interactions with surfaces of cold spots and/or of unswept volumes within the mass spectrometric system. As this effect was most pronounced for the early eluting primary and secondary amines (i.e., amphetamine, MDA, methamphetamine, MDMA), it is very likely that chemical interactions are the guiding factors for the observed tailing.

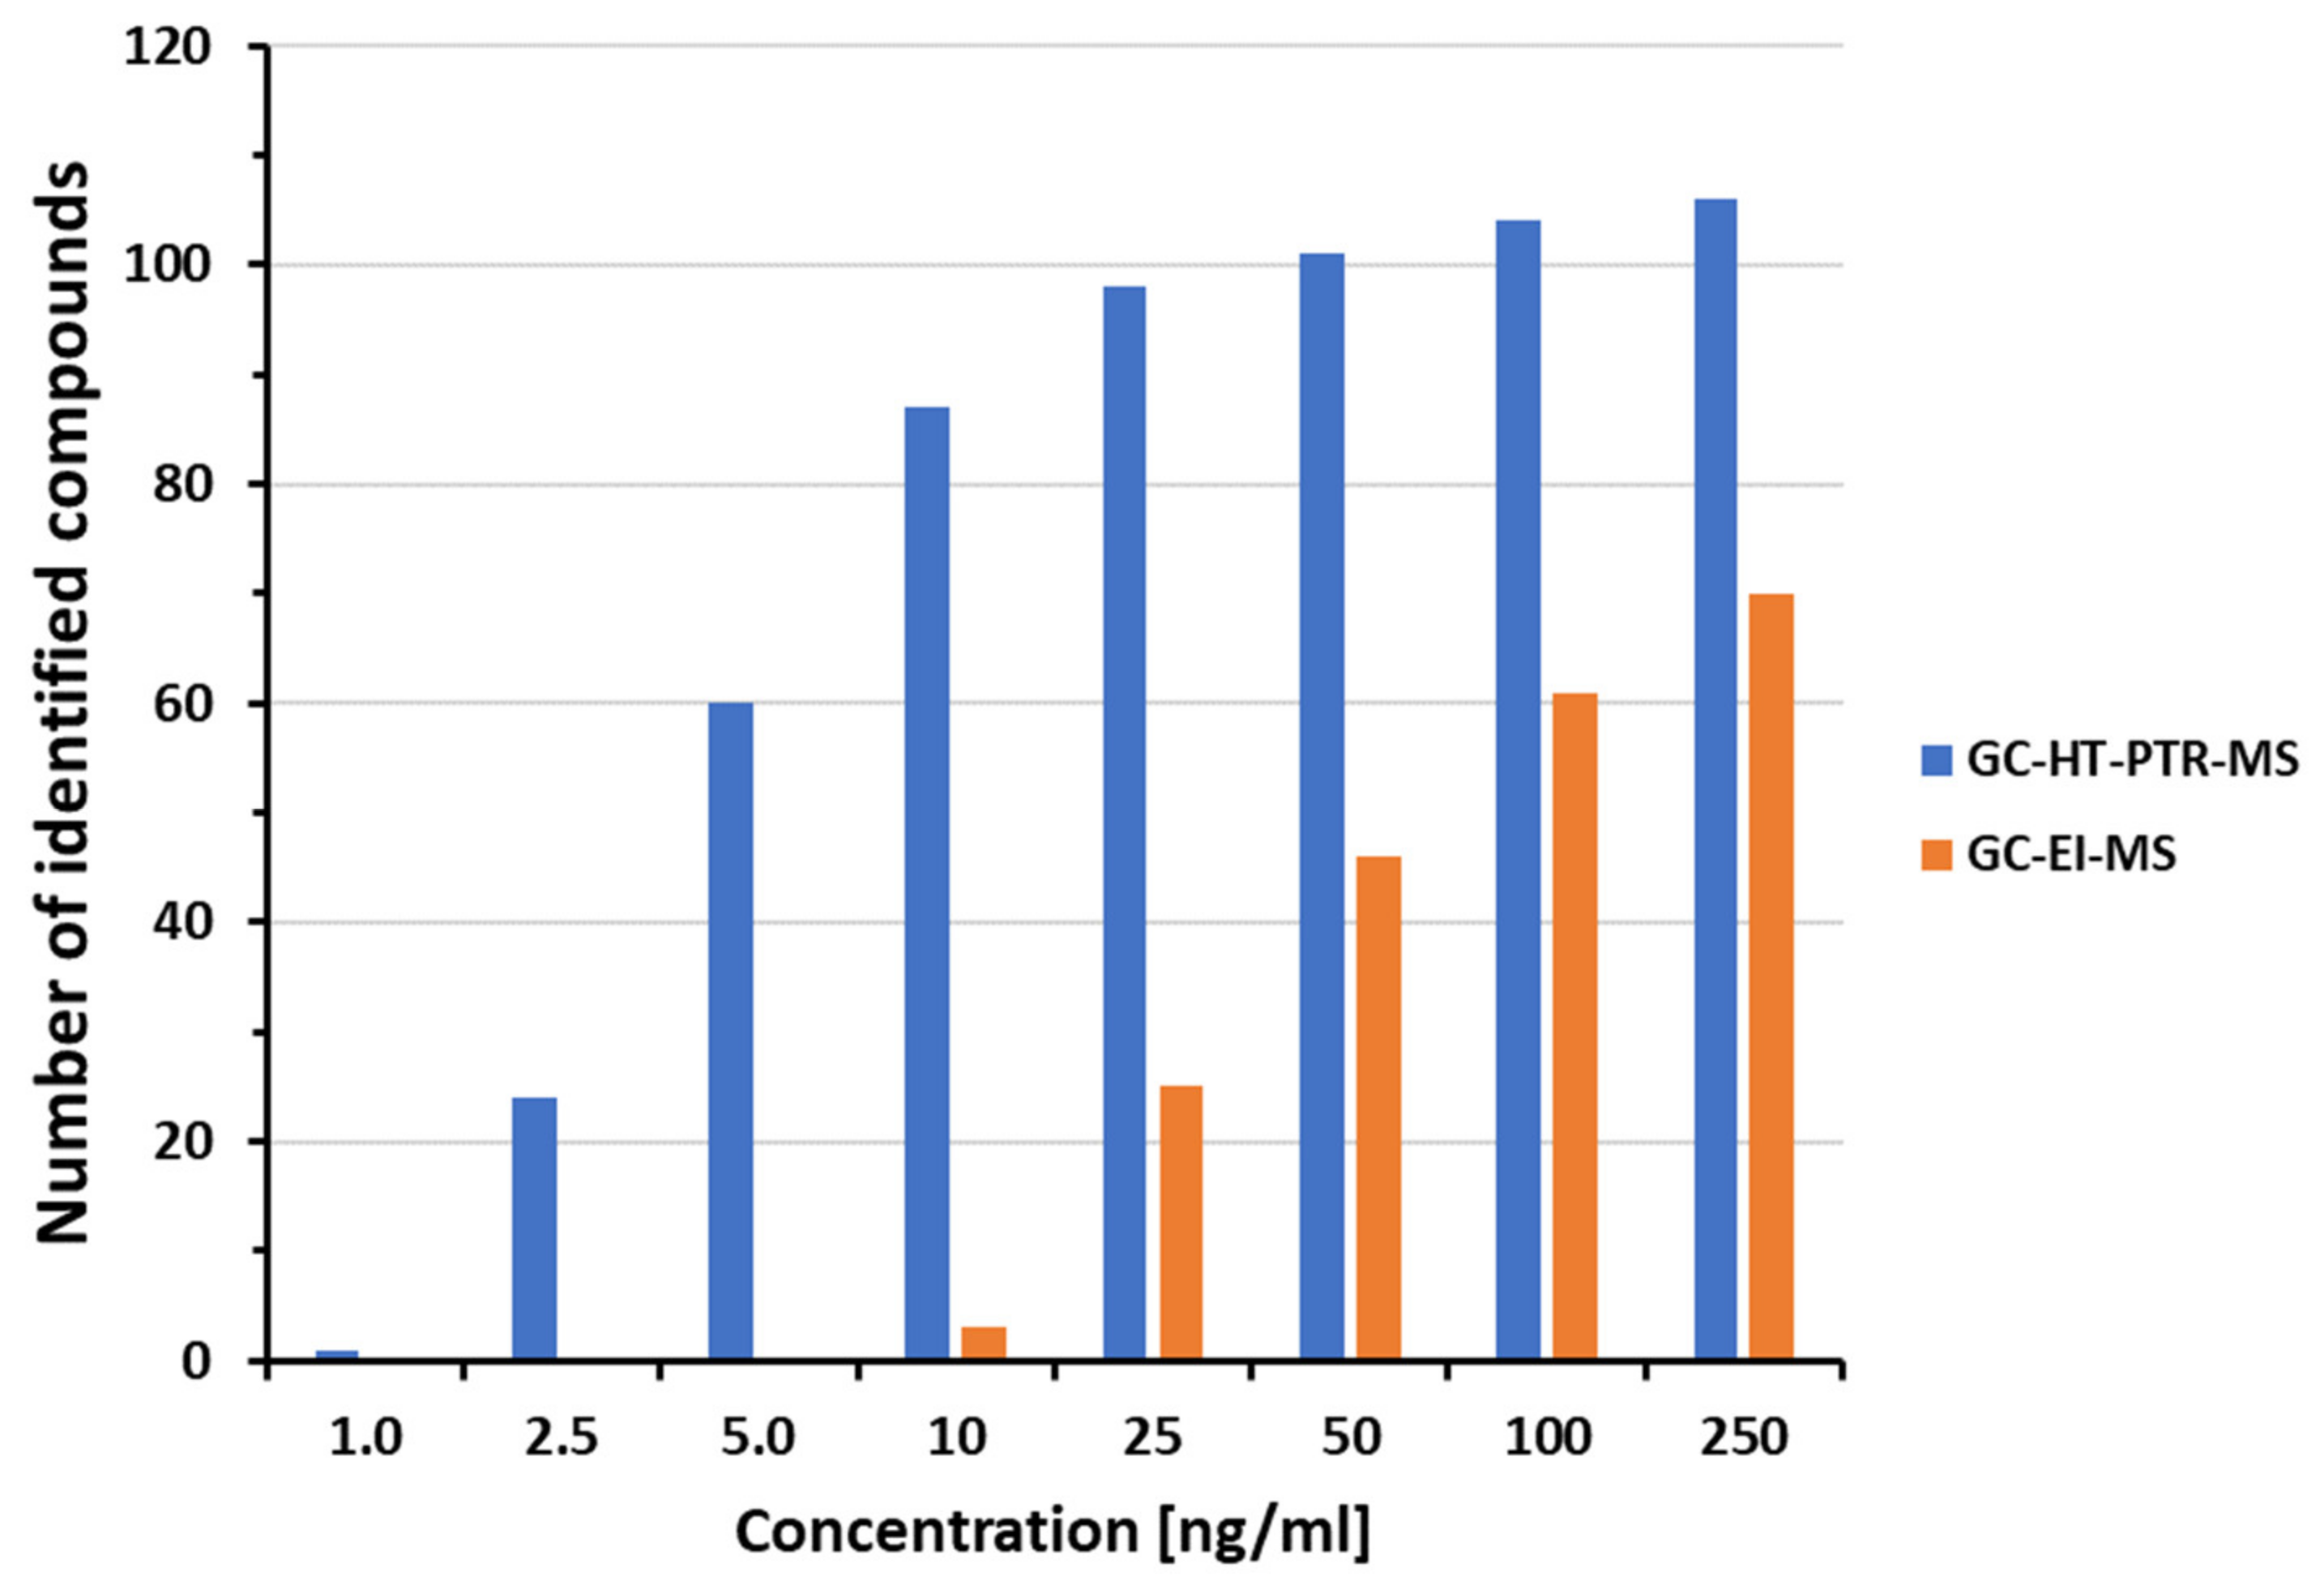
3.2. Forensic Drug Screening

The efficient chromatographic and mass spectrometric detection of semi-volatile compounds is a prime requisite for the application of GC-HT-PTR-MS to forensic toxicology, which involves qualitative and quantitative drug analysis.
For qualitative analysis of blood/plasma samples, a suspect screening workflow was developed. The workflow involved different steps of sample preparation, non-targeted analysis, and compound identification.
Samples were submitted to solid-phase extraction employing a mixed mode material. The obtained eluate was split into three fractions to enable analysis of all compounds in their native as well as acetylated and trimethylsilylated forms. Particularly, for low-volatile and thermally labile compounds, derivatization was of analytical advantage to reach low limits of detection.
Data acquisition in GC-HT-PTR-MS is inherently non-targeted, as it involves full scan monitoring. The scan range applied was m/z 15–700, which is sufficiently large to enable detection of a considerable number of drug compounds and their derivates that are amenable to GC analysis.
In HT-PTR-MS, compounds are primarily detected as their protonated molecular ions. In some cases, abundant fragment ions and or isotopic peaks are observed as well. Compound identification is based on the assignment of features consisting of all these compound-specific m/z-values and retention time information to the corresponding reference values. The reference values can be stored in libraries.
For evaluation of the detection capabilities of the developed workflow as well as for the generation of a small reference library, blank serum samples fortified with 106 reference standards at 8 different concentration levels ranging from 1.0 ng/mL to 250 ng/mL were analyzed. A detailed list of the compounds included in this study is provided in Supplementary Material Table S1. For each compound, the lowest concentration level enabling its detection in one of the three fractions analyzed was called limit of identification (LOI). For benchmarking the results obtained with GC-HT-PTR-MS, experiments were repeated with GC-EI-MS as the analytical technique. A comparison of the compounds detected with the two screening techniques at the investigated concentration levels is shown in Figure 6. On average, the newly developed GC-HT-PTR-MS technique reached one order of magnitude lower LOI-values than the GC-EI-MS screening technique routinely applied in forensic toxicology.
If the chromatographic performance would be considered as the only factor responsible for the achievable detection sensitivity, then GC-EI-MS should outperform GC-HT-PTR-MS. Due to the following reasons the GC-EI-MS technique offers a better chromatographic performance than the GC-HT-PTR-MS technique: (1) a column with a smaller i.d. was used, (2) the i.d.-corrected injection volume was slightly larger, (3) the flow rate was much closer to its optimum value, and (4) extra-column band broadening issues were less pronounced. As comparably lower LOIs were achieved with GC-HT-PTR-MS than with GC-EI-MS, the guiding factor seems to be improved mass spectrometric detection, which might be related to a higher ion yield and limited distribution between multiple ion species.
To evaluate potential carryover of sticky compounds, blank samples were analyzed after the fractions with the highest concentration (250 ng/mL). In the samples, none of the 106 reference standards was detected. Thus, carryover seems to be a minor problem for the developed GC-HT-PTR-MS technique.
The developed GC-HT-PTR-MS workflow was applied for drug screening in authentic samples. The 20 samples analyzed were collected by members of the casework unit during autopsies. The obtained results were benchmarked against the outcome of screening with a non-targeted LC-MS/MS workflow involving compound identification by suspect screening in tandem mass spectral libraries [14,15,16,17].
Importantly, the retention time library available for compound annotation with GC-HT-PTR-MS covered 106 compounds only. To avoid a biased comparison, the library was extended by analyzing 27 reference standards of drug-related compounds detected by LC-MS/MS screening (Supplementary Material Table S2).
The total number of annotated drug-related compounds obtained with the 2 analytical workflows applied for drug screening was 199. A total of 138 compounds (69.3%) were identified with GC-HT-PTR-MS and 186 compounds (93.5%) with LC-MS/MS. In total, 125 annotations (62.8%) were obtained with both methods applied, 13 (6.5%) with GC-HT-PTR-MS and 61 (30.7%) with LC-MS/MS only.
With regard to a possible combined use with LC-MS/MS screening, GC-HT-PTR-MS screening seems to represent a confirmatory and complementary method. Performance differences are mainly attributable to the fact that at the current stage of development for the majority of tested drug compounds LC-MS/MS can reach lower LOI-values than GC-HT-PTR-MS (Supplementary Material Figure S1). Of the 106 test compounds included in the retention time library, for instance, 69 compounds (65.1%) were detected with LC-MS/MS at significant lower concentration levels than with GC-HT-PTR-MS. For only 14 compounds (13.2%), GC-HT-PTR-MS provided an improved detection sensitivity. Particularly compounds with low-ionization efficiency in positive electrospray ionization (i.e., propofol, naproxen, ibuprofen, thiopental, and pentobarbital) were preferentially detected [18,19].

3.3. Quantitative Drug Analysis

To demonstrate the applicability of GC-HT-PTR-MS for quantitative drug analysis, a multianalyte method was developed. The targeted compounds are listed in Table 1. Isotopically labelled analogues were used as internal standards. Peak areas were obtained from target-specific selected ion chromatograms. The obtained data were used to build calibration curves by taking the peak area ratio for each compound to internal standard versus the concentration of the sample. Unweighted linear, least squares regression models were chosen to fit the calibration curves with the accuracy (bias) and precision data in the required acceptances limits (bias, ±15%, precision, 15%, Table 1). The observed limits of quantification (LOQs) ranged from 5–25 ng/mL. Thus, for all compounds except THC and 6-AM, for which lower detection limits were requested, the method was found to be fit for application in forensic-toxicological analysis.
A total of 10 authentic casework samples were quantified with the developed GC-HT-PTR-MS workflow. Validated GC-EI-MS workflows served as reference methods for benchmarking. The obtained results are summarized in Table 2. Nineteen compounds were detected. Fifteen compounds were quantified. For all except one compound, the differences between the measured concentrations was within ±15%. A bias of −35.3% was observed only for dihydrocodeine in sample 1.

4. Conclusions

In this proof-of-concept study, GC-HT-PTR-MS is presented as a novel analytical technique for the analysis of semi-volatile compounds, with a special emphasis on licit and illicit drugs. To enable high-performance detection of gas chromatographically separated analytes, a HT-PTR-MS system was developed. In this setup, a newly designed and more chemically inert drift chamber in combination with elevated temperatures in the transfer-, inlet-, and ionization regions was used to minimize extra column peak broadening.
With the presented inventions, current limitations of PTR-MS technology with regard to the analyzability of semi-volatile compounds were overcome rendering PTR-MS a reasonable alternative to EI for GC-MS.
HT-PTR-MS is a soft ionization technique, primarily producing protonated molecular ions. Fragmentation in the drift tube occurs, but this is usually limited to a few preferred fragmentation channels only (e.g., loss of H2O or NH3). In the current form, extensive and comprehensive structure elucidation is not supported, and compound annotation mainly relies on retention time and intact molecular mass matching.
As with any other GC-based technique, GC-HT-PTR-MS suffers from the problem that only volatile and thermally stable compounds are amenable to chromatographic analysis. Often laborious and time-consuming derivatization steps are needed to convert analytes in suitable forms.
The developed GC-HT-PTR-MS instrument was a prototype that performed well for the qualitative and quantitative analysis of drug compounds. Especially for screening applications, the detection sensitivity was considerably improved in comparison to GC-EI-MS. Thus, GC-HT-PTR-MS has the vast potential to act as a confirmatory and complementary method for LC-MS/MS-based drug screening.

Supplementary Materials

The following supporting information can be downloaded at: https://www.mdpi.com/article/10.3390/separations9110328/s1, Figure S1: Comparison of the detection capabilities obtained for 106 reference compounds with GC-HT-PTR-MS and LC-MS/MS; Table S1: Reference compounds used for determining the detection capabilities of GC-HT-PTR-MS; Table S2: Reference compounds used for additional compound annotation in plasma samples; Table S3: Overview of quantifier and qualifier ions used for quantitative drug analysis with GC-electron ionization-MS.

Author Contributions

Conceptualization, H.O., R.G., K.W. and F.P.; methodology, H.O., R.G., K.W. and F.P.; validation, V.R. and F.P.; formal analysis, V.R. and F.P.; investigation, V.R. and F.P.; resources, F.P., R.G. and K.W.; writing—original draft preparation, V.R. and H.O.; writing—review and editing, all authors; visualization, V.R. and H.O.; supervision, H.O. and R.G.; project administration, H.O. and R.G.; funding acquisition, H.O. and R.G. All authors have read and agreed to the published version of the manuscript.

Funding

This research received funding from the TIROLER INNOVATIONSFÖRDERUNG, grant number wa-540-02-00496/01-0018.

Data Availability Statement

Not applicable.

Acknowledgments

We want to thank the members of the casework unit at the Institute of Legal Medicine (Medical University of Innsbruck) for their assistance. The support and help of Philipp Sulzer, Daniel Gunsch, and Johann Seehauser at IONICON Analytik is acknowledged. The input of ‘Wolf Fertigungs- und Fügungstechnik’ (Wildermieming, Austria) in the form of instrumental components is very much appreciated. Finally, we want to thank Josef Krautgasser for his support with GC instrumentation.

Conflicts of Interest

R.G. and K.W. are employees of IONICON Analytik. IONICON is the manufacturer of the PTR-TOF 4000 which is the basis of the prototype developed and utilized in this study.

References

  1. Blake, R.S.; Monks, P.S. Proton-Transfer Reaction Mass Spectrometry. Chem. Rev. 2009, 109, 861–896. [Google Scholar] [CrossRef] [PubMed]
  2. Hartungen, E.; Jürschik, S. Proton transfer reaction-mass spectrometry: Fundamentals, recent advances and applications. Eur. Phys. J. Appl. Phys. 2013, 61, 24303. [Google Scholar] [CrossRef]
  3. Yuan, B.; Koss, A.R. Proton-transfer-reaction mass spectrometry: Applications in atmospheric sciences. Chem. Rev. 2017, 117, 13187–13229. [Google Scholar] [CrossRef] [PubMed]
  4. Hansel, A.; Jordan, A. Proton transfer reaction mass spectrometry: On-line trace gas analysis at the ppb level. Int. J. Mass Spectrom. Ion Process. 1995, 149, 609–619. [Google Scholar] [CrossRef]
  5. Pleil, J.D.; Hansel, A. Advances in proton transfer reaction mass spectrometry (PTR-MS): Applications in exhaled breath analysis, food science, and atmospheric chemistry. J. Breath Res. 2019, 13, 039002. [Google Scholar] [CrossRef] [PubMed]
  6. Romano, A.; Capozzi, V. Proton transfer reaction–mass spectrometry: Online and rapid determination of volatile organic compounds of microbial origin. Appl. Microbiol. Biotechnol. 2015, 99, 3787–3795. [Google Scholar] [CrossRef] [PubMed]
  7. Winkler, K.; Herbig, J. Real-time metabolic monitoring with proton transfer reaction mass spectrometry. J. Breath Res. 2013, 7, 036006. [Google Scholar] [CrossRef] [PubMed]
  8. Biasioli, F.; Gasperi, F. PTR-MS monitoring of VOCs and BVOCs in food science and technology. Trends Anal. Chem. 2011, 30, 968–977. [Google Scholar] [CrossRef]
  9. Piel, F.; Müller, M. Introducing the extended volatility range proton-transfer-reaction mass spectrometer (EVR PTR-MS). Atmos. Meas. Tech. 2021, 14, 1355–1363. [Google Scholar] [CrossRef]
  10. Mikoviny, T.; Kaser, L. Development and characterization of a high-temperature proton-transfer-reaction mass spectrometer (HT-PTR-MS). Atmos. Meas. Tech. 2010, 3, 537–544. [Google Scholar] [CrossRef]
  11. Fang, J.; Zhao, H. Atmospheric pressure chemical ionization in gas chromatography-mass spectrometry for the analysis of persistent organic pollutants. Trends Environ. Anal. Chem. 2020, 25, e00076. [Google Scholar] [CrossRef]
  12. Li, D.-X.; Gan, L. Gas chromatography coupled to atmospheric pressure ionization mass spectrometry (GC-API-MS): Review. Anal. Chim. Acta 2015, 891, 43–61. [Google Scholar] [CrossRef] [PubMed]
  13. Sulzer, P.; Hartungen, E. A Proton Transfer Reaction-Quadrupole interface Time-Of-Flight Mass Spectrometer (PTR-QiTOF): High speed due to extreme sensitivity. Int. J. Mass Spectrom. 2014, 368, 1–5. [Google Scholar] [CrossRef]
  14. Stempfer, M.; Reinstadler, V. Analysis of cannabis seizures by non-targeted liquid chromatography-tandem mass spectrometry. J. Pharm. Biomed. Anal. 2021, 205, 114313. [Google Scholar] [CrossRef] [PubMed]
  15. Reinstadler, V.; Lierheimer, S. A validated workflow for drug detection in oral fluid by non-targeted liquid chromatography-tandem mass spectrometry. Anal. Bioanal. Chem. 2019, 411, 867–876. [Google Scholar] [CrossRef] [PubMed] [Green Version]
  16. Oberacher, H.; Reinstadler, V. Annotating Nontargeted LC-HRMS/MS Data with Two Complementary Tandem Mass Spectral Libraries. Metabolites 2018, 9, 3. [Google Scholar] [CrossRef] [PubMed] [Green Version]
  17. Arnhard, K.; Gottschall, A. Applying ‘Sequential Windowed Acquisition of All Theoretical Fragment Ion Mass Spectra’ (SWATH) for systematic toxicological analysis with liquid chromatography-high-resolution tandem mass spectrometry. Anal. Bioanal. Chem. 2015, 407, 405–414. [Google Scholar] [CrossRef] [PubMed]
  18. Oberacher, H.; Schubert, B. Detection and identification of drugs and toxicants in human body fluids by liquid chromatography–tandem mass spectrometry under data-dependent acquisition control and automated database search. Anal. Chim. Acta 2013, 770, 121–131. [Google Scholar] [CrossRef] [PubMed]
  19. Pitterl, F.; Kob, S. Applying LC with Low-Resolution MS/MS and subsequent library search for reliable compound identification in systematic toxicological analysis. LCGC N. Am. 2017, 35, 23–31. [Google Scholar]
Figure 1. Schematic drawing of the GC-HT-PTR-MS instrument.
Separations 09 00328 g001
Figure 2. Extracted ion chromatograms obtained from the GC-HT-PTR-MS analysis of a mixture of test compounds (10 µg/mL each) employing optimized instrumental settings.
Separations 09 00328 g002
Figure 3. Impact of the drift tube temperature on the peak widths at half height (b0.5) of 15 compounds (10 µg/mL each) analyzed with GC-HT-PTR-MS.
Separations 09 00328 g003
Figure 4. Impact of the make-up gas flow rate on the detection sensitivity of 15 compounds (10 µg/mL each) analyzed with GC-HT-PTR-MS.
Separations 09 00328 g004
Figure 5. Impact of the reduced electric field strength in the drift tube on amphetamine fragmentation.
Separations 09 00328 g005
Figure 6. Comparison of the detection capabilities obtained for 106 reference compounds with GC-HT-PTR-MS and GC-EI-MS.
Separations 09 00328 g006
Table 1. Overview on performance parameters determined for a multianalyte method employing GC-HT-PTR-MS for quantitative analysis.
CompoundCalibration Range [ng/mL]R2Maximum Bias [%]Maximum Relative Standard Deviation [%]
Amphetamine5–1000.9983.76.4
Methamphetamine5–1000.9964.58.7
MDMA5–1000.9973.96.0
MDA5–1000.999−2.85.6
Cocaine5–1000.998−3.98.5
Methadone10–2500.996−4.59.8
EDDP5–2500.9979.28.3
THC10–2500.998−3.99.2
Morphine25–5000.9976.27.9
6-AM10–2500.9934.39.5
Dihydrocodeine10–2500.997−5.114.1
Table 2. Summary of results obtained from the quantitative analysis of 10 authentic blood/plasma samples with GC-HT-PTR-MS.
SampleCompoundC with GC-HT-PTR-MS [ng/mL]C with GC-EI-MS [ng/mL]Difference between Measured Concentrations [%]
1Dihydrocodeine12.920−35.3
Morphine1211137.0
2THC19.320−3.6
3Cocaine19.920−0.7
4Cocaine1211200.8
THC15.517−8.9
5Cocaine30.931−0.3
6EDDP<LOQ4.0
Methadone73.2730.3
THC<LOQ4.9
7Amphetamine58.9573.4
MDA21.1205.3
MDMA232.32301.0
THC<LOQ6.5−9.9
8Cocaine15.417−9.1
THC18.620−6.9
9Cocaine26.130−13.0
THC<LOQ5.3
10Cocaine43.945−2.4
Publisher’s Note: MDPI stays neutral with regard to jurisdictional claims in published maps and institutional affiliations.

