1. Introduction
N-nitrosamines are considered mutagenic impurities [
1,
2] and their presence was first reported in 2018 by the Zhejiang Huahai Pharmaceutical company, which identified
N-nitrosodimethylamine (NDMA) in valsartan. The finding was then assessed by the Committee for Medicinal Products for Human Use (CHMP) and a recommendation was made as to whether the relevant marketing authorizations should be maintained, varied, suspended, or revoked [
3]. Mutagenic compounds, even at very low concentrations, can react directly with DNA and lead to genetic mutations and tumor formation [
4]. The International Agency for Research on Cancer (IARC) has classified the two most commonly reported N-nitrosamines, NDMA and NDEA, as probable human carcinogens (group 2A), and the European Union (EU) classified them as suspected carcinogens (group 1B).
Marketing Authorization Holders (MAHs) and the EMA [
5] are now familiar with the problem and are reviewing their procedures for assessing the risk of nitrosamine contamination of an API or pharmaceutical formulation. From a chemical perspective, nitrosamines are the products of a reaction (at high temperatures) between a nitrosating agent and a secondary or tertiary amine. Therefore, the use of sodium nitrite (NaNO
2) or other nitrite salts, in the presence of secondary (in reagents and solvents) or tertiary (in common bases such as triethylamine) amines, as well as the use of contaminated raw materials (during their production process), is now considered a possible source of N-nitrosamines. Additionally, as it was recently reported [
6], special attention should be given to certain excipients that are used in pharmaceutical products and could be possible precursors of the reaction between dimethylamine (DMA) and nitrites.
Lisinopril (LIS) is a synthetic peptide derivative with a long-acting angiotensin-converting enzyme inhibitor that has been shown to reduce blood pressure in patients with mild to moderate hypertension [
7]. It acts without any effect on the heart rate or cardiovascular reflexes [
8] and is commonly prescribed for the treatment of hypertension [
9]. Lisinopril is administered orally and is available in various doses, with the daily dose ranging from 2.5 to 40 mg/tablet.
Active pharmaceutical ingredients (APIs) with secondary or tertiary amine groups in their structure, such as Lisinopril (
Figure S1), could become a potential source of nitrosamines [
10]. Therefore, it is necessary not only as a research interest but also for quality control (QC) purposes to develop a simple and reliable method for the determination of nitrosamines in both Lisinopril’s raw material and its final products. According to the European Medicines Agency (EMA) [
11] and the World Health Organization (WHO) [
12], the daily intake limits for NDMA and NDEA are 96.0 ng and 26.5 ng, respectively. The limit of impurities that can be taken daily by an adult is calculated by dividing the maximum permissible intake limit by the maximum daily dose of Lisinopril (80 mg/day). This was set at 1.2 ppm (μg/g) and 0.33 ppm (μg/g) for NDMA and NDEA, respectively.
Review articles have summarized the analytical methods developed for the analysis of nitrosamines not only in APIs but also in different matrixes such as food, tobacco smoke, environmental samples, water, or human urine [
10,
13]. However, due to their volatile character, most of them were determined using capillary electrophoresis [
14] or gas chromatography combined with LC-MS [
6], MS/MS [
15], nitrogen-phosphorous detection (NPD), or a thermal energy analyzer (TEA).
On the other hand, the sensitivity of an LC-MS detector for such moieties is limited due to their low MW, which usually causes technical problems with matrix interference (background noise) and significant ion suppression. In addition, the use of an expensive isotope (e.g., d-NDMA) as the internal standard, as well as the complex instrumentation, is normally not recommended in routine analysis tests [
16]. Although nitrosamines can also be determined by a common UV-Vis detector (230 nm), their quantification at the required μg/g levels of EMA is impossible.
Thus, a more sensitive and selective detector such as fluorescence (FLD) may be a good alternative. HPLC combined with FLD is a well-known, easy-to-use, and low-cost technique. There are only a few published HPLC-FLD analytical methods for the determination of nitrosamines in food [
17] and beer [
18] samples, several in API, and only one in enalapril [
19]. The detection of nitrosamines by an FLD detector requires two reaction steps (
Figure 1). First, in order to produce a secondary amine, the nitro group must be removed from the molecule using HBr in acetic acid (denitrosation). The generated amines should then be reacted with the appropriate fluorescent reagent (derivatization step). The above procedure can be performed pre- or post-column.
There are many derivatization agents that react with the amine group, including dansyl-chloride [
20,
21] or 9-Fluorenylmethoxycarbonyl chloride (FMOC-Cl) [
19]. Dansyl-Cl is a well-known, low-cost, and widely used reagent and has been shown to possess excellent fluorescence sensitivity and high reactive selectivity while providing fewer by-products. Nevertheless, according to the existing literature, it is the first time that the use of dansly-Cl has been found to be successful in the determination of nitrosamines in APIs. A similar attempt had been made by Boczar and co-workers for the quantification of NDMA and NDEA in enalapril (
Supplementary Table S1) but was eventually abandoned because possible contamination of the samples with dimethylamine gave irreproducible peaks in the blank solution.
Various sample preparation techniques using different solvents and materials [
13] have been reported for the isolation and purification of nitrosamines, including solid-phase extraction (SPE) and liquid–liquid extraction (LLE) [
10]. The main difficulty in extracting drug impurities in such substrates (API or pharmaceutical formulation) is that their presence is in trace amounts (ng/mg). The sample should be purified from the API and/or other excipients, and NAs should be fully recovered.
In the present study, in order to follow the rules of green chemistry [
22], a liquid–liquid microextraction process with dichloromethane (DCM) and water was selected and optimized. Subsequently, an HPLC-FLD method was developed and validated for the determination of
N-nitrosamines in Lisinopril and its commercially available formulations, with pre-column denitrosation and dansyl-chloride derivatization. Following EMA guidelines, the suggested method is sensitive, fast, and simple with low cost and is suitable for routine analysis.
2. Experimental
2.1. Materials and Equipment
Lisinopril was purchased from Sigma-Aldrich (Saint Louis, MO, USA), while the final product of Lisinopril dihydrate tablets was provided by a local pharmacy store. The N-nitrosodimethylamine analytical standard solution (5000 μg/mL in methanol) was obtained from Chem-lab Analytical bvba, Zedelgem, Belgium. N-nitrosodiethylamine was purchased from Sigma-Aldrich (Saint Louis, MO, USA). Dimethylamine HCl (99%), diethylamine HCl (99%), hydrobromic acid (HBr, ≥48%), and Dansyl chloride Sigma-Aldrich (BioReagent, ≥99%) were purchased from Sigma-Aldrich (Saint Louis, MO, USA). Acetic acid (≥99.8%) and phosphoric acid (≥85%) were purchased from Honeywell-Fluka, NC, USA. Boric acid pro-analysis, dichloromethane (DCM), trichloromethane, NaH2PO4⋅H2O, and NaOH pellets were all pro-analysis and obtained from Merck (Darmstadt, Germany). Acetonitrile (ACN) and methanol, both HPLC gradient grades, were obtained from VWR Chemicals (Radnor, PA, USA). Technical-grade acetone was obtained from Chem-lab Analytical bvba (Zedelgem, Belgium). High-purity water (18.2 MΩ cm resistivity) produced by a B30 water purification system was used during the study (Adrona SIA, Riga, Latvia).
2.2. Instrumentation and Chromatographic Conditions
HPLC-FLD analysis was performed using a Shimadzu HPLC system consisting of two LC-20AD isocratic pumps, a DGU-14A degasser, and a SIL-10AD autosampler with an injection volume of 20 μL. The HPLC system was coupled to a fluorimetric detector (RF-535) (Shimadzu, Tokyo, Japan) where the Dansyl-Cl derivatives were detected at λex/λem = 340/530 nm. The mobile phase was 20 mM phosphate buffer (pH 2.8 with dropwise addition of concentrated H3PO4) and acetonitrile 55:45 v/v, and its flow rate was 1 mL/min. The analytical column was a reversed-phase LC-C18 DB (250 × 4.6 mm, 5.0 µm, Supelco), which was thermostated at 25 °C.
LC-solution® software version 1.25 SP4 was utilized for hardware control and data manipulation. Experimental design and statistical analysis were performed using Design Expert® software, version 13 (Stat-Ease Inc., Minneapolis, MN, USA).
2.3. Reagents and Solutions
The denitrosation reagent was prepared by dissolving 1 mL of HBr in 10 mL of CH3COOH and stored in an amber flask at 4 °C. For the derivatization procedure, an accurately weighed amount of Dansyl chloride was suspended in ACN at a final concentration of 10 µg/mL and prepared daily. Accordingly, in order to prepare the 25 mM borate buffer solution, pH 10.5, the appropriate amount of boric acid was diluted in deionized water and the pH was adjusted to 10.5 by adding 1 M NaOH dropwise. The solution was sonicated for 40 min and thereafter placed in a 40 °C water bath (40 min) to remove the possible contamination of deionized water by the volatile DMA and DEA.
In the present procedure, in order to study both reactions (denitrosation and derivatization) and to quantify their products, four standard solutions were used. DMA and DEA were prepared by dissolving both substances in 25 mM borate buffer, pH 10.5. Stock standard solutions of N-nitrosamine were also prepared by dissolving the appropriate amount of NDMA and NDEA in DCM. All standards were subjected to the same extraction/derivatization procedure as the unknown samples.
2.4. Liquid-Liquid Microextraction (LLME) of Nitrosamines from Lisinopril
DCM has a low boiling point and is considered an outstanding extraction solvent [
13] for nitrosamines. Since LIS is practically insoluble in DCM (<0.1 mg/mL) [
9] and freely soluble in water, a DCM–water mixture was chosen for the microextraction procedure.
Firstly, 80.0 mg LIS was suspended in 600 μL DCM and 600 μL H2O and vortexed for 20 s to produce a white homogeneous suspension. The water–DCM mixture was left for 30 min to equilibrate and cause the separation of the two phases. The lower DCM phase was then collected using a glass-sealed syringe, and the same procedure was repeated twice, and all 600 µL of DCM was transferred to an HPLC vial.
2.5. Denitrosation and Derivatization Procedures
After the microextraction (LLME) step, 20 µL of the denitrosation reagent (1 mL of HBr in 10 mL of CH3COOH) was added to the HPLC vial containing the DCM phase with the nitrosamines. The vial was capped with a packed screw cap without holes and shaken via vortex for 10 s. The sample was left capped for 30 min at room temperature in the dark and then heated for 2 h at 70 °C to completely evaporate the DCM solvent and acids. After the extraction and denitrosation procedures were completed, the vials were allowed to cool (at room temperature), and then 250 μL of the 25 mM borate buffer (pH 10.5) and 250 μL of the 10 μg/mL Dansyl chloride solution were added. The sample was heated for 30 min at 40 °C in a thermostated oven and analyzed by HPLC.
3. Results
3.1. Development and Optimization of Chromatographic Conditions
Focusing on the development of a reliable, simple, and rapid chromatographic method for the determination of
N-nitrosamines, the optimization step was essential. As already mentioned, the quantification of the two nitrosamines in LIS and its formulations consists of three steps: The extraction, the denitrosation of NDMA and NDEA, and the derivatization of their products, DMA and DEA (
Figure 1). According to preliminary studies on the recovery of Dansyl-DMA and Dansyl-DEA derivatization products, problems were encountered in separating Dansyl-DMA from the peak of an interference (
Rs < 1). Thus, in order to achieve their separation, it was necessary to apply the following gradient elution program: The initial ratio was 40% ACN: 60% aqueous buffer for 5 min, and then the organic phase was linearly increased to 70% in 15 min, and finally, decreased back to the initial ratio at 16 min and remained for up to 25 min to equilibrate the system.
Since this interference disappeared after the extraction and denitrosation steps (due to the evaporation of the sample), an isocratic analysis program was finally evaluated.
Although, for the chromatographic determination of
N-nitrosamines, mobile phases consisting of H
2O and ACN are recommended [
19,
22], asymmetry and broadening of the peak’s shape were presented when they were used. Thus, the existence of a buffer solution was deemed necessary, and phosphates (instead of an acidic aqueous with formic acid) were chosen as the most appropriate.
The effect of the buffer concentration on the chromatogram was further studied in a range of 10 to 50 mM. Based on the results, no variations were observed either in the selectivity of the method or in the shape of the peaks, but when considering the retention time of the derivatives, a minimal improvement was shown. Ultimately, a relatively low buffer concentration of 20 mM was chosen for the simplicity and protection of the system.
Two factors were decisive for pH adjustment: The chemical structure of Dansyl-DMA and DEA derivatives and their pK
a values and the use of an ecological and low-cost mobile phase (low organic solvent content). Based on the pK
a values (4.63) of the two analytes, which were calculated using Marvin Sketch [
23], the derivatives are weak bases. To achieve their complete ionization so that they require less of the organic solvent for their rapid elution, the pH of the mobile phase should be adjusted to approximately 2.6 (pK
a-2).
Corresponding studies were also performed by varying the % of ACN vs. aqueous buffer (20 mM, pH 2.8) from 10 to 70. According to the results, the derivatives exhibited the typical “reversed phase” behavior where the retention increases and the separation is improved by decreasing the percentage of acetonitrile. Thus, considering both the analysis time and the acceptable resolution and tailing factor, a volume of 45:55 (ACN:20 mM phosphate buffer, pH 2.8) was finally selected (
Rs = 4.5 and
Tf = 1.48 and 1.50 for Dansyl-DMA and Dansyl-DEA, respectively). The retention time was 7.6 min and 10.5 for Dansyl-DMA and Dansyl-DEA, respectively (
Figure 2).
Finally, the effect of different column temperatures (in the range of 25–35 °C) on the behavior of the analytes was tested, where no significant changes were observed. Thus, due to reasonable back pressure and in order to protect the column, 25 °C was chosen as the optimum temperature.
The sensitivity of the fluorescence detector was always set to high mode throughout the study where, based on the literature [
24], optimal excitation/emission wavelengths were obtained.
3.2. Development of the Microextraction Procedure of NDMA and NDEA
To identify nitrosamines that may be present in the API or final product, a preliminary extraction step is necessary. At the same time, the extraction process helps to isolate them from the secondary amines (DMA and DEA), which may appear as residues. These amines may interfere or also react with the same derivatization reagent used for N-nitrosamines. Finally, the proposed extraction procedure aimed to follow the new trends in sample preparation and comply with the 12 principles of Green Chemistry to maximize the environmental friendliness of analytical methods [
25].
In more detail, liquid–liquid microextraction with DCM and H
2O [
10,
13,
26] was performed in which the participation of the organic solvent was investigated, aiming to use as small amounts as possible.
Since LIS is completely soluble in water (up to 97 mg/mL) and considered insoluble in DCM, this solvent could be used to wash and clean the API samples. In contrast,
N-nitrosamines are completely soluble in DCM while their denitrosation products DMA and DEA are insoluble. Based on the experimentally measured partition coefficient of NDMA and DMA, after their extraction with water and DCM [
26], only NDMA, and no DMA, is taken up in DCM so the amount of NDMA is not overestimated.
Considering literature references, a series of experimental tests were carried out using DCM and water (1:1 v/v) as extraction solvents. After the investigation of different solvent volumes (0.3–5 mL), it was found that the minimum manageable volume to produce acceptable analyte recoveries was 600 µL DCM and 600 µL water, processed in a 2 mL Eppendorf tube. The aqueous layer was then extracted once more with 600 µL of DCM collected for further workup.
3.3. Development and Formulation of the Denitrosation Method
For the processing of the samples in the denitrosation stage, literature information on the respective reactions [
21,
24] was initially adopted, and some modifications were made afterward. One of the points that needed special attention was that after the denitrification reaction, it is absolutely necessary to completely evaporate the samples. Otherwise, acid residues (CH
3COOH and HBr) will lead to lower pH values and block the next derivatization step, producing non-reproducible results and extra peaks in the chromatogram. Considering the boiling points of HBr (122 °C), CH
3COOH (118 °C), DEA (55.5 °C), DCM (40 °C), and DMA (7 °C), an additional point that needs investigation is the determination of the optimal evaporation temperature of the samples so that there is no loss of DMA or DEA. However, knowing that the released amines react with HBr to form hydrobromides, which are a solid residue at 70 °C, this temperature was chosen as optimal.
After investigation, it was finally found that for the denitrosation step, the samples should first be left in the dark at room temperature for 30 min and then heated for 2 h at 70 °C to achieve complete removal of DCM and acids.
3.4. Optimization of Derivatization Conditions
For the preliminary experiments, DMA and DEA standard solutions at a concentration of 1 μg/mL were derivatized (under different conditions) and analyzed by HPLC-FLD. The areas of both chromatographic peaks (DMA and DEA) directly related to the reaction performance and were considered as a criterion for evaluating the degree of influence for each tested condition.
The type and pH of the buffer solution, the concentration and diluent of the Dansyl-Cl reagent, and the reaction time and temperature were studied as critical parameters for the derivatization procedure (each experiment was repeated in triplicate).
Since the acids were used in the previous denitrification step, it is possible that their residues remained in the sample due to incomplete volatilization. Therefore, in order to ensure that the pH of the sample is between 9 and 12, which is considered necessary for the derivatization reaction, a buffer solution should be added. To this end, two different solutions were tested, NaHCO3 0.5 M, pH 9, and borate buffer 25 mM, pH 10.5, where the latter was chosen as optimal. Afterward, the effect of different concentrations of borate buffer, namely, 25, 50, and 100 mM, on the reaction efficiency was tested. Since there was no difference in the peak areas of the samples, 25 mM was chosen as the optimal value.
According to the literature [
19,
20,
22,
24], the most common diluent for Dansyl-Cl reagent is acetone. However, when a blank with acetone was derivatized, an interference occurred in the same elution time of dansyl-DMA. Methanol was also used as an alternative, but precipitation of products was observed. Finally, acetonitrile was chosen as the diluent, which did not show any interference peak or precipitate.
To conclude the study, three parameters (of minor importance) that could possibly influence the results were processed using the response surface and the Central Composite Design (CCD) methodology. Their investigated boundaries were relatively narrow and derived from those suggested by corresponding studies. Thus, the volume of denitrification reagent (study levels: 10–40 µL), derivatization time (study levels: 15–45 min), and temperature (study levels: 30–50 °C) was used. Based on a quadratic model, 20 runs were needed (one block, fourteen non-center points, six center points) with one face in the center (a = 1). The area of DMA and DEA peaks were used as responses (
Table S2, Supplementary File). The significance of the process factors was statistically evaluated based on the analysis of variance (ANOVA).
The experimental results revealed that derivatization’s yield was practically unaffected (p-value > 0.05) by temperature, volume, and time variations. So, the following conditions were selected: 20 μL of the denitrosation reagent and 30 min at 40 °C for derivatization.
3.5. Method Validation
The method was validated in terms of specificity, linearity, sensitivity, and reliability according to ICH guidelines. All standards were subjected to extraction, denitrosation, derivatization, and, finally, injected into HPLC-FLD for analysis. Three individual replicates were performed for each concentration.
3.5.1. Specificity
The specificity of the method was confirmed by overlaying chromatograms of the blank, API (lisinopril), and the final product (
Figure 2). As derived, there are more peaks (impurities) in the samples, but they are well separated from those of the blank.
3.5.2. Linearity and Method Sensitivity
The calibration curve of each derivatized analyte (Dansyl-DMA, Dansyl-DEA) was evaluated individually by linear regression. Their concentrations ranged from 0.02 to 0.24 μg/mL or 0.15–1.8 µg/g API for NDMA, and 0.2 to 1.6 μg/mL or 1.5–12 µg/g API for NDEA, respectively. The value of 1.2 µg/g of the calibration curve corresponds to the maximum allowable limit of NDMA in Lisinopril (100% of the target concentration). The correlation coefficient (
R) values for both analytes were equal to 0.9995 and Equations (1) and (2) were used for NDMA and NDEA, respectively. For NDMA, the limit of quantitation (LOQ) and limit of detection (LOD) were found equal to 14.4 ng/mL and 4.7 ng/mL, respectively, while NDEA’s LOQ and LOD were equal to 0.13 μg/mL and 0.04 μg/mL, respectively.
3.5.3. Precision
The inter-day and intra-day precision experiments are presented in
Table 1. Precision was assessed by calculating the % relative standard deviation (%RSD) of NDMA and NDEA at three concentration levels (high, medium, and low) on the same and three consecutive days. The % RSD values ranged from 1.4 to 13.4%, for both intra-day and inter-day precision (
Table 1).
3.5.4. Accuracy
The accuracy of the method was determined by calculating the recoveries of N-nitrosamines in Lisinopril-spiked samples at three concentration levels (0.6 µg/g, 1.2 µg/g, and 2.4 µg/g equivalent to 50, 100, and 200% of the target concentration). To ensure the purity of Lisinopril, 80.0 mg of the substance was first washed with 100 mL of DCM, and after removing the solvent, the sample was subjected to gentle drying. Each sample was then subjected to the same pretreatment as the standard samples (liquid–liquid extraction, denitrosation, and derivatization). According to the results (
Table 2), the recoveries were in the range of 91.9 to 108.4% for NDMA and 90.3 to 108.4 for NDEA (acceptance limits of 90–110%).
3.5.5. Robustness
To evaluate the robustness of the chromatographic system, the effects of small changes in the buffer concentration (from 18 to 20 mM), pH values (from 2.7 to 2.9), column temperature (from 24 to 26 °C), ACN content (44 to 46% v/v), and injection volume (from 19 to 21 µL) were investigated. According to the results, none of the tested parameters affect either the peak intensities or their resolutions.
3.6. Method Application
The proposed HPLC-FLD method was successfully applied to the analysis of nitrosamines in a commercially available final product of LIS. For the analysis of the final product, six tablets were taken and powdered. Eighty milligrams of powder were weighed and transferred to an Eppendorf tube where DCM and H
2O (1:1) were added. Subsequently, the samples were subjected to the same pretreatment as the standards (
Section 2.4 and
Section 2.5). Accordingly, spiked LIS tablets were subjected to the same procedure described in
Section 2.4 and
Section 2.5, and the recoveries ranged between 72.8 and 122.6% in all cases. Representative blank and spiked-sample chromatograms are shown in
Figure 2.


 and
and 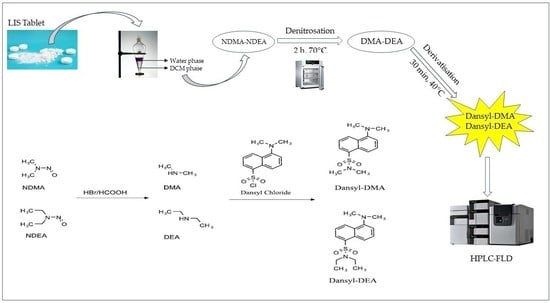


