Article

Effects of Flotation Reagents on Flotation Kinetics of Aphanitic (Microcrystalline) Graphite

1
Key Laboratory of Coal Processing and Efficient Utilization (Ministry of Education), School of Chemical Engineering and Technology, China University of Mining and Technology, Xuzhou 221116, China
2
Department of Mining Engineering, Balochistan University of Information Technology Engineering and Management Sciences (BUITEMS), Quetta 87300, Pakistan
3
College of Mining Engineering, Taiyuan University of Technology, Taiyuan 030024, China
*
Authors to whom correspondence should be addressed.
Separations 2022, 9(12), 416; https://doi.org/10.3390/separations9120416
Submission received: 6 November 2022 / Revised: 24 November 2022 / Accepted: 2 December 2022 / Published: 7 December 2022

Abstract

:
The flotation method is widely used for the preliminary beneficiation of aphanitic (microcrystalline) graphite. However, there is limited literature regarding the effects of flotation reagents on the flotation kinetics of aphanitic graphite. In this study, six commonly used flotation kinetic models were used to fit the flotation experimental data of aphanitic graphite. The classical first-order model was found to be most suitable for describing flotation kinetics of aphanitic graphite. The modified flotation rate constant (Km) was then applied to evaluate the effects of collector, frother, and inhibitor on aphanitic graphite flotation kinetics. Compared to diesel oil and terpineol oil, kerosene and 2-octanol produced a greater Km. The highest Km was obtained at an inhibitor dosage of 15 mg/L.

1. Introduction

The molecular structure of graphite determines its excellent physical and chemical properties as an isomer of carbon, such as good electrical conductivity, heat resistance, high temperature resistance, and corrosion resistance. Because of these properties, graphite has a wide range of applications in aerospace, the chemical industry and other fields. However, these applications require high purity of the graphite material itself. Graphite can be purified in a variety of ways based on the physical and chemical changes caused by the process, including wet purification and fire purification. There are three types of wet purification methods: flotation, acid-base, and hydrofluoric acid; and two types of fire purification methods: chlorination and high-temperature de-hybridization [1]. In comparison to other methods, flotation is less energy-consuming, environmentally friendly, simple to operate, and based on mature technology. Because the flotation method is effective for microfine particles, it is the most commonly used method for graphite purification at present. In relation to its crystal structure, graphite’s flotation efficiency (such as flotation rate, and flotation ease) is worse for cryptocrystalline than for flaky graphite.
In order to fully dissociate graphite microcrystals and gangue impurities, cryptocrystalline graphite minerals are usually ground to a very fine size [2]. Flotation is a common method for the enrichment of fine minerals [3]. Due to the small, disseminated particle size of cryptocrystalline graphite impurities, the particle size after grinding is too small, which is not conducive to obtaining high grade concentrate by the traditional flotation method [2,4]. To this end, various methods, such as collector emulsification [5,6,7,8] and grinding-pretreatment [4,9], high-shear flocculation [10,11], ultrasonic treatment [12], nanobubble flotation [13] and equipment optimization [14,15], have been used to improve the graphite flotation effect. However, the highest grade of graphite flotation concentrate could only reach about 95% carbon content because part of the impurity minerals was distributed in the concentrate particles. Meanwhile, gangue mineral entrainment, which is difficult to be completely avoided in the flotation process, also restricts the further improvement of flotation concentrate grade [6,16,17].
Therefore, a variety of agents are used in the graphite flotation process to improve the effectiveness of flotation. A collector is added to improve the hydrophobicity of graphite particles and to enhance the probability of adhesion of graphite particles to air bubbles. An inhibitor can adsorb on the surface of impurity minerals and increase the hydrophilicity of the impurity particle surface, which in turn reduces the probability of entrapment of impurity minerals. However, the effects of different flotation agents on the flotation kinetic of cryptocrystalline graphite need to be further investigated.
Flotation kinetics are often used to compare flotation effects under different conditions [6,18,19]. The classical first-order kinetic model is most commonly used to describe the flotation yield-time curve. Two parameters, the flotation rate constant (K) and the ultimate recovery (R) through fitting the curve, are used to quantitatively evaluate the effects of the variables on flotation [20].
In summary, previous research on graphite flotation has been relatively extensive. However, graphite flotation kinetics studies have not attracted much attention. This paper explores the flotation kinetic models in line with graphite flotation and the influence of different factors on the flotation rate constant, as well as the reasons for its impact, through a series of graphite flotation experiments.

2. Experiment

2.1. Materials

The samples of cryptocrystalline graphite used in this experiment were acquired from Hunan, China; the ash content of the samples was 13.02%. The average particle size of the samples (d50) was 3.88 μm. Kerosene and diesel oil were purchased from local gas stations. Secondary octanol (AR) and pine alcohol oils were purchased from the Sinopharm Group.

2.2. Characterization Methods

The chemical characterizations of SPL samples were measured by XRD (6100, Shimadzu Corporation, Tokyo, Japan). The XRD experiment was carried out at a 40 kV accelerating voltage and 30 mA current using a Cu Kα radiation source. The scanning speed and the scan range was 8°/min and 10–90°, respectively. The morphology characterizations and the impurity distribution of SPL samples were measured by SEM-EDS (FIB-SEM, Helios G4 CX, Thermo Fisher Scientific). The acceleration voltage was 10 kV, and the operating current was 5.5 nA. The SEM and EDS images were synthesized to make the results more distinct. The XRD and SEM-EDS test methods in this article are detailed in the reference [21].

2.3. Flotation Experiments

The effects of collector, frother, and inhibitors on the flotation rate constant (Km) were investigated using single-factor optimization methods, and the optimal types and dosages of collector and frothers, as well as the optimal dosage of inhibitors, were obtained.
The RK/FD type 0.5 L single-slot flotation machine (power 120 w, impeller diameter 45 mm) produced by Wuhan Rock Grinding Equipment Manufacturing Co., Ltd. (Wuhan, China) was used in this study. Kerosene and diesel oil were used as collectors, and 2-Octanol and terpineol oil (2# oil) were used as the frother. Flotation parameters included 60 g/L slurry concentration, 2000 r/min speed, and 250 L/h inflation volume. The experimental steps of flotation rate were: (a) add 30 g graphite and a certain amount of water to the beaker, use a glass rod to stir and mix well, pour it into the flotation tank, and then add water to the first line of the flotation tank, and then stir the slurry for 3 min; (b) after adding the collector, continue to stir for 2 min, add the frother, add water to the second line after stirring for 20 s, open the inflation switch after stirring for 10 s, and open the scraper to start scraping after 10 s of inflation. Concentrates J1, J2 and J3 were collected at times 0–1 min, 1–3 min and 3–6 min. Concentrates and tailings collected were filtered, dried, weighed and tested at the end of the experiment to calculate the flotation rate constant. The data for the error bars were derived The flotation rate constant was used to quantify the effect of flotation agents (frother, collectors) on graphite flotation, and six flotation kinetic models were compared to find the best model suitable for this experimental data. The flotation kinetic parameters were calculated in MATLAB software using least-square analysis [22,23,24].

2.4. Zeta Potential Test

The zeta potential measurement was carried out using standard procedures on a Brookhaven Zeta Plus Zeta potential meter. A sample having a 0.02% solid concentration with the required reagent dosage was added to a 100 mL beaker. The suspension was agitated for 2 min and transferred to the testing vessel, after which the zeta potential measurement was made. The measurement procedure has been described in the literature [25].

3. Experimental Results and Analysis

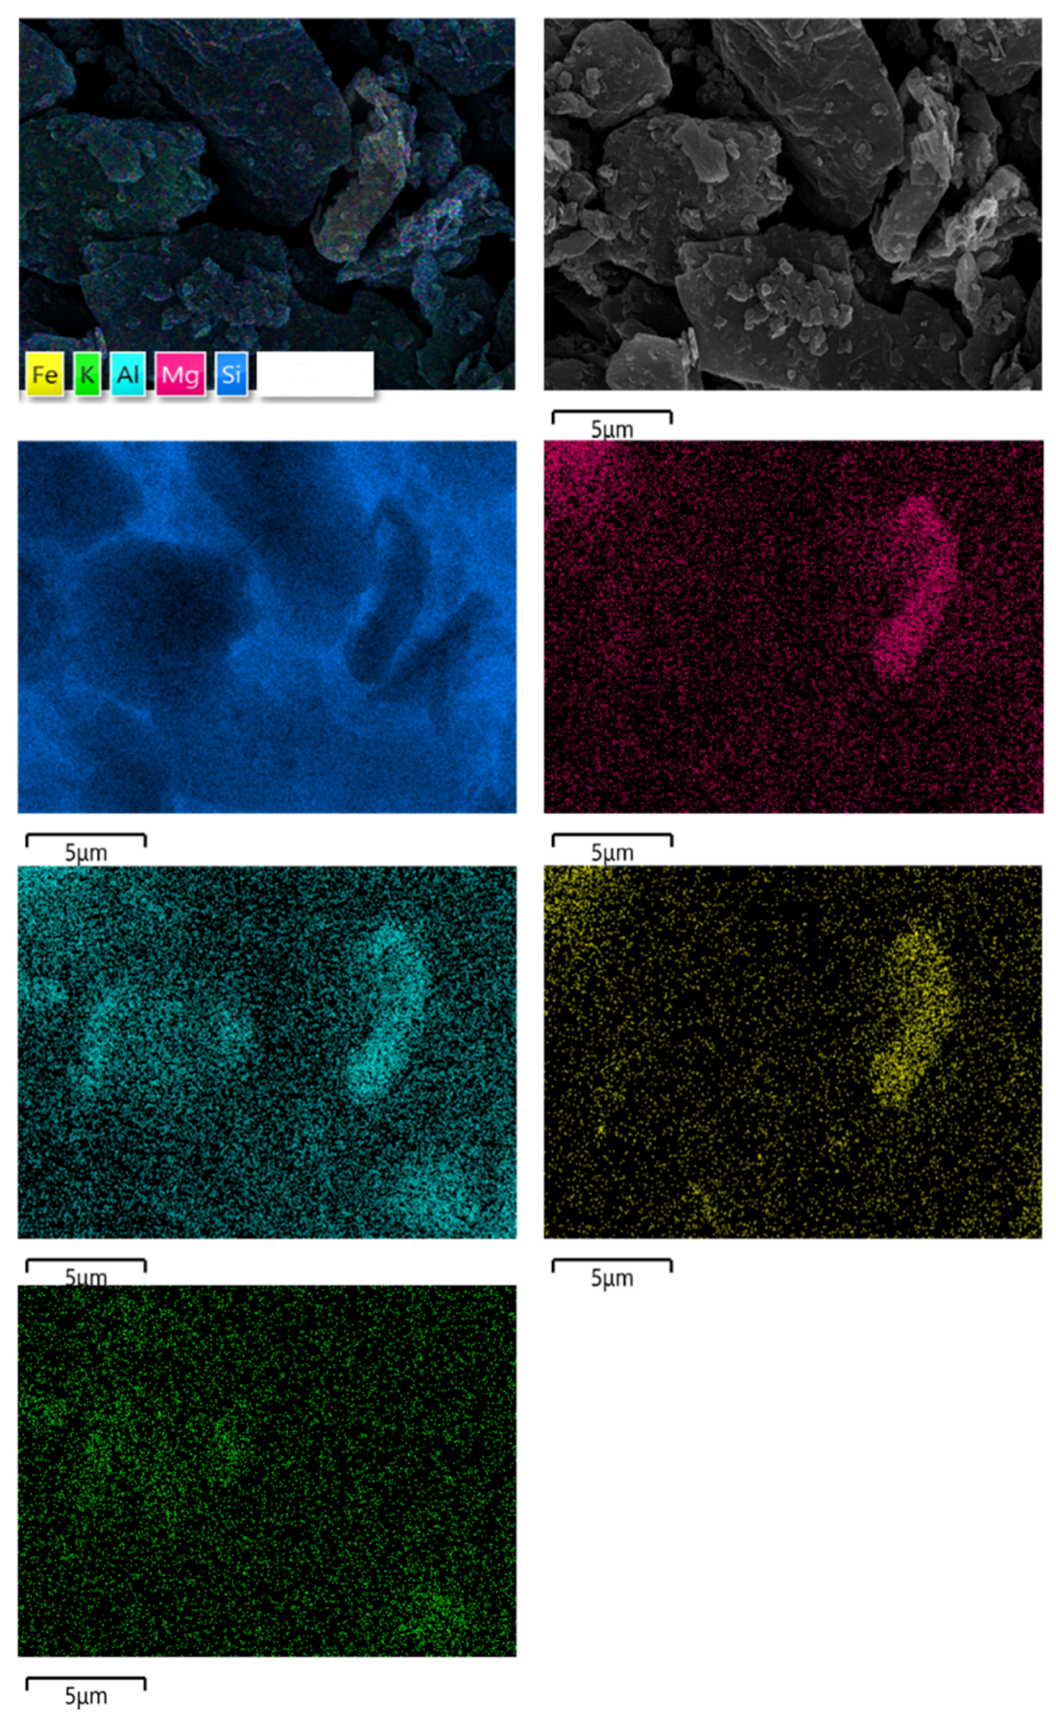
3.1. Mineralogical Characteristics

Figure 1 shows the mineralogical composition of graphite raw ore According to the XRD results, the impurity minerals contained in graphite ore primarily included quartz (SiO2) and oblique chlorite (Mg,Fe)6(Si,Al)4O10(OH)8. The peak height and peak shape area showed that the quartz mineral content was higher and the oblique chlorite content was lower, indicating that the influence of quartz minerals on flotation should be considered in the subsequent flotation process.
The SEM-EDS results of graphite raw ore are shown in Figure 2 and Table 1. It can be seen that Si was widely distributed, while Mg, Fe, and Al were primarily distributed on larger graphite particles, and that impurity minerals were primarily present in graphite ore in the form of embedded cloth. The EDS element content results show that the Si element had the greatest content, which is in line with the XRD results.

3.2. Comparison of Flotation Kinetic Models

The recovery of the concentrate product per unit time is represented by the K-value magnitude of the flotation rate constant in flotation kinetics, but many studies have used the modified flotation rate constant (Km = RK) as an alternative method for comparing the overall flotation process under different conditions [6,26,27,28,29,30]. The flotation rate constant (K) and maximum theoretical recovery (R) are effective indicators for evaluating flotation performance [20,31]. This section compares the six flotation rate models (Table 2), and Table S1 gives the calculation results of the six models for different collectors and frothers (including repeated experiments). The coefficient of determination collector was used to evaluate the fitting of the flotation kinetic model [20,22,24], and the higher value of R2 quantified the goodness of fit. Flotation of difficult floating particles with poor hydrophobicity is unlikely to achieve 100% recovery, even if flotation time is extended indefinitely [23].
The data in Figure 3 are the R and R2 values fitted by six different flotation kinetic models obtained by different experiments, and the abscissa coordinates 2, 4, 6, and 8 represent the experiments of different groups, that is, groups 2, 4, 6, and 8, but each set of experimental conditions correspond to each model (the dosage of reagents is the same).
The data in Figure 3 are the R and R2 values fitted by six different flotation kinetic models obtained by different experiments, and the abscissa coordinates 2, 4, 6, and 8 represent the experiments of different groups, that is, groups 2, 4, 6, and 8, but each set of experimental conditions correspond to each model (the dosage of agents is the same).
Since the equations for models 3, 4 and 5 are mathematically equivalent, the calculations for models 3, 4 and 5 overlap completely in Figure 3, showing only four series of data points. As can be seen from Figure 3a), the R2 of the first-order kinetic model was basically the smallest, which means that the other flotation kinetic models were fitted with slightly higher accuracy than the first-order kinetic model. However, the difference in R2 for these six kinetic models is not large, varying between 0.9982 and 0.9999. Figure 3b shows that only the R value of the first-order kinetic model was less than 100%, while the R values of the remaining kinetic models exceeded 100%, which is obviously not consistent with the actual flotation. Considering the maximum recovery and R2 values, the classical first-order model can be used to fit the results of these experiments. Therefore, it can be concluded that the classical first-order kinetic model is more suitable for the flotation behavior of graphite.
Figure 4 shows the dependence of cumulative yield of concentrate products obtained at different time intervals on the flotation time, containing the actual flotation yields as well as the fitted results of the six flotation kinetic models. Similar to the case of Figure 3, the fitted curves for models 4 and 5 are overlaid by model 3. Table 2 clearly shows that the models 3, 4 and 5 are mathematically equivalent [20,24,30].
Figure 4 illustrates that with the increase of flotation time, the flotation concentrate yield increased rapidly, and after the flotation time reached 6 min, the concentrate all floated out and the flotation yield reached its maximum. The classical first-order kinetic model fitting curve was basically consistent with the actual concentrate rate variation. The flotation yield increased rapidly and then became very flat when it reached a certain value and remained basically constant. The rest of the kinetic models fit the actual concentrate yield variation pattern very well in the initial stage; however, after the flotation time exceeded 6 min the concentrate flotation yield still increased slowly, even exceeding 100%, which is obviously not consistent with the actual flotation situation.
The classical first-order kinetic model had a higher fitting accuracy (R2 > 0.998), and the fitted curve was more consistent with the variation of the concentrate yield with time. Therefore, the classical first-order kinetic model is considered to be more suitable for depicting the flotation behavior of graphite.

3.3. Effects of Different Factors on the Flotation Rate Constant Km

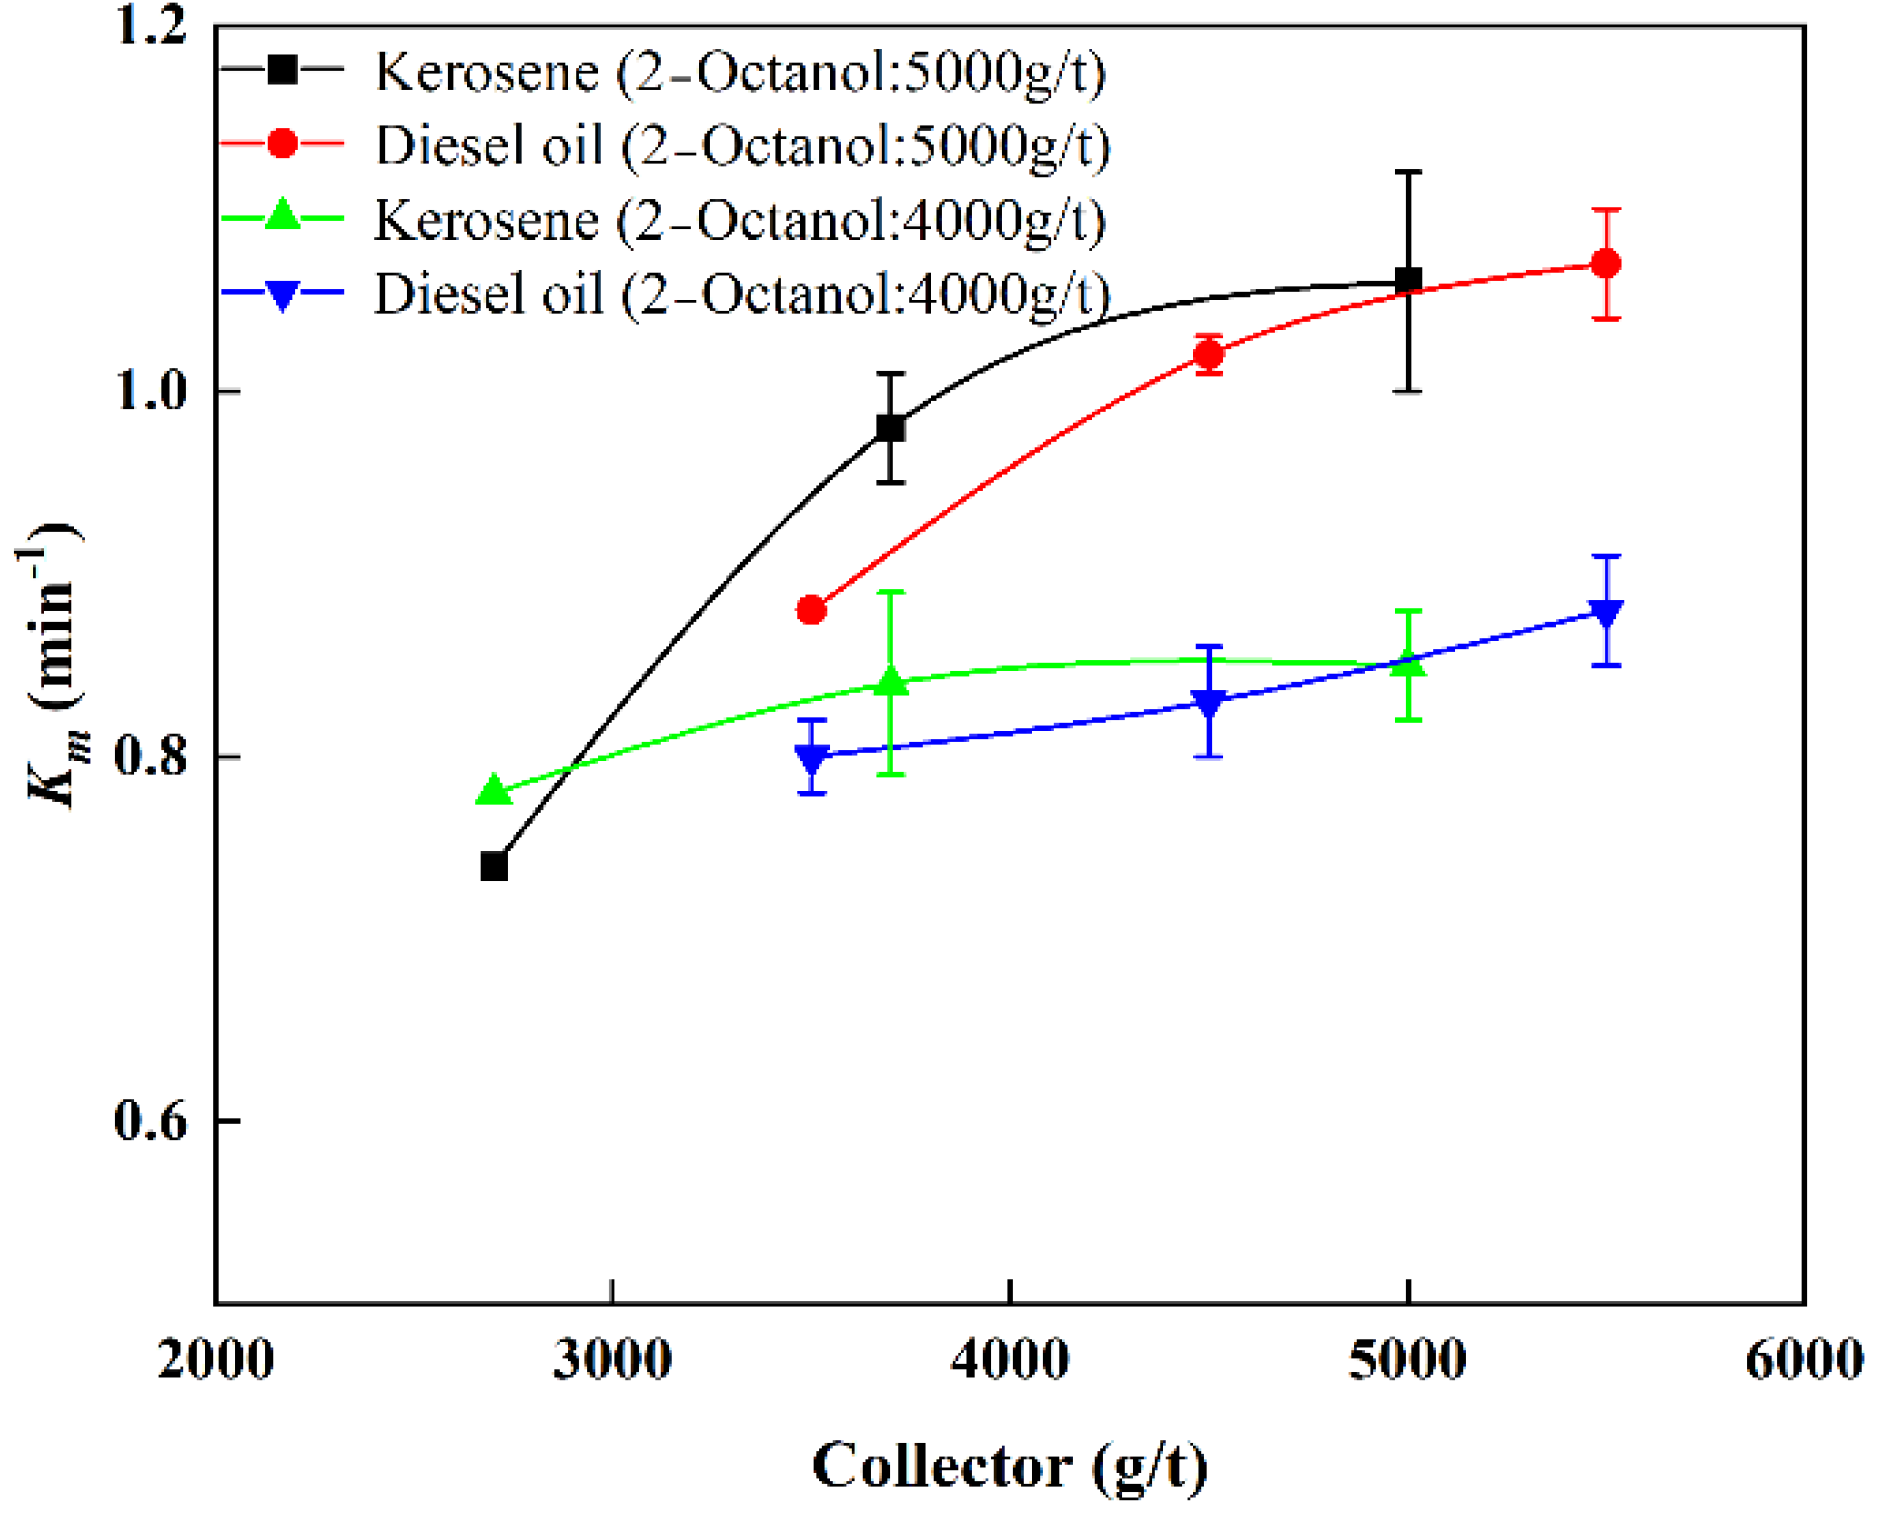
3.3.1. Effects of Collector

Figure 5 shows the relationship between Km and the type and dosage of the collector, while fixing the frother type and dosage. As can be seen from Figure 5, as the amount of collector increased, the value of Km also increased. For the same type of collector, as the amount of collector increases, Km also gradually increased. With the increase of the amount of collector, the surface of the graphite particles was fully adsorbed by collector, thereby improving the hydrophobicity of the graphite particles [14].
It has already been discussed that the dosage of the reagent has a certain degree of promotion effect on Km, and the flotation effect of kerosene as a collector is better, with an optimal dosage of 5000 g/t. Several studies have also found that kerosene is the best graphite collector when compared to other non-polar hydrocarbon oils [32,33]. This may be due to the better adsorption ability of kerosene on the surface hydrophobic particles [34].

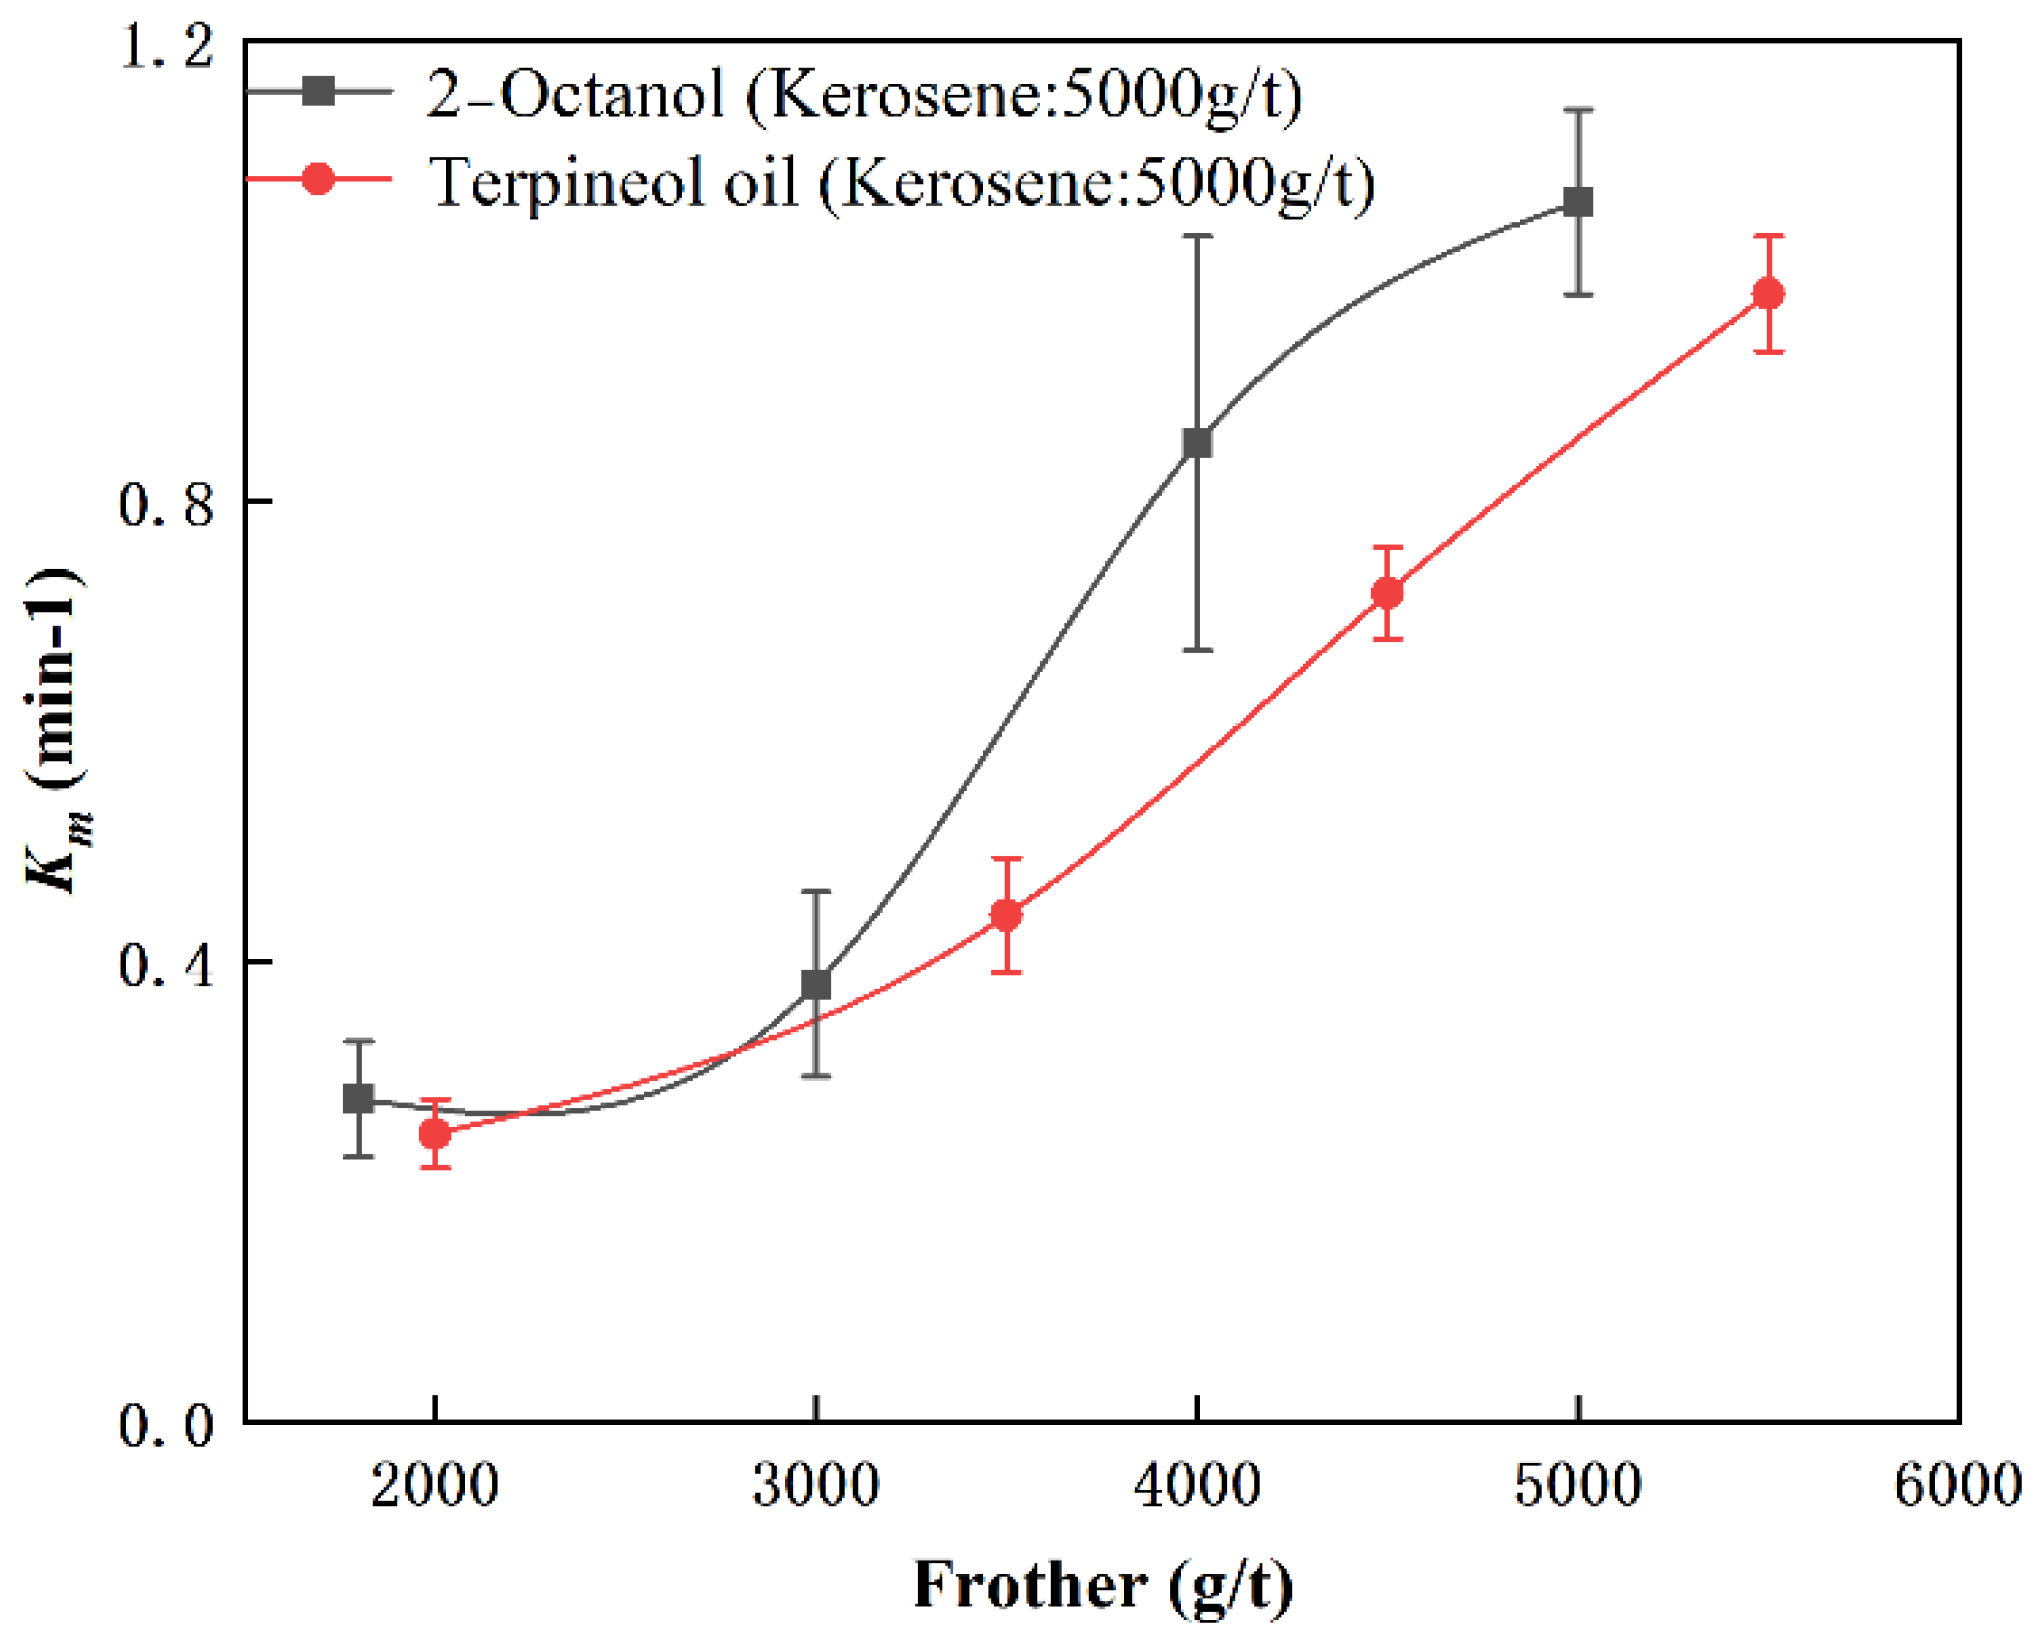
3.3.2. Effect of Frother

Figure 6 shows the effect of frother types and their dosage on Km under the conditions of optimal collector type and dosage. As can be seen from Figure 6, with the increase of the amount of frother, Km showed an increasing trend, with a slow and then rapid increase. For the same amount of 2-Octanol and terpineol oil, it is obvious that the value of Km obtained by 2-Octanol was greater than the Km value of terpineol oil, indicating that 2-Octanol is superior to terpineol oil. The above results show that the frother had a positive effect on Km, because the frother added during the flotation process increased the strength and stability of the bubbles, thereby improving the flotation effect of graphite [35]. In addition, the increase in the dosage of collector reduces the surface tension of the liquid, resulting in smaller bubble sizes and generating more gas-liquid interfaces for the attachment of ultrafine graphite particles. This is also in compliance with the principle that the small particle size of graphite particles (d50 is 3.88 μm) is suitable for flotation separation using microbubbles. The frother type selected based on the above results was 2-Octanol with an optimum dosage of 5000 g/t.

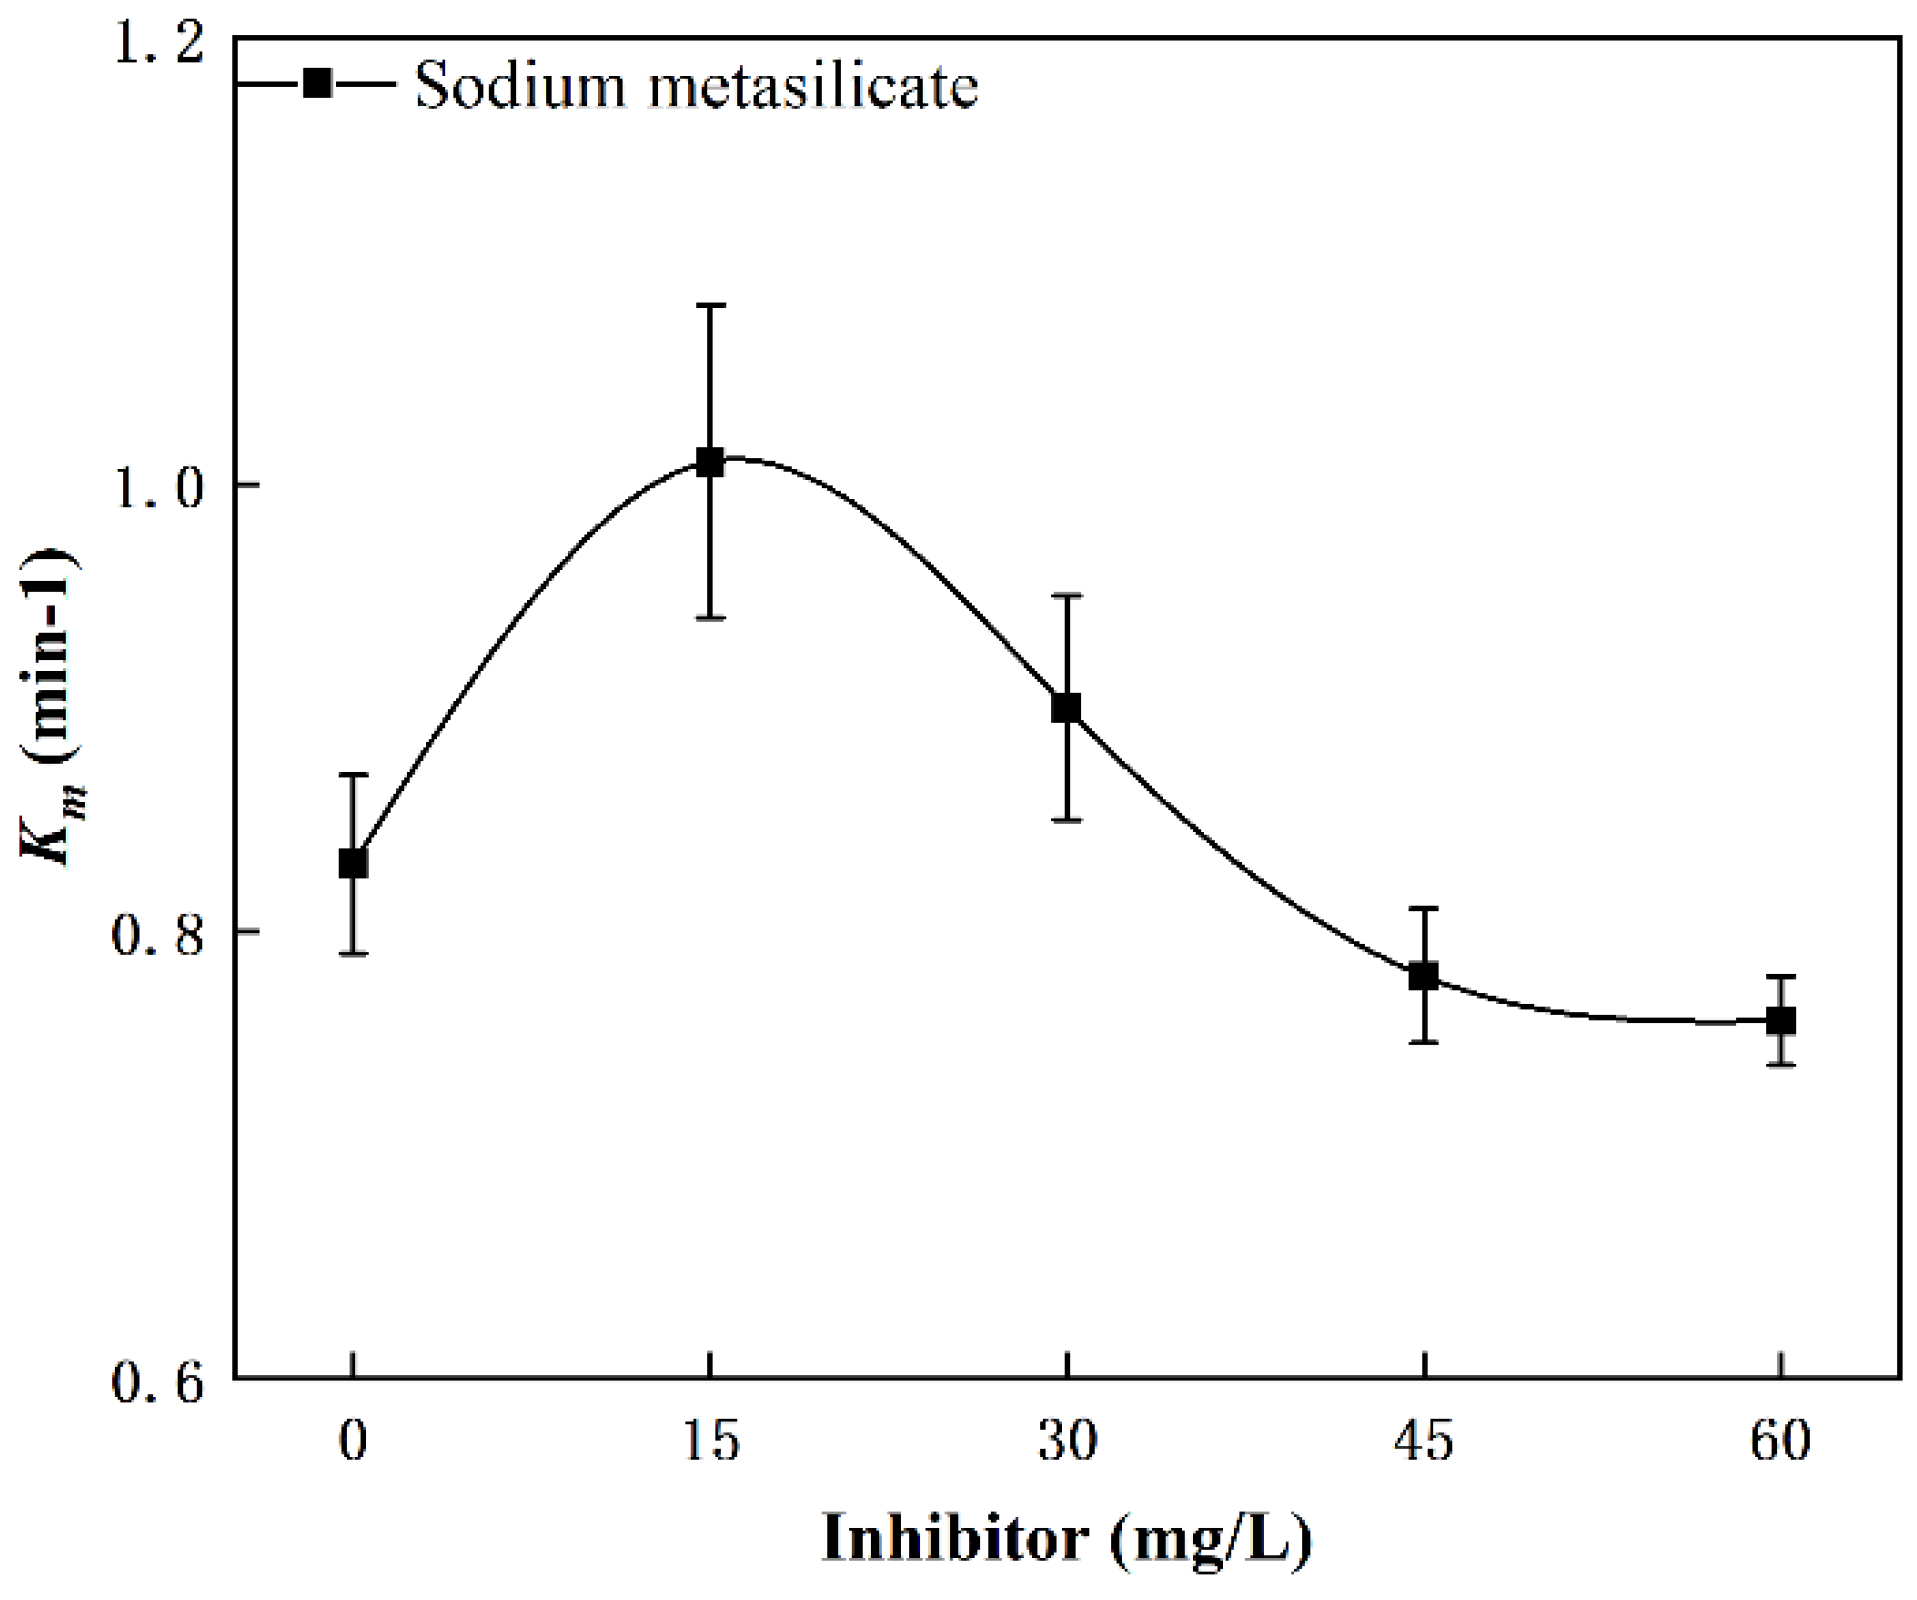
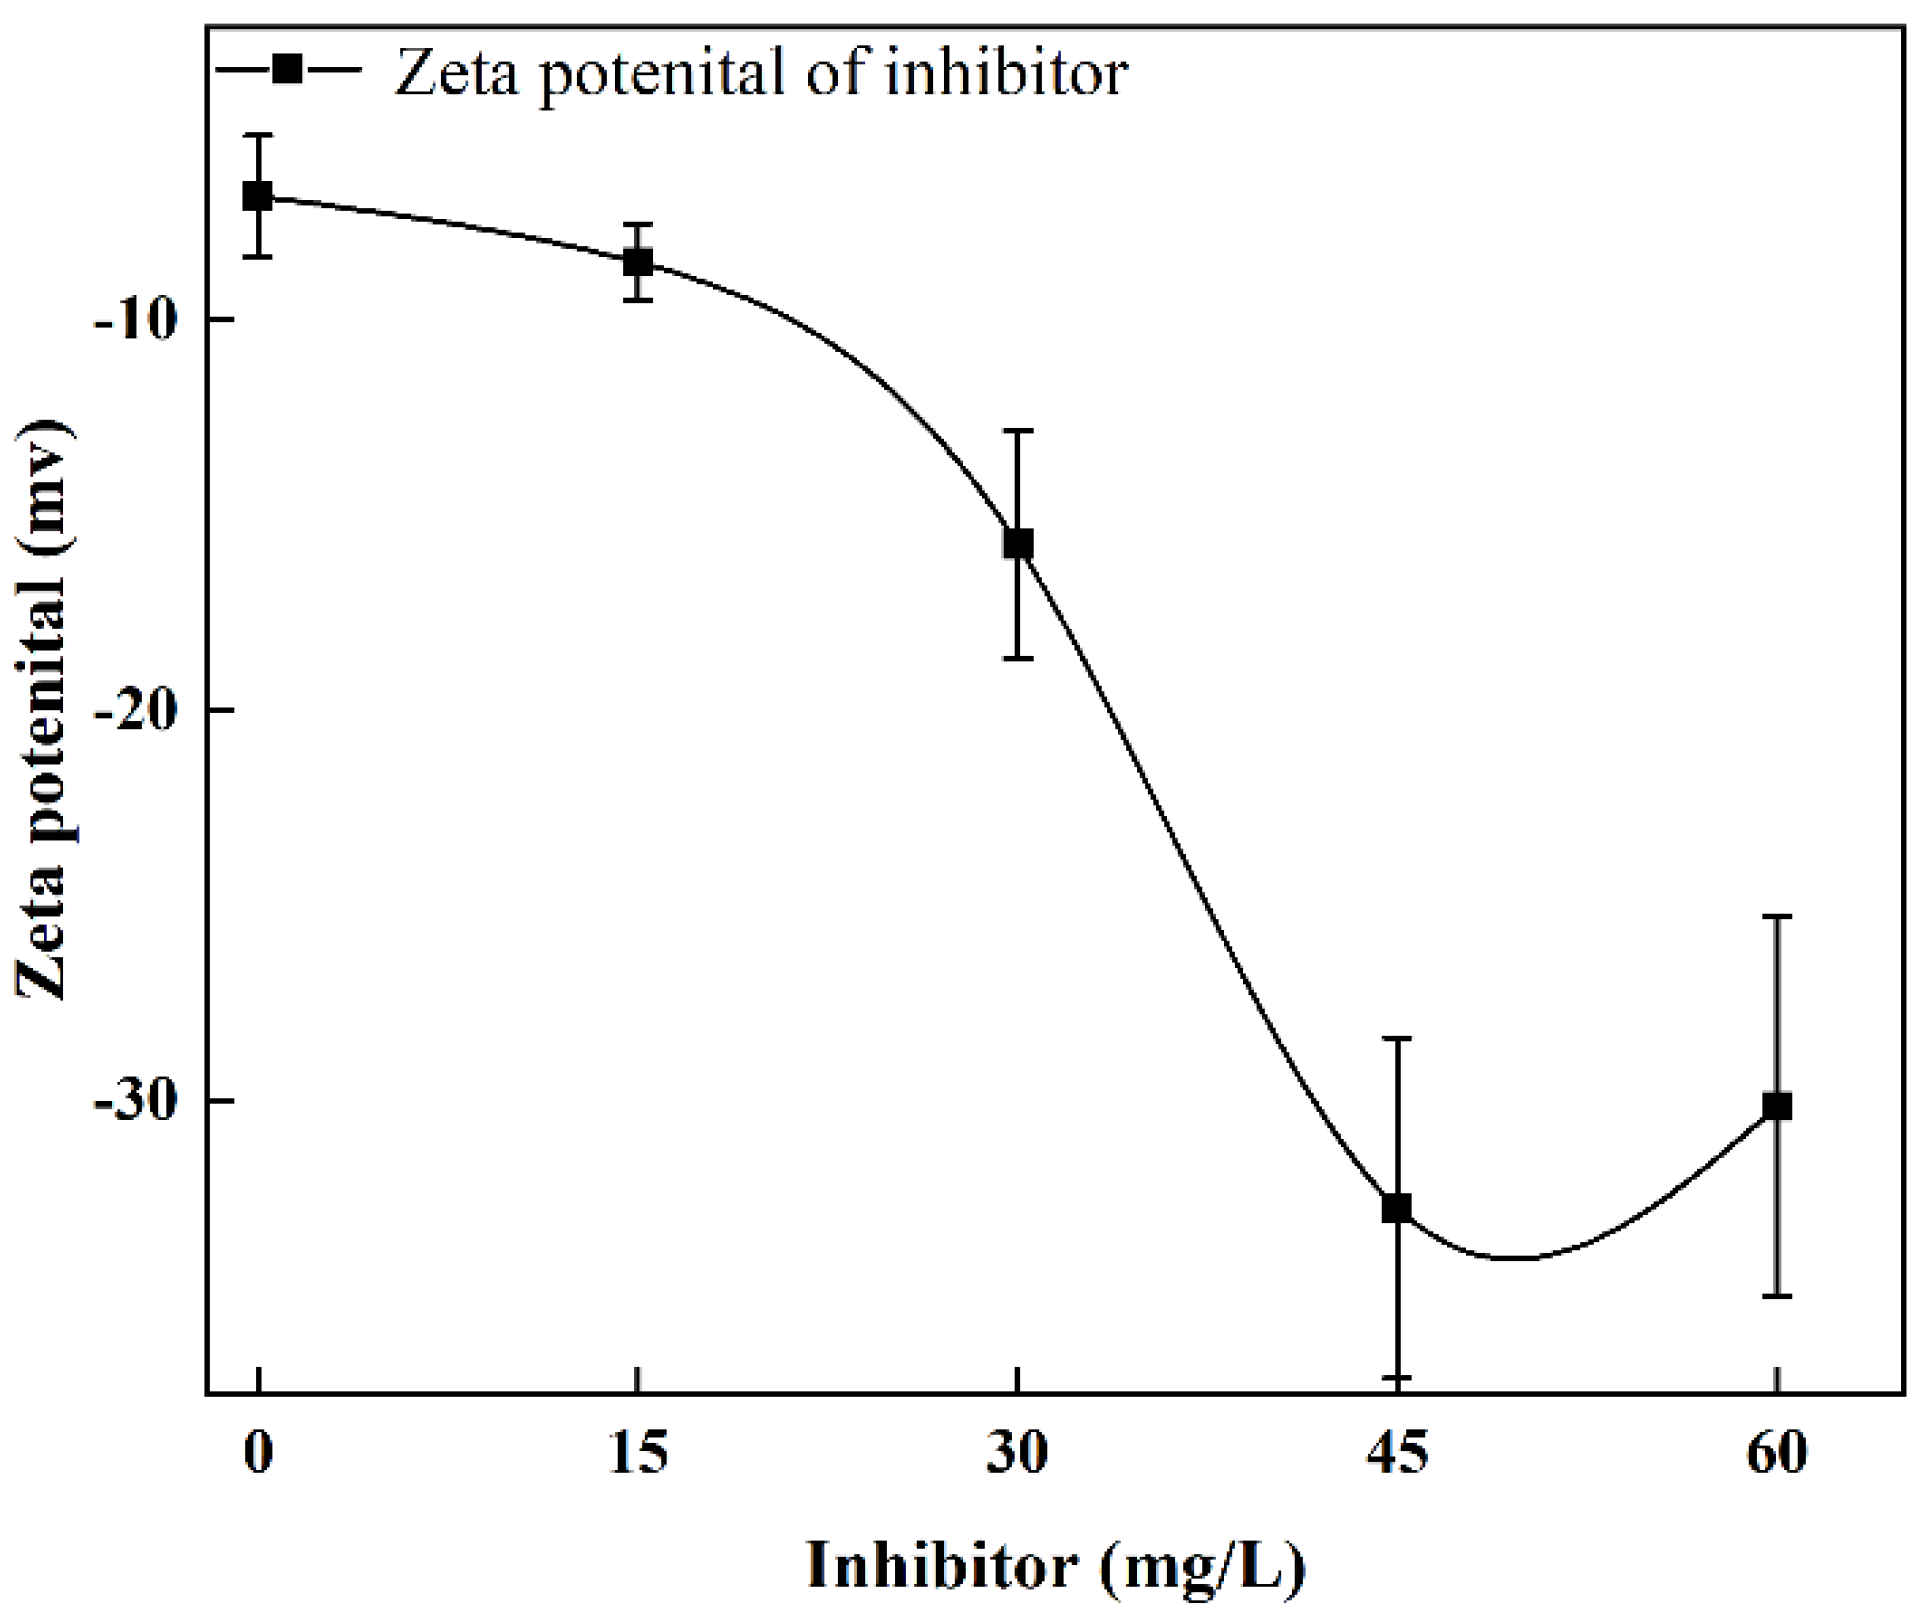
3.3.3. Effect of Inhibitor

Figure 7 shows the relationship between Km value and the different dosage of the inhibitor. Figure 7 shows that the amount of inhibitor also had a significant effect on Km. As the amount of inhibitor increased, the Km value rose first and then decreased. When the inhibitor dosage was 15 mg/L, the value of Km reached the maximum value, indicating that the inhibitor had a certain improvement effect on flotation, but excessive inhibitor dosage worsened the flotation effect. When an appropriate amount of inhibitor was added, the metasilicate ions in the inhibitor adsorbed on the surface of impurity minerals, increasing the hydrophilicity of the impurity minerals, thereby inhibiting impurity mineral upswelling, and thus improving graphite flotation. However, excess inhibitors can also adsorb on the surface of graphite particles and oil droplets, resulting in poor harvesting capacity of the collector and deterioration of hydrophobicity on the surface of graphite particles [36]. That is why the value of Km started decreasing when an excessive amount of inhibitor was used.
The variation of Zeta potential on the particle surface with the amount of inhibitor is shown in Figure 8. Figure 8 shows that with the increase of sodium metasilicate dosage, the Zeta potential electronegativity of the particle surface increased, which indicates that the adsorption of sodium metasilicate on the mineral surface was increasing. The appropriate amount of sodium metasilicate is beneficial to the dispersion of impurity minerals and reduces the adsorption of impurity minerals on the surface of graphite particles, so that the surface of graphite particles can fully contact with the collector. Thus, it increases the hydrophobic difference between graphite particles and impurity minerals, which is beneficial to improve the flotation. However, excessive sodium metasilicate also adsorbs on the surface of graphite particles, thus deteriorating the flotation performance [25].

4. Conclusions

The effect of flotation reagents on the flotation performance of cryptocrystalline graphite was studied from the perspective of flotation kinetic model optimization. The main conclusions are as follows:
(1)
The ash content of the cryptocrystalline graphite ore was 13.02%, and the average particle size was 3.88 μm. Impurity minerals were predominantly quartz and small amounts of oblique chlorite.
(2)
The classical first-order kinetic model had a higher fitting accuracy (R2 > 0.998), and the fitted curve was more consistent with the variation of the concentrate yield with time. Therefore, the classical first-order kinetic model is considered to be more suitable for depicting the flotation behavior of graphite.
(3)
The value of Km increased with increased dosages of collector and frother. The combination of kerosene and 2-Octanol provided better flotation results. In contrast to the results of collector and frother, moderate inhibitor dosages (15 mg/L) promoted flotation of cryptocrystalline graphite, while excessive inhibitor dosages reduced flotation performance.
(4)
With the increase of sodium metasilicate, the Zeta potential electronegativity of the particle surface increased. An appropriate amount of sodium metasilicate was beneficial to the dispersion of impurity minerals, while excessive sodium metasilicate adsorbed on the surface of graphite particles and reduced the flotation performance.

Supplementary Materials

The following supporting information can be downloaded at: https://www.mdpi.com/article/10.3390/separations9120416/s1, Table S1: the calculation results of the six models.

Author Contributions

Conceptualization, J.S.; methodology, R.G. and Y.D.; software, validation, and formal analysis, Z.T. and C.L.; investigation, Z.T.; resources, J.S.; data curation, X.H.; writing—original draft preparation, X.H. and J.S.; writing—review and editing and visualization, Y.S., M.B.; supervision, J.S.; project administration, J.S. and Y.S.; funding acquisition, Y.S. and C.N. All authors have read and agreed to the published version of the manuscript.

Funding

This work was supported by the National Natural Science Foundation of China (grant No. 52204275 and 51904296) and Research Project Supported by Shanxi Scholarship Council of China (2022-059).

Institutional Review Board Statement

Not applicable.

Informed Consent Statement

Not applicable.

Data Availability Statement

Not applicable.

Acknowledgments

The authors acknowledge the contribution to the manuscript from Li Pan.

Conflicts of Interest

The authors declare no conflict of interest.

References

  1. Guo, R.; Li, W.; Han, Y. Progress on the separation, purification and application of natural graphite. Huagong Jinzhan Chem. Ind. Eng. Prog. 2021, 40, 6155–6172. [Google Scholar]
  2. Chehreh Chelgani, S.; Rudolph, M.; Kratzsch, R.; Sandmann, D.; Gutzmer, J. A Review of Graphite Beneficiation Techniques. Miner. Proc. Ext. Met. Rev. 2016, 37, 58–68. [Google Scholar] [CrossRef]
  3. Fuerstenau, M.J.G.Y. Froth Flotation: A Centurey of Innovation; SEM: Littleton, CO, USA, 2007. [Google Scholar]
  4. Wang, X.; Bu, X.; Alheshibri, M.; Bilal, M.; Zhou, S.; Ni, C.; Peng, Y.; Xie, G. Effect of scrubbing medium’s particle size distribution and scrubbing time on scrubbing flotation performance and entrainment of microcrystalline graphite. Int. J. Coal Prep. Util. 2022, 42, 3032–3053. [Google Scholar] [CrossRef]
  5. Peng, W.; Wang, C.; Hu, Y.; Song, S. Effect of droplet size of the emulsified kerosene on the floatation of amorphous graphite. J. Disper. Sci. Technol. 2017, 38, 889–894. [Google Scholar] [CrossRef]
  6. Zhou, S.; Wang, X.; Bu, X.; Shao, H.; Hu, Y.; Alheshibri, M.; Li, B.; Ni, C.; Peng, Y.; Xie, G. Effects of emulsified kerosene nanodroplets on the entrainment of gangue materials and selectivity index in aphanitic graphite flotation. Miner. Eng. 2020, 158, 106592. [Google Scholar] [CrossRef]
  7. Sun, K.; Qiu, Y.; Zhang, L.; Liu, Q.; Mao, Z.; Qian, Y. Enhanced fine flake graphite flotation and reduced carbon emission by a novel water-in-oil kerosene emulsion. Colloids Surf. A Physicochem. Eng. Asp. 2022, 650, 129603. [Google Scholar] [CrossRef]
  8. Shi, Q.; Liang, X.; Feng, Q.; Chen, Y.; Wu, B. The relationship between the stability of emulsified diesel and flotation of graphite. Miner. Eng. 2015, 78, 89–92. [Google Scholar] [CrossRef]
  9. Wang, X.; Bu, X.; Ni, C.; Zhou, S.; Yang, X.; Zhang, J.; Alheshibri, M.; Peng, Y.; Xie, G. Effect of scrubbing medium’s particle size on scrubbing flotation performance and mineralogical characteristics of microcrystalline graphite. Miner. Eng. 2021, 163, 106766. [Google Scholar] [CrossRef]
  10. Ni, C.; Zhang, Q.; Jin, M.; Xie, G.; Peng, Y.; Yu, H.; Bu, X. Effect of high-speed shear flocculation on the flotation kinetics of ultrafine microcrystalline graphite. Powder Technol. 2022, 396, 345–353. [Google Scholar] [CrossRef]
  11. Jin, M.; Xie, G.; Xia, W.; Peng, Y. Flotation Optimization of Ultrafine Microcrystalline Graphite Using a Box-Behnken Design. Int. J. Coal Prep. Util. 2018, 38, 281–289. [Google Scholar] [CrossRef]
  12. Barma, S.D.; Baskey, P.K.; Rao, D.S.; Sahu, S.N. Ultrasonic-assisted flotation for enhancing the recovery of flaky graphite from low-grade graphite ore. Ultrason. Sonochem. 2019, 56, 386–396. [Google Scholar] [CrossRef] [PubMed]
  13. Ma, F.; Tao, D.; Tao, Y.; Liu, S. An innovative flake graphite upgrading process based on HPGR, stirred grinding mill, and nanobubble column flotation. Int. J. Miner. Sci. Technol. 2021, 31, 1063–1074. [Google Scholar] [CrossRef]
  14. Bu, X.; Zhang, T.; Chen, Y.; Peng, Y.; Xie, G.; Wu, E. Comparison of mechanical flotation cell and cyclonic microbubble flotation column in terms of separation performance for fine graphite. Physicochem. Probl. Miner. Process. 2018, 54, 732–740. [Google Scholar]
  15. Bu, X.; Zhang, T.; Peng, Y.; Xie, G.; Wu, E. Multi-stage flotation for the removal of ash from fine graphite using mechanical and centrifugal forces. Minerals 2018, 8, 15. [Google Scholar] [CrossRef] [Green Version]
  16. Li, H.; Ou, L.; Feng, Q.; Chang, Z. Recovery mechanisms of sericite in microcrystalline graphite flotation. Physicochem. Probl. Miner. Process. 2015, 51, 387–400. [Google Scholar]
  17. Li, H.; Feng, Q.; Yang, S.; Ou, L.; Lu, Y. The entrainment behaviour of sericite in microcrystalline graphite flotation. Int. J. Miner. Process. 2014, 127, 1–9. [Google Scholar] [CrossRef]
  18. Zheng, K.; Bu, X.; Zhou, S.; Zhang, J.; Shao, H.; Sha, J.; Xie, G. Effects of monovalent and divalent ions in coal gasification brine on the froth entrainment and flotation kinetics of anthracite coal. Physicochem. Probl. Miner. Process. 2020, 56, 960–974. [Google Scholar] [CrossRef]
  19. Chen, Y.; Bu, X.; Truong, V.N.T.; Peng, Y.; Xie, G. Study on the effects of pre-conditioning time on the floatability of molybdenite from the perspective of cavitation threshold. Miner. Eng. 2019, 141, 105845. [Google Scholar] [CrossRef]
  20. Bu, X.; Xie, G.; Peng, Y.; Chen, Y. Kinetic modeling and optimization of flotation process in a cyclonic microbubble flotation column using composite central design methodology. Int. J. Miner. Process. 2016, 157, 175–183. [Google Scholar] [CrossRef]
  21. Chen, Y.; Li, P.; Bu, X.; Wang, L.; Liang, X.; Chelgani, S.C. In-depth purification of spent pot-lining by oxidation-expansion acid leaching–A comparative study. Sep. Purif. Technol. 2022, 303, 122313. [Google Scholar] [CrossRef]
  22. Vaziri Hassas, B.; Guven, O.; Hassanzadeh, A. An investigation of the recovery and kinetics during the flotation of residual petroleum coke in lime calcination exhaust tailings. Int. J. Coal Prep. Util. 2018, 41, 617–627. [Google Scholar] [CrossRef]
  23. Bu, X.; Xie, G.; Peng, Y.; Ge, L.; Ni, C. Kinetics of flotation. Order of process, rate constant distribution and ultimate recovery. Physicochem. Probl. Miner. Process. 2017, 53, 342–365. [Google Scholar]
  24. Gharai, M.; Venugopal, R. Modeling of flotation process—An overview of different approaches. Miner. Proc. Ext. Met. Rev. 2016, 37, 120–133. [Google Scholar] [CrossRef]
  25. Bu, X.; Evans, G.; Xie, G.; Peng, Y.; Zhang, Z.; Ni, C.; Ge, L. Removal of fine quartz from coal-series kaolin by flotation. Appl. Clay Sci. 2017, 143, 437–444. [Google Scholar] [CrossRef]
  26. Bu, X.; Wang, X.; Zhou, S.; Li, B.; Zhan, H.; Xie, G. Discrimination of Six Flotation Kinetic Models Used in the Conventional Flotation and Carrier Flotation of −74 μm Coal Fines. Acs. Omega 2020, 5, 13813–13821. [Google Scholar] [CrossRef]
  27. Yin, Z.; Xu, L.; He, J.; Wu, H.; Fang, S.; Khoso, S.A.; Hu, Y.; Sun, W. Evaluation of L-cysteine as an eco-friendly depressant for the selective separation of MoS 2 from PbS by flotation. J. Mol. Liq. 2019, 282, 177–186. [Google Scholar] [CrossRef]
  28. Marion, C.; Jordens, A.; Li, R.; Rudolph, M.; Waters, K.E. An evaluation of hydroxamate collectors for malachite flotation. Sep. Purif. Technol. 2017, 183, 258–269. [Google Scholar] [CrossRef]
  29. Oney, O.; Samanli, S.; Celik, H.; Tayyar, N. Optimization of Operating Parameters for Flotation of Fine Coal Using a Box-Behnken Design. Int. J. Coal Prep. Util. 2015, 35, 233–246. [Google Scholar] [CrossRef]
  30. Xu, M. Modified flotation rate constant and selectivity index. Miner. Eng. 1998, 11, 271–278. [Google Scholar] [CrossRef]
  31. Yang, X.; Bu, X.; Xie, G.; Chelgani, S.C. A comparative study on the influence of mono, di, and trivalent cations on the chalcopyrite and pyrite flotation. J. Mater. Res. Technol. 2021, 11, 1112–1122. [Google Scholar] [CrossRef]
  32. Bulatovic, S.M. Beneficiation of graphite ore. In Handbook of Flotation Reagents: Chemistry, Theory and Practice; Elsevier: Amsterdam, The Netherlands, 2015; Volume 3, pp. 163–171. [Google Scholar]
  33. Kaya, O.; Canbazoglu, M. A study on the floatability of graphite ore from Yozgat Akdagmadeni (Turkey). J. Ore Dress. 2007, 9, 40. [Google Scholar]
  34. Gao, Y.; Pan, L. Understanding the mechanism of froth flotation of molybdenite using oily collectors from a perspective of thinning and rupture of thin liquid film. Miner. Eng. 2021, 163, 106805. [Google Scholar] [CrossRef]
  35. Wakamatsu, T.; Numata, Y. Flotation of graphite. Miner. Eng. 1991, 4, 975–982. [Google Scholar] [CrossRef]
  36. Gao, J.; Bu, X.; Zhou, S.; Wang, X.; Alheshibri, M.; Peng, Y.; Xie, G. Graphite flotation by β-cyclodextrin/kerosene Pickering emulsion as a novel collector. Miner. Eng. 2022, 178, 107412. [Google Scholar] [CrossRef]
Figure 1. XRD pattern of graphite.
Separations 09 00416 g001
Figure 2. SEM and EDS analysis of raw graphite ore.
Separations 09 00416 g002
Figure 3. (a) R2 values and (b) maximum recoveries (R) of six flotation kinetic models obtained from experiments in different groups (Test 2: 2700 g/t collector, 5000 g/t frother; Test 4: 3700 g/t collector, 5000 g/t frother; Test 6: 5000 g/t collector, 5000 g/t frother; Test 8: 5000 g/t collector, 1800 g/t frother).
Separations 09 00416 g003
Figure 4. Comparison of different kinetic models fitted to the experimental data of Test No. 1. The fitting curves obtained from models 3, 4, and 5 overlapped completely.
Separations 09 00416 g004
Figure 5. Km value under different dosage of collector.
Separations 09 00416 g005
Figure 6. Km value under different dosages of frother.
Separations 09 00416 g006
Figure 7. Km value under different dosage of inhibitor (kerosene: 5000 g/t; 2−octanol: 5000 g/t).
Separations 09 00416 g007
Figure 8. Zeta potential change under different inhibitor dosages.
Separations 09 00416 g008
Table 1. EDS elemental analysis of graphite.
ElementWt%
Si95.50
Al1.58
Mg0.75
Fe1.60
K0.56
Table 2. Flotation kinetic models and formulas.
No.ModelFormula
1Classical first-order model R = R , 1 1 e K 1 t
2First-order with a rectangular distribution R = R , 2 1 1 e K 2 t K 2 t
3Fully mixed factor model R = R , 3 1 1 1 + t / K 3
4Improved gas/solid adsorption model R = R , 4 K 4 t 1 + K 4 t
5Second-order model R = R , 5 2 K 5 t 1 + R , 5 K 5 t
6Second-order with a rectangular distribution R = R , 6 { 1 1 K 6 t ln 1 + K 6 t }
Publisher’s Note: MDPI stays neutral with regard to jurisdictional claims in published maps and institutional affiliations.

