Article

Optimization Protocol of the PEG-Based Method for OSCC-Derived Exosome Isolation and Downstream Applications

1
School of Dentistry, China Medical University, Taichung 40402, Taiwan
2
Department of Pediatrics, Kaohsiung Medical University Hospital, Kaohsiung Medical University, Kaohsiung 80756, Taiwan
3
School of Nutrition and Health Sciences, College of Nutrition, Taipei Medical University, Taipei 110301, Taiwan
4
Liver Research Center, Department of Hepato-Gastroenterology, Tissue Bank, Chang Gung Memorial Hospital, Taoyuan 33305, Taiwan
5
Department of Healthcare Administration, Asia University, Taichung 41354, Taiwan
*
Author to whom correspondence should be addressed.
Separations 2022, 9(12), 435; https://doi.org/10.3390/separations9120435
Submission received: 17 November 2022 / Revised: 30 November 2022 / Accepted: 9 December 2022 / Published: 13 December 2022
(This article belongs to the Section Purification Technology)

Abstract

:
The exosome precipitation method affects the purity of the exosome and the quality of the downstream application. Polymer-based precipitation is a cost-effective method widely used in different research fields. The percentage of the polymer should be modified in different cell types or liquid biopsy before precipitation. This study aimed to optimize the protocol of the poly(ethylene glycol) (PEG)-based approach for extracting oral squamous cell carcinoma (OSCC)-derived exosomes, and its downstream applications. We used 8%, 10%, and 12% PEG to isolate the exosomes from the culture medium and compared the purity with that of the ultracentrifugation method. In addition, we extracted exosomal protein, DNA, and RNA, and tested the cell transfection efficiency for downstream application. The results reveal that 8% PEG and the medium mixture incubated at 4 °C overnight effectively precipitated exosomes of higher purity and more proper size and particle numbers compared with the ultracentrifuge method. PEG-precipitated exosomes cocultured with fibroblasts showed better transfection efficiency compared to exosomes alone. Therefore, 8% PEG is ideal for OSCC-derived exosome isolation and downstream applications. We recommend that the cost-effective PEG precipitation method be used for precipitating exosomes from OSCC cell experiments.

Graphical Abstract

1. Introduction

Extracellular vesicles (EVs) are lipid bilayer particles that are known to participate in cell–cell signaling via proteins, nucleic acids, and metabolites, and have also been used as a biomarker for disease [1,2,3,4,5]. In contrast with cells, EVs have specific functions, but are unable to self-replicate. EVs can be categorized based on particle size, biochemical composition, function, and cell origin. Exosomes are EVs with a diameter ranging from 30–150 nm and are secreted from cells via fusion with the plasma membrane [6]. Exosomes can be detected via electron microscopy and surface markers CD81, CD63, and CD9 [7,8]. The size and number can be quantified via nanoparticle tracking analysis [9,10].
Evidence has shown that an elevation of exosome secretion is correlated with inflammation, hypoxia, and an acidic environment, and is associated with tumorigenesis [11,12]. The exosomes containing DNA, RNA, and protein molecules are widely investigated in cancer research as a biomarker or cargo that mediates biological or pathological processes [13,14,15]. For the past decade, numerous articles have reported the role and function of exosomes in cancer. The issue of how to isolate exosomes with a simple step, high purity, and efficiency is increasingly important for researchers who conduct exosome experiments.
In recent decades, the separation method in exosome isolation has continuously improved. The classical separation method is ultracentrifugation, which has a high recovery rate, but requires careful and skilled operation to avoid sample loss. The drawback is that researchers need to wait in line to use a high-cost precision instrument, and the procedure is time-consuming. Other modified techniques, such as size exclusion-based, antibody-coated immune-bead, and microfluidic-based isolation, are excellent methods for isolating exosomes from liquid specimens. However, researchers should consider the high cost of consumables [16].
Polymer-based precipitation is a cost-effective method of isolating exosomes from liquid specimens. This method is widely used in a wide spectrum of research fields, including cell-derived [17], saliva-derived [18], serum-derived [19], urine-derived [20], and plant-derived [21] exosome isolation and virus particle isolation [22]. These studies use poly(ethylene glycol) (PEG) at concentrations ranging from 5% to 15%. The exosome isolation procedure and PEG concentration significantly impact the purity of the exosome and the quality of downstream applications [23]. The most common downstream application of exosomes is differential expression of DNA and RNA between the disease and control. Furthermore, exosome-mediated changes in the tumor microenvironment and using exosomes as drug delivery cargo for disease treatment are still state-of-the-art cancer research topics [24,25,26].
This study aimed to optimize the PEG-based method for isolation of oral squamous cell carcinoma (OSCC)-derived exosomes and optimize the protocol for downstream applications of DNA and RNA extraction, quantitative polymerase chain reaction (qPCR), and coculture experiments, providing a reference for OSCC-derived exosome studies in the future.

2. Materials and Methods

2.1. Cell Culture and Media

OSCC cells (1 × 10⁵; gift from Chung-Shan Medical University Prof. Yu) were cultured in a 10 cm dish containing 10 mL of medium (Gibco, Waltham, MA, USA) with 10% fetal bovine serum (Gibco, Waltham, MA, USA) and 1% 3-in-1 antibiotic (Gibco, Waltham, MA, USA) at 37 °C. The media used for the different cell lines in this study were as follows: SAS cells were cultured in Dulbecco’s modified eagle medium (DMEM), HSC3 cells were cultured in DMEM/F12, and OECM-1 cells were cultured in Roswell Park Memorial Institute medium (RPMI). MG63 fibroblasts were cultured in DMEM. Before exosome isolation, the cells were cultured in 10 mL of serum-free medium with 1% 3-in-1 antibiotic for 24 h. The medium was collected and centrifuged at 900× g for 30 min to remove cell debris at the bottom of the tube. The supernatant was aspirated, filtered with 0.22 µm syringe filter (Pall Life Sciences, Port Washington, NY, USA) to exclude molecules larger than 0.22 µm, and stored at 4 °C prior to exosome isolation.

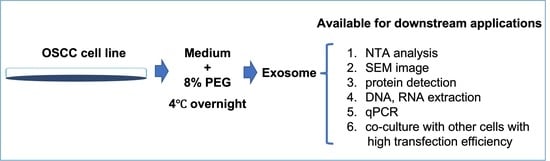
2.2. PEG-Based Exosome Isolation

PEG 6000 (40 g; Sigma-Aldrich, St. Louis, MO, USA) was dissolved in 100 mL of phosphate-buffered saline (PBS) to make a 40% PEG 6000 solution. Ten milliliters of prefiltered medium (described in the previous section) were mixed with 2.5, 3.3, and 4.3 mL of 40% PEG solution to obtain mixtures of 8%, 10%, and 12% PEG-medium solution, respectively. The mixture was incubated at 4 °C for 16 h, followed by centrifugation at 16,000× g for 1 h at 4 °C, and the PEG-exosome pellet sedimented at the bottom of the centrifuge tube. The upper liquid layer was discarded, and a specific buffer or reagent was added for downstream applications.

2.3. Scanning Electron Microscopy

Two microliters of PEG-exosome (in PBS) were aspirated and mixed with 2 µL of 4% paraformaldehyde for 10 min to fix the exosomes. Two microliters of the diluted samples (250× dilution with PBS) were dropped onto cleaned cover slides and air dried in a fume hood at room temperature overnight. The samples were coated with platinum (HITACHI E-1010 ION SPUTTER; Hitachi High-Tech Corporation, Japan) and observed and imaged using a scanning electron microscope (HITACHI S-4800; Hitachi High = Tech Corporation).

2.4. Nanoparticle Tracking Analysis (NTA)

The PEG-exosome pellet was diluted with PBS and injected into the assembled sample chamber. The video images of exosomes were acquired using a NanoSight NS300 system (Malvern Panalytical, Westborough, MA, USA). We started detecting the size and concentration after the video showed 20–200 particles/frame. Each sample was recorded for 1 min, and the data represent the average of five measurements.

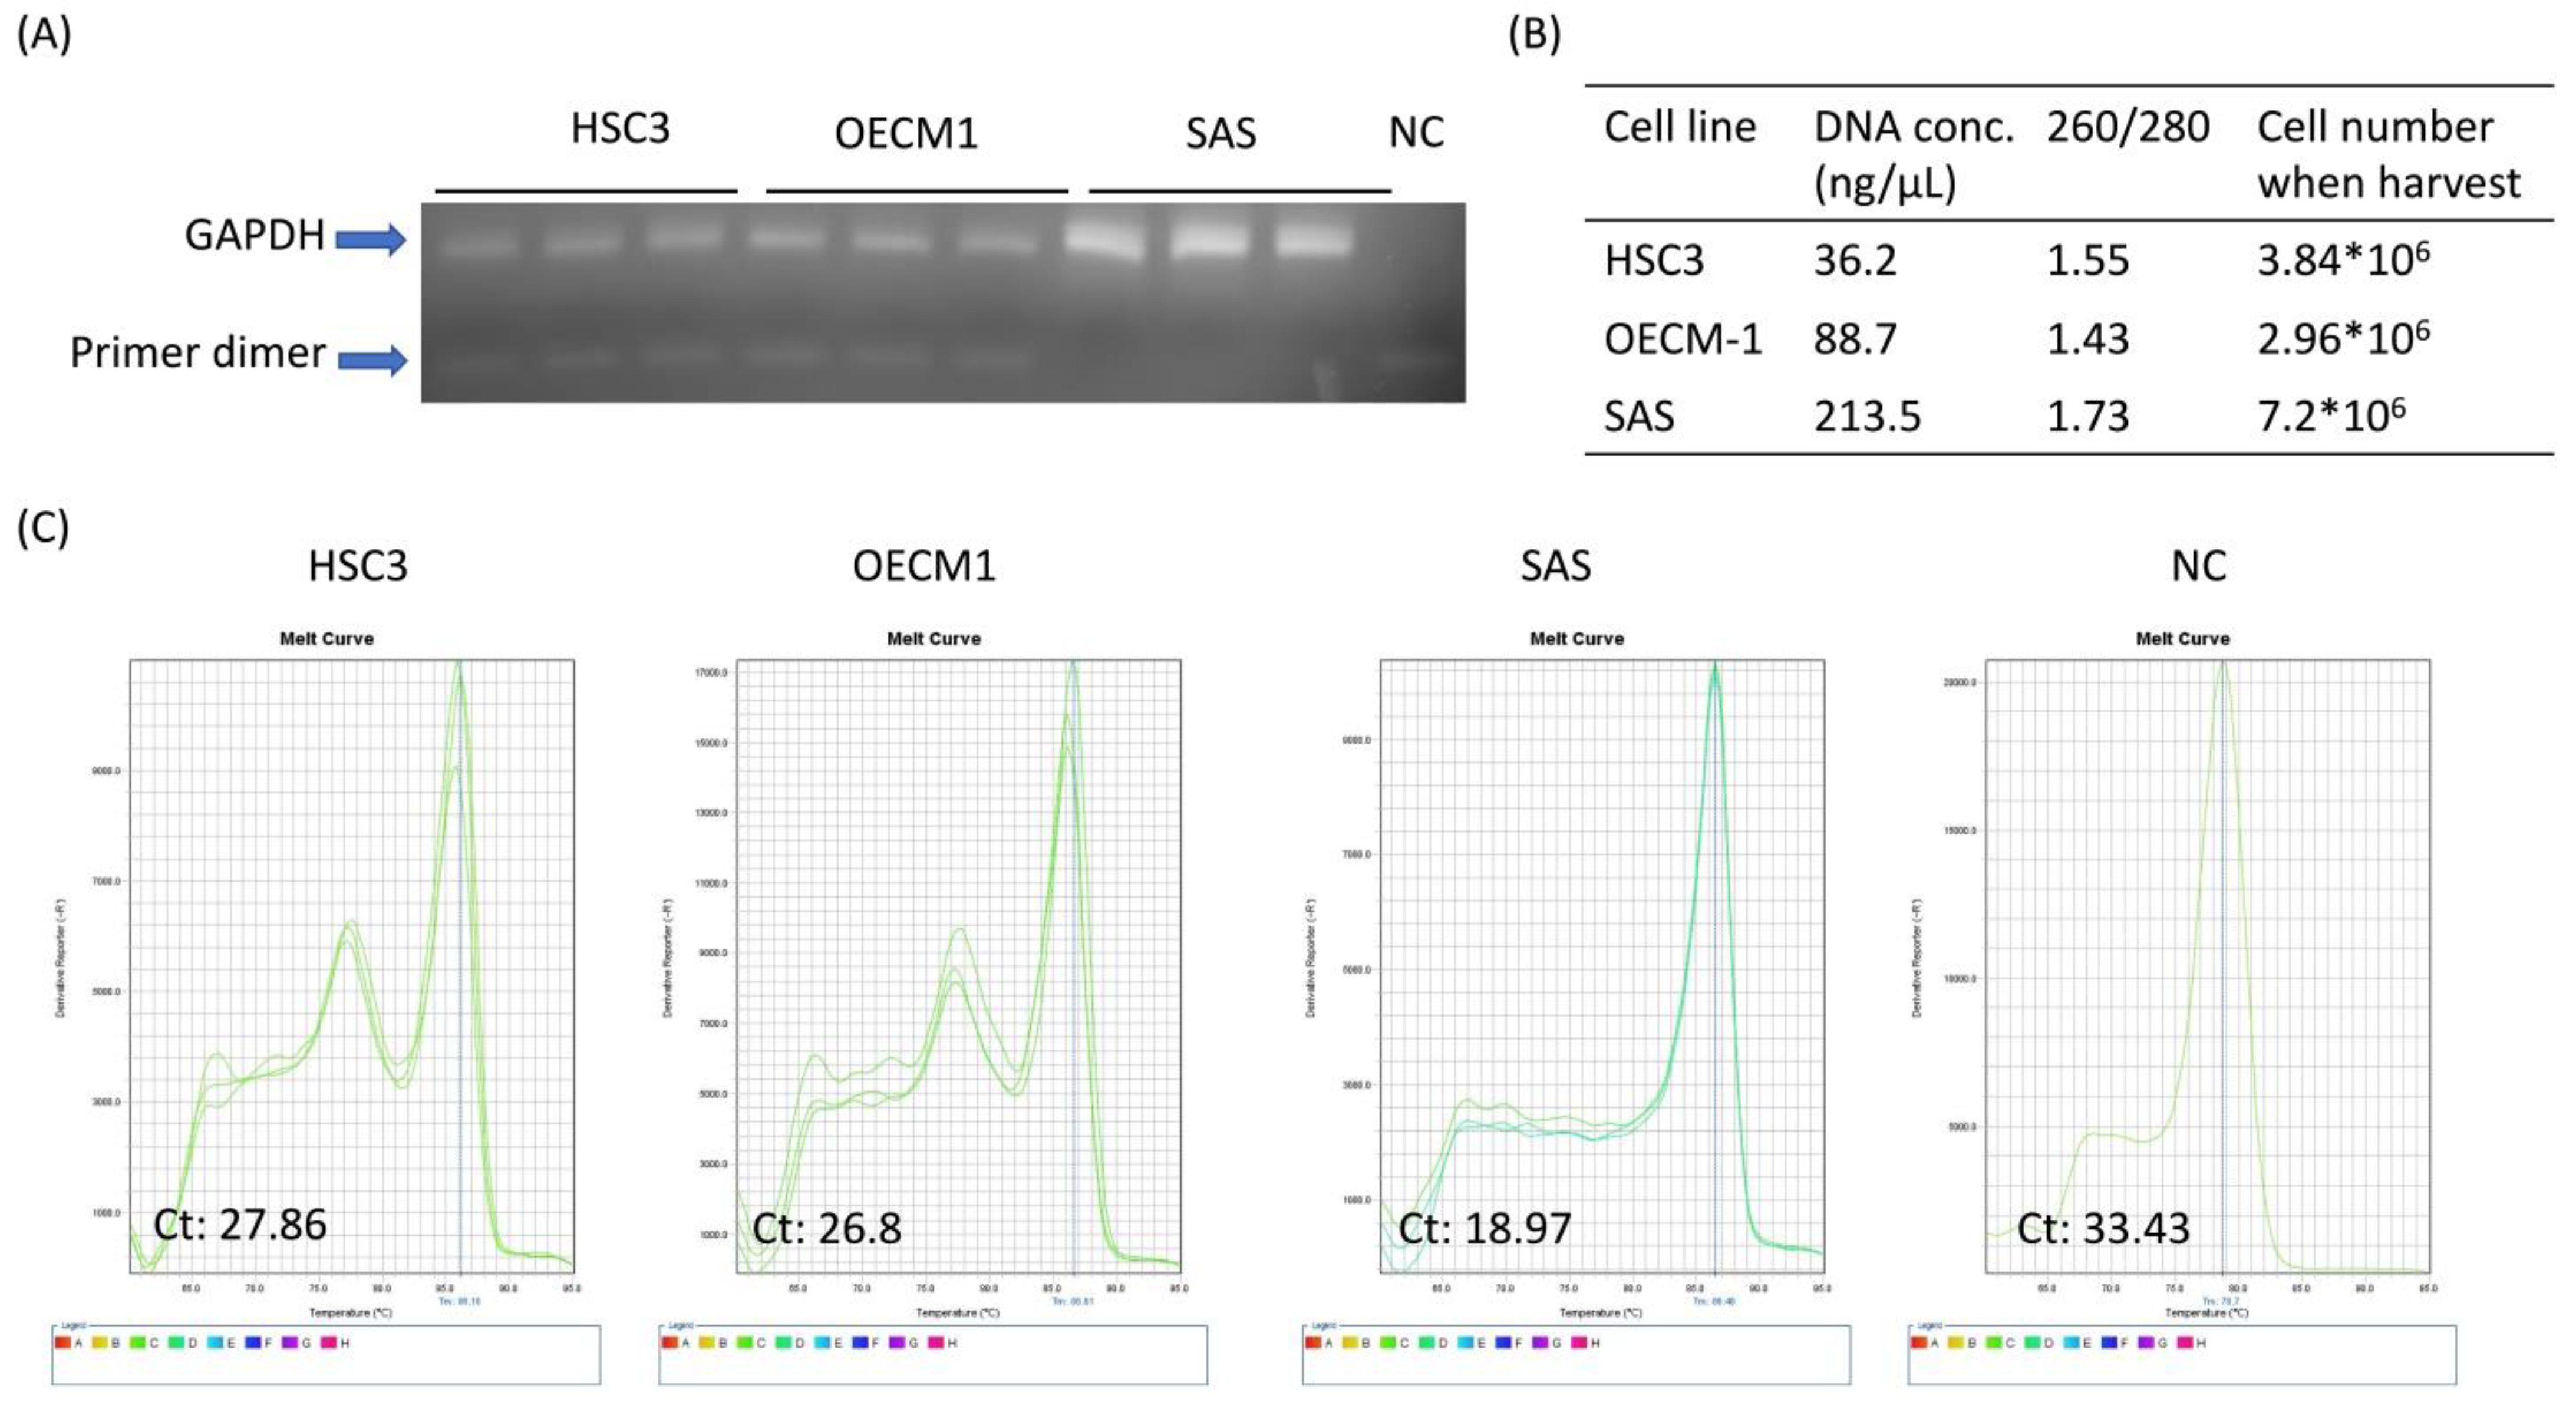
2.5. DNA Extraction and Analysis

Twenty milliliters of serum-free medium were collected for exosome pellet production. Following exosome isolation, the pellet settled at the bottom of the centrifuge tube. To remove non exosomal DNA around the pellet, the sample was treated with 20 μL of DNase I and incubated at 37 °C for 30 min, followed by incubation with 10 mM of ethylenediaminetetraacetic acid at 75 °C for 10 min to stop the reaction. Then, exosomal DNA was extracted (Viogene, Taiwan) following the manufacturer’s instructions. To further concentrate the DNA, the nucleic acid precipitation method was applied. First, 1 μL of carrier (20 mg/mL glycogen), 0.1 sample volume of 3 M sodium acetate, and 3 sample volumes of 100% ethanol were added to the sample, mixed thoroughly, and incubated at −80 °C overnight. The sample was centrifuged at 12,000 rpm for 30 min at 4 °C, after which the supernatant was removed, and the pellet was washed with cold 75% ethanol. The sample was then centrifuged at full speed for 10 min at 4 °C. The wash step was performed twice, and the supernatant was then removed. The DNA pellet was air dried and dissolved in 15 μL of distilled water.

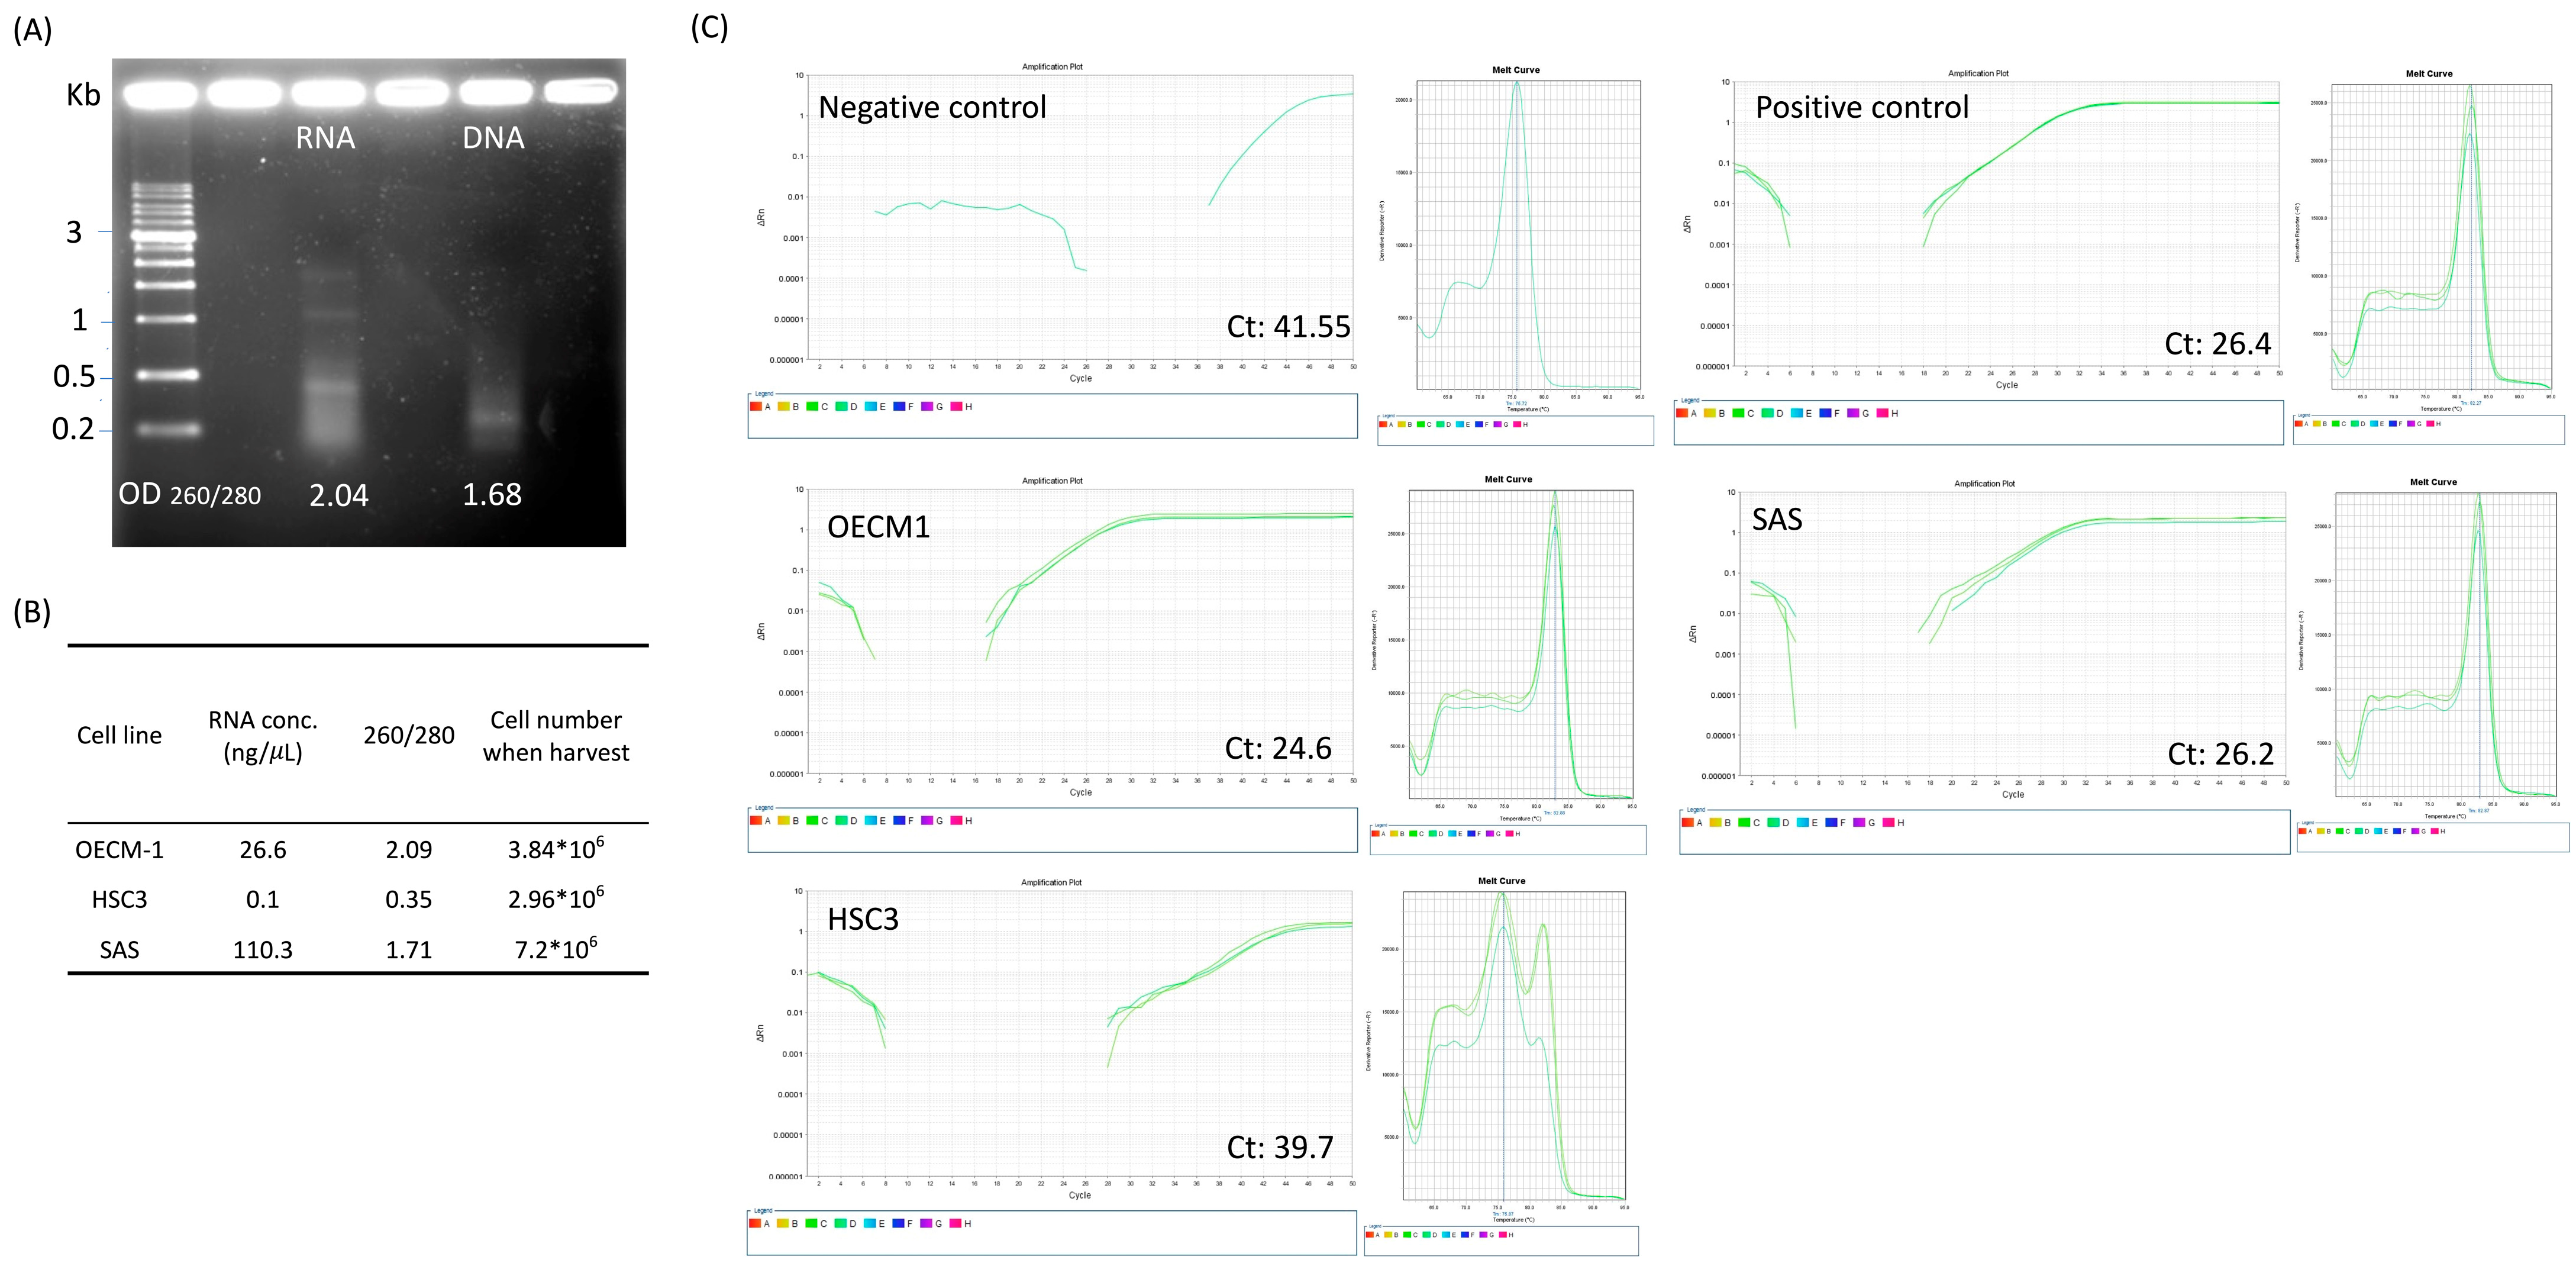
2.6. RNA Extraction and Analysis

The PEG-exosome pellet was treated with 1 mL of TRI Reagent (Sigma-Aldrich) and incubated at room temperature for 5 min. Then, 100 μL of 1-bromo-3-chloropropane (Sigma-Aldrich) was added to the mixture, which was vortexed vigorously for 15 s and incubated for 5 min. After incubation, the sample was centrifuged at 12,000 rpm for 15 min at 4 °C. The upper layer (transparent color) of the solution was then carefully transferred to a new centrifuge tube and gently mixed with an equal volume of isopropanol (Sigma-Aldrich). After mixing, the sample was incubated at room temperature for 15 min, followed by centrifugation at 12,000 rpm for 10 min at 4 °C. Finally, the pellet containing exosomal RNA was washed with 75% ethanol twice and air dried prior to resuspension with RNase-free water.

2.7. Protein Extraction and Analysis

The exosome, resuspended in 100 μL of PBS, was lysed with 10× radioimmunoprecipitation assay buffer (Millipore, Burlington, MA, USA) and treated with protease inhibitor (GoalBio, Taiwan). The samples were frozen at −20 °C overnight, followed by centrifugation at 13,800× g for 20 min. The supernatant was collected, and the protein concentration was determined using a Bio-Rad protein assay dye reagent. The protein samples (5 μg) were prepared with 4× LDS sample buffer (BoltTM; Invitrogen, Waltham, MA, USA) and ran on a 10% Bis–Tris gel system, after which the proteins were transferred onto polyvinylidene difluoride membranes (Millipore) via wet electroblotting. The membranes were blocked with 0.5% non-fat dry milk in 1× Tris-buffered saline with 0.5% Tween 20 (TBST) at room temperature for 1 h and then probed with the following primary antibodies overnight at 4 °C: anti-CD9 (sc-13118), anti-CD63 (sc-5275), and anti-CD81 (sc-7637), all from Santa Cruz Biotechnology (Dallas, TX, USA). The membranes were then washed thrice with 1× TBST and incubated with horseradish peroxidase-conjugated secondary antibody (Jackson ImmunoResearch Laboratories, Inc., West Grove, PA, USA) for 4 h at 4 °C. After washing with TBST, the protein bands were visualized with SuperSignalTM West Atto Ultimate Sensitivity Chemiluminescent Substrate (Thermo Scientific, Waltham, MA, USA).

2.8. Exosomes Staining and Confocal Microscope Photograph for Coculture Results

The exosome pellet of the exosome-only group was collected by ultracentrifugation, and the PEG + exosome group was collected by the PEG6000 precipitation method. The exosomes were stained using PKH67 Green Fluorescent Cell Linker Kits (Sigma-Aldrich, St. Louis, MO, USA). The PEG + exosome, exosome-only, and PEG-only materials were cocultured with Mg63 cells in serum-free DMEM medium for 4 h in a chamber slide. Then the cells were fixed with 10% formalin (Sigma-Aldrich, St. Louis, MO, USA) for 15 min, the nucleus was stained with 1 ug/mL HOECHST33258 for 10 min (INVITROGEN, Waltham, MA, USA), and the cells were mounted with aqueous mounting solution (SCYTEK, Logan, UT, USA) for confocal microscope photograph (Leica TCS SP8 X Confocal Spectral Microscope Imaging System, New York, NY, USA).

3. Results

3.1. PEG-Medium Mixture Stored at 4 °C Overnight Yields Higher Protein Concentration

We seeded 90% confluent OSCC cells in a 10 cm culture dish with a serum-free medium and collected the medium (10 mL) after 48 h. The medium was centrifuged to remove debris and filter particles larger than 0.22 µm. Based on previous studies, we chose 8–12% as the final PEG concentration to modify our precipitation conditions for the OSCC cell line. A flowchart of the protocol is shown in Figure 1. We incubated the PEG–culture medium mixture at 4 °C for 4 h or overnight. The overnight group yielded a higher protein concentration than the 4 h group (Figure 2A). The precipitated pellets were more clearly shown with increasing PEG concentration (Figure 2B).

3.2. 8% PEG Is Suitable for Precipitation of OSCCl-Derived Exosome

We analyzed the physical properties, including particle size, number, and outward appearance of the precipitated exosomes using the NTA method. The results show that the main peak of the OSCC-derived exosomes was approximately 50–100 nm. The pattern of particle size of the 8–10% PEG group was similar with that of the ultracentrifuge group (Figure 3A). However, we observed that the 8% PEG group had the simplest peak compared with the other groups. In the 8% PEG group, the SAS cells aggregated at PEG concentrations higher than 10% (Figure 3B). The number of exosomal particles increased in a PEG concentration-dependent manner (Figure 3C). Thus, 8% PEG was suitable for the extraction of exosomes from three different OSCC cell lines. The 8% PEG-precipitated exosomes had a higher number and uniform particle size compared with the ultracentrifuge-precipitated exosomes. The cell morphology of the three different cell types is shown in Supplementary Figure S1.

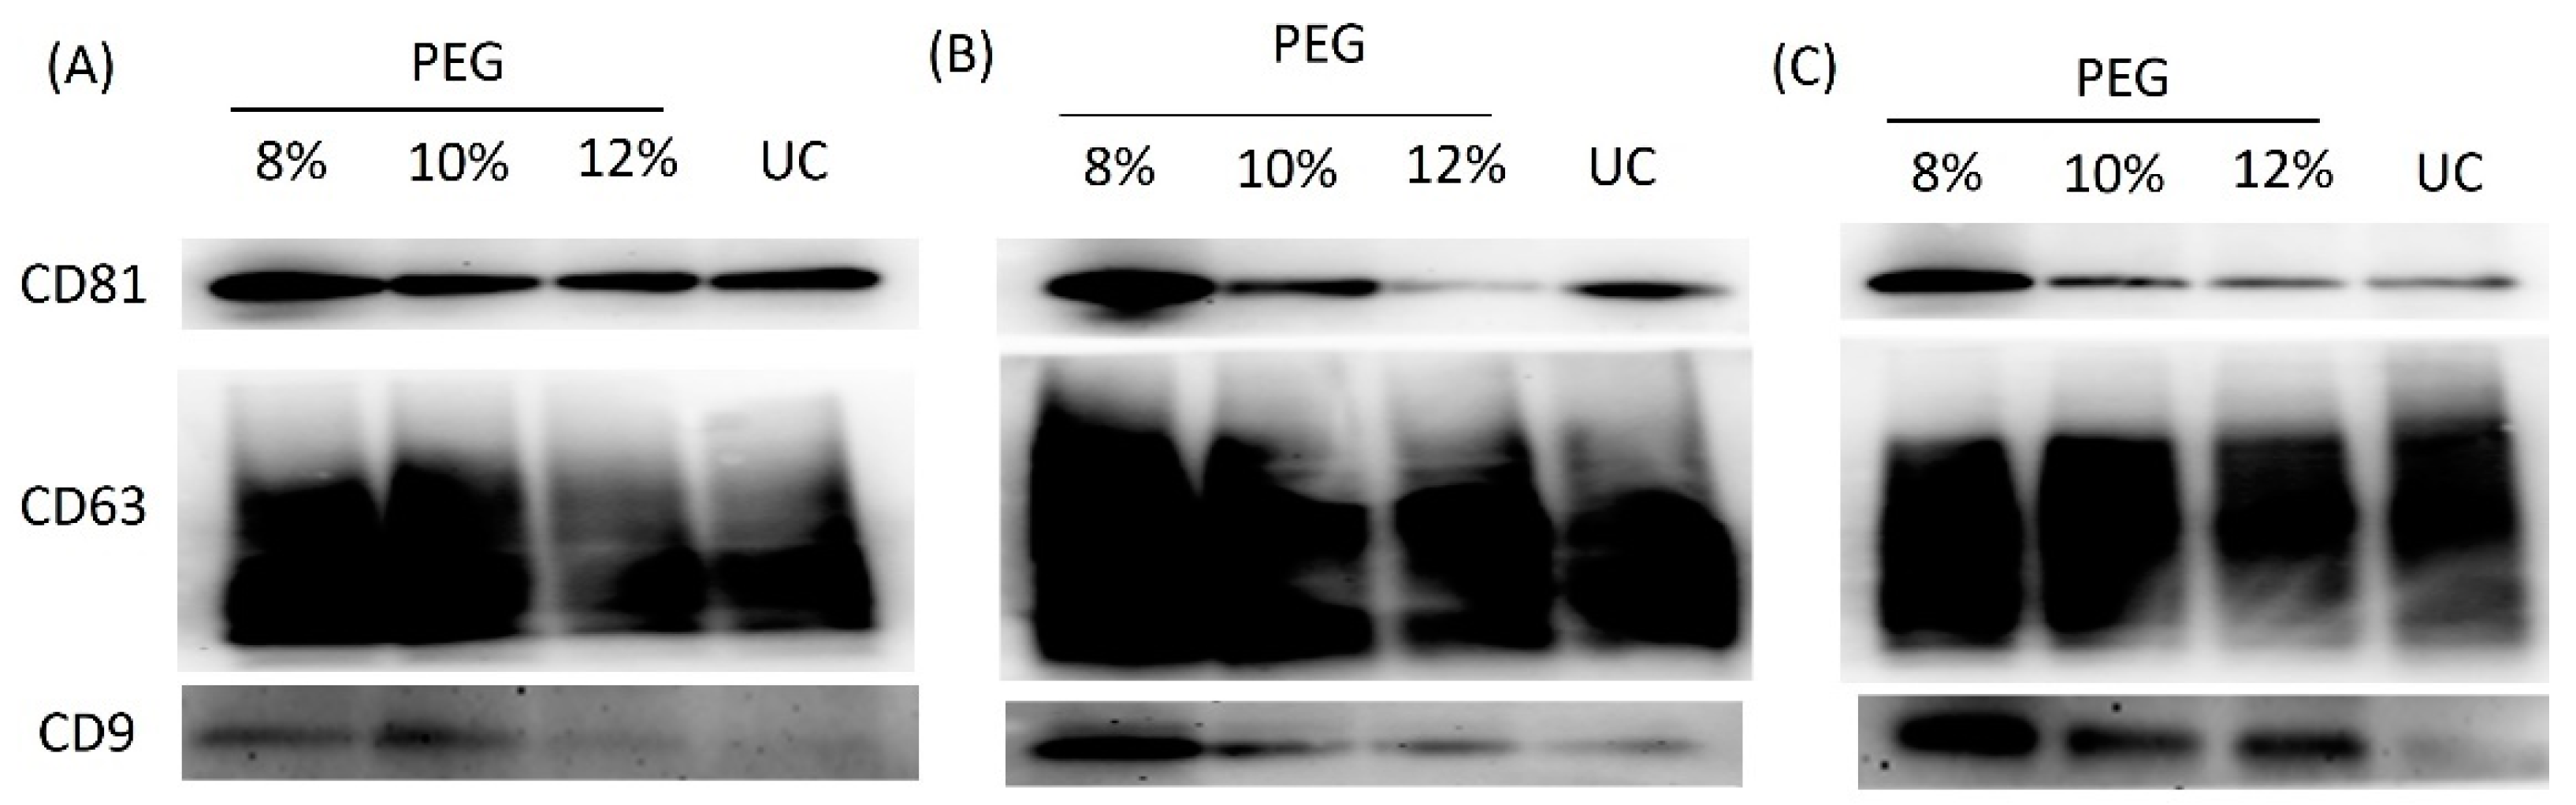
3.3. Exosomes Precipitated by 8% PEG Had the Highest Exosomal Surface Marker Intensity

We investigated the correlation of CD marker intensity with the exosomal particle number (Supplementary data S1). The results reveal a positive correlation between the two. We further determined the CD marker intensity of the exosomes isolated from different cell lines and different groups (Figure 4) and found that the 8% PEG group had the strongest intensity of CD markers compared with the other groups. As shown in Figure 2, Figure 3 and Figure 4, 8% PEG was able to best precipitate the exosome particles from OSCC cell lines, and the precipitation efficiency is better than that of the ultracentrifugation method.

3.4. 8% PEG-Precipitated Exosome Yields High-Quality DNA and RNA for Downstream Biomolecular Applications

Exosomal nucleic acids (DNA and RNA) were extracted from three different cell lines. We extracted high concentrations of DNA and RNA from the SAS-derived exosome and verified the quality via gel electrophoresis and optical density values Figure 5A,B and Figure 6B). Meanwhile, the nucleic acid concentration of HSC3 and OECM-1 were too low for detection via gel electrophoresis. The DNA (Figure 6B) and RNA (Figure 5B) concentration was positively correlated with the cell number while the exosome was harvested. We performed qPCR for U6 miRNA (Figure 5C) and GAPDH of DNA (Figure 6) to check the feasibility of downstream applications and found that the cycle threshold (Ct) value was negatively correlated with the RNA and DNA concentration. We successfully detected U6 expression in SAS- and OECM-1-derived exosomes (a single-peak melting curve and Ct value was between the value of the positive and negative control). In contrast, we were unable to detect U6 expression in HSC3-derived exosomes due to the low exosomal RNA concentration (high Ct value and multi-peak melting curve). As shown in Figure 3, Figure 5 and Figure 6, the total exosomal particle number in the medium was positively related to the cell number while the exosomes were harvested and was positively related to the nucleic acid concentration of downstream applications.

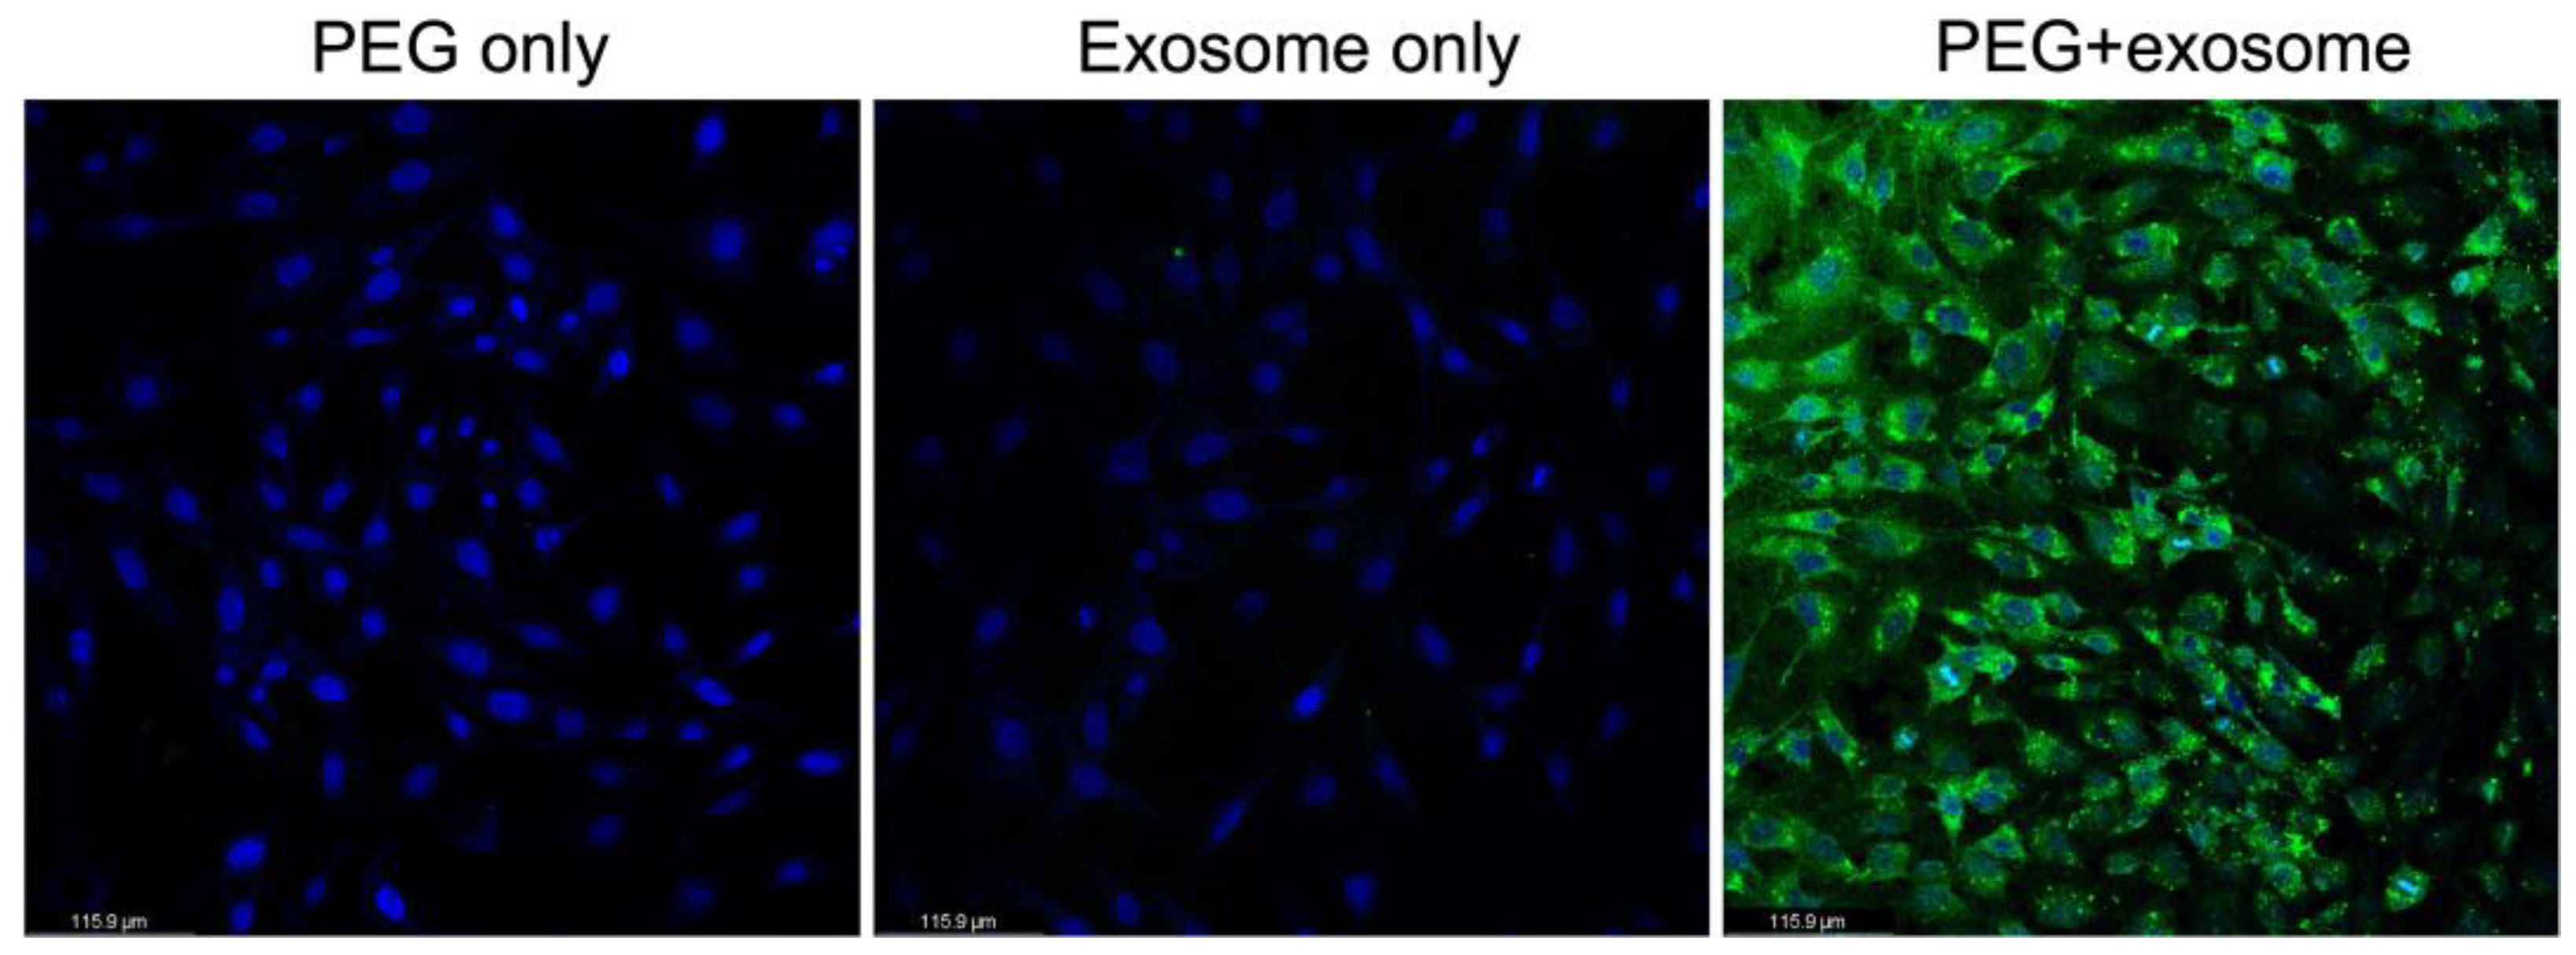
3.5. PEG Enhance the Entrance Efficiency of Exosome to Cells

Exosomes are functional microvehicles that interfere with the microenvironment of other cells. We cocultured SAS-derived exosomes and human MG-63 fibroblasts. We labeled the nuclei with blue fluorescence (HOECHST33258) and stained the exosomes with green fluorescent dye (PKH67) (Figure 7). In the PEG-only group, the green fluorescence signal was not detected in or around the cells. In the exosome-only group, we detected slight green fluorescence in the cells. In the PEG with exosome group, we detected stronger green fluorescence in the cells. These findings reveal that our optimization of exosome precipitation can enhance the entry rate of exosomes to cells. PEG-based precipitation of exosomes is a practical method for downstream cell coculture applications.

4. Discussion

The results show that, compared with the traditional ultracentrifugation method, PEG-based isolation of OSCC-derived exosomes is efficient and stable to obtain a high purity yield; is available for downstream applications, such as DNA and RNA extraction; and is convenient for directly proceeding coculture experiments. The PEG-based method is easy to handle for inexperienced technicians. The higher concentration of PEG may pull more exosomes down from the medium; however, it would aggregate the cells in a mass and show a larger particle size in NTA analysis (Figure 3). Exosome aggregation may affect cell lysis efficiency. As a result, we could not observe more exosome particles pulled down at higher concentrations of PEG with a higher CD marker expression (Figure 4). The PEG percentage used in different sample types needs to be modified. This study can explain why the commercial kit cannot stalely yield high-quality exosomes.
For the exosomal protein capture and detection, we incubated the PEG-medium mixture at room temperature or 4 °C overnight and compared the CD marker expression. The results show that PEG captured more protein from the medium at 4 °C (Figure 2) and had a better CD marker signal compared with the room temperature group (data not shown). Initially, we encountered problems in conducting a western blot using the tris-glycine gel system. The protein sample could not form a compact band in the stacking gel, and the size of the CD marker that appears on the membrane was unstable. We speculate that the salivary exosome protein had a higher proportion that underwent modification during electrophoresis in an acidic gel system. Thus, we changed the system to a Bis–Tris gel system. We also observed that the CD marker expression depended on the particle number of exosomes (supplementary data S1). Thus, good exosome CD marker detection depends on a proper exosome particle number (more than 2 × 10¹⁰), particle lysis efficiency (less aggregation mass), and the pH value of the gel system (neutral gel system). In addition, researchers can exclude the endoplasmic reticulum or Golgi apparatus contamination by detecting the relative markers, such as calnexin and GM130, simultaneously [27].
DNA is destroyed by various developmental processes in mammals. It can be a pathogenic molecule if not properly degraded [28]. In the clinical setting, researchers detected cell-free DNA (cfDNA) in the serum of patients, as well as healthy individuals [29]. An in vitro experiment showed that cells actively release cfDNA into the medium [30]. The size of cfDNA released due to cell apoptosis ranges from 150–1000 bp [31], and that of cfDNA released due to necrosis is larger than 10,000 bp [32]. cfDNA may originate from the mitochondria or the nucleosome [33]. It not only exists in exosomes as a marker for diseases [34], but also in the medium. We excluded cfDNA in the medium while extracting the cfDNA in the exosome via pretreatment with DNase I. Based on the size of the DNA (200–500 bp) we extracted (Figure 5), the OSCC-derived cfDNA may originate from apoptosis. Future experiments can focus on the differential expression of cfDNA fragments between the three cell lines or apply to salivary exosome biomarker detection from bench to bedside.
An exosome contains various RNA species, such as mRNA, piRNA, snRNA, circRNA, lncRNA, tRNA, and snoRNA [35]. Most of the RNAs expressed in exosomes are considered as diagnostic biomarkers of disease. However, exosomes are secreted from various tissues and are released into the bloodstream. The various sources of exosomes and various RNA species make analysis of the differential expression in blood samples for a specific disease more complicated. Saliva also contains numerous molecules; however, the salivary exosomal molecules are believed to reflect the biomarker profile of oral lesions more precisely compared with blood exosomal molecules. Our study employed the PEG method to precipitate OSCC-derived exosomes. However, the PEG method is not suitable for the precipitation of exosomes from protein-rich saliva due to the high affinity of PEG to biomolecules such as DNA, RNA, and protein. In future studies, we will employ the PEG-based method to precipitate the exosomes and remove unnecessary molecules in the saliva.
Exosomes are novel cell–cell communication mediators that transport biomolecules, including lipid, protein, DNA, and RNA, between cells locally and systematically. Cell–cell communication occurs not only in tumor cells, but also in healthy cells, such as fibroblasts and endothelial cells. The exosome-mediated cell–cell communication may affect the process of angiogenesis, tissue inflammation [36], tumorigenesis [37], and immunologic remodeling [38]. Therefore, the exosome-based cell–cell communication is a common topic in cancer research. PEG-mediated transfection is a well-known method to deliver biomolecules into cells [39,40]. Our data show that the PEG-coated exosome had a higher transfection efficiency than the exosome alone (Figure 7). This indicates that the PEG-based exosome precipitation is suitable for downstream coculture experiments.
Despite the findings, our study has some limitations. The exosome precipitation conditions were used for OSCC-derived exosomes, and the percentage of PEG should be adjusted for different types of cell line or liquid specimens. In addition, we used a serum-free medium to collect the OSCC-derived exosome. The protein constitution in the medium is simpler than that in body fluids. Thus, the PEG-precipitation method used in body fluids should use extra consumables, such as a size exclusion column or coating beads, to remove unwanted molecules. Furthermore, the quality of exosomal DNA and RNA depends on the exosomal particle number. Researchers should pretest the correlation between exosomal particle number and the quality of nucleic acid before DNA and RNA extraction.

5. Conclusions

The 8% PEG-medium mixture stored at 4 °C overnight is the ideal condition to precipitate OSCC-derived exosomes in a medium. This method is also available for the downstream application of DNA and RNA extraction for qPCR, protein detection, and cell-exosome coculture research. We suggest that the PEG percentage and cell membrane lysis efficiency should be adjusted for different cell lines.

Supplementary Materials

The following supporting information can be downloaded at: https://www.mdpi.com/article/10.3390/separations9120435/s1, Figure S1: The morphology of OSCC cell lines; Data S1: The intensity of CD81 and the relative exosome particle number.

Author Contributions

Conceptualization, T.-M.S. and Y.-H.S.; methodology, Y.-H.S. and W.-C.L.; formal analysis, Y.-H.S.; writing—original draft preparation, T.-M.S.; writing—review and editing, Y.-H.S.; supervision, Y.-H.T., S.-M.H., and T.-H.W.; funding acquisition, Y.-H.S. All authors have read and agreed to the published version of the manuscript.

Funding

This research was funded by the Ministry of Science and Technology, Taiwan (MOST 109-2314-B-468-006-MY3 and MOST 111-2314-B-039-027-MY3), and China Medical University, Taiwan (CMU111-S-36 and CMU111-MF-38).

Data Availability Statement

Not applicable.

Acknowledgments

We thank Yu of the Chung-Shan Medical University and Lin of the China Medical University for providing the cell lines. Experiments and data analysis were partly performed using the Medical Research Core Facilities Center in the Office of Research and Development at China Medical University (Taichung, Taiwan).

Conflicts of Interest

The authors declare no conflict of interest. The funders had no role in the design of the study; in the collection, analyses, or interpretation of data; in the writing of the manuscript; or in the decision to publish the results.

References

  1. Wang, W.C.; Huang, M.Y.; Chen, Y.K.; Lan, W.C.; Shieh, T.M.; Shih, Y.H. Salivary Exosome Proteomics and Bioinformatics Analysis in 7,12-Dimethylbenz[a]anthracene-Induced Oral Cancer with Radiation Therapy-A Syrian Golden Hamster Model. Diagnostics 2021, 12, 65. [Google Scholar] [CrossRef] [PubMed]
  2. Du, Y.; Dong, J.H.; Chen, L.; Liu, H.; Zheng, G.E.; Chen, G.Y.; Cheng, Y. Metabolomic Identification of Serum Exosome-Derived Biomarkers for Bipolar Disorder. Oxid. Med. Cell. Longev. 2022, 2022, 5717445. [Google Scholar] [CrossRef] [PubMed]
  3. Hu, C.; Jiang, W.; Lv, M.; Fan, S.; Lu, Y.; Wu, Q.; Pi, J. Potentiality of Exosomal Proteins as Novel Cancer Biomarkers for Liquid Biopsy. Front. Immunol. 2022, 13, 792046. [Google Scholar] [CrossRef] [PubMed]
  4. Wang, J.; Yue, B.L.; Huang, Y.Z.; Lan, X.Y.; Liu, W.J.; Chen, H. Exosomal RNAs: Novel Potential Biomarkers for Diseases-A Review. Int. J. Mol. Sci. 2022, 23, 2461. [Google Scholar] [CrossRef] [PubMed]
  5. Alazzawi, W.; Shahsavari, Z.; Babaei, H.; Firouzpour, H.; Karimi, A.; Goudarzi, A. The evaluation of serum lipid profile and apolipoprotein C-1 in the Iranian patients of Oral Squamous Cell Carcinoma. Biomedicine 2022, 12, 40–47. [Google Scholar] [CrossRef]
  6. Yanez-Mo, M.; Siljander, P.R.; Andreu, Z.; Zavec, A.B.; Borras, F.E.; Buzas, E.I.; Buzas, K.; Casal, E.; Cappello, F.; Carvalho, J.; et al. Biological properties of extracellular vesicles and their physiological functions. J. Extracell. Vesicles 2015, 4, 27066. [Google Scholar] [CrossRef] [Green Version]
  7. Shin, H.; Jeong, H.; Park, J.; Hong, S.; Choi, Y. Correlation between Cancerous Exosomes and Protein Markers Based on Surface-Enhanced Raman Spectroscopy (SERS) and Principal Component Analysis (PCA). ACS Sens. 2018, 3, 2637–2643. [Google Scholar] [CrossRef]
  8. Wu, Y.; Deng, W.; Klinke, D.J., 2nd. Exosomes: Improved methods to characterize their morphology, RNA content, and surface protein biomarkers. Analyst 2015, 140, 6631–6642. [Google Scholar] [CrossRef] [Green Version]
  9. Van der Pol, E.; Coumans, F.A.; Grootemaat, A.E.; Gardiner, C.; Sargent, I.L.; Harrison, P.; Sturk, A.; van Leeuwen, T.G.; Nieuwland, R. Particle size distribution of exosomes and microvesicles determined by transmission electron microscopy, flow cytometry, nanoparticle tracking analysis, and resistive pulse sensing. J. Thromb. Haemost. 2014, 12, 1182–1192. [Google Scholar] [CrossRef]
  10. Koritzinsky, E.H.; Street, J.M.; Star, R.A.; Yuen, P.S. Quantification of Exosomes. J. Cell. Physiol. 2017, 232, 1587–1590. [Google Scholar] [CrossRef]
  11. Van Niel, G.; Raposo, G.; Candalh, C.; Boussac, M.; Hershberg, R.; Cerf-Bensussan, N.; Heyman, M. Intestinal epithelial cells secrete exosome-like vesicles. Gastroenterology 2001, 121, 337–349. [Google Scholar] [CrossRef] [PubMed]
  12. Parolini, I.; Federici, C.; Raggi, C.; Lugini, L.; Palleschi, S.; De Milito, A.; Coscia, C.; Iessi, E.; Logozzi, M.; Molinari, A.; et al. Microenvironmental pH is a key factor for exosome traffic in tumor cells. J. Biol. Chem. 2009, 284, 34211–34222. [Google Scholar] [CrossRef] [PubMed] [Green Version]
  13. Quail, D.F.; Joyce, J.A. Microenvironmental regulation of tumor progression and metastasis. Nat. Med. 2013, 19, 1423–1437. [Google Scholar] [CrossRef] [PubMed]
  14. Hoshino, A.; Costa-Silva, B.; Shen, T.L.; Rodrigues, G.; Hashimoto, A.; Tesic Mark, M.; Molina, H.; Kohsaka, S.; Di Giannatale, A.; Ceder, S.; et al. Tumour exosome integrins determine organotropic metastasis. Nature 2015, 527, 329–335. [Google Scholar] [CrossRef] [Green Version]
  15. Kosaka, N.; Yoshioka, Y.; Tominaga, N.; Hagiwara, K.; Katsuda, T.; Ochiya, T. Dark side of the exosome: The role of the exosome in cancer metastasis and targeting the exosome as a strategy for cancer therapy. Future Oncol. 2014, 10, 671–681. [Google Scholar] [CrossRef]
  16. Yamamoto, T.; Kosaka, N.; Ochiya, T. Latest advances in extracellular vesicles: From bench to bedside. Sci. Technol. Adv. Mater. 2019, 20, 746–757. [Google Scholar] [CrossRef] [Green Version]
  17. Kim, H.; Kim, E.H.; Kwak, G.; Chi, S.G.; Kim, S.H.; Yang, Y. Exosomes: Cell-Derived Nanoplatforms for the Delivery of Cancer Therapeutics. Int. J. Mol. Sci. 2020, 22, 14. [Google Scholar] [CrossRef]
  18. Zlotogorski-Hurvitz, A.; Dayan, D.; Chaushu, G.; Korvala, J.; Salo, T.; Sormunen, R.; Vered, M. Human saliva-derived exosomes: Comparing methods of isolation. J. Histochem. Cytochem. 2015, 63, 181–189. [Google Scholar] [CrossRef] [Green Version]
  19. Neerukonda, S.N.; Egan, N.A.; Patria, J.; Assakhi, I.; Tavlarides-Hontz, P.; Modla, S.; Munoz, E.R.; Hudson, M.B.; Parcells, M.S. A comparison of exosome purification methods using serum of Marek’s disease virus (MDV)-vaccinated and -tumor-bearing chickens. Heliyon 2020, 6, e05669. [Google Scholar] [CrossRef]
  20. Lv, C.Y.; Ding, W.J.; Wang, Y.L.; Zhao, Z.Y.; Li, J.H.; Chen, Y.; Lv, J. A PEG-based method for the isolation of urinary exosomes and its application in renal fibrosis diagnostics using cargo miR-29c and miR-21 analysis. Int. Urol. Nephrol. 2018, 50, 973–982. [Google Scholar] [CrossRef]
  21. Kalarikkal, S.P.; Prasad, D.; Kasiappan, R.; Chaudhari, S.R.; Sundaram, G.M. A cost-effective polyethylene glycol-based method for the isolation of functional edible nanoparticles from ginger rhizomes. Sci. Rep. 2020, 10, 4456. [Google Scholar] [CrossRef] [PubMed] [Green Version]
  22. Rider, M.A.; Hurwitz, S.N.; Meckes, D.G., Jr. ExtraPEG: A Polyethylene Glycol-Based Method for Enrichment of Extracellular Vesicles. Sci. Rep. 2016, 6, 23978. [Google Scholar] [CrossRef] [PubMed]
  23. Tang, Y.T.; Huang, Y.Y.; Zheng, L.; Qin, S.H.; Xu, X.P.; An, T.X.; Xu, Y.; Wu, Y.S.; Hu, X.M.; Ping, B.H.; et al. Comparison of isolation methods of exosomes and exosomal RNA from cell culture medium and serum. Int. J. Mol. Med. 2017, 40, 834–844. [Google Scholar] [CrossRef] [Green Version]
  24. Munagala, R.; Aqil, F.; Jeyabalan, J.; Kandimalla, R.; Wallen, M.; Tyagi, N.; Wilcher, S.; Yan, J.; Schultz, D.J.; Spencer, W.; et al. Exosome-mediated delivery of RNA and DNA for gene therapy. Cancer Lett. 2021, 505, 58–72. [Google Scholar] [CrossRef] [PubMed]
  25. Da Costa, V.R.; Araldi, R.P.; Vigerelli, H.; D’Amelio, F.; Mendes, T.B.; Gonzaga, V.; Policiquio, B.; Colozza-Gama, G.A.; Valverde, C.W.; Kerkis, I. Exosomes in the Tumor Microenvironment: From Biology to Clinical Applications. Cells 2021, 10, 2617. [Google Scholar] [CrossRef]
  26. Huda, M.N.; Nafiujjaman, M.; Deaguero, I.G.; Okonkwo, J.; Hill, M.L.; Kim, T.; Nurunnabi, M. Potential Use of Exosomes as Diagnostic Biomarkers and in Targeted Drug Delivery: Progress in Clinical and Preclinical Applications. ACS Biomater. Sci. Eng. 2021, 7, 2106–2149. [Google Scholar] [CrossRef] [PubMed]
  27. Lasser, C.; Eldh, M.; Lotvall, J. Isolation and characterization of RNA-containing exosomes. J. Vis. Exp. 2012, 59, e3037. [Google Scholar] [CrossRef] [PubMed]
  28. Soni, C.; Reizis, B. DNA as a self-antigen: Nature and regulation. Curr. Opin. Immunol. 2018, 55, 31–37. [Google Scholar] [CrossRef]
  29. Nagata, S. DNA degradation in development and programmed cell death. Annu. Rev. Immunol. 2005, 23, 853–875. [Google Scholar] [CrossRef]
  30. Bronkhorst, A.J.; Wentzel, J.F.; Aucamp, J.; van Dyk, E.; du Plessis, L.; Pretorius, P.J. Characterization of the cell-free DNA released by cultured cancer cells. Biochim. Biophys. Acta 2016, 1863, 157–165. [Google Scholar] [CrossRef]
  31. Holdenrieder, S.; Stieber, P. Apoptotic markers in cancer. Clin. Biochem. 2004, 37, 605–617. [Google Scholar] [CrossRef]
  32. Jahr, S.; Hentze, H.; Englisch, S.; Hardt, D.; Fackelmayer, F.O.; Hesch, R.D.; Knippers, R. DNA fragments in the blood plasma of cancer patients: Quantitations and evidence for their origin from apoptotic and necrotic cells. Cancer Res. 2001, 61, 1659–1665. [Google Scholar]
  33. Jiang, P.; Chan, C.W.; Chan, K.C.; Cheng, S.H.; Wong, J.; Wong, V.W.; Wong, G.L.; Chan, S.L.; Mok, T.S.; Chan, H.L.; et al. Lengthening and shortening of plasma DNA in hepatocellular carcinoma patients. Proc. Natl. Acad. Sci. USA 2015, 112, E1317–E1325. [Google Scholar] [CrossRef] [Green Version]
  34. Yu, W.; Hurley, J.; Roberts, D.; Chakrabortty, S.K.; Enderle, D.; Noerholm, M.; Breakefield, X.O.; Skog, J.K. Exosome-based liquid biopsies in cancer: Opportunities and challenges. Ann. Oncol. 2021, 32, 466–477. [Google Scholar] [CrossRef]
  35. Narang, P.; Shah, M.; Beljanski, V. Exosomal RNAs in diagnosis and therapies. Noncoding RNA Res. 2022, 7, 7–15. [Google Scholar] [CrossRef]
  36. Cavallo, F.; De Giovanni, C.; Nanni, P.; Forni, G.; Lollini, P.L. 2011: The immune hallmarks of cancer. Cancer Immunol. Immunother. 2011, 60, 319–326. [Google Scholar] [CrossRef] [Green Version]
  37. Peinado, H.; Zhang, H.; Matei, I.R.; Costa-Silva, B.; Hoshino, A.; Rodrigues, G.; Psaila, B.; Kaplan, R.N.; Bromberg, J.F.; Kang, Y.; et al. Pre-metastatic niches: Organ-specific homes for metastases. Nat. Rev. Cancer 2017, 17, 302–317. [Google Scholar] [CrossRef]
  38. Blanchard, N.; Lankar, D.; Faure, F.; Regnault, A.; Dumont, C.; Raposo, G.; Hivroz, C. TCR activation of human T cells induces the production of exosomes bearing the TCR/CD3/zeta complex. J. Immunol. 2002, 168, 3235–3241. [Google Scholar] [CrossRef] [Green Version]
  39. Masani, M.Y.; Noll, G.A.; Parveez, G.K.; Sambanthamurthi, R.; Prufer, D. Efficient transformation of oil palm protoplasts by PEG-mediated transfection and DNA microinjection. PLoS ONE 2014, 9, e96831. [Google Scholar] [CrossRef] [Green Version]
  40. Wu, S.; Zhu, H.; Liu, J.; Yang, Q.; Shao, X.; Bi, F.; Hu, C.; Huo, H.; Chen, K.; Yi, G. Establishment of a PEG-mediated protoplast transformation system based on DNA and CRISPR/Cas9 ribonucleoprotein complexes for banana. BMC Plant Biol. 2020, 20, 425. [Google Scholar] [CrossRef]
Figure 1. Flowchart of exosome collection.
Separations 09 00435 g001
Figure 2. Protein concentrations of different timepoints at 4 °C, and the outward of the PEG-exosome pellet. (A) Total protein concentration at different time points at 4 °C (n = 3). (B) Pellets of the PEG-exosome at different PEG percentages. PEG, poly(ethylene glycol).
Separations 09 00435 g002
Figure 3. Physical properties of exosomes extracted using different PEG percentages. (A) Nanoparticle tracking analysis of exosomes extracted using different PEG percentages (n = 3). UC, ultracentrifuge. (B) Scanning electron microscopy images of SAS-derived exosomes extracted using different PEG percentages. (C) Exosome particle number of different percentages of PEG and the ultracentrifugation method (n = 3).
Separations 09 00435 g003
Figure 4. Detection of exosomal surface markers. (A) OECM-1, (B) HSC3, and (C) SAS. UC: ultracentrifuge.
Separations 09 00435 g004
Figure 5. DNA and RNA extraction from exosomes of the 8% PEG group. (A) Gel electrophoresis of SAS-derived exosomal RNA and DNA. (B) RNA concentration, OD260/280, and the cell number while the exosome was harvested. (C) qPCR results of exosomal RNA (target gene: U6) (n = 3). qPCR, quantitative polymerase chain reaction.
Separations 09 00435 g005
Figure 6. DNA extracted from exosomes of the 8% PEG group and qPCR of GAPDH gene. (A) Gel electrophoresis of the final qPCR products, NC: negative control, (n = 3). (B) DNA concentration, OD260/280, and cell number while the exosome was harvested. (C) Ct value and melting curve of the qPCR.
Separations 09 00435 g006
Figure 7. Confocal microscopy images of SAS-derived exosomes cocultured with MG-63 cells. The fluorescence capture intensity of the photo was identical in each group.
Separations 09 00435 g007
Publisher’s Note: MDPI stays neutral with regard to jurisdictional claims in published maps and institutional affiliations.

