Article

Utility of Atmospheric-Pressure Chemical Ionization and Photoionization Mass Spectrometry in Bottom-Up Proteomics

by
Simona Sedláčková
1,2,
Martin Hubálek
1,
Vladimír Vrkoslav
1,
Miroslava Blechová
1 and
Josef Cvačka
1,2,*
1
Institute of Organic Chemistry and Biochemistry of the Czech Academy of Sciences, Flemingovo náměstí 542/2, 166 00 Prague, Czech Republic
2
Department of Analytical Chemistry, Faculty of Science, Charles University, Hlavova 2030/8, 128 43 Prague, Czech Republic
*
Author to whom correspondence should be addressed.
Separations 2022, 9(2), 42; https://doi.org/10.3390/separations9020042
Submission received: 30 December 2021 / Revised: 19 January 2022 / Accepted: 20 January 2022 / Published: 2 February 2022
(This article belongs to the Section Bioanalysis/Clinical Analysis)

Abstract

:
In a typical bottom-up proteomics workflow, proteins are enzymatically cleaved, and the resulting peptides are analyzed by HPLC with electrospray ionization (ESI) tandem mass spectrometry. This approach is practical and widely applied. It has, however, limitations mostly related to less efficient or even inefficient ionization of some peptides in ESI sources. Gas-phase ionization methods like atmospheric-pressure chemical ionization (APCI) or atmospheric-pressure photoionization (APPI) offer alternative ways of detecting various analytes. This work is a systematic study of the ionization efficiencies of peptides in ESI, APCI, and APPI and the applicability of the mentioned ionizations in proteomics. A set of peptide standards and bovine serum albumin digests were examined using a high-resolution mass spectrometer coupled to an ultra HPLC system. Since the ionization efficiency in APCI and APPI depends strongly on experimental conditions, the ion source settings and mobile phase compositions were optimized for each ionization technique. As expected, tryptic peptides were best detected using ESI. The numbers of chymotrypsin peptides successfully detected by ESI, APPI, and APCI were comparable. In the case of Glu-C digest, APPI detected the highest number of peptides. The results suggest that gas-phase ionization techniques, particularly APPI, are an interesting alternative for detecting peptides and delivering complementary data in proteomics.

Graphical Abstract

1. Introduction

The first peptide sequence analysis utilizing mass spectrometry (MS) was accomplished in 1959 by Klaus Biemann [1], who described an innovative method based on the reduction of small peptides to polyamino alcohols with characteristic electron ionization (EI) spectra. This approach, however, presented several drawbacks for peptide detection. One of them was extensive fragmentation in EI, which made molecular ions detection difficult [2]. Later “soft” ionization techniques such as chemical ionization or field desorption were discovered and applied for peptides [3,4]. The introduction of fast atom bombardment (FAB) in 1981 represented a significant advancement in the mass spectrometry of peptides [2]. FAB allowed ionization of peptides up to 2 kDa without the need for their derivatization. Tandem MS and offline coupling to HPLC [5] permitted peptide sequence analysis and characterization of chemically or post-translationally modified amino acid residues [6]. However, FAB was less efficient in detecting hydrophilic peptides in mixtures because hydrophobic proteins tended to saturate the matrix surface, thus suppressing the ionization of polar species. HPLC fractionation of peptide mixtures or conversion of carboxyl groups to more hydrophobic esters helped, but hydrophobic peptides’ sensitivity remained relatively low [7]. Thermospray ionization (TSI) was designed for coupling MS to HPLC. It produced mass spectra with abundant protonated molecules and molecular adducts without significant fragmentation. Ionization efficiency was good for larger (0.8–30 kDa) or cyclic peptides [8]; shorter peptides were more efficiently detected after a derivatization step [9,10]. TSI was soon surpassed by electrospray ionization (ESI), offering superior performance [11]. Besides ESI, MALDI [12] has gradually become indispensable for characterizing peptides and proteins. It offers an efficient way of peptides ionization and provides proteomics data complementary to ESI [13]. Surface-assisted laser desorption/ionization (SALDI) was introduced as a method for protein detection in the late 1980s [14]. SALDI is carried out on various surfaces, including porous silicon [15] or inorganic nanomaterials [16].
In ESI, multiply charged peptide ions are formed, which allows the detection of peptides and proteins in a relatively low mass range of the analyzer. Although ESI achieves an extensive application in proteomics [17], several limitations exist. Analysis of hydrophobic, for instance, membrane proteins, is complicated by detergents and salts, which are used for their extraction and solubilization [18]. The analyte response in ESI is heavily affected by the matrix and other peptides [19]. In addition to ionization issues, highly hydrophilic peptides are not retained on reversed-phase columns and might be lost in void volume; conversely, hydrophobic peptides tend to retain in the stationary phase. Separation might be less efficient for peptides containing multiple basic residues [20]. Consequently, some peptides in protein digest remain undetected in HPLC/ESI–MS2. Peptides derivatization has been introduced to overcome these limitations. Many of the derivatization reagents carry a permanent charge for efficient ionization in ESI [21,22,23].
Other ionizations developed for HPLC, atmospheric-pressure chemical ionization (APCI), and photoionization (APPI) are usually not considered for peptide analysis. Both techniques, however, have been shown to ionize various peptides [18,24,25,26,27,28,29,30,31,32,33,34,35,36,37,38,39,40,41,42,43]. APCI [44] and APPI [45] are gas-phase ionization techniques less affected by matrix [46]. Both ionizations utilize a heated pneumatic sprayer that generates a stream of fine, quickly evaporating droplets from the liquid phase. While corona discharge serves as a source of electrons in APCI, a vacuum ultraviolet (VUV) lamp is used in APPI to produce energetic photons. Singly charged ions, which often partly fragment, are usually generated.
The APCI technique was shown to work for short peptides <600 Da [27]. Although well suited for non-polar analytes, APCI turned out inappropriate for highly hydrophobic large peptides [35]. APCI source without corona discharge was successfully applied to larger peptides [27]. The ion source performance was comparable to ESI, likely due to thermospray ionization. APCI was also utilized for cyclic peptides [29,33] or iminodipeptides [26]. Corona discharge in a dual APCI/nanoESI source [33,39] was used to generate reactive ions for ion/ion reactions with multiply charged peptides produced by nanoESI. Proton transfer and electron transfer reactions carried out in a modified ion trap instrument were used to manipulate the charge state of peptide ions and perform electron-transfer dissociation [47]. In addition to continuous ion sources, a pulsed APCI interface was tested for peptides to increase detection sensitivity [32].
In APPI, not only singly charged molecules but also multiply protonated molecules can be observed, especially in the presence of a dopant. The probability of the formation of multiply charged peptide ions depends on the nature of the dopant [36]. Electron transfer to multiply charged proton molecules induces N-Cα cleavage in the peptide backbone by electron capture dissociation (ECD)/electron transfer dissociation (ETD) mechanism [48,49,50]. The ECD/ETD methods have an excellent value for top-down sequencing [34]. In APPI, and to a less extent also in APCI, molecular adducts [M + K]+, [M + Na]+, and [M + NH4]+ can be formed, likely due to the thermospray ionization mechanism [27]. APPI finds its use for hydrophobic peptides or membrane proteins which are difficult to ionize by ESI or MALDI [18,34]. APPI proves to help reveal post-translational modifications (PTM) of membrane proteins, namely palmitoylation [24]. In addition to ion sources with commercial UV lamps, synchrotron radiation (SR) was implemented for APPI. SR is a powerful UV light source tunable within a wide range of photon energies [40]. When used for APPI, it offers high spectral purity and the detection of PTMs [51]. In addition, an electropneumatic-heated nebulizer enhances the yield of sprayed ions from PhotoSpray [42].
In bottom-up proteomics, sample digestion is an important step. Trypsin is the most preferred protease due to its specificity and high efficiency. However, recent reports show that its exclusive use has limitations. It has been demonstrated that previously neglected proteases like chymotrypsin, Lys-C, Lys-N, Asp-N, Glu-C, or Arg-C can be helpful [52]. Some protein segments or subsets of proteins remain undetected using a single protease, typically trypsin. Since the alternative proteases cleave at other sites, they cover different parts of the proteome. For instance, chymotrypsin is effective toward hydrophobic amino acids and is therefore helpful in detecting membrane proteins. When mapping PTMs, Arg-C and Glu-C are often involved. Peptides from Arg-C digest generally have longer sequences with the R-termini; K-termini may also occur. Glu-C preferentially cleaves peptide bonds C-terminal to glutamic acid residues [53]. Therefore, the use of several proteases helps to maximize information on proteins in samples.
In this work, a systematic approach is used to evaluate the applicability of APCI and APPI in peptide analysis and proteomics. A series of synthetic peptides and bovine serum albumin (BSA) digests were used to optimize the experimental conditions for ESI, APCI, and APPI. The C-terminal amino acids in the investigated peptides were those typically achieved by protein cleavages by trypsin, chymotrypsin, and Glu-C. Analytical figures of merit and sequence coverage values were compared.

2. Materials and Methods

2.1. Chemicals and Reagent

Ammonium formate (97%), ammonium bicarbonate (ABC; reagent grade), and bovine serum albumin (BSA; <98%) were purchased from Fluka Biochemica (Buchs, Switzerland). Trifluoroacetic acid (TFA) for HPLC (>99.9%), acetone for HPLC (>99.8%), ammonia solution (25%) for LC-MS, iodoacetamide (IAA; reagent grade), and dithiothreitol (DTT; reagent grade) were obtained from Sigma-Aldrich (St. Louise, WA, USA). Formic acid (FA; 98%) and acetic acid (99%) were purchased from Lach-Ner (Neratovice, Czech Republic). Methanol and acetonitrile (both OPTIMA LC/MS) were obtained from Fisher Chemical (Waltham, MA, USA). Sequencing grade trypsin, chymotrypsin, and Glu-C were purchased from Roche Diagnostics (Mannheim, Germany). Fmoc-Arg(Pbf)-WANG resin, Fmoc-Lys(Boc)-WANG resin, Fmoc-Phe-WANG, and Fmoc-Glu(OtBu)-WANG for peptide standards synthesis were purchased from Iris Biotech (Marktredwitz, Germany).

2.2. BSA Digest

BSA was digested according to the enhanced filter-aided sample preparation (eFASP) method [54]. BSA in water (125 μL; 1 mg·mL−1) was diluted with ABC (50 mmol·L−1) to a volume of 200 μL. The reduction was initiated by adding 10 μL of DTT (100 mmol·L−1 in water), and the sample was incubated at 65 °C for 30 min. Free thiol groups were alkylated with 30 μL of IAA (100 mmol·L−1 in water), and the sample was incubated in the dark at 20 °C for 30 min. The alkylation was terminated by adding 20 μL of DTT (100 mmol·L−1 in water). The sample was washed three times with 100 μL of 50 mmol·L−1 ABC on Microcon centrifugal filters (Ultracel PL 10, Merck, Ireland) using Eppendorf Centrifuge 5417 Refrigerator (Boston, MA, USA). The digestion was performed on the same filter in 100 μL of 50 mmol·L−1 ABC in the presence of protease (0.1 mg·mL−1) in protease:protein weight ratio of 1:100 at 37 °C for 16 h. BSA digest was washed twice with 50 μL of 50 mmol·L−1 ABC by centrifugation, and the filtrate was evaporated to dryness on a refrigerated centrifugal vacuum concentrator Labconco (Kansas City, MI, USA).

2.3. Peptide Standards

Peptide standards SLGK, VASLR, AWSVAR, VLASSAR, AEFVEVTK, QTALVELLK, LAE, SLGE, VASLE, AWSVAE, VLASSAE, AEFVEVTE, QTALVELLE, LAF, SLGF, VASLF, AWSVAF, VLASSAF, AEFVEVTF, and QTALVELLF (all with free carboxyl on C-terminus) were synthetized in house. Peptide sequences were assembled on a Liberty Blue solid-phase synthesizer from CEM (Charlotte, NC, USA) by stepwise coupling of the corresponding Fmoc-amino acids to the growing chain on a Fmoc-Arg(Pbf)-WANG resin (100–200 mesh, 0.64 mmol·g−1); Fmoc-Lys (Boc)-WANG resin (100–200 mesh, 0.65 mmol·g−1); Fmoc-Glu(OtBu)-WANG resin (200–400 mesh, 0.62 mmol·g−1), and Fmoc-Phe-WANG resin (200–400 mesh, 0.67 mmol·g−1). Fully protected peptides were synthesized according to a standard procedure involving cleavage of the Nα-Fmoc protecting group with 20% piperidine in dimethylformamide (DMF) (HPLC grade) and coupling, mediated by mixtures of coupling reagents (diisopropylcarbodiimide) DIC/(oxyma-ethylcyanohydroxyiminoacetate) Oxyma in DMF. On completion of synthesis, the deprotection and detachment of the linear peptides from the resins were carried out simultaneously, using a TFA/H2O/triisopropylsilane (TIS) (98%) (95:2.5:2.5) cleavage mixture. Each resin was washed with dichloromethane (DCM), and the combined TFA filtrates were evaporated at room temperature. The precipitated residues were triturated with tert-butyl methyl ether, collected by suction, and dried by lyophilization. The linear peptides were purified by HPLC using a Waters instrument with Delta 600 pump and a 2489 UV/VIS detector. Peptide standard solutions (1 mg·mL−1) were prepared in methanol/water (1:1 v/v) with 0.1% TFA and stored at −18 °C. Working solutions (0.1 mg·mL−1) were prepared by diluting the standard solutions with water.

2.4. Mass Spectrometry

The experiments were performed on an LTQ Orbitrap XL (Thermo Scientific, Waltham, MA, USA) that combines a linear ion trap MS and an Orbitrap mass analyzer. The mass spectrometer was equipped with an IonMax source operating in ESI, APCI, or APPI mode. Full scan mass spectra were collected using the Orbitrap operated at a resolution of 30,000. Collision-induced dissociation (CID) and the fragments detection were performed in the ion trap. The mass spectrometer was operated in the positive ion mode. In ESI, the ion source parameters were as follows: sheath and auxiliary gases at 35 and 5 arbitrary units, respectively, the source voltage of 4.80 kV, the capillary voltage of 7.0 V, tube lens offset of 100.0 V, and the capillary temperature 275 °C. In APCI, sheath and auxiliary gases were at 50 and 10 arbitrary units, respectively; the probe temperature was 470 °C, corona discharge current was 5.00 μA, tube lens offset was 110.0 V, and the capillary temperature was 270 °C. In APPI, a krypton lamp from Syagen Technology, Inc. (Tustin, CA, USA) that emits photons at 10.0 eV and 10.6 eV (123.6 nm and 118.0 nm) was used. The sheath and auxiliary gases were at 90 and 10 arbitrary units, respectively; the probe temperature was 450 °C, tube lens offset was 160 V, and the capillary temperature was 270 °C.

2.5. Infusion Experiments and Flow Injection Analysis

The peptide solutions were directly infused into the mass spectrometer equipped with ESI, APCI, or APPI sources to optimize experimental conditions and record mass spectra. Peptide standard solutions diluted in water and delivered from a syringe (5–10 μL·min−1) were mixed with a mobile phase (300–500 μL·min−1) in a low dead volume mixing Tee. The mobile phase was either methanol/water 80:20 v/v (optimization of probe temperature in APCI and APPI; recording fragmentation spectra of peptides), or 35 μmol·L−1 acetic acid (pH 3.5), water, or 35 μmol·L−1 ammonia (pH = 10.8) (optimization of mobile phase pH). For the mobile phase pH optimization experiments in APCI and APPI, the probe temperatures were 475 °C and 450 °C, respectively. Limits of detection (LOD) and sensitivities were determined by flow injection analysis (FIA). Solutions of peptide standards (2.5 μL) were loop injected into the methanol mobile phase (400 μL·min−1). Peak height and noise values were obtained from chromatograms reconstructed for [M + H]+ with a 1 Da extraction window. Sensitivity values were determined as the slope of the calibration curve. LOD values were calculated as a triple value of the background noise divided by the slope of the calibration curve. The calibration curve coefficients of determination (R2) varied between 0.96–1.00.

2.6. Liquid Chromatography-Tandem Mass Spectrometry

The mass spectrometer was coupled to a liquid chromatograph consisting of the Rheos 2200 LCMS Pump (Thermo Scientific/Flux Instruments), HTS PAL Autosampler (CTC Analytics, Zwingen, Switzerland), and DeltaChrom CTC 100 column thermostat (Watrex, Prague, Czech Republic). The analyses of BSA digest (650 μmol·L−1, 10 μL injected) were carried out on an Acquity UPLC BEH C18 reversed-phase column (1.7 μm; 2.1 × 5.0 mm, Waters) kept at 40–60 °C. The mobile phases were prepared from the solvent A (0.1% formic acid in water, water adjusted to pH 9 with ammonia, or 10 mmol·L−1 ammonium acetate in water) and solvent B (methanol or acetonitrile) as follows: Sample loading 0–1.0 min (5% of B), continued by linear gradients: 1.0–3.0 min 5.0–12.0% of B, 3.0–15.0 min 12.0–35.0% of B, 15.0–17.0 min 35.0–95.0% of B, 17.0–19.5 min 95.0% of B, 19.5–20.0 min 95.0–5.0% of B, and 20.0–25.0 min 5.0% of B. The mobile phase flow rate was 250 μL·min−1. In APPI, acetone delivered from Rheos 2200 LC-MS Pump (Thermo Scientific/Flux Instruments) served as dopant and accounted for 7% of the mobile phase.
The optimum values of normalized collision energy (NCE) for peptide standards were 17–30%. For data-dependent fragmentation of peptides in the digests, NCE of 40% was used to induce complete fragmentation of all peptides. The data-dependent scanning with six scan events was used. Dynamic exclusion of 60 s was employed to minimize repeated sequencing of peptides. The exclusion list size was limited to 500 precursor ions. The minimum signal threshold was set to 100 counts. Protein sequence coverage values were gained using Amanda and Sequest engines; the parameters were set as follows: MS1 mass tolerance 5 ppm; the mass tolerance of MS2 0.3 Da.

3. Results and Discussion

The standards used in this work were BSA tryptic peptides and their analogs having C-terminal amino acid substituted by phenylalanine or glutamic acid. They represented peptides resulting from trypsin, chymotrypsin, or Glu-C digestion. Their signals in APCI and APPI were maximized by optimizing the ion source parameters and mobile phase composition. The applicability of APPI and APCI in MS-based proteomics was evaluated using protein digest samples and comparing the results with those obtained by ESI.

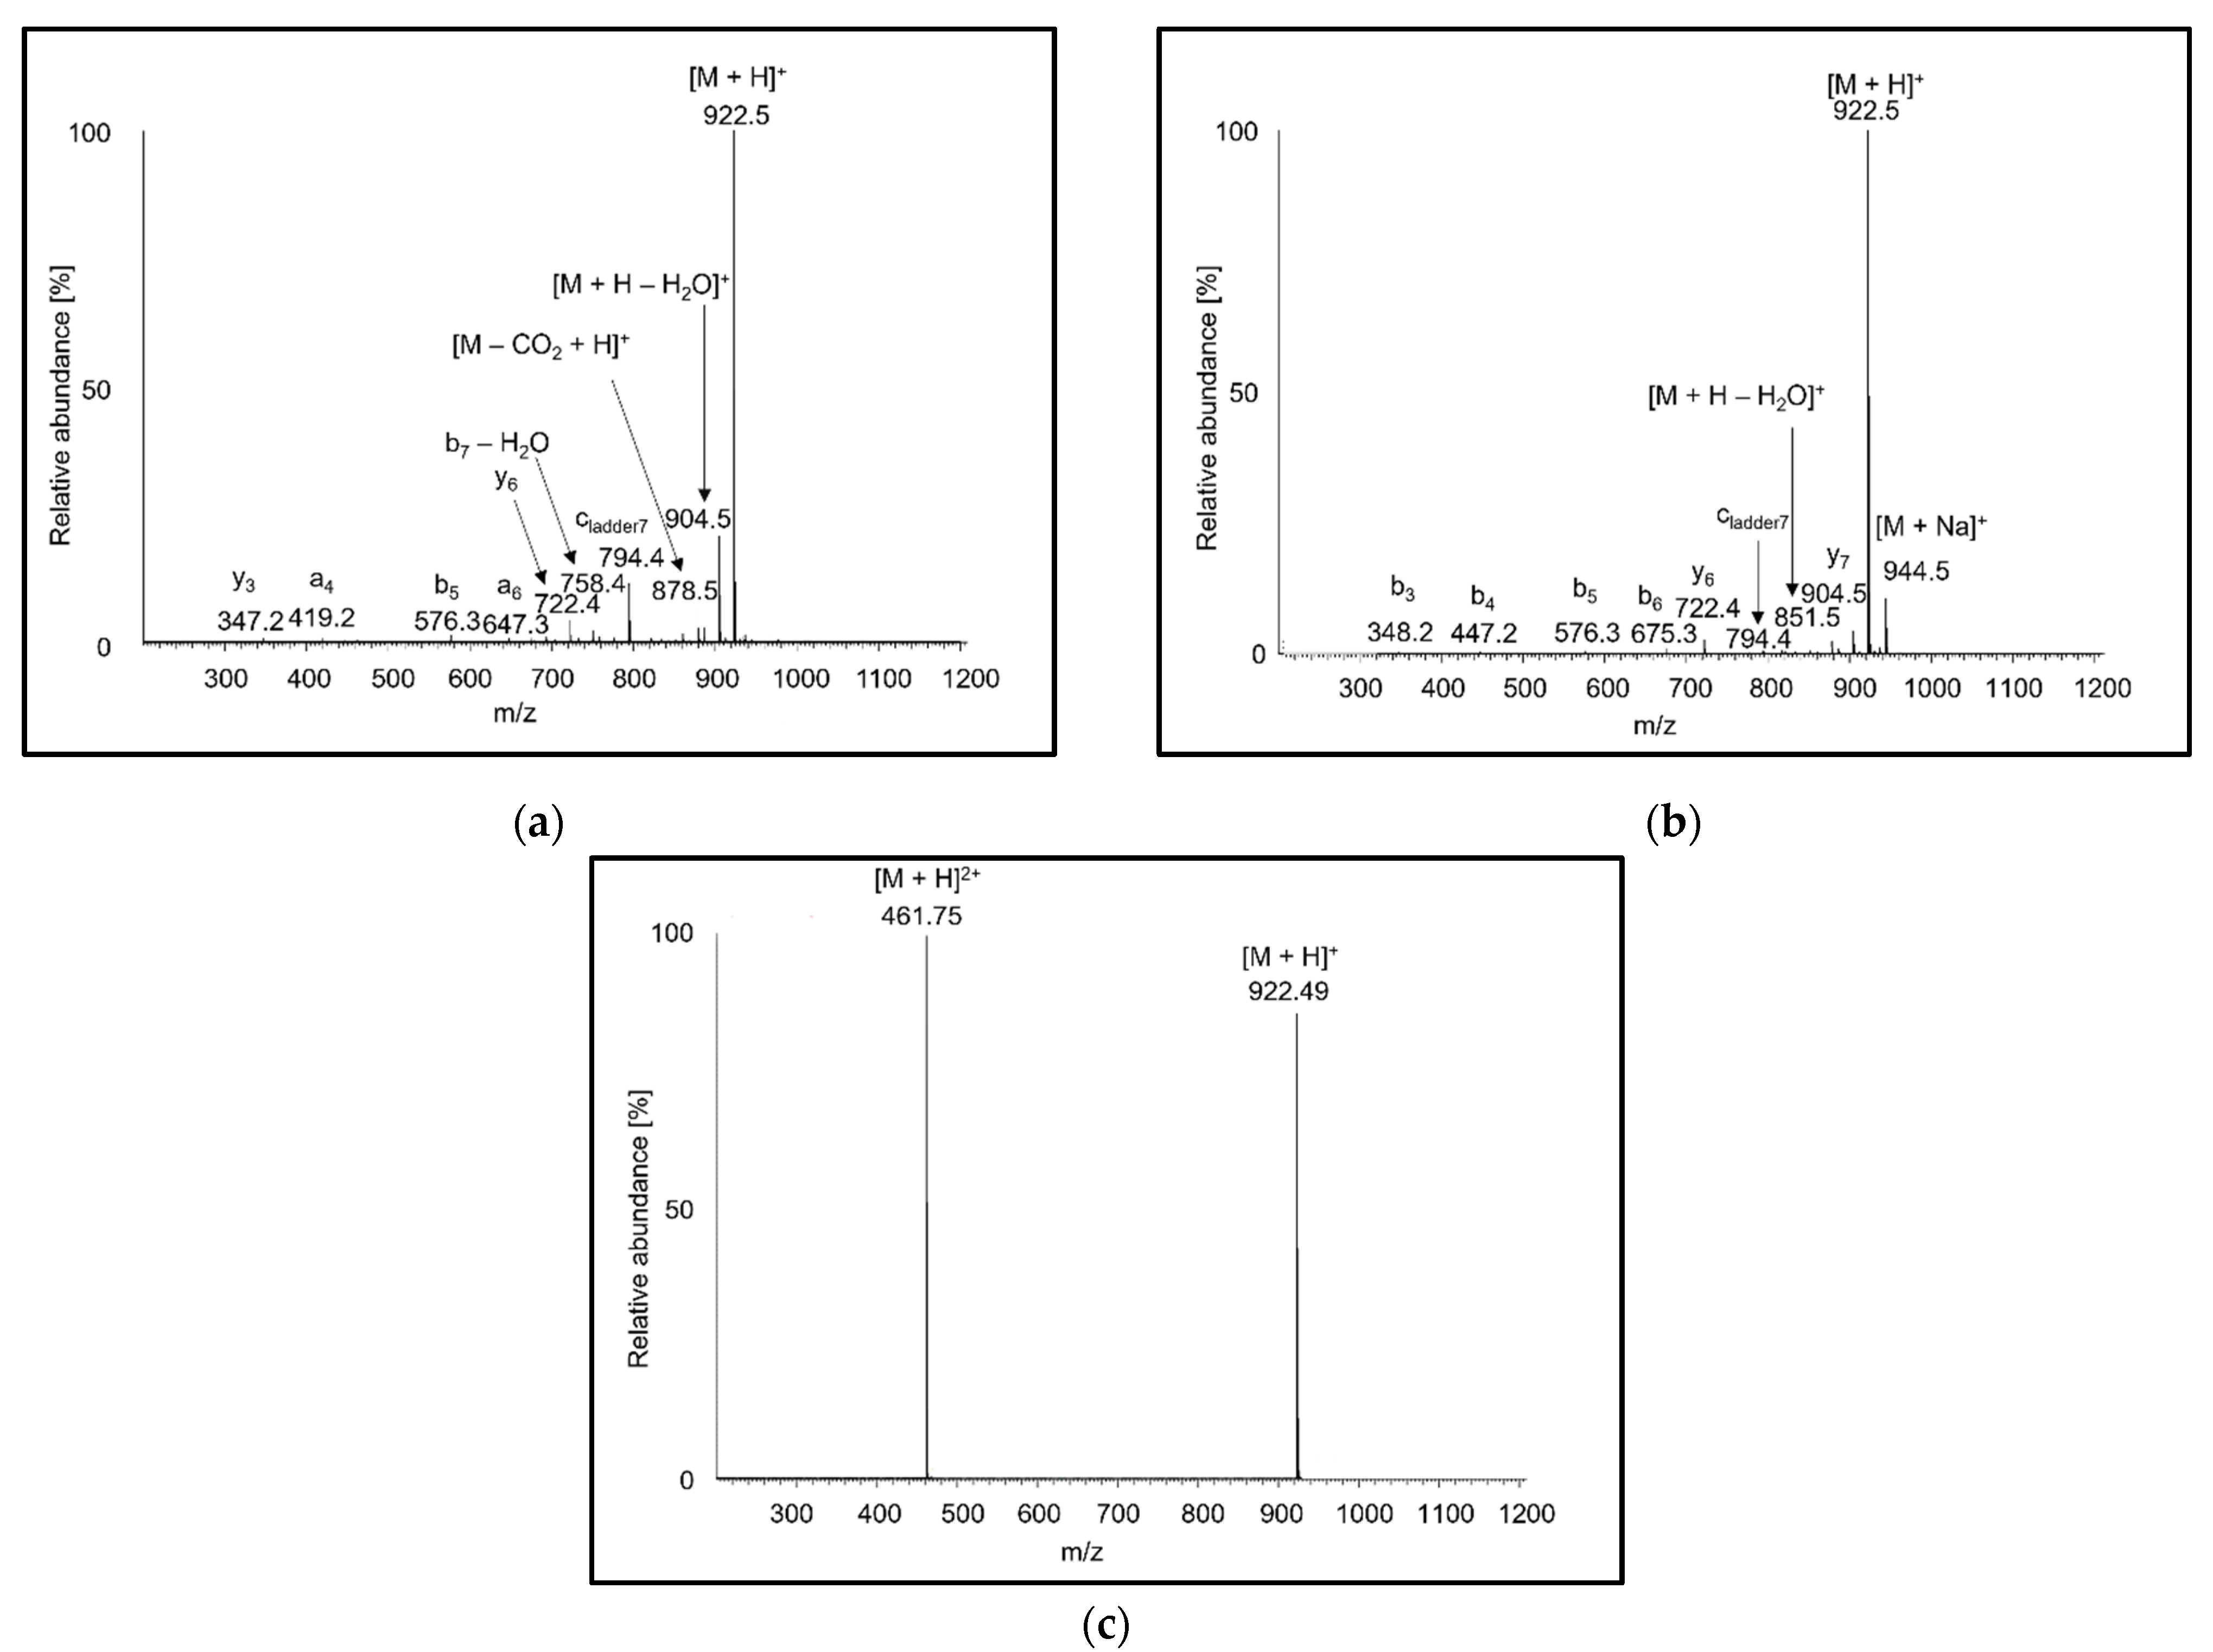
3.1. Mass Spectra of Peptide Standards

Full scan APCI and APPI mass spectra of peptides showed singly charged protonated molecules and fragments (Figure 1a,b). The intensities of fragments tended to increase with the peptide length, and the most abundant fragments usually corresponded to neutral loss of water. In agreement with the literature [55,56], the MS2 spectra of [M + H]+ precursor ions showed b, y fragments, and less abundant a fragments. No radical ions were formed for any of the peptides tested. In the presence of acetone dopant in APPI, doubly charged ions were detected at noise level. In contrast to previous observations reporting protonated molecules [36], the ions were sodium adducts. The origin of doubly charged sodium adducts can be attributed to a thermospray-like ionization mechanism. In ESI full scan spectra, peptides with more than five amino acids yielded doubly charged ions (Figure 1c), while shorter peptide ions were mostly singly charged. A higher charge state is associated with more ionizable groups in longer peptides. Doubly charged shorter peptides were more readily formed at lower peptide concentrations. It is known that increasing concentration leads to a reduction in charge-state for small analyte molecules [57]. In Fenn’s model, at a higher concentration of analyte molecules, the droplets undergo ionic evaporation of low-charged ions at an earlier point in the droplet lifetime [58].

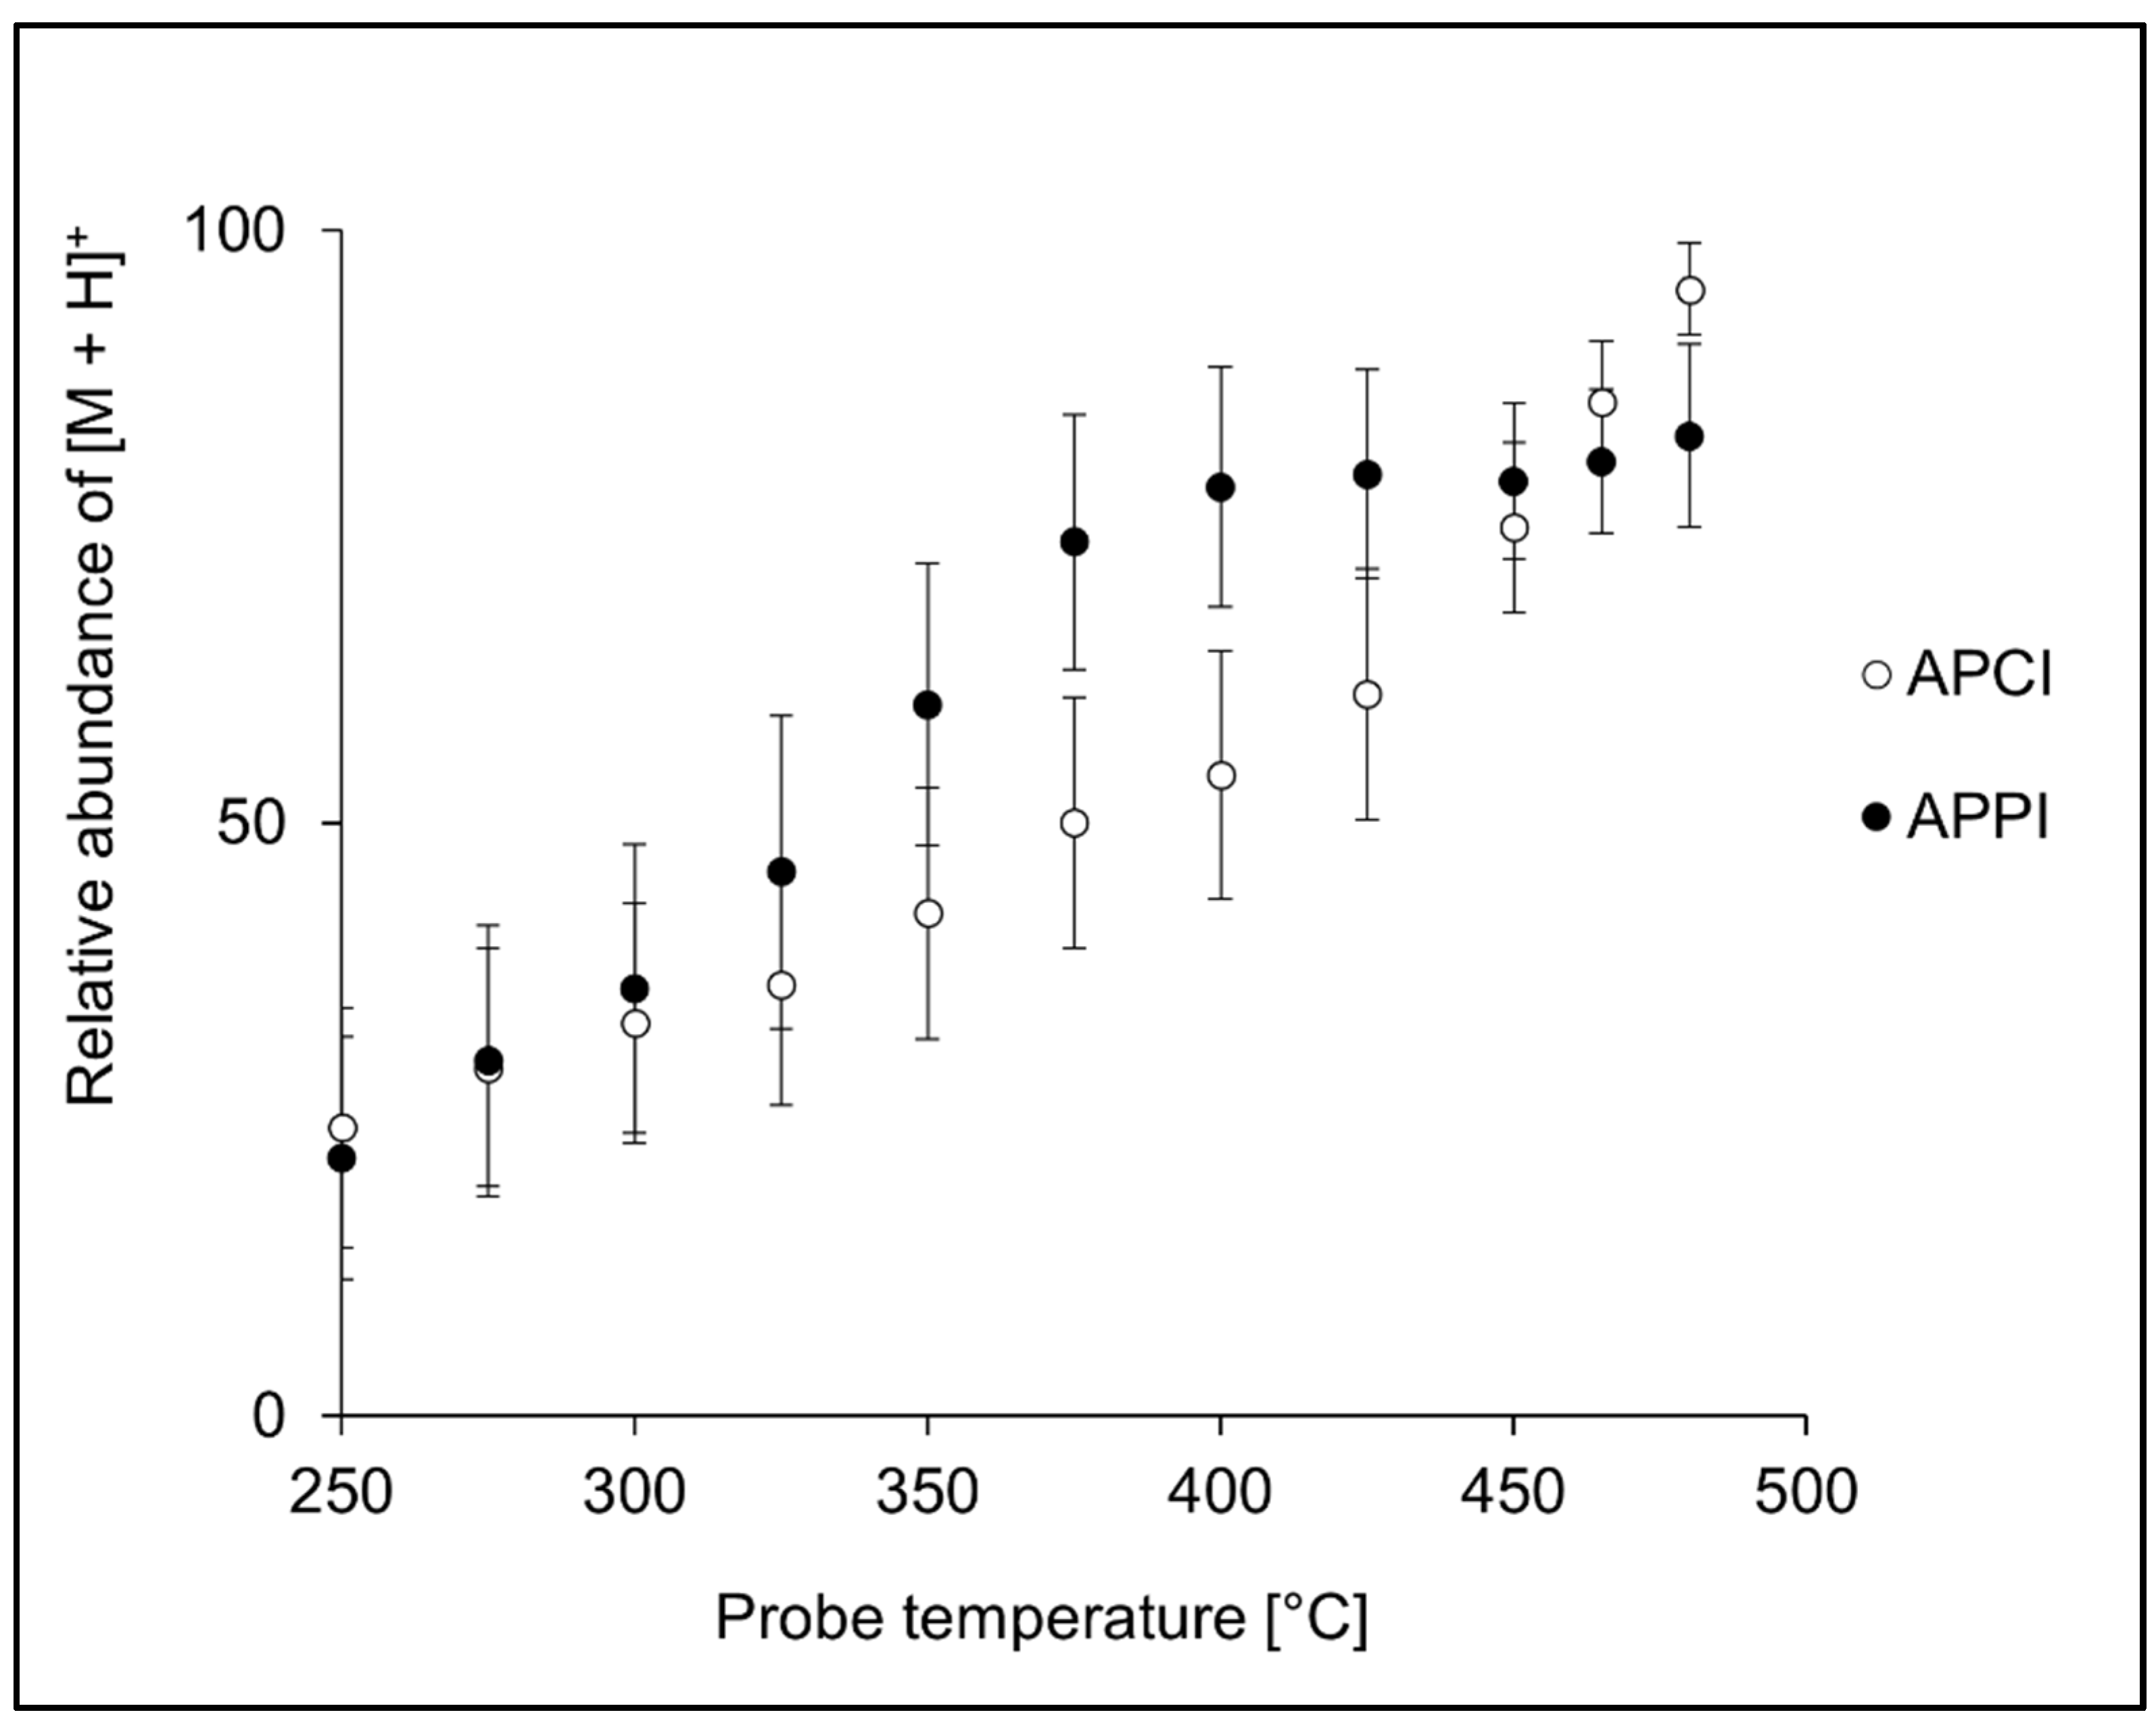
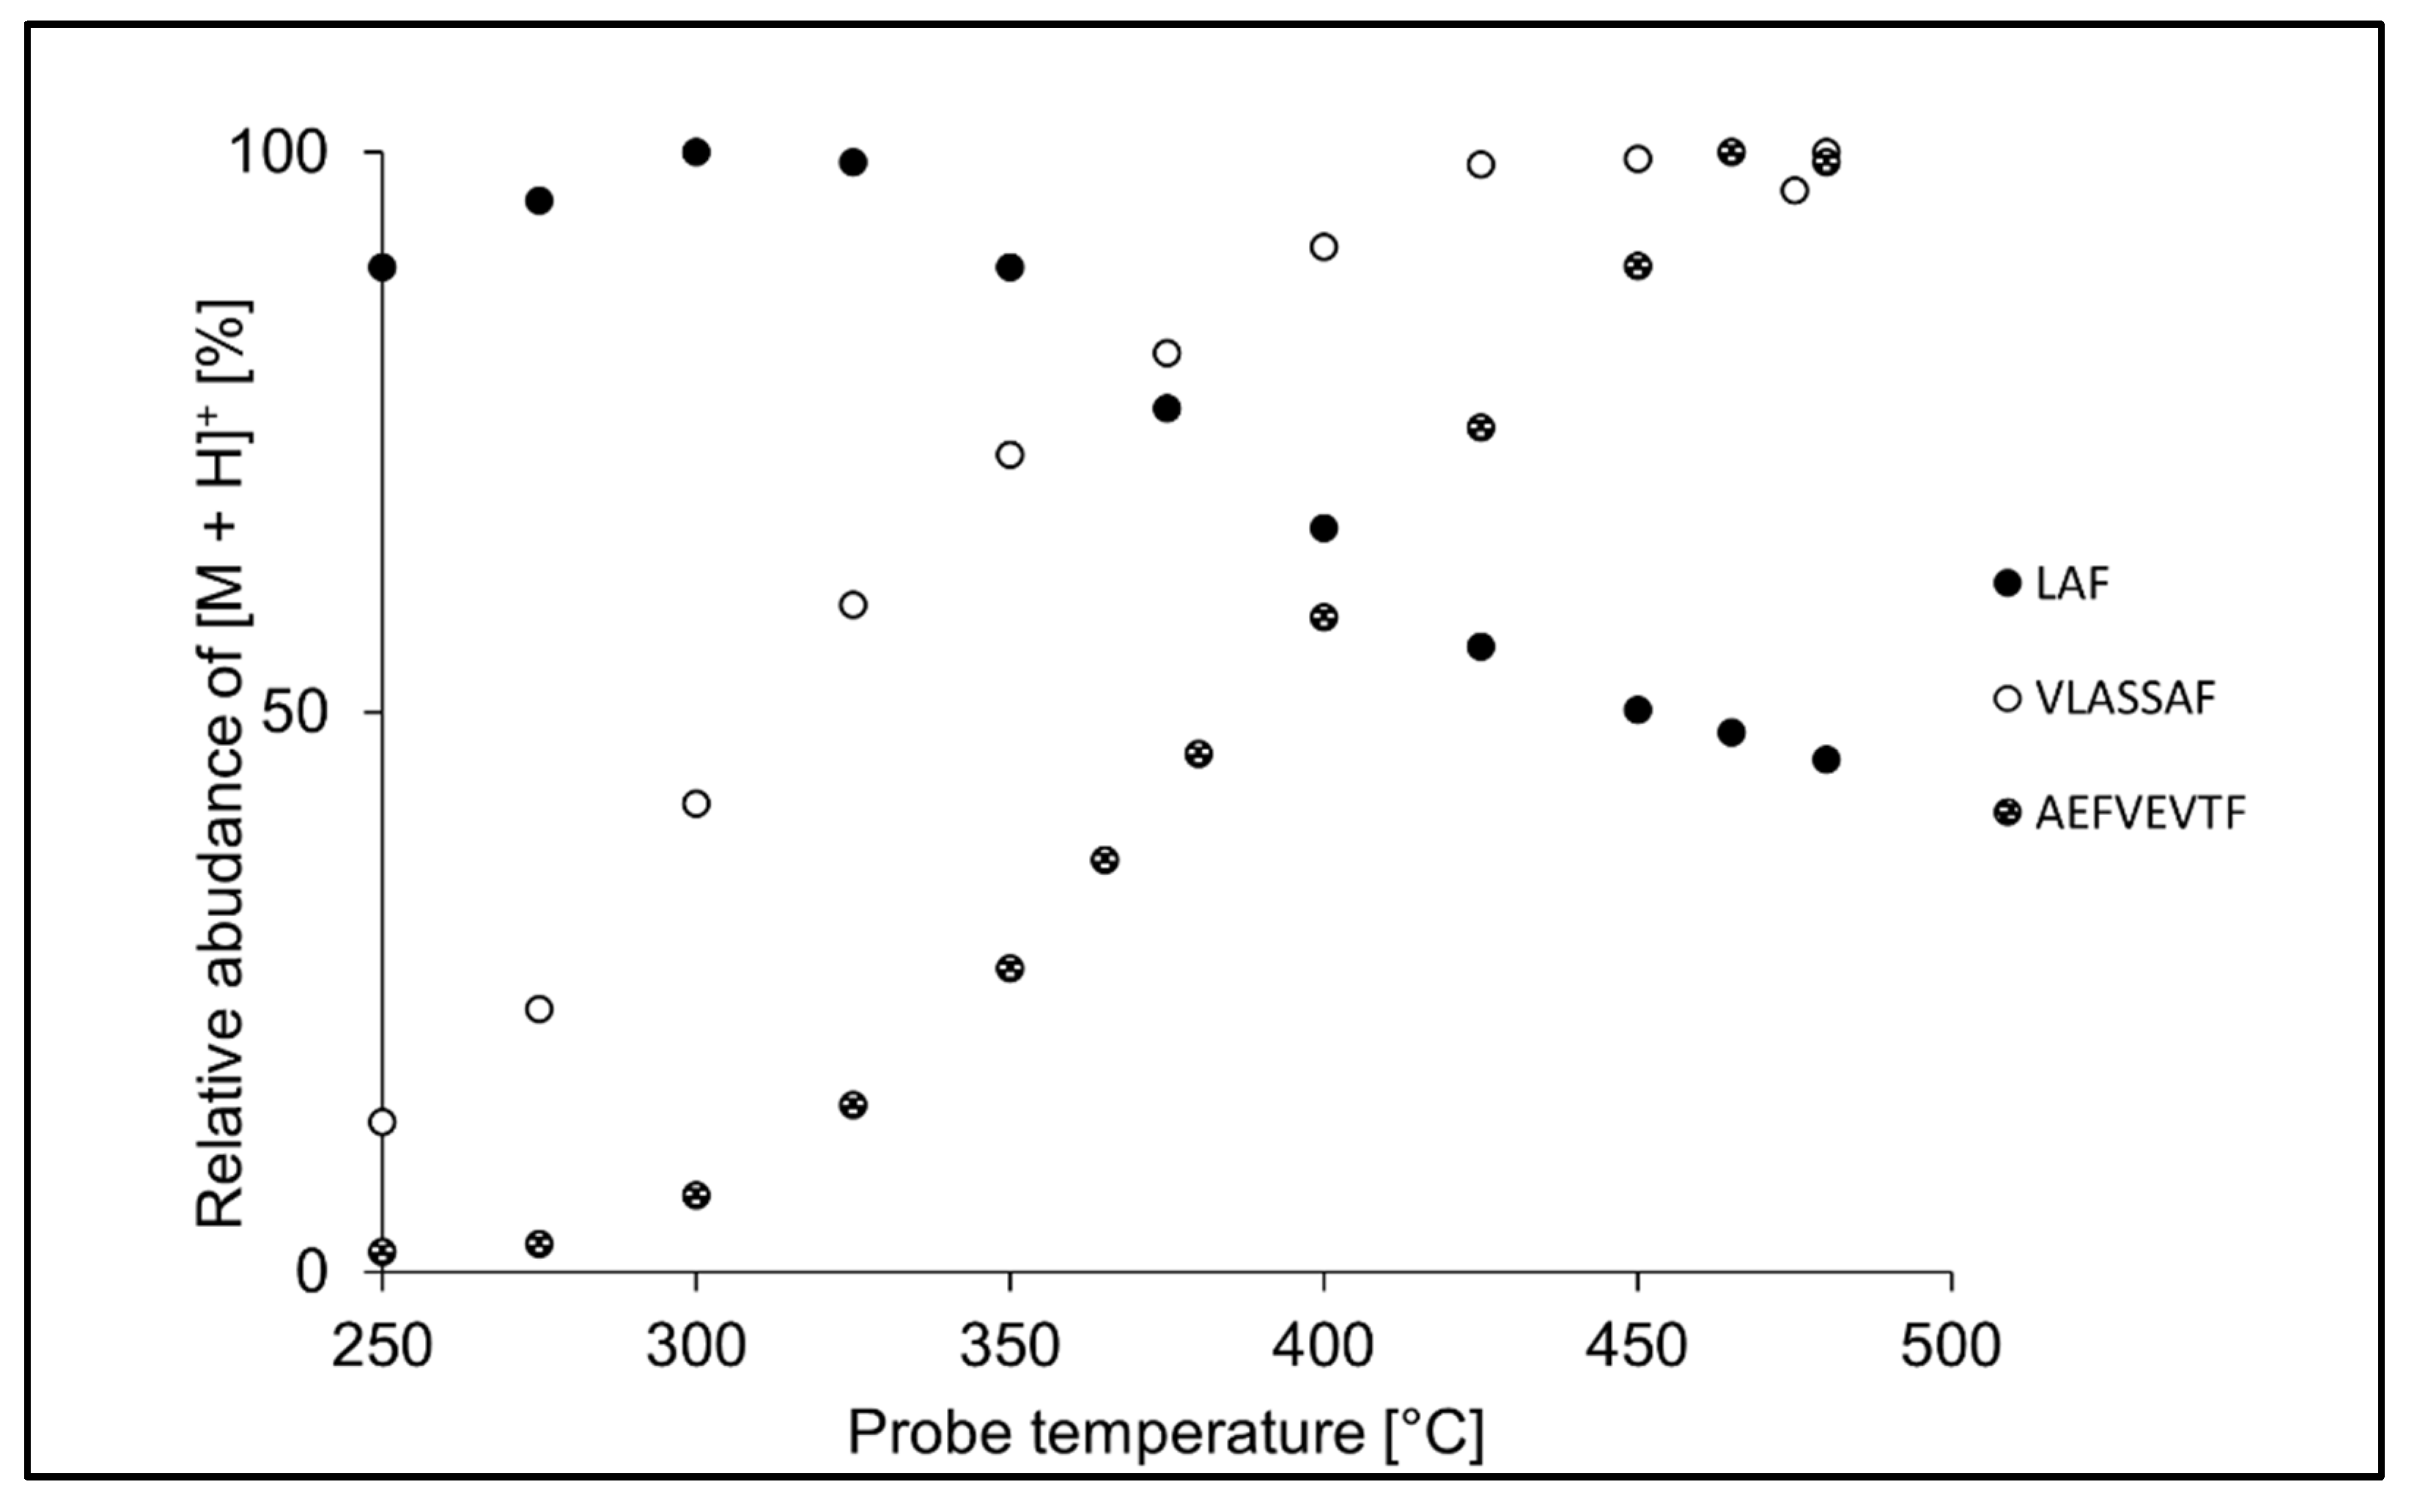
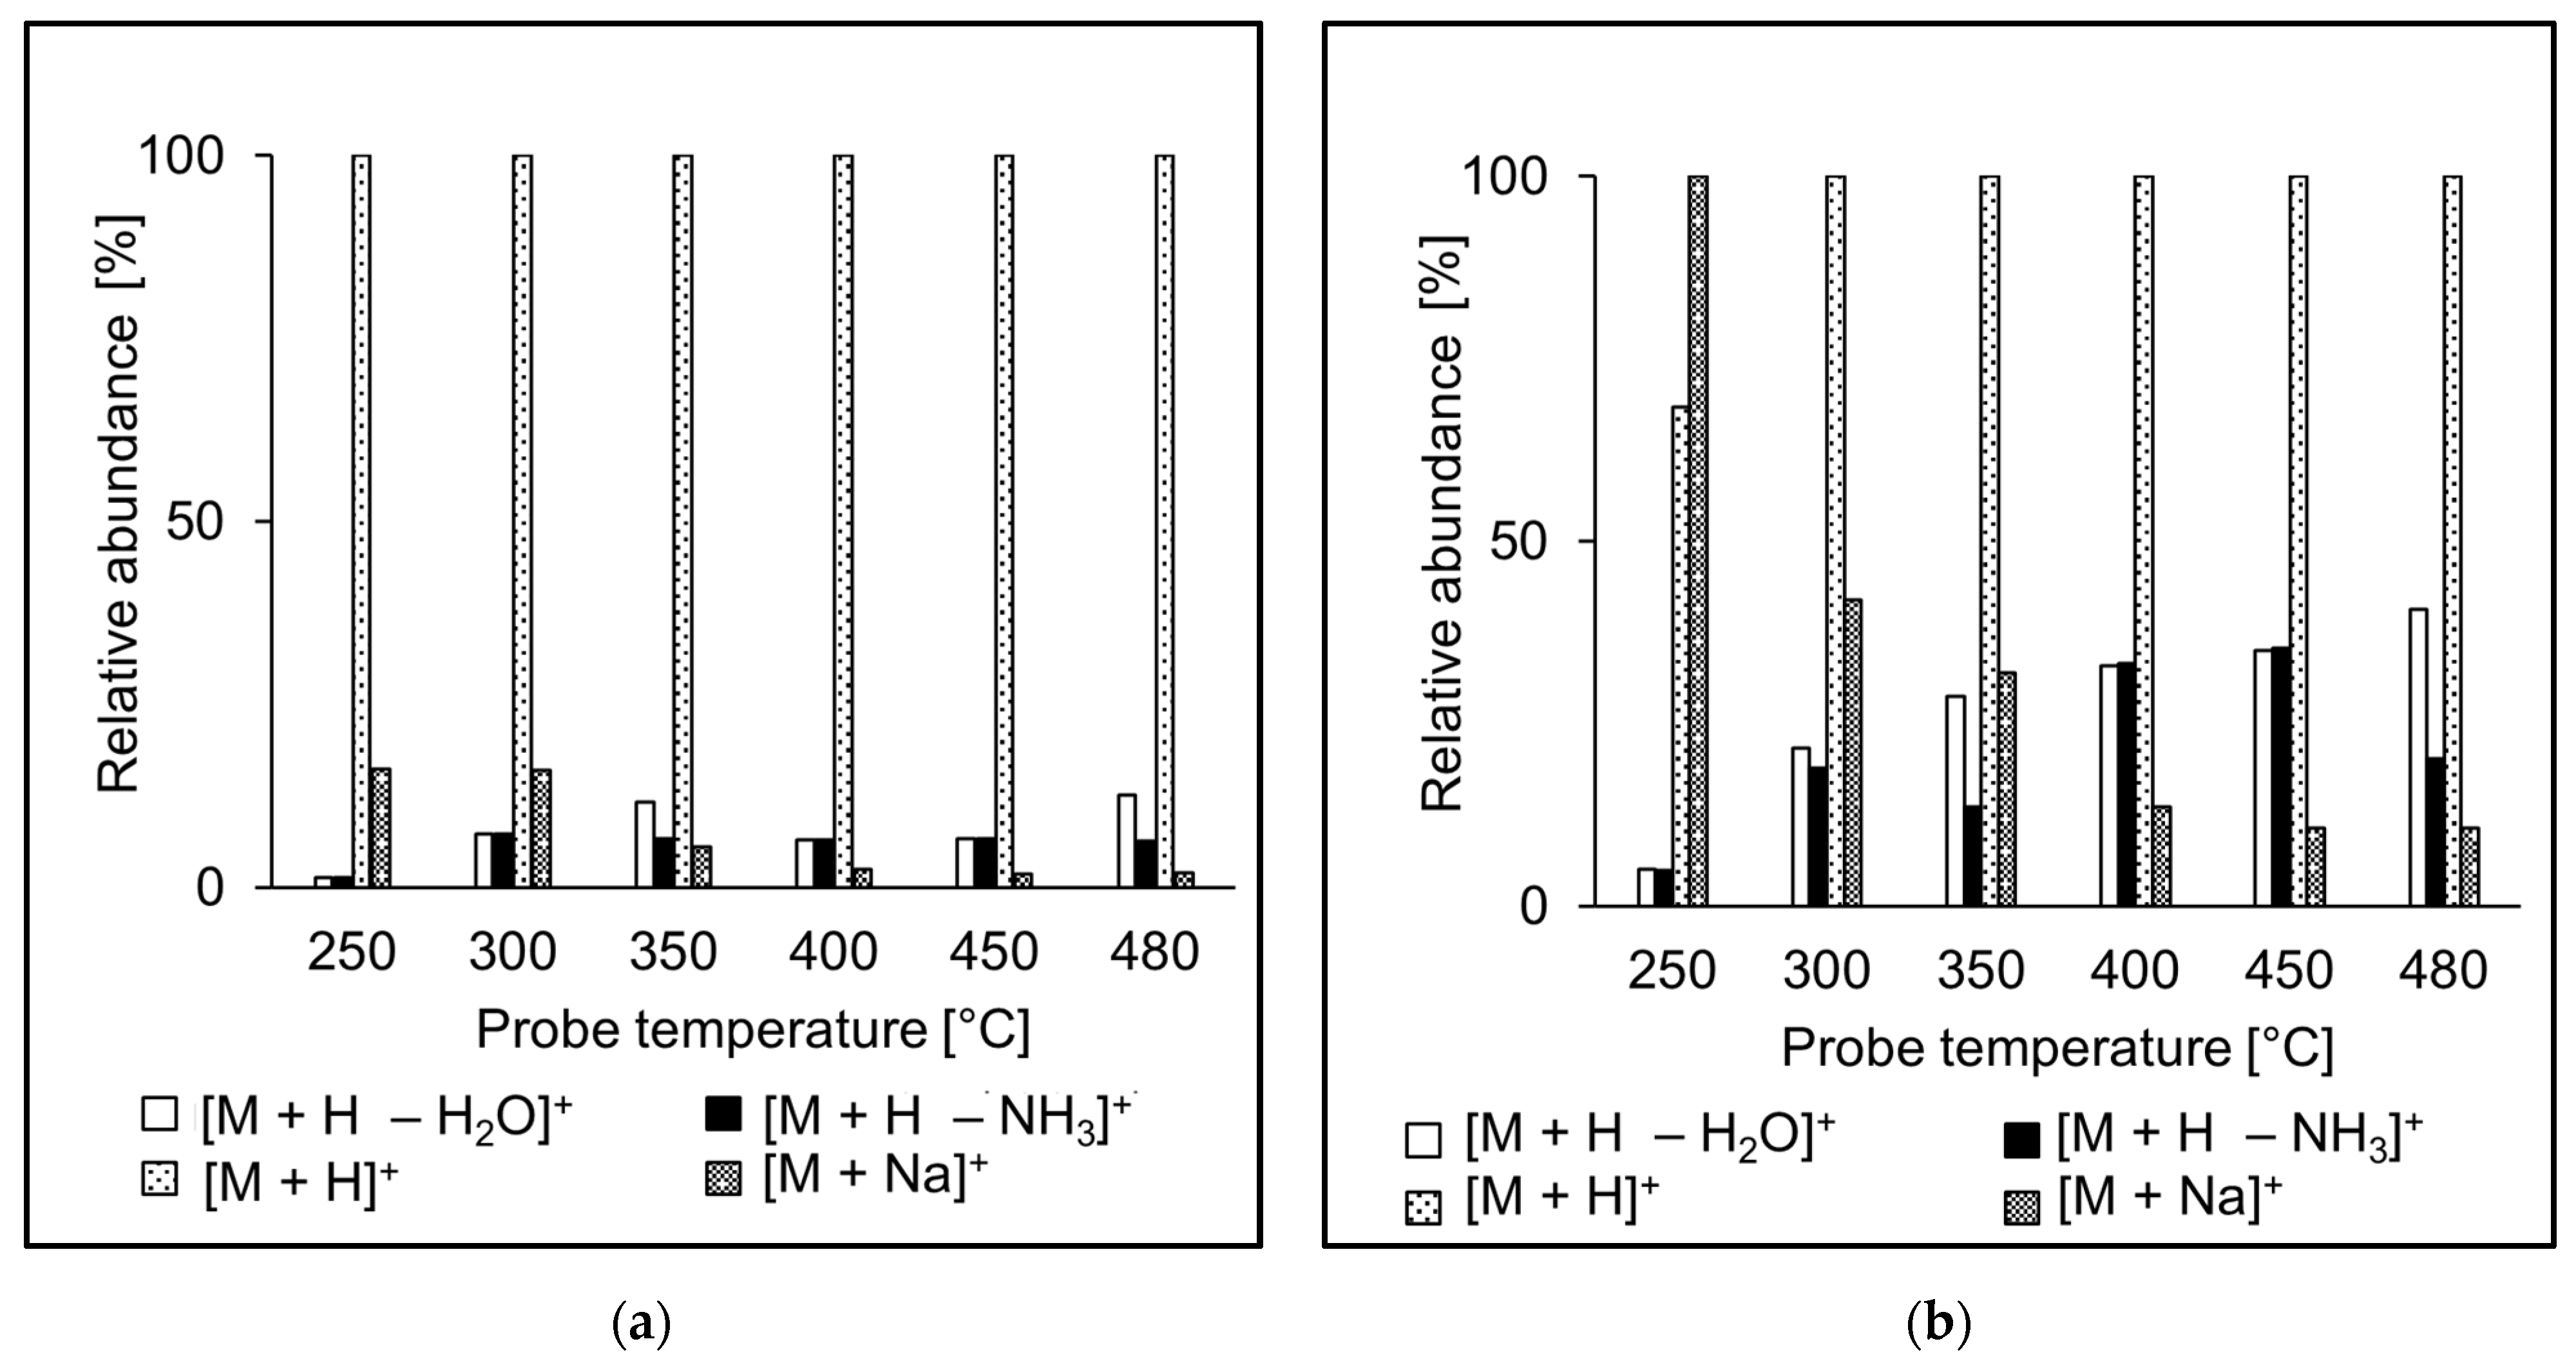
3.2. Ion Source Probe Temperature

The probe temperature is an essential parameter in APCI and APPI. At optimal temperatures, charged organic molecules are liberated from quickly evaporating droplets, and their thermal degradation is minimal. The analytes may decompose at too high temperatures, and too low a temperature setting leads to inefficient solvent evaporation from the droplets. In our experiments, the probe temperature was optimized in the 250–480 °C range by monitoring [M + H]+ signal of peptides infused into the ion source. In APCI, the maximum intensity of [M + H]+ was typically reached for the highest probe temperatures (Figure 2). Although temperature profiles of the individual peptides differed (Figure S1), most peptides exhibited the same trend. However, there were exceptions. For instance, VLASSAR and VASLE provided maximum signal at lower temperatures, while AWSVAR had almost the same signal over the entire temperature range. In contrast to APCI, the highest peptide intensities in APPI were typically observed at lower temperatures (350–475 °C); see Figure 2 for the averaged data and Figure S2 for data on individual peptides.
In terms of peptide size, shorter peptides were efficiently ionized at lower temperatures, while longer peptides required higher probe temperature settings. It is illustrated in Figure 3, which shows temperature profiles for LAF, VLASSAF, and AEFVEVTF in APPI. While tripeptide LAF provided the most intense signal at 325 °C, the maximum intensity of heptapeptide VLASSAF was reached at 450 °C, and octapeptide AEFVEVTF required the maximum probe temperature of 475 °C. Similarly, the optimum probe temperature increased with the peptide chain length also in APCI. Shorter peptides likely gain excess thermal energy, which leads to decomposition already at lower probe temperatures [59,60].
The ion source probe temperature may affect the relative abundances of ions observed in the spectra. The intensities of molecular adducts reflect competing processes of their formation and fragmentation. Fragment ion intensities depend on the excess of energy deposited on their precursors in the ion source. We investigated relative intensities of [M + H]+, [M + H − NH3]+, [M + H − H2O]+, and [M + Na]+ for the peptide standards in APCI and APPI. For most peptides, [M + H]+ was the most abundant peak in both APCI and APPI spectra, like in the case of AEFVEVTF (Figure 4). Sodium adducts were formed mainly at lower temperatures, likely due to thermospray-like ionization [35]. The intensities of ammonia and water loss peaks increased with the temperature both in APCI and APPI. However, at the same time, the relative intensities of ions in APCI and APPI spectra were significantly different, which reflects different ionization mechanisms. Neutral ammonia losses were more pronounced in APCI than APPI. The fragment ions were more abundant than their precursor molecular adducts only rarely, for instance, in QTALVELLK (Figure 5).
The effect of the ion source temperature on peptide signal in APCI and APPI has rarely been studied [35]. In previous papers, both relatively high temperatures at or above 400 °C [18,24,36,40,42,61], and lower temperatures below 400 °C [26,28,29,38] were used. Our results indicate that higher probe temperatures are advantageous for detecting peptides. Therefore, the following proteomics experiments were carried out with the probe temperature set to 475 °C for APCI and 450 °C for APPI. These values ensured the efficient formation of [M + H]+, low intensity of sodium adduct, and low fragmentation for most peptides.

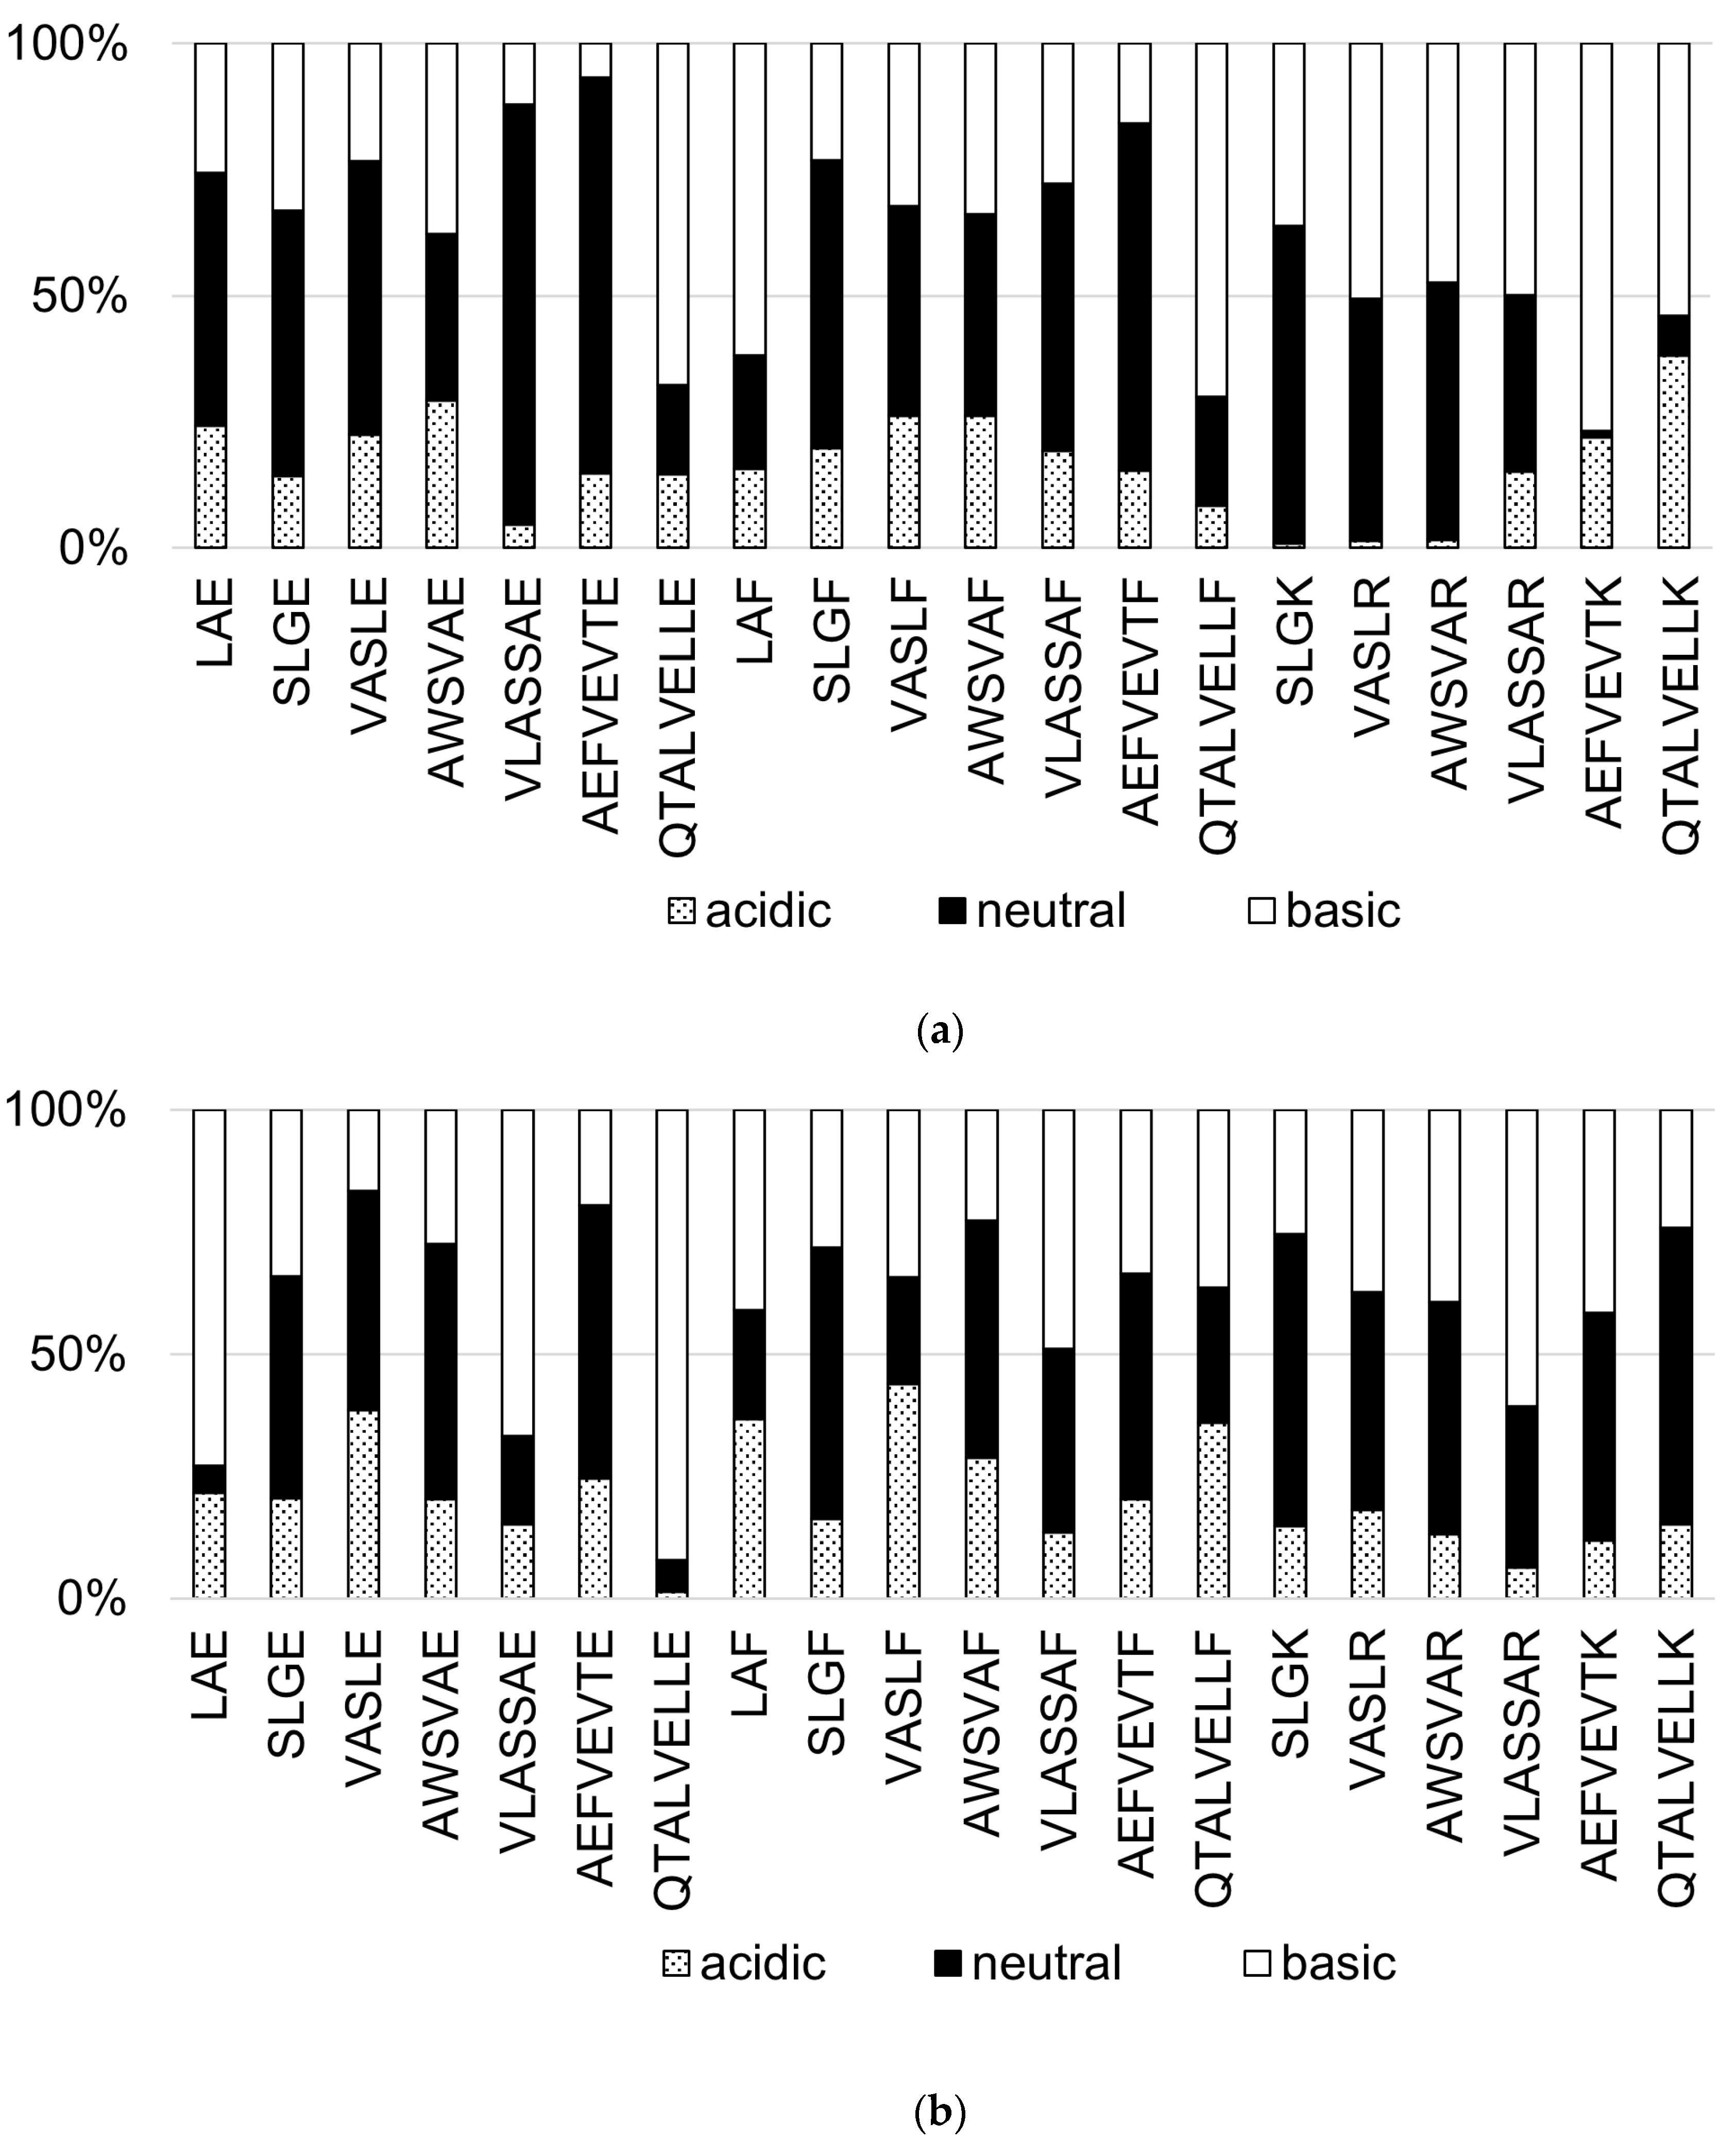
3.3. Effect of the Mobile Phase pH

The effect of mobile phase pH on the intensity of protonated peptides in APCI and APPI was studied. The peptides were infused into the ion source in one of the following mobile phases: (i) acidic phase pH 3.8 (35 μmol·L−1 CH3COOH), (ii) neutral phase (water), and (iii) basic phase pH 10.5 (35 μmol·L−1 NH4OH). The peptide signal-to-noise ratios detected in all mobile phases were normalized and plotted in Figure 6. The lowest S/N values were achieved at pH 3.8 for most peptides in both ion sources. This finding is important because other authors commonly use acidic pH for analyzing peptides in APCI–MS and APPI–MS [25,26,28,30]. In our experiments, neutral or basic pH mobile phases provided better S/N values for the investigated peptides.

3.4. Effect of Dopant in APPI

We studied the effect of dopants (acetone or toluene) on detecting peptides in APPI. Dopant was added from the LC pump as a part of the mobile phase. The dependence of the [M + H]+ intensity on the dopant content in the mobile phase was investigated within the 0–20% range. The m/z values of the ions in the spectra did not change, but the presence of dopant enhanced the peptide signals. The increase of [M + H]+ intensities was about 30% at maximum. Compared to toluene, fewer background ions were observed in acetone, which offered higher signal-to-noise ratios. The peptide signals increased for up to 7% of acetone in the mobile phase (acetonitrile at 400 μL·min−1). Since higher acetone concentrations did not provide any beneficial effect, 7% of acetone in the mobile phase was used for further APPI–MS experiments. Notably, the presence of acetone in the mobile phase at this level barely affected peptides retention and separation on the column in the experiments described below.

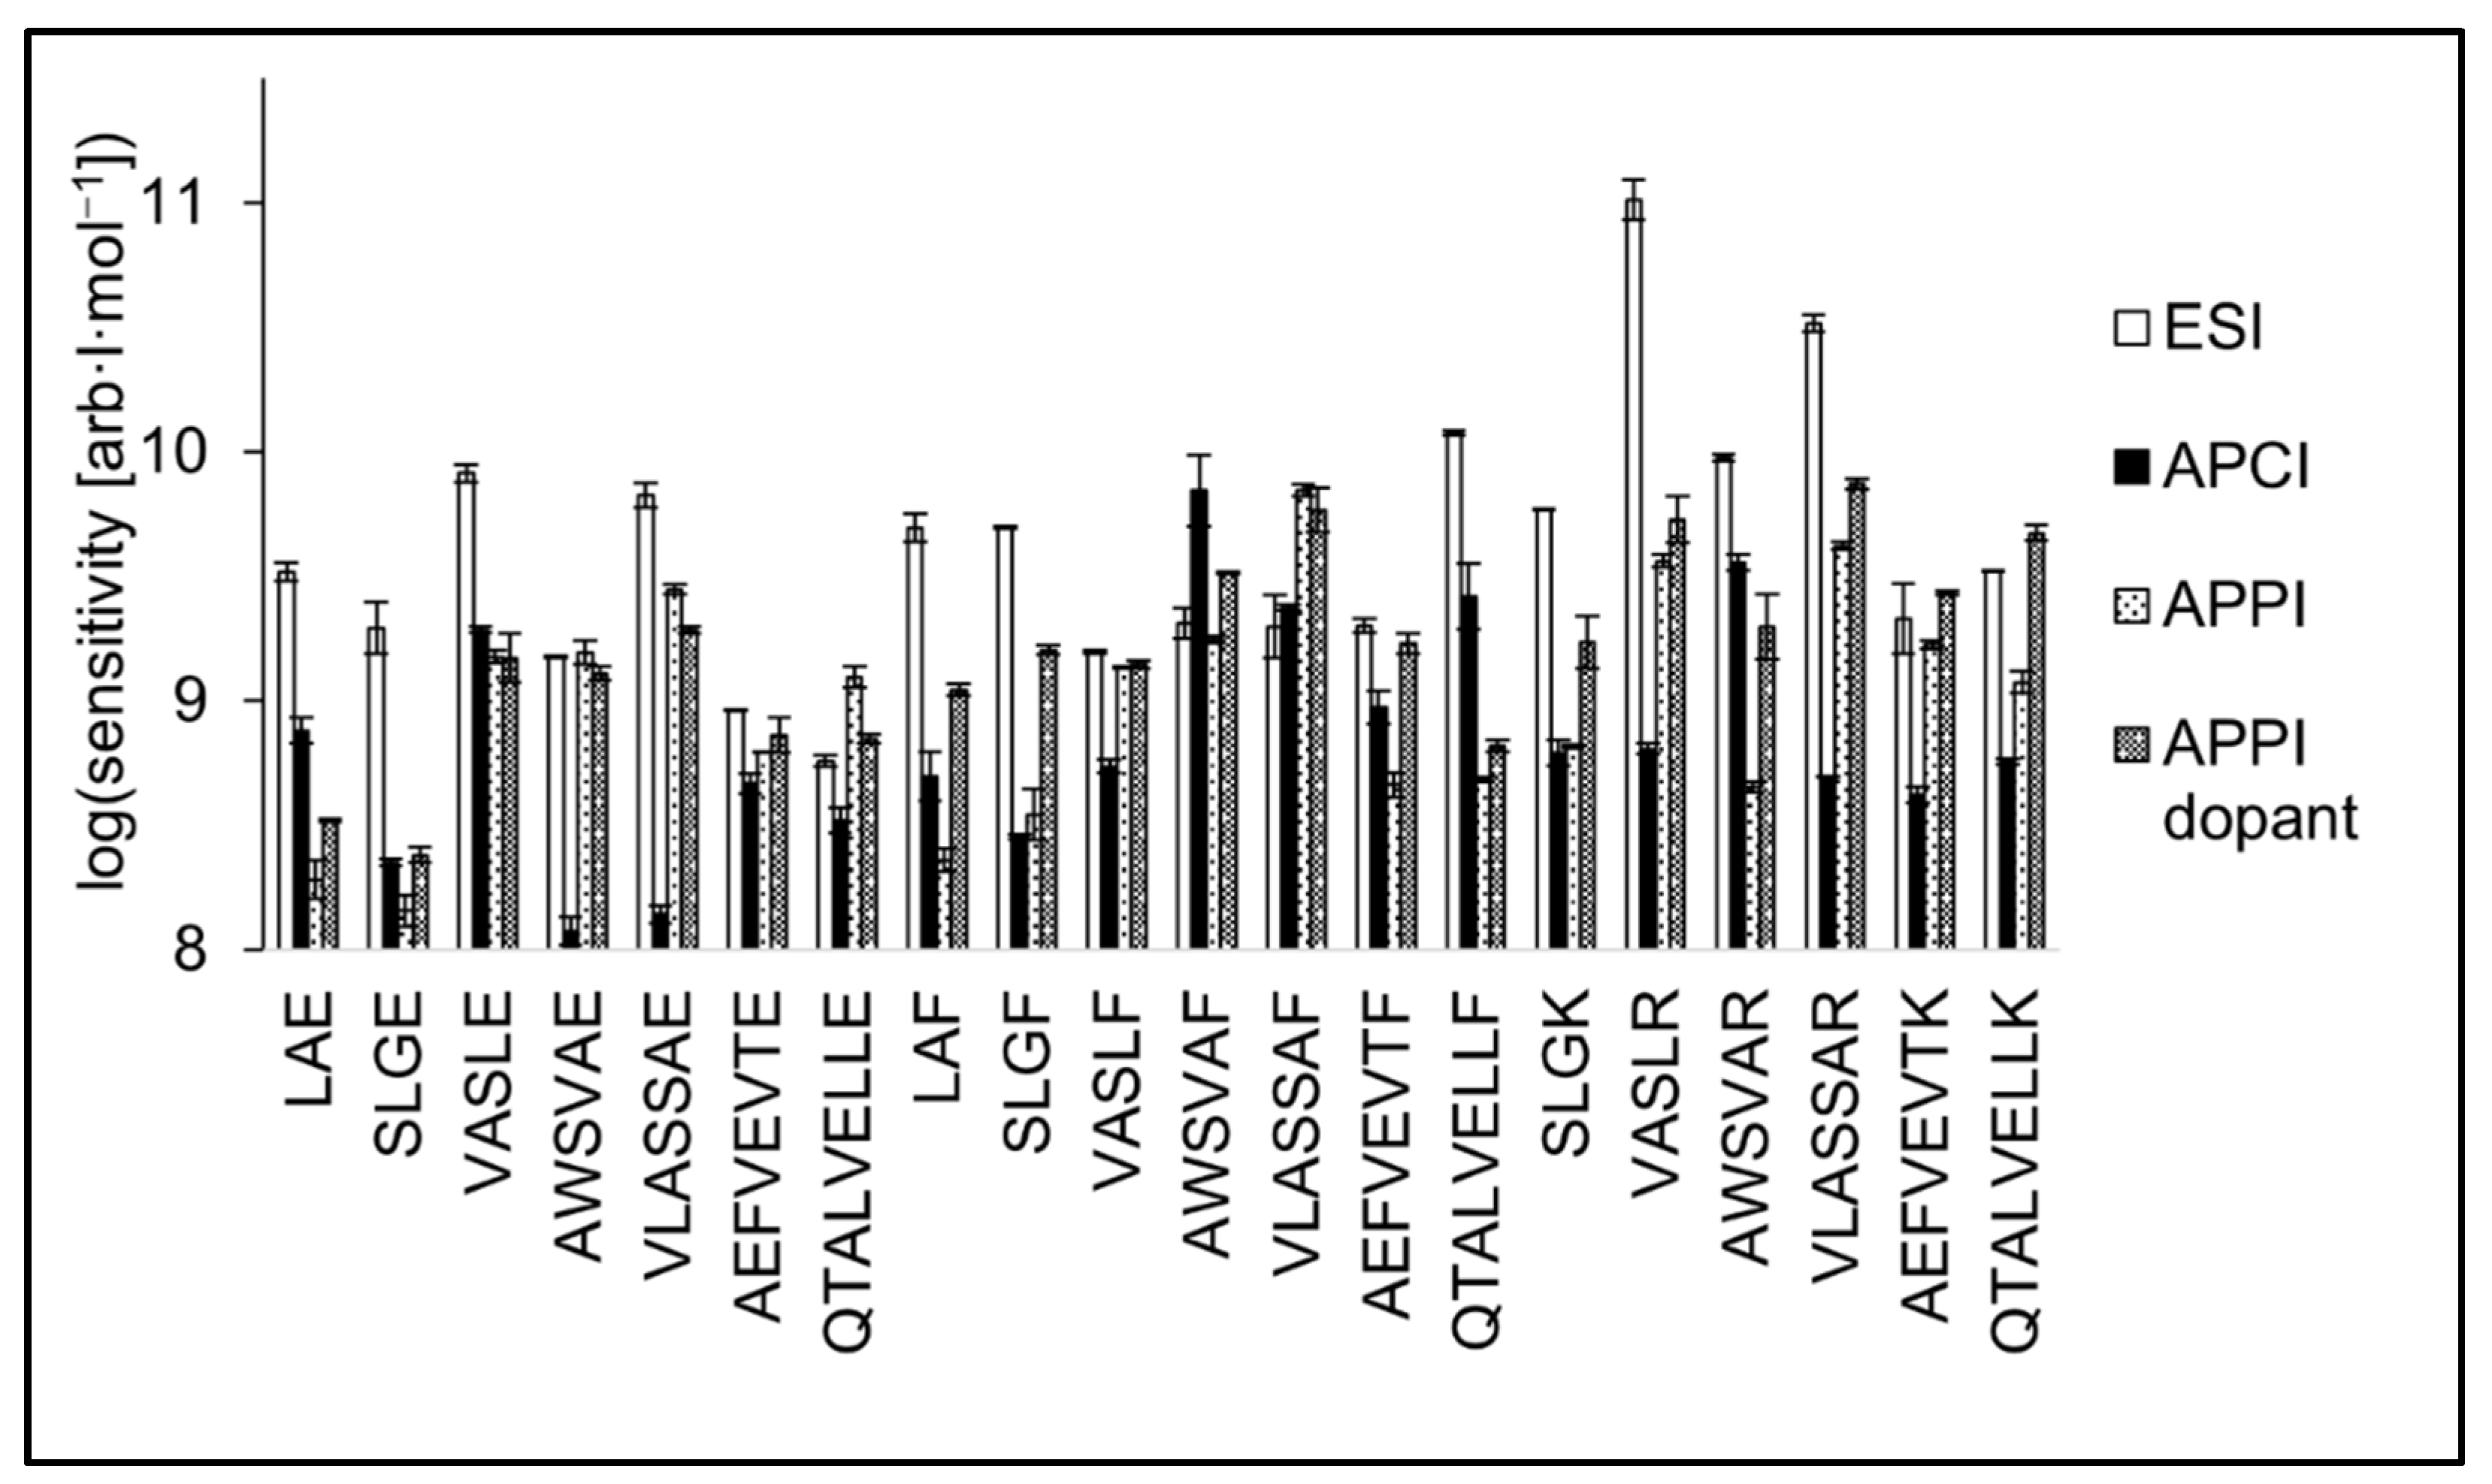
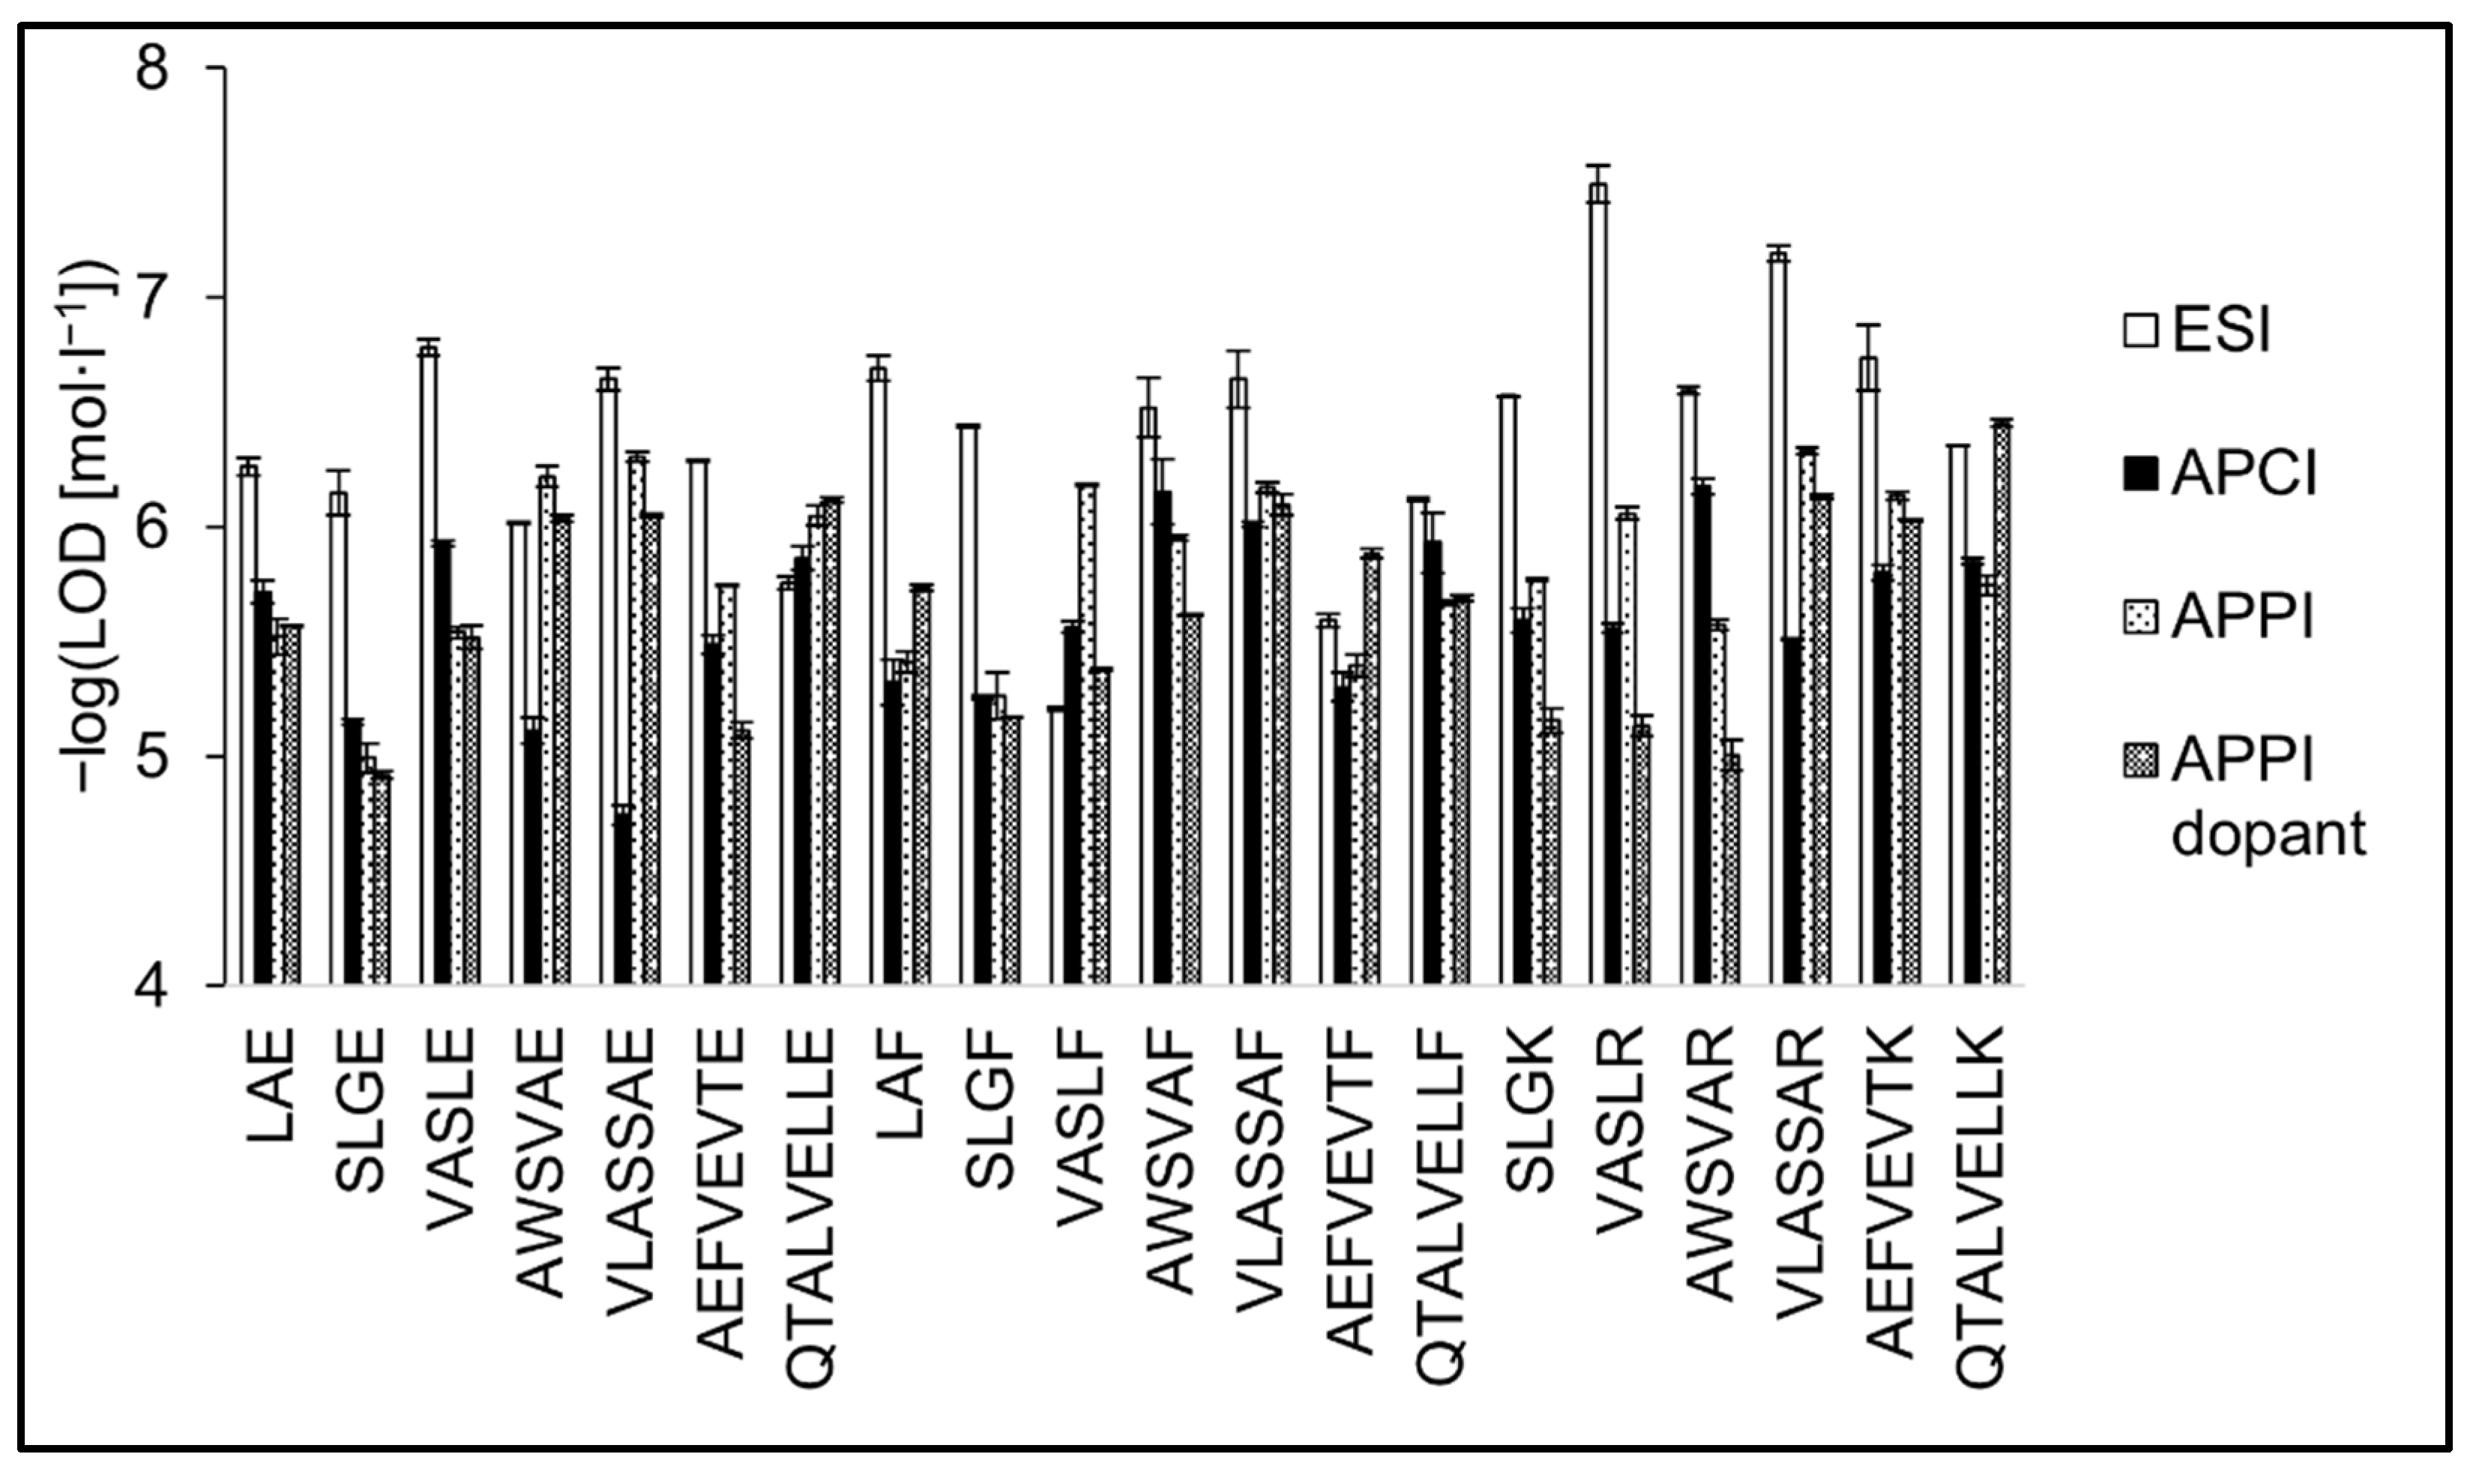
3.5. Analytical Figures of Merit

Limits of detection and sensitivity values were evaluated for the peptide standards to compare the ionization methods from the quantification point of view. The same mobile phase (methanol/water, 80:20 v/v) and flow rate (400 μL·min−1) were used to obtain comparable data for all three ion sources. Data for the construction of calibration curves for the peptide standards were recorded in flow injection analysis mode.
The slopes of calibration curves (i.e., sensitivity values) are shown in the logarithmic scale in Figure 7. As for the peptides with glutamic acid on C-terminus, the sensitivity of QTALVELLE and AWSVAE was best in APPI. At the same time, AEFVEVTE was detected in APPI, APCI, and ESI with similar sensitivity. Three short peptides, LAE, SLGE, and VASLE, exhibited the highest sensitivity in ESI. The sensitivity of peptides terminated with F was similar or even higher in APPI and APCI compared to ESI for most peptides. The best sensitivity in APCI was achieved for AWSVAF, and ESI proved to be more sensitive for LAF and SLGF. Tryptic peptides were the most sensitively detected in ESI. Two tryptic peptides, AEFVEVTK and QTALVELLK, were detected with similar sensitivities in ESI and dopant APPI.
The use of the dopant in APPI positively affected the detectability of tryptic peptides and partially also peptides terminated by phenylalanine. The presence of acetone in the mobile phase did not significantly increase the detection sensitivity for peptides terminated by glutamic acid; in some cases, the sensitivity even decreased (VASLE, AWSVAE, or VLASSAE). This behavior is likely due to the higher proton affinity of basic residues K and R compared to neutral aromatic F or acidic E [62]. Although terminal amino acids do not form the entire PA of the peptide, their contribution could be decisive in ionization efficiency.
The detection limits are presented as the peptide concentration providing a signal at three times the background noise (Figure 8). The LOD values were 3.2 × 10⁻⁸–6.2 × 10⁻⁶ mol·L−1 (0.1–15.6 pmol; median value x ˜ = 0.8 pmol) for ESI, 6.6 × 10⁻⁷–1.8 × 10⁻⁵ mol·L−1 (1.6–45.0 pmol; x ˜ = 6.6 pmol) for APCI, 4.7 × 10⁻⁷–1.0 × 10⁻⁵ mol·L−1 (1.0–25.4 pmol; x ˜ = 4.4 pmol) for APPI, and 3.5 × 10⁻⁷–1.2 × 10⁻⁵ mol·L−1 (0.9–30.0 pmol; x ˜ = 5.6 pmol) for dopant APPI. The lowest values were typically observed in ESI; however, there were several exceptions. The highest differences in LOD values between ESI and gas-phase ionizations were observed for tryptic peptides. The LODs in ESI were two to 80 times lower compared to APCI or APPI. The differences were less pronounced for the peptides terminated by phenylalanine or glutamic acid. Some peptides in APPI provided comparable or even lower LODs than in ESI; this was the case of AWSVAE, QTALVELLE, VASLF, and AEFVEVTF. The positive effect of APPI dopant on LODs was not as pronounced as in the case of sensitivities. In addition to increasing the peptide signal, the dopant also caused an increase in the background noise, which had an adverse effect on the LOD values. It is known that commonly used dopants such as toluene, anisole, chlorobenzene, and acetone intensify impurities and cause higher background noise. The effect of various dopants is not the same; compared to toluene, reactions with acetone are more selective, and the background is usually lower [63]. The highest LOD values were achieved in APCI. APCI provided the best response for tryptic and phenylalanine terminated peptides among the peptides tested. Detection limits of peptides terminated with glutamic acid significantly increased with the peptide chain length. Limits of detection with error bars are shown in Table 1. Tabulated figures of merit for all peptide standards are provided in Tables S1–S4.
The use of the same composition and flow rate of mobile phase for all three ion sources allowed us to compare different ionization modes directly. The performance of all the ion sources was compromised because they did not operate at their optimum flow rates and mobile phases. ESI–MS of peptides is commonly performed at nano- or microliter per minute flow rates. Since ESI–MS is a concentration-sensitive detector, lower flow rates bring benefits in terms of LODs, which are now typically at the fmol level [64,65,66]. On the contrary, gas-phase ionizations like APCI and APPI are mass-sensitive detectors, and the commercial sources operate best at higher flow rates, above 1 mL·min−1. There are, however, attempts to tailor APCI and APPI sources for significantly lower flow rates with improved ionization efficiency and ion transport to mass spectrometer [67,68,69,70,71,72]. Such miniaturized sources could be beneficial also for peptide analysis. Optimization of mobile phase composition might also help achieve better LODs in APCI and APPI.

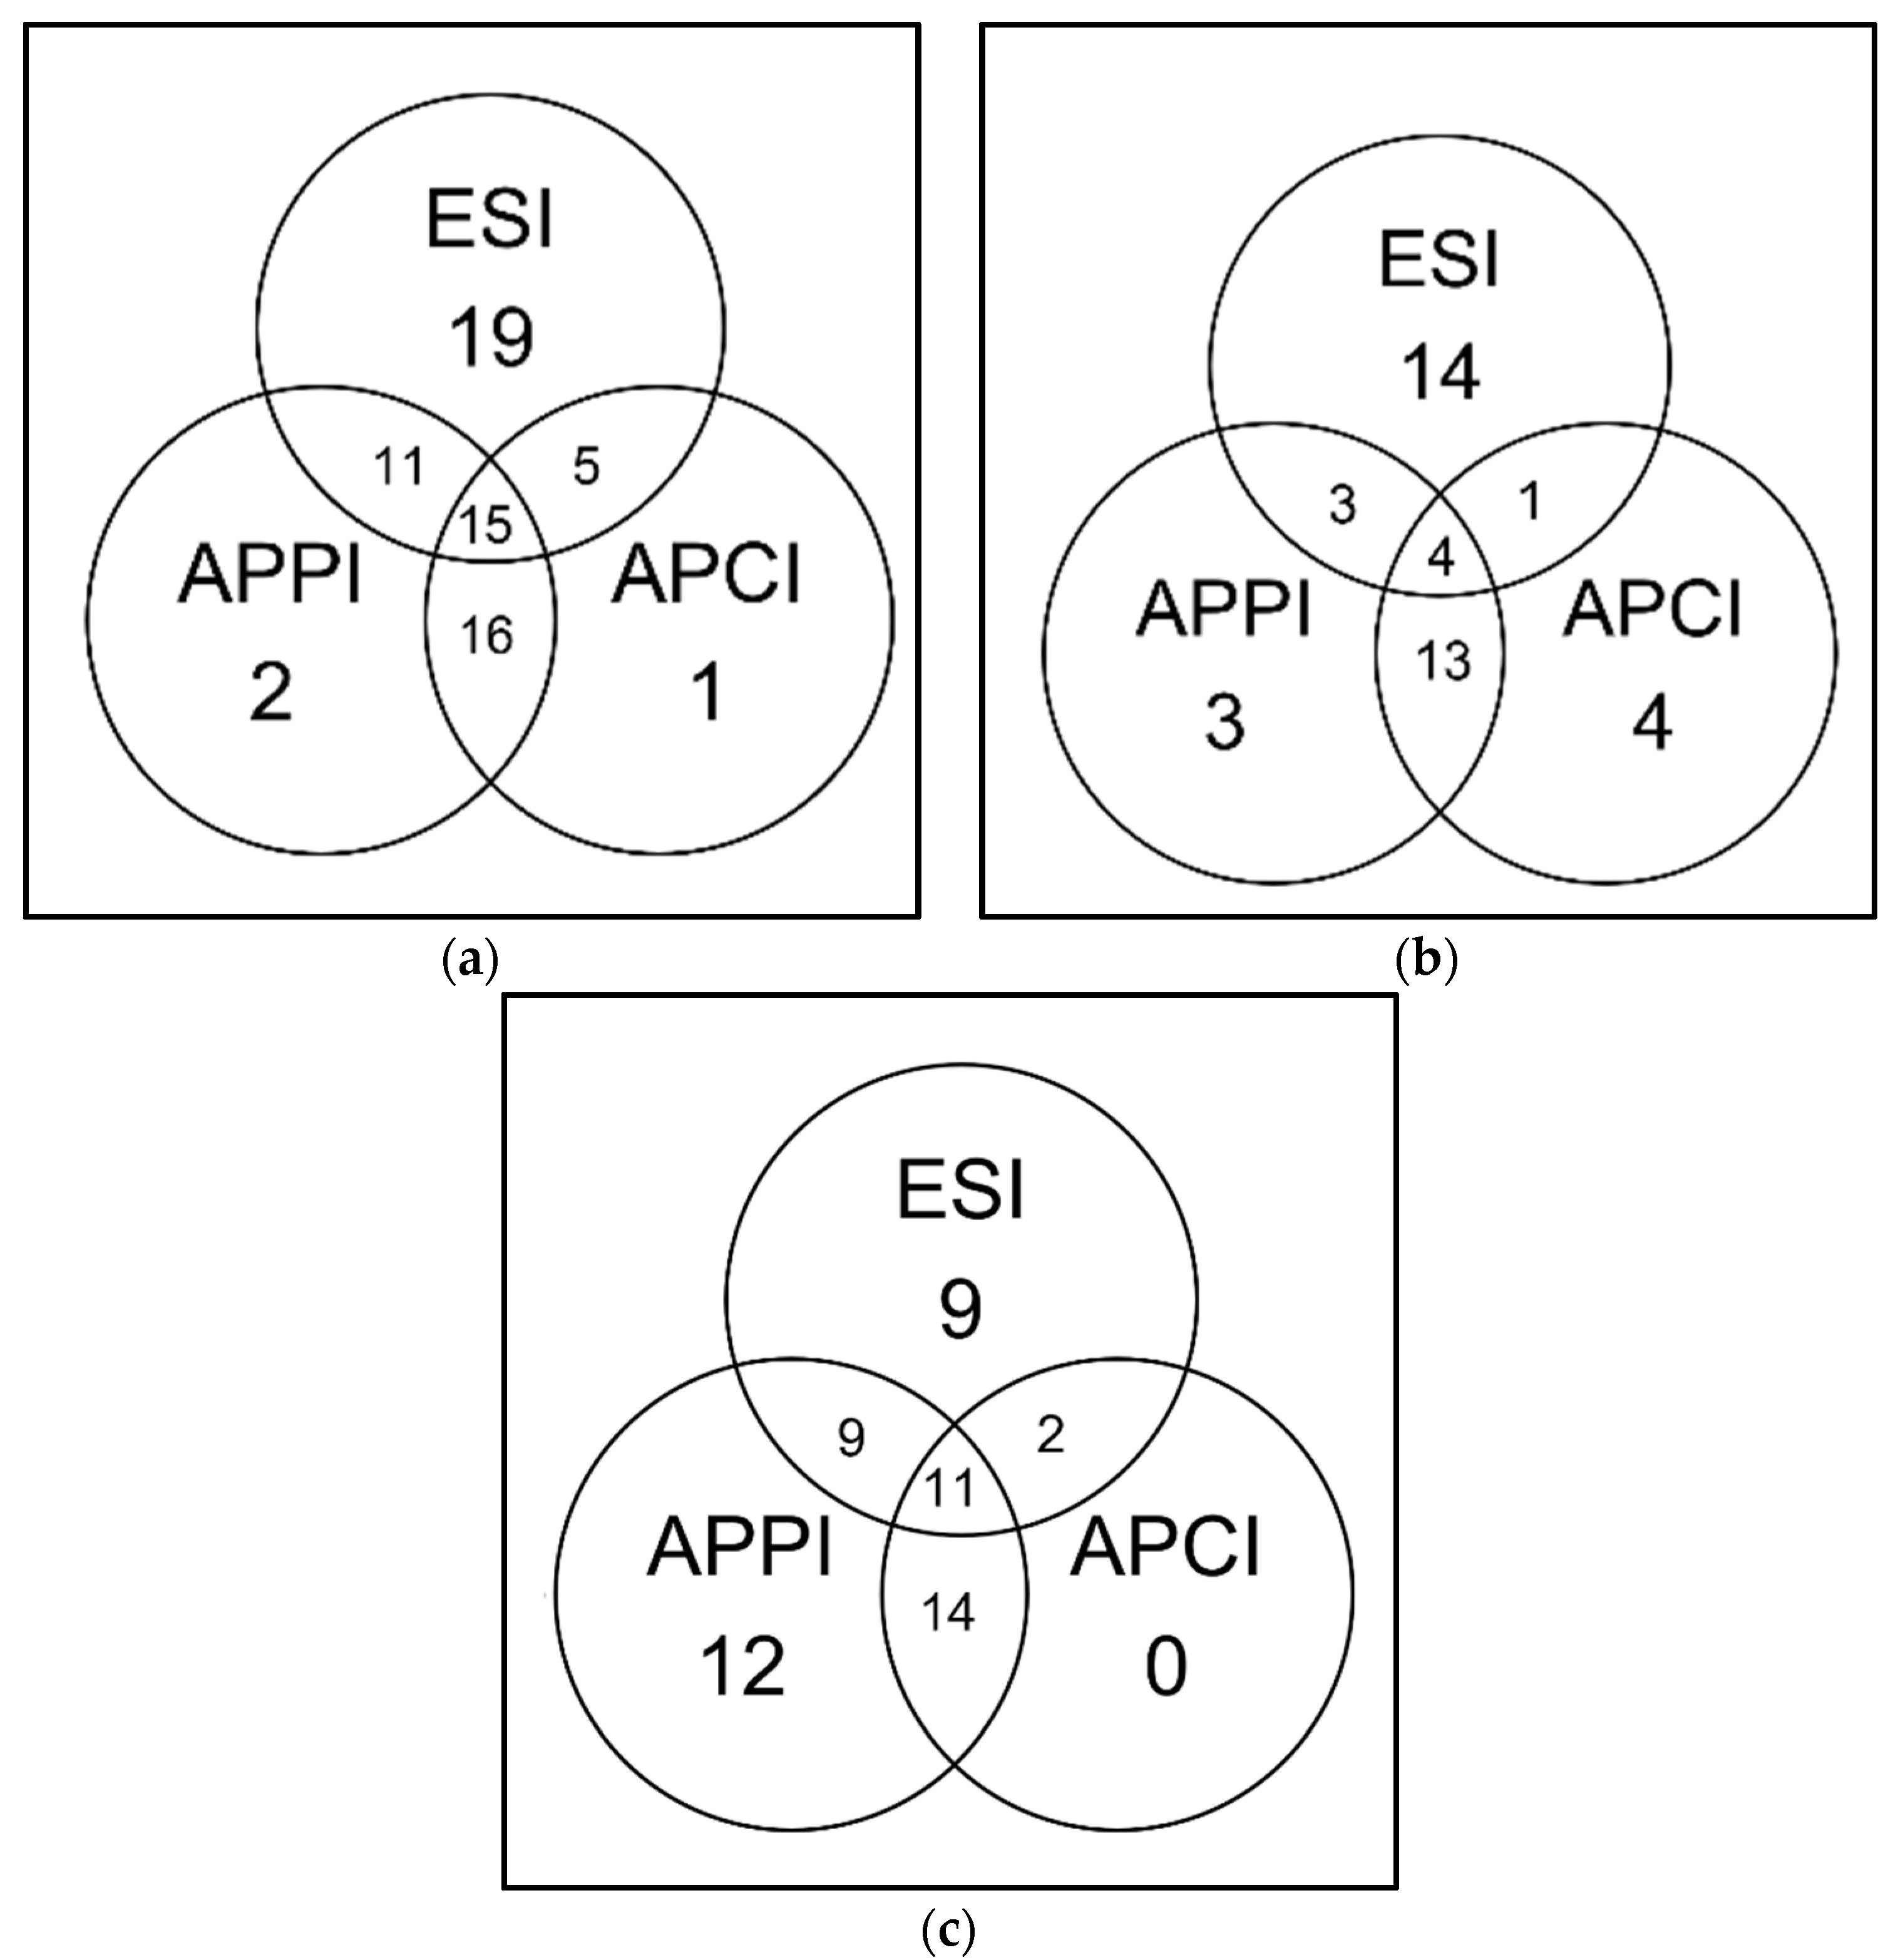
3.6. Chromatographic Analysis of BSA Digest

The applicability of APCI and APPI in proteomics was finally tested for digests prepared by trypsin, chymotrypsin, or Glu-C digestion of bovine serum albumin. UHPLC separations of peptides were achieved on a 2.1 mm i.d. reversed-phase column using mobile phase flow rates of 225 or 250 μL·min−1. The source probe temperatures were 475 °C in APCI and 450 °C in APPI. ESI source was used to generate reference proteomics data. Peptide ions were detected in the Orbitrap and fragmented by collision-induced dissociation in the linear ion trap.
In current LC/ESI–MS2 proteomics, acidic mobile phases are considered a gold standard and widely used. Nevertheless, it turns out that basic phases might be advantageous, as discussed in a recent review [73]. The basic mobile phases improve the S/N ratio, shape of the chromatographic peaks for basic compounds, and in some cases, also quantification due to reduced matrix effect. The mobile phase composition is particularly crucial when gas-phase ionizations like APCI and APPI are used. Therefore, the optimum composition of mobile phases for APPI and APCI was searched in a series of experiments with various mobile phases. The performance of mobile phases was evaluated using the percentage of the BSA sequence covered by identified peptides (sequence coverage). The first experiments were performed with tryptic peptides and ten mobile phases representing various combinations of organic solvent (methanol or acetonitrile) and acidic, neutral, or basic aqueous phase (Table 2). While ESI provided high sequence coverage for all mobile phases tested, the performance of the other two ion sources depended strongly on the mobile phase composition.
Regarding the mobile phases’ organic component, APCI provided significantly higher sequence coverage values for methanol than for acetonitrile. The best results in APCI were achieved in mobile phases combining organic solvents and water with no additives. The presence of salt or acid in water reduced sequence coverage. Methanol combined with water adjusted to pH 9 provided slightly worse sequence coverage than the methanol/water phase. APCI provided the lowest sequence coverage for all mobile phases among the ionization modes tested.
In APPI, no significant differences between mobile phases containing methanol or acetonitrile were noticed. Neutral and basic mobile phases provided higher sequence coverage than acidic phases. Ammonium acetate and aqueous ammonia possibly improved the detectability of some peptides due to the formation of ammonium adducts in APPI [74]. Attempts to increase sequence coverage in APPI by using dopant turned out ineffective. Although the peptide signals increased, the elevated background reduced their chances of detection.
ESI primarily provided multiple (two to four) charged peptides in all mobile phases. There was no difference whether methanol or acetonitrile was used; however, better ionization efficiency was achieved using mobile phase additives. In the second set of experiments, mobile phases performing the best for tryptic peptides were used to evaluate the performance of APCI and APPI for a broader range of peptides. They were obtained by digesting BSA with trypsin, chymotrypsin, or Glu-C. As in the previous experiments, sequence coverage was used to compare APCI and APPI with ESI (Table 3).
Not surprisingly, electrospray was the most helpful ionization for tryptic peptides, yielding sequence coverage of 70% for BSA. Gas-phase ionizations provided lower values for tryptic peptides; 46% for APPI and 27% for APCI. All peptides detected by APCI or APPI were also found in ESI spectra. When compared to APCI, APPI was more efficient in detecting arginine-terminated basic peptides. In APCI, peptides with more acidic residues and lower hydrophobicity were better ionized compared to APPI. Hydrophobicity was assessed based on the number of hydrophobic residues.
The sequence coverages were different for chymotryptic and Glu-C digests. Peptides in chymotryptic digest were also best detected by ESI, but sequence coverages obtained by the other two ionization methods were almost comparable. The values were 35% for ESI, 26% for APPI, and 18% for APCI. Notably, both APPI and APPI made it possible to detect unique peptides. Since the peptides detected solely by APCI were short, the sequence coverage achieved by APCI–MS was significantly lower than in APPI–MS. The ability of APCI to detect shorter peptides has been demonstrated previously [27]. The ability of ESI and gas-phase ionizations to detect chymotryptic peptides appeared to be complementary; see Venn’s diagrams in Figure 9. Out of 42 peptides detected, 15 were not detected by APPI, APCI did not detect 20, and ESI did not detect 16. APPI efficiently detected basic peptides, while APCI was sensitive to acidic and neutral peptides. The difference between APCI and APPI can be attributed to different ionization mechanisms and different compositions of mobile phases.
For the Glu-C digest, the highest sequence coverage of 46% was achieved in APPI. ESI was less efficient at detecting peptides in this sample, showing sequence coverage of 35%. APCI showed the worst performance with a sequence coverage of 20%. APPI provided the highest number of unique peptides: out of 57 peptides detected, 26 were not detected by ESI, and APPI did not detect only 11 peptides. No unique peptides were observed in APCI spectra.

4. Conclusions

This study aimed to investigate the usefulness of gas-phase ionizations, namely APCI and APPI, for peptide analysis in mass spectrometry-based proteomics. Experiments focused on optimizing the working conditions of the ion sources were performed. The APCI and APPI sources operated best when the probe temperature was set relatively high; the optimum temperatures were 470–480 °C for APCI and 350–480 °C for APPI. Peptides detected by APCI or APPI provided the highest signal-to-noise ratios when delivered to the ion sources in neutral or basic mobile phases. Analytical figures of merit were determined for synthetic peptides to compare the performance of the ion sources. The lowest limits of detection and highest sensitivities were achieved for tryptic peptides in ESI. However, some peptides terminated with phenylalanine or glutamic acid were more efficiently detected in APPI. The applicability of APCI and APPI in bottom-up proteomics based on UHPLC/MS2 was evaluated for BSA digests. Unlike ESI, peptides’ detectability in APCI and APPI depended strongly on the mobile phase. The highest sequence coverage in APPI was achieved for acetonitrile/water adjusted to pH 9 with ammonia, while APCI performed the best in methanol/water. Compared to other ionization methods, ESI showed significantly higher sequence coverage for the tryptic digest. However, BSA peptides in chymotryptic digest were detected by ESI and gas-phase ionizations comparably. APPI turned out to be the most appropriate technique for detecting peptides in the Glu-C digest, providing the highest number of identified peptides.
The results show that gas-phase ionizations can detect peptides that are not efficiently ionized in ESI. APCI and APPI provide data complementary to widely used ESI, particularly for non-tryptic peptides. Gas-phase ionizations, in particular APPI, have great potential in proteomics, especially in workflows involving alternative methods of protein digestion. The applicability of gas-phase ionizations in proteomics is, however, limited by the unavailability of commercial ion sources dedicated to low flow rates.

Supplementary Materials

The following are available online https://www.mdpi.com/article/10.3390/separations9020042/s1, Figure S1: Effect of the probe temperature on the relative intensities of peptide molecular ions ([M + H]+) in APCI. Figure S2: Effect of the probe temperature on the relative intensities of peptide molecular ions ([M + H]+) in APPI. Table S1: Detection limits and sensitivities in ESI for peptide standards. Table S2: Detection limits and sensitivities in APCI for peptide standards. Table S3: Detection limits and sensitivities in APPI for peptide standards. Table S4: Detection limits and sensitivities in dopant APPI for peptide standards.

Author Contributions

Conceptualization, J.C.; methodology, M.H. and V.V.; resources, M.B.; investigation, formal analysis, and writing-original draft preparation S.S.; writing—review and editing, J.C., V.V. and M.H.; supervision and funding acquisition, J.C. All authors have read and agreed to the published version of the manuscript.

Funding

Financial support from the Czech Science Foundation (Project No. 20-09126S) is acknowledged with appreciation.

Institutional Review Board Statement

Not applicable.

Data Availability Statement

The data presented in this study are available on request from the corresponding author.

Conflicts of Interest

The authors declare no conflict of interest.

References

  1. Biemann, K.; Gapp, F.; Seibl, J. Application of Mass Spectrometry to Structure Problems. I. Amino Acid Sequence in Peptides. J. Am. Chem. Soc. 1959, 81, 2274–2275. [Google Scholar] [CrossRef]
  2. Morris, H.R.; Panico, M.; Barber, M.; Bordoli, R.S.; Sedgwick, R.D.; Tyler, A. Fast Atom Bombardment: A New Mass Spectrometric Method for Peptide Sequence Analysis. Biochem. Biophys. Res. Commun. 1981, 101, 623–631. [Google Scholar] [CrossRef]
  3. Przybylski, M.; Lüderwald, I.; Kraas, E.; Voelter, W.; Nelson, S.D. Field Desorption Mass Spectra of Gastrine Peptides and Glutathione Derivatives. Z. Naturforsch.-Sect. B J. Chem. Sci. 1979, 34, 736–743. [Google Scholar] [CrossRef] [Green Version]
  4. Mudgett, M.; Bowen, D.V.; Field, F.H.; Kindt, T.J. Peptide Sequencing: The Utility of Chemical Ionization Mass Spectrometry. Biol. Mass Spectrom. 1977, 4, 159–171. [Google Scholar] [CrossRef]
  5. Hunt, D.F.; Yates, J.R.; Shabanowitz, J.; Winston, S.; Hauer, C.R. Protein Sequencing by Tandem Mass Spectrometry. Proc. Natl. Acad. Sci. USA 1986, 83, 6233–6237. [Google Scholar] [CrossRef] [Green Version]
  6. Carr, S.A.; Biemann, K. Identification of Posttranslationally Modified Amino Acids in Proteins by Mass Spectrometry. Methods Enzymol. 1984, 106, 29–58. [Google Scholar] [CrossRef]
  7. Naylor, S.; Findeis, A.F.; Gibson, B.W.; Williams, D.H. An Approach toward the Complete FAB Analysis of Enzymic Digests of Peptides and Proteins. J. Am. Chem. Soc. 1986, 108, 6359–6363. [Google Scholar] [CrossRef]
  8. Yergey, A.L.; Edmonds, C.G.; Lewis, I.A.S.; Vestal, M.L. Applications of LC/MS to Amino Acids, Peptides, and Proteins. In Liquid Chromatography/Mass Spectrometry; Hercules, D., Ed.; Springer Science + Business Media: New York, NY, USA, 1990; pp. 137–145. [Google Scholar]
  9. Jones, D.S.; Krolik, S.T.; Aplin, R. Analysis of Nonderivatised Peptides by Thermospray Using a Magnetic Sector Mass Spectrometer D. Rapid Commun. Mass Spectrom. 1987, 1, 67–68. [Google Scholar] [CrossRef]
  10. Kilpatrick, G.; Lewis, I.A.S.; Smith, J.F. The Reduction of Collision Induced Dissociation Effects in Thermospray Sources on Sector Instruments. Biomed. Environ. Mass Spectrom. 1987, 14, 155–159. [Google Scholar] [CrossRef]
  11. Yamashita, M.; Fenn, J.B. Electrospray Ion Source. Another Variation on the Free-Jet Theme. J. Phys. Chem. 1984, 88, 4451–4459. [Google Scholar] [CrossRef]
  12. Karas, M.; Hillenkamp, F. Laser Desorption Ionization of Proteins with Molecular Masses Exceeding 10 000 Daltons. Anal. Chem. 1988, 60, 2299–2301. [Google Scholar] [CrossRef] [PubMed]
  13. Nadler, W.M.; Waidelich, D.; Kerner, A.; Hanke, S.; Berg, R.; Trumpp, A.; Rösli, C. MALDI versus ESI: The Impact of the Ion Source on Peptide Identification. J. Proteome Res. 2017, 16, 1207–1215. [Google Scholar] [CrossRef] [PubMed]
  14. Tanaka, K.; Waki, H.; Ido, Y.; Akita, S.; Yoshida, Y.; Yoshida, T.; Matsuo, T. Protein and Polymer Analyses up to m/z 100 000 by Laser Ionization Time-of-Flight Mass Spectrometry. Rapid Commun. Mass Spectrom. 1988, 2, 151–153. [Google Scholar] [CrossRef]
  15. Shen, Z.; Thomas, J.J.; Averbuj, C.; Broo, K.M.; Engelhard, M.; Crowell, J.E.; Finn, M.G.; Siuzdak, G. Porous Silicon as a Versatile Platform for Laser Desorption/Ionization Mass Spectrometry. Anal. Chem. 2001, 73, 612–619. [Google Scholar] [CrossRef]
  16. Abdelhamid, H.N.; Wu, H.F. Facile Synthesis of Nano Silver Ferrite (AgFeO2) Modified with Chitosan Applied for Biothiol Separation. Mater. Sci. Eng. C 2014, 45, 438–445. [Google Scholar] [CrossRef]
  17. Woods, A.G.; Darie, C.C. Advancements of Mass Spectrometry in Biomedical Research, 2nd ed; Springer: Cham, Switzerland, 2019; ISBN 10:3030159507. [Google Scholar]
  18. Bagag, A.; Jault, J.M.; Sidahmed-Adrar, N.; Réfrégiers, M.; Giuliani, A.; Le Naour, F. Characterization of Hydrophobic Peptides in the Presence of Detergent by Photoionization Mass Spectrometry. PLoS ONE 2013, 8, e79033. [Google Scholar] [CrossRef]
  19. Xu, N.; Lin, Y.; Hofstadler, S.A.; Matson, D.; Call, C.J.; Smith, R.D. A Microfabricated Dialysis Device for Sample Cleanup in Electrospray Ionization Mass Spectrometry. Anal. Chem. 1998, 70, 3553–3556. [Google Scholar] [CrossRef]
  20. Lei, J.; Chen, D.A.; Regnier, F.E. Rapid Verification of Disulfide Linkages in Recombinant Human Growth Hormone by Tandem Column Tryptic Mapping. J. Chromatogr. A 1998, 808, 121–131. [Google Scholar] [CrossRef]
  21. Waliczek, M.; Kijewska, M.; Rudowska, M.; Setner, B.; Stefanowicz, P.; Szewczuk, Z. Peptides Labeled with Pyridinium Salts for Sensitive Detection and Sequencing by Electrospray Tandem Mass Spectrometry. Sci. Rep. 2016, 6, 37720. [Google Scholar] [CrossRef]
  22. Rebane, R.; Rodima, T.; Kütt, A.; Herodes, K. Development of Amino Acid Derivatization Reagents for Liquid Chromatography Electrospray Ionization Mass Spectrometric Analysis and Ionization Efficiency Measurements. J. Chromatogr. A 2015, 1390, 62–70. [Google Scholar] [CrossRef]
  23. DeGraan-Weber, N.; Ward, S.A.; Reilly, J.P. A Novel Triethylphosphonium Charge Tag on Peptides: Synthesis, Derivatization, and Fragmentation. J. Am. Soc. Mass Spectrom. 2017, 28, 1889–1900. [Google Scholar] [CrossRef] [PubMed]
  24. Bagag, A.; Giuliani, A.; Réfrégiers, M.; Le Naour, F. Atmospheric Pressure Photoionization Study of Post-Translational Modifications: The Case of Palmitoylation. Int. J. Mass Spectrom. 2012, 328–329, 23–27. [Google Scholar] [CrossRef]
  25. Ruiz, J.; García, C.; Del Carmen Díaz, M.; Cava, R.; Florencio Tejeda, J.; Ventanas, J. Dry Cured Iberian Ham Non-Volatile Components as Affected by the Length of the Curing Process. Food Res. Int. 1999, 32, 643–651. [Google Scholar] [CrossRef]
  26. Yamamoto, Y.; Yasuda, K.; Kodama, H. Measurement of Iminodipeptides in the Serum of Patients with Prolidase Deficiency Using Liquid Chromatography-Mass Spectrometry. Clin. Chem. Lab. Med. 1994, 32, 113–118. [Google Scholar] [CrossRef] [Green Version]
  27. Cristoni, S.; Bernardi, L.R.; Biunno, I.; Guidugli, F. Analysis of Peptides Using Partial (No Discharge) Atmospheric Pressure Chemical Ionization Conditions with Ion Trap Mass Spectrometry. Rapid Commun. Mass Spectrom. 2002, 16, 1686–1691. [Google Scholar] [CrossRef] [PubMed]
  28. Desai, M.J.; Armstrong, D.W. Analysis of Native Amino Acid and Peptide Enantiomers by High-Performance Liquid Chromatography/Atmospheric Pressure Chemical Ionization Mass Spectrometry. J. Mass Spectrom. 2004, 39, 177–187. [Google Scholar] [CrossRef]
  29. Shen, Y.; Han, C.; Chen, J.; Wang, X. Analysis of Cyclic Peptides in Pseudostellaria Heterophylla (Miq.) Pax by HPLC-APCI-MS. Chromatographia 2007, 66, 319–323. [Google Scholar] [CrossRef]
  30. Han, H.; Xia, Y.; Yang, M.; McLuckey, S.A. Rapidly Alternating Transmission Mode Electron-Transfer Dissociation and Collisional Activation for the Characterization of Polypeptide Ions. Anal. Chem. 2008, 80, 3492–3497. [Google Scholar] [CrossRef] [Green Version]
  31. McLuckey, S.A.; Han, H.; Xia, Y. Method and Apparatus for Collisional Activation of Polypeptide Ions. U.S. Patent Application No. 7,829,851, 9 November 2008. [Google Scholar]
  32. Wei, Y.; Bian, C.; Ouyang, Z.; Xu, W. A Pulsed Pinhole Atmospheric Pressure Interface for Simplified Mass Spectrometry Instrumentation with Enhanced Sensitivity. Rapid Commun. Mass Spectrom. 2015, 29, 701–706. [Google Scholar] [CrossRef]
  33. Bose, U.; Hodson, M.; Shaw, P.; Fuerst, J.; Hewavitharana, A. Two Peptides, Cycloaspeptide A and Nazumamide A from a Sponge Associated Marine Actinobacterium salinispora Sp. Nat. Prod. Commun. 2014, 9, 545–546. [Google Scholar] [CrossRef] [Green Version]
  34. Bagag, A.; Giuliani, A.; Laprévote, O. Atmospheric Pressure Photoionization of Peptides. Int. J. Mass Spectrom. 2011, 299, 1–4. [Google Scholar] [CrossRef]
  35. Delobel, A.; Halgand, F.; Laffranchise-Gosse, B.; Snijders, H.; Laprévote, O. Characterization of Hydrophobic Peptides by Atmospheric Pressure Photoionization-Mass Spectrometry and Tandem Mass Spectrometry. Anal. Chem. 2003, 75, 5961–5968. [Google Scholar] [CrossRef]
  36. Debois, A.D.; Giuliani, A.; Laprévote, O. Fragmentation Induced in Atmospheric Pressure Photoionization of Peptides. J. Mass Spectrom. 2006, 41, 1554–1560. [Google Scholar] [CrossRef] [PubMed]
  37. Ross, M.S.; Wong, C.S. Comparison of Electrospray Ionization, Atmospheric Pressure Photoionization, and Anion Attachment Atmospheric Pressure Photoionization for the Analysis of Hexabromocyclododecane Enantiomers in Environmental Samples. J. Chromatogr. A 2010, 1217, 7855–7863. [Google Scholar] [CrossRef]
  38. Robb, D.B.; Rogalski, J.C.; Kast, J.; Blades, M.W. A New Ion Source and Procedures for Atmospheric Pressure-Electron Capture Dissociation of Peptides. J. Am. Soc. Mass Spectrom. 2011, 22, 1699–1706. [Google Scholar] [CrossRef] [PubMed] [Green Version]
  39. McLuckey, S.A.; Liang, X.; Xiu, Y. Method and Apparatus for Transmission Mode Ion/Ion Dissociation. U.S. Patent Application No. 11/998,306, 25 April 2008. [Google Scholar]
  40. Méjean, M.; Giuliani, A.; Brunelle, A.; Touboul, D. Exploring the Peptide Fragmentation Mechanisms under Atmospheric Pressure Photoionization Using Tunable VUV Synchrotron Radiation. Int. J. Mass Spectrom. 2015, 379, 80–86. [Google Scholar] [CrossRef]
  41. Hockaday, W.C.; Purcell, J.M.; Marshall, A.G.; Baldock, J.A.; Hatcher, P.G. Electrospray and Photoionization Mass Spectrometry for the Characterization of Organic Matter in Natural Waters: A Qualitative Assessment. Limnol. Oceanogr. Methods 2009, 7, 81–95. [Google Scholar] [CrossRef] [Green Version]
  42. Robb, D.B.; Blades, M.W. An Electropneumatic-Heated Nebulizer for Enhancing Spray Ionization in PhotoSpray Atmospheric Pressure Photoionization Sources for Liquid Chromatography/Mass Spectrometry. Rapid Commun. Mass Spectrom. 2009, 23, 3394–3400. [Google Scholar] [CrossRef]
  43. Taylor, L.C.E.; Johnson, R.L.; Raso, R. Open Access Atmospheric Pressure Chemical Ionization Mass Spectrometry for Routine Sample Analyses. J. Am. Soc. Mass Spectrom. 1995, 6, 387–393. [Google Scholar] [CrossRef] [Green Version]
  44. Horning, E.C.; Horning, M.G.; Carroll, D.I.; Dzidic, I.; Stillwell, R.N. New Picogram Detection System Based on a Mass Spectrometer with an External Ionization Source at Atmospheric Pressure. Anal. Chem. 1973, 45, 936–943. [Google Scholar] [CrossRef]
  45. Robb, D.B.; Covey, T.R.; Bruins, A.P. Atmospheric Pressure Photoionization: An Ionization Method for Liquid Chromatography-Mass Spectrometry. Anal. Chem. 2000, 72, 3653–3659. [Google Scholar] [CrossRef] [PubMed]
  46. Zhou, W.; Yang, S.; Wang, P.G. Matrix Effects and Application of Matrix Effect Factor. Bioanalysis 2017, 9, 1839–1844. [Google Scholar] [CrossRef] [PubMed] [Green Version]
  47. Liang, X.; Xia, Y.; McLuckey, S.A. Alternately Pulsed Nanoelectrospray Ionization/Atmospheric Pressure Chemical Ionization for Ion/Ion Reactions in an Electrodynamic Ion Trap. Anal. Chem. 2006, 78, 3208–3212. [Google Scholar] [CrossRef] [Green Version]
  48. Syrstad, E.A.; Tureček, F. Toward a General Mechanism of Electron Capture Dissociation. J. Am. Soc. Mass Spectrom. 2005, 16, 208–224. [Google Scholar] [CrossRef] [PubMed] [Green Version]
  49. Sawicka, A.; Skurski, P.; Hudgins, R.R.; Simons, J. Model Calculations Relevant to Disulfide Bond Cleavage via Electron Capture Influenced by Positively Charged Groups. J. Phys. Chem. B 2003, 107, 13505–13511. [Google Scholar] [CrossRef] [Green Version]
  50. Zubarev, R.A.; Kruger, N.A.; Fridriksson, E.K.; Lewis, M.A.; Horn, D.M.; Carpenter, B.K.; McLafferty, F.W. Electron Capture Dissociation of Gaseous Multiply-Charged Proteins Is Favored at Disulfide Bonds and Other Sites of High Hydrogen Atom Affinity. J. Am. Chem. Soc. 1999, 121, 2857–2862. [Google Scholar] [CrossRef]
  51. Giuliani, A.; Giorgetta, J.L.; Ricaud, J.P.; Jamme, F.; Rouam, V.; Wien, F.; Laprévote, O.; Réfrégiers, M. Atmospheric Pressure Photoionization Using Tunable VUV Synchrotron Radiation. Nucl. Instrum. Methods Phys. Res. Sect. B Beam Interact. Mater. Atoms 2012, 279, 114–117. [Google Scholar] [CrossRef]
  52. Tsiatsiani, L.; Heck, A.J.R. Proteomics beyond Trypsin. FEBS J. 2015, 282, 2612–2626. [Google Scholar] [CrossRef]
  53. Giansanti, P.; Tsiatsiani, L.; Low, T.Y.; Heck, A.J.R. Six Alternative Proteases for Mass Spectrometry-Based Proteomics beyond Trypsin. Nat. Protoc. 2016, 11, 993–1006. [Google Scholar] [CrossRef]
  54. Erde, J.; Loo, R.R.O.; Loo, J.A. Improving Proteome Coverage and Sample Recovery with Enhanced FASP (EFASP) for Quantitative Proteomic Experiments. Methods Mol. Biol. 2017, 1550, 11–18. [Google Scholar] [CrossRef]
  55. Vrkoslav, V.; Muck, A.; Brown, J.M.; Hubálek, M.; Cvačka, J. The Matrix-Assisted Laser Desorption/Ionisation in-Source Decay of Peptides Using Ion Mobility Enabled Quadrupole-Time-of-Flight Mass Spectrometry. Rapid Commun. Mass Spectrom. 2018, 32, 2099–2105. [Google Scholar] [CrossRef] [PubMed]
  56. Thompson, M.S.; Cui, W.; Reilly, J.P. Fragmentation of Singly Charged Peptide Ions by Photodissociation at λ = 157 Nm. Angew. Chem.-Int. Ed. 2004, 43, 4791–4794. [Google Scholar] [CrossRef]
  57. Yuan, M.; Namikoshi, M.; Otsuki, A.; Watanabe, M.F.; Rinehart, K.L. Electrospray Ionization Mass Spectrometric Analysis of Microcystins, Cyclic Heptapeptide Hepatotoxins: Modulation of Charge States and [M + H]+ to [M + Na]+ Ratio. J. Am. Soc. Mass Spectrom. 1999, 10, 1138–1151. [Google Scholar] [CrossRef] [Green Version]
  58. Wang, G.; Cole, R.B. Mechanistic Interpretation of the Dependence of Charge State Distributions on Analyte Concentrations in Electrospray Ionization Mass Spectrometry. Anal. Chem. 1995, 67, 2892–2900. [Google Scholar] [CrossRef]
  59. Schaberg, A.; Wroblowski, R.; Goertz, R. Comparative Study of the Thermal Decomposition Behaviour of Different Amino Acids and Peptides. J. Phys. Conf. Ser. 2018, 1107, 032013. [Google Scholar] [CrossRef]
  60. Basile, F.; Zhang, S.; Kandar, S.K.; Lu, L. Mass Spectrometry Characterization of the Thermal Decomposition/Digestion (TDD) at Cysteine in Peptides and Proteins in the Condensed Phase. J. Am. Soc. Mass Spectrom. 2011, 22, 1926–1940. [Google Scholar] [CrossRef] [Green Version]
  61. Raffaelli, A.; Saba, A. Atmospheric Pressure Photoionization Mass Spectrometry. Mass Spectrom. Rev. 2003, 22, 318–331. [Google Scholar] [CrossRef]
  62. Gronert, S.; Simpson, D.C.; Conner, K.M. A Reevaluation of Computed Proton Affinities for the Common α-Amino Acids. J. Am. Soc. Mass Spectrom. 2009, 20, 2116–2123. [Google Scholar] [CrossRef] [Green Version]
  63. Robb, D.B.; Blades, M.W. State-of-the-Art in Atmospheric Pressure Photoionization for LC/MS. Anal. Chim. Acta 2008, 627, 34–49. [Google Scholar] [CrossRef]
  64. Wilm, M.; Shevchenko, A.; Houthaeve, T.; Breit, S.; Schweigerer, L.; Fotsis, T.; Mann, M. Femtomole Sequencing of Proteins from Polyacrylamide Gels by Nano-Electrospray Mass Spectrometry. Nature 1996, 379, 466–469. [Google Scholar] [CrossRef]
  65. Oosterkamp, A.J.; Gelpí, E.; Abian, J. Quantitative Peptide Bioanalysis Using Column-Switching Nano Liquid Chromatography/Mass Spectrometry. J. Mass Spectrom. 1998, 33, 976–983. [Google Scholar] [CrossRef]
  66. Emmett, M.R.; Caprioli, R.M. Micro-Electrospray Mass Spectrometry: Ultra-High-Sensitivity Analysis of Peptides and Proteins. J. Am. Soc. Mass Spectrom. 1994, 5, 605–613. [Google Scholar] [CrossRef] [Green Version]
  67. Kruve, A.; Haapala, M.; Saarela, V.; Franssila, S.; Kostiainen, R.; Kotiaho, T.; Ketola, R.A. Feasibility of Capillary Liquid Chromatography-Microchip-Atmospheric Pressure Photoionization-Mass Spectrometry for Pesticide Analysis in Tomato. Anal. Chim. Acta 2011, 696, 77–83. [Google Scholar] [CrossRef] [PubMed]
  68. Östman, P.; Marttila, S.J.; Kotiaho, T.; Franssila, S.; Kostiainen, R. Microchip Atmospheric Pressure Chemical Ionization Source for Mass Spectrometry. Anal. Chem. 2004, 76, 6659–6664. [Google Scholar] [CrossRef]
  69. Saarela, V.; Haapala, M.; Kostiainen, R.; Kotiaho, T.; Franssila, S. Glass Microfabricated Nebulizer Chip for Mass Spectrometry. Lab Chip 2007, 7, 644–646. [Google Scholar] [CrossRef]
  70. Kauppila, T.J.; Östman, P.; Marttila, S.; Ketola, R.A.; Kotiaho, T.; Franssila, S.; Kostiainen, R. Atmospheric Pressure Photoionization-Mass Spectrometry with a Microchip Heated Nebulizer. Anal. Chem. 2004, 76, 6797–6801. [Google Scholar] [CrossRef]
  71. Strmeň, T.; Vrkoslav, V.; Pačes, O.; Cvačka, J. Evaluation of an Ion Source with a Tubular Nebulizer for Microflow Atmospheric Pressure Chemical Ionization. Mon. Chem. 2018, 149, 987–994. [Google Scholar] [CrossRef]
  72. Vrkoslav, V.; Rumlová, B.; Strmeň, T.; Nekvasilová, P.; Šulc, M.; Cvačka, J. Applicability of Low-Flow Atmospheric Pressure Chemical Ionization and Photoionization Mass Spectrometry with a Microfabricated Nebulizer for Neutral Lipids. Rapid Commun. Mass Spectrom. 2018, 32, 639–648. [Google Scholar] [CrossRef]
  73. Tan, A.; Fanaras, J.C. Use of High-PH (Basic/Alkaline) Mobile Phases for LC–MS or LC–MS/MS Bioanalysis. Biomed. Chromatogr. 2019, 33, e4409. [Google Scholar] [CrossRef] [Green Version]
  74. Kostiainen, R.; Kauppila, T.J. Effect of Eluent on the Ionization Process in Liquid Chromatography-Mass Spectrometry. J. Chromatogr. A 2009, 1216, 685–699. [Google Scholar] [CrossRef]
Figure 1. Full scan mass spectra of AEFVEVTF ionized by (a) atmospheric-pressure chemical ionization (APCI), (b) atmospheric-pressure photoionization (APPI), and (c) electrospray ionization (ESI) recorded in methanol/water (80:20 v/v).
Separations 09 00042 g001
Figure 2. Effect of the probe temperature on the averaged relative intensities of [M + H]+ calculated for all 20 peptide standards in APCI and APPI. The error bars represent the standard errors of the mean.
Separations 09 00042 g002
Figure 3. Effect of the probe temperature in APPI on the relative intensity of LAF, VLASSAF, and AEFVEVTF. The values are normalized to the highest intensity of the protonated molecule ([M + H]+) in the respective peptide.
Separations 09 00042 g003
Figure 4. Effect of the probe temperature on the relative abundances of major ions in (a) APCI and (b) APPI full scan mass spectra of AEFVEVTF. Data obtained by flow injection analysis (FIA) using methanol/water (80:20 v/v) mobile phase.
Separations 09 00042 g004
Figure 5. Effect of the probe temperature on the relative abundances of major ions in (a) APCI and (b) APPI full scan mass spectra of QTALVELLK. Data obtained by FIA using methanol/water (80:20 v/v) mobile phase.
Separations 09 00042 g005
Figure 6. Normalized values of signal-to-noise ratio (S/N) for [M + H]+ of peptide standards in the acidic (35 μmol·L−1 CH3COOH pH 3.8), neutral (water) and basic (35 μmol·L−1 NH4OH pH 10.5) mobile phases. (a) APCI and (b) APPI.
Separations 09 00042 g006
Figure 7. Sensitivities of peptide standards shown in positive logarithmic scale for ESI, APCI, APPI, and dopant APPI. Data were obtained by FIA using methanol/water (80:20 v/v) mobile phase, flow rate 400 μL·min−1. The error bars represent the standard errors of the mean.
Separations 09 00042 g007
Figure 8. Detection limits of peptide standards are shown in the negative logarithmic scale for ESI, APCI, APPI, and dopant APPI. Data were obtained by FIA using methanol/water (80:20 v/v) mobile phase, flow rate 400 μL·min−1. The error bars represent the standard errors of the mean.
Separations 09 00042 g008
Figure 9. Venn’s diagram shows the number of peptides detected by ESI, APCI, APPI in bovine serum albumin (BSA) digests (10 μL injected; c = 0.65 mmol·L−1) obtained by (a) trypsin, (b) chymotrypsin, or (c) Glu-C cleavage of the protein. The peptides were separated at 60 °C by a 25 min gradient elution; the mobile phase flow rate was 250 μL·min−1. Data were evaluated using Amanda and Sequest engines.
Separations 09 00042 g009
Table 1. Limits of detection for peptide standards in atmospheric-pressure chemical ionization (APCI), atmospheric-pressure photoionization (APPI), and electrospray ionization (ESI). The values in pmol ± standard error of the mean (SEM) were obtained by flow injection analysis (FIA) using methanol/water (80:20 v/v) mobile phase, flow rate 400 μL·min−1. The injection volume was 2.5 μL.
PeptideAPCIAPPIAPPI Dopant 1ESI
LOD [pmol]LOD [pmol]LOD [pmol]LOD [pmol]
LAE4.8 ± 0.67.5 ± 1.46.8 ± 0.11.4 ± 0.1
SLGE17.6 ± 0.925.4 ± 3.730.0 ± 2.11.8 ± 0.4
VASLE3.0 ± 0.17.2 ± 0.47.6 ± 1.70.4 ± 0.0
AWSVAE19.3 ± 3.41.5 ± 0.22.3 ± 0.22.4 ± 0.2
VLASSAE45.0 ± 4.41.2 ± 0.12.2 ± 0.10.6 ± 0.1
AEFVEVTE8.1 ± 0.74.5 ± 0.019.2 ± 3.11.3 ± 0.0
QTALVELLE3.4 ± 2.82.2 ± 0.21.9 ± 0.14.4 ± 0.3
LAF11.9 ± 2.79.7 ± 1.04.6 ± 0.30.5 ± 0.1
SLGF13.8 ± 0.313.6 ± 3.216.8 ± 0.30.9 ± 0.0
VASLF6.8 ± 0.31.6 ± 0.010.4 ± 0.415.6 ± 0.0
AWSVAF1.8 ± 0.62.8 ± 0.06.0 ± 0.10.8 ± 0.2
VLASSAF2.4 ± 0.11.7 ± 0.02.0 ± 0.40.6 ± 0.3
AEFVEVTF12.5 ± 1.910.1 ± 1.13.3 ± 0.46.4 ± 0.4
QTALVELLF2.9 ± 0.95.3 ± 0.15.1 ± 0.31.9 ± 0.0
SLGK6.4 ± 0.84.3 ± 0.017.4 ± 4.30.7 ± 0.0
VASLR6.9 ± 0.32.2 ± 0.118.4 ± 3.90.1 ± 0.0
AWSVAR1.7 ± 0.16.7 ± 0.324.7 ± 8.00.6 ± 0.0
VLASSAR7.7 ± 0.11.2 ± 0.01.8 ± 0.10.2 ± 0.0
AEFVEVTK4.0 ± 0.31.8 ± 0.12.4 ± 0.00.5 ± 0.2
QTALVELLK3.5 ± 0.14.5 ± 0.50.9 ± 0.11.1 ± 0.0
1 The mobile phase contained 7% of acetone.
Table 2. Bovine serum albumin (BSA) sequence coverage values for tryptic digest (10 μL injected; c = 0.65 mmol·L−1) analyzed by APCI, APPI, or ESI using various mobile phases. The peptides were separated at 40 °C by a 25 min gradient elution; the mobile phase flow rate was 225 μL·min−1. Data were evaluated using Amanda and Sequest engines.
Mobile PhaseSequence Coverage [%]
APCIAPPI//Dopant APPI 1ESI
ACN (0.1% FA)/H2O (0.1% FA)//+acetone738//1065
MeOH (0.1% FA)/H2O (0.1% FA)//+acetone1537//1066
ACN/H2O//+acetone1743//1462
MeOH/H2O//+acetone2541//1863
ACN/10 mmol·L−1 CH3COONH4 in H2O, adjusted pH = 9 (NH4OH)//+acetone- 252//3964
MeOH/10 mmol·L−1 CH3COONH4 in H2O, adjusted pH = 9 (NH4OH)13- 366
ACN/H2O adjusted pH = 9 (NH4OH)//+acetone1457//3668
MeOH/H2O adjusted pH = 9 (NH4OH)21- 368
ACN/10 mmol·L−1 CH3COONH4 in H2O//+acetone- 244//2165
MeOH/10 mmol·L−1 CH3COONH4 in H2O13- 368
1 The mobile phase contained 7% of acetone. 2 In APCI, buffered mobile phases with acetonitrile were not tested because methanol phases worked better. 3 In APPI, buffered mobile phases with methanol were not tested because acetonitrile phases worked better.
Table 3. BSA sequence coverage values for tryptic, chymotryptic, and Glu-C digests (10 μL injected; c = 0.65 mmol·L−1) analyzed by APCI, APPI, or ESI using optimized mobile phases. The peptides were separated at 60 °C by a 25-min gradient elution; the mobile phase flow rate was 250 μL·min−1. Data were evaluated using Amanda and Sequest engines.
Mobile PhaseIon SourceProteaseSequence Coverage [%]
MeOH/H2OAPCItrypsin27
chymotrypsin18
Glu-C22
ACN/H2O adjusted pH = 9 (NH4OH)APPItrypsin46
chymotrypsin
Glu-C
23
48
ACN (0.1% FA)/H2O (0.1% FA)ESItrypsin70
chymotrypsin
Glu-C
36
35
Publisher’s Note: MDPI stays neutral with regard to jurisdictional claims in published maps and institutional affiliations.

