Abstract
The main objective of this article is to determine the existing linear correlation between the real left ventricular volume (RV) from the heart of bovines and the volumes obtained by Teichholz’s mathematical model and the volume of the truncated prolate spheroid (TPS) to identify which model has a higher proximity to the RV. For that, ten silicon rubber molds of the left ventricle (LV) were manufactured, and their real volumes were obtained through Archimedes’ principle, and their linear dimensions were also obtained. These dimensions were used to feed Teichholz’s and the TPS models. It was verified that, for ventricles of lower volume, the models showed relatively close results, and Teichholz’s model was the most accurate one. The TPS method shows a grave accuracy mistake for higher volume ventricles. Besides, both methods showed strong linear correlations with the RV, and both with high significance.
1. Introduction
The Left Ventricular Volume (LVV) is an extremely important heart parameter for the diagnosis of heart diseases, such as hypertension, heart failure, and dilated myocardiopathy [1,2,3,4,5].
Research related to LVV began a long time ago and one of the main works in this sense was presented by Teichholz et al. [6]. In that work, the LV is considered to have the geometry of a revolution ellipsoid and a mathematical model is determined that allows a good approximation of the LVV. This model is given by Equation (1), where d is the diastolic diameter of the LV.
Teichholz’s model has the limitation of loss of accuracy when applied to hearts with some types of heart pathologies and is no longer recommended for clinical use or with considerable amount of noise [7,8,9]. However, this model is still widely used, especially in Brazil [10,11].
Another method, considered to be the most efficient for the calculation of the LVV is Simpson’s rule (Figure 1), where it is considered that the LV has a circular geometry in the transversal cuts, that is, in the perpendicular cuts to its long axis [3,12,13,14,15,16]. This rule calculates the sum of the volumes of the N parallel slices from the apex to the base of the LV, where is the radius of each one, and L is the measurement of this chamber’a long axis, as described by Equation (2).
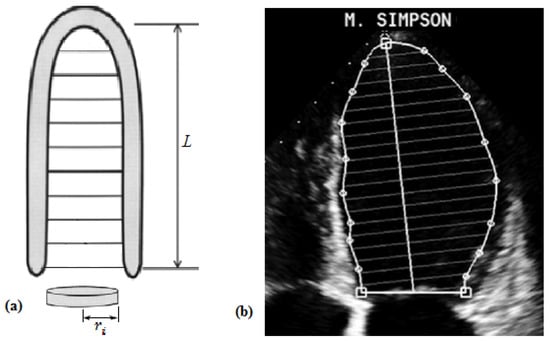
Figure 1.
Schematic representation of Simpson’s model (a) and its aspect during the exam (b). Adaptations from Silva et al. [16] and Ramires et al. [17], respectively.
However, if the quality of the image is reduced, or if there are changes in the angle of the transducer, although small, it is hard to accurately define the limits of the LV, reducing the calculated volume [18].
To facilitate the detection of the LV edges, Andrade et al. [19] showed a hybrid image segmentation algorithm through bidimensional echocardiography, which, among other techniques, uses mathematical morphology procedures to identify and extract the edges of this chamber, enabling the collection of clinical parameters used on the diagnosis of many heart pathologies. Based on this research, Melo et al. [20] proposed an improved semi-automatic algorithm for the detection of the LV edges, which builds the variation curve of the left ventricular area throughout a full heart cycle. Each of these methods can be combined with the values obtained for the LVV to improve the determination of the degree of compromise of the functional heart anatomy. However, both depend on human intervention to indicate the position of the mitral valve.
More recently, a new mathematical model to determine the area of the LV surface was published [21]. In this paper, the authors studied the linear correlation between this area and the LVV normalized by the body surface, collecting data from Brazilian patients without heart conditions. The results show a strong correlation between these two parameters.
Due to the shape of the outline of the LV shown in Figure 1b, many of the mathematical models to determine the LVV are based on a fixed geometry, such as the TPS geometry [3,21,22,23,24]. Therefore, it makes sense to study a model for the LVV considering the TPS, which is presented by Domingues [12] and Domingues et al. [21]. In this geometry, the TPS is modeled with larger and smaller semi-axes with measurements c and a, and with truncation point regarding its origin, as shown in Figure 2.
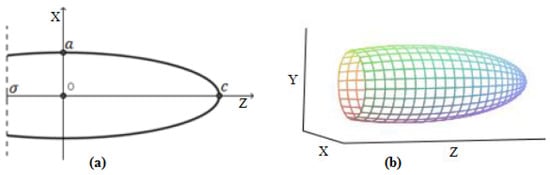
Figure 2.
The geometry of the TPS, considered to be similar to the LV’s anatomy.
The equation of the positive part of the truncated ellipsis curve in Figure 2a is:
Then, the volume of the TPS is expressed by
This work proposes to obtain the linear correlation between the RV of the bovine hearts and the volumes determined by the models of Equations (1) and (5). Both models consider a pre-defined geometry for the ventricle, which is why they were chosen. The choice of bovine hearts was based on the proposal of verifying the RV from the manufacturing of silicon molds. These molds allow the extraction of the exact geometry of the LV and, therefore, obtaining the actual volume. For the ten silicone molds made, it was concluded that the RV has a strong linear correlation with both models, in addition to high significance in both comparisons.
2. The Manufacturing of the Molds and Collection of Measurements
This research is still under development, and, thus far, ten molds were manufactured, using ten bovine hearts bought at a meat warehouse in the city of Formiga—MG, in Brazil. The hearts and their internal chambers were cleaned in running water, and the mitral valve of each one of them was sutured. For each mold, we prepared a mix where, for each 1000 g of M533-type silicon rubber, we used 100 g of T-35 silicon rubber catalyst. This mix was introduced into the LV through the aortic valve to fill this cavity completely. After 24 h, we opened the LV and removed the mold from the cavity (Figure 3). This preparation method was described by Bezerra [25].
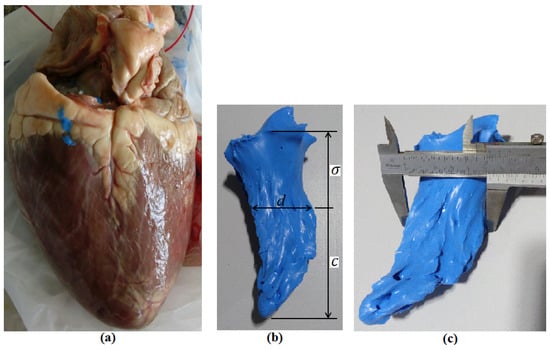
Figure 3.
(a) One of the hearts used to manufacture the molds; (b) one of the molds obtained, and the indication of the measurements taken; and (c) the measurement of the final diastolic diameter, obtained with a caliper, considering this measurement as the largest diameter obtained in the mold.
When considering that the LV geometry is similar to a TPS, its bigger axis, L, is given by , where c is the largest semi-axis of the TPS and is the truncating point of this geometric shape. The diastolic diameter, d, was considered as the largest diameter obtained in the LV mold, but the measurement of was taken from the meeting point between the perpendiculars of the mold’s long axis and the point of collection of the d measurement. Besides, according to the needs of the TPS model parameters, we also determined the measurement of the smaller semi-axis, . The collected measurements are shown in Table 1.

Table 1.
Measurements determined from the manufactured molds and which will be the considered data to feed the models.
In Table 1, the values for the RV are shown, obtained based on Archimedes’ principle, in which all molds were submerged in water in graduated recipients, and the volume of the displaced liquid was considered as the real volume (Figure 4).
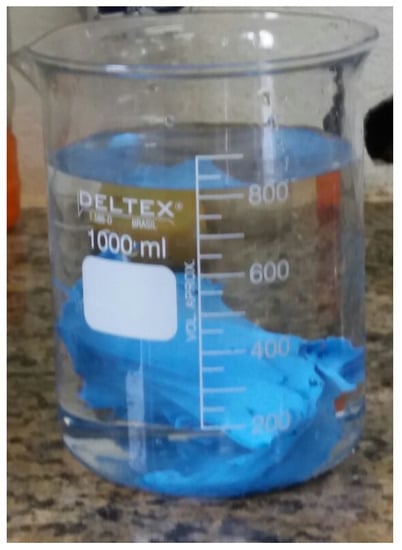
Figure 4.
Collection of the RV through Archimedes’ principle.
The values obtained from the manufactured molds and displayed in Table 1 were properly replaced in the equations for the Teichholz’s and TPS models to determine the approximate LVV.
3. Results and Discussions
The obtained results for the volumes of the molds based on the measurements shown in Table 1 and using Equations (1) and (5) are described in Table 2. The percent errors of each model, Teichholz and TPS, were also calculated when compared to the RV.
Table 2.
Results obtained for the LVV through the Teichholz and TPS models, and the respective errors when compared to the RV.
The biggest discrepancy between the RV and the mathematical models was noticed on the largest volume mold, and, especially, with the TPS model, where the percentage difference was of . This is because Teichholz’s model has a geometric correction factor which enables its use in cavities of many sizes [3,26].
Lang et al. [7] presented an average value for LVV of 136 mL, with a standard deviation of 29 mL. Thus, in this study, it is considered that the ventricles with the least volumes are those with RV mL mL. For those ventricles that meet this condition, the average percentage error by the Teichholz’s model is versus by the TPS model. For the ventricles with the highest volumes, the average percentage errors were and for Teichholz and TPS models, respectively.
We note that, even though Teichholz’s model is to be used only in human hearts, since it was made specifically for this and has never been validated for veterinary species [27], our results show that, for those bovine hearts with ventricular volumes close to human volumes, this model presents results with little percentage differences in relation to the real volumes.
The linear correlation obtained between and was and between the and the was , both very strong, and p values were, respectively, equal to and (Figure 5a,b), indicating high significance for Teichholz’s model.
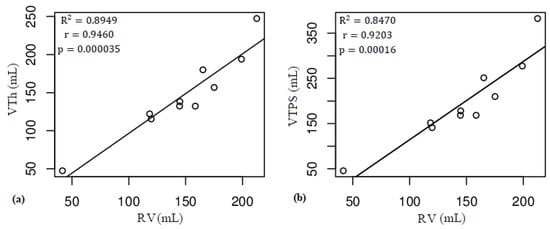
Figure 5.
Linear correlations obtained: between and (a); and between and (b).
4. Conclusions
The results obtained by Teichholz’s mathematical model are relatively close to the real volume calculated through Archimedes’ principle, for all considered molds. The TPS model has good approximations to the real volume when the analyzed ventricles have smaller volumes. This happens because this mathematical model does not show the geometric correction factor, which is present in Teichholz’s model. Besides, the linear correlations between any of the types of analysis are always very strong and with high significances, showing that one of the parameters can be estimated from the other with relative accuracy. Therefore, even without a direct clinical application, this research can illustrate that the consideration that the LV has an ellipsoidal geometry was of great importance for the advancement of cardiology, as, from this consideration, adjustments were made that enabled the use of Teichholz’s model, which is still used.
Author Contributions
Conceptualization, J.S.D.; Data curation, J.S.D., R.A.C., F.d.S.B., B.C.A. and A.O.d.C.; Formal analysis, J.S.D.; Investigation, J.S.D., R.A.C., F.d.S.B., B.C.A. and A.O.d.C.; Methodology, J.S.D.; Project administration, J.S.D.; Supervision, J.S.D.; Validation, J.S.D., R.A.C., F.d.S.B., B.C.A. and A.O.d.C.; Writing—original draft, J.S.D.; and Writing—review and editing, J.S.D., R.A.C., F.d.S.B., B.C.A. and A.O.d.C.
Acknowledgments
The authors thank IFMG—Campus Formiga for the financial aid granted by the scientific initiation scholarship program, PIBIC, and also by the voluntary scientific initiation program, PIVIC.
Conflicts of Interest
The authors declare no conflict of interest.
Abbreviations
The following abbreviations are used in this manuscript:
| TPS | Truncated prolate spheroid |
| LV | Left ventricle |
| LVV | Left ventricular volume |
| RV | real left ventricular volume |
References
- Galrinho, A.; Branco, L.M.; Soares, R.M.; Miranda, F.E.; Leal, A.; Ferreira, R.C. Volume da aurícula esquerda: Um velho cálculo ecocardiográfico com uma importância prognóstica renovada. Um estudo em doentes com miocardiopatia dilatada. Revista Portuguesa de Cardiologia 2009, 28, 1049–1060. (In Portuguese) [Google Scholar] [PubMed]
- Martins, E.; Silva-Cardoso, J.; Bicho, M.; Bourbon, M.; Ceia, F.; Rebocho, M.J.; Moura, B.; Fonseca, C.; Correia, M.J.; Brito, D.; et al. Study Portuguese in Dilated Myocardiopathies Family: The FATIMA Study. Rev. Port. Cardiol. 2008, 27, 1029–1042. [Google Scholar] [PubMed]
- Filho, P.R.P.F. Padrões de Hipertrofia e Geometria do Ventrículo Esquerdo pela Ecocardiografia Transtorácica. Revista Brasileira de Ecocardiografia e Imagem Cardiovascular 2012, 25, 103–115. (In Portuguese) [Google Scholar]
- Domingues, J.S.; Barbosa, M.P.; Vale, M.P. Mathematical and Computational Aspects in Partial Ventriculectomy. In Proceedings of the 8th International Conference on Advanced Computational Engineering and Experimenting, Paris, France, 30 June–3 July 2014. [Google Scholar]
- Domingues, J.S.; Vale, M.P.; Barbosa, M.P. Partial left ventriculectomy: Have well-succeeded cases and innovations in the procedure been observed in the last 10 years? Braz. J. Cardiovasc. Surg. 2015, 30, 579–585. [Google Scholar] [CrossRef] [PubMed]
- Teichholz, L.E.; Kreulen, T.; Herman, M.V.; Gorlin, R. Problems in Echocardiographic Volume Determinations: Echocardiographic-Angiographic Correlations in the Presence or Absence of Asynergy. Am. J. Cardiol. 1976, 37, 7–11. [Google Scholar] [CrossRef]
- Lang, R.M.; Badano, L.P.; Mor-Avi, V.; Afilalo, J.; Armstrong, A.; Ernande, L.; Flachskampf, F.A.; Foster, E.; Goldstein, S.A.; Kuznetsova, T.; et al. Recommendations for Cardiac Chamber Quantification by Echocardiography in Adults: An Update from the American Society of Echocardiography and the European Association of Cardiovascular Imaging. J. Am. Soc. Echocardiogr. 2015, 28, 1–39. [Google Scholar] [CrossRef] [PubMed]
- Wood, P.W.; Choy, J.B.; Nanda, N.C.; Becher, H. Left ventricular ejection fraction and volumes: It depends on the imaging method. Echocardiography 2014, 31, 87–100. [Google Scholar] [CrossRef] [PubMed]
- Chengode, S. Left ventricular global systolic function assessment by echocardiography. Ann. Card. Anaesth. 2016, 19, 26–34. [Google Scholar] [CrossRef] [PubMed]
- Costa, S.A. Fatores Prognósticos na Insuficiência Cardíaca Chagásica com Disfunção Ventricular Grave. Master’s Thesis, Health Sciences, Medical School, Federal University of Goiás, Goiânia, Brazil, 2016. Available online: http://repositorio.bc.ufg.br/tede/handle/tede/6083 (accessed on 10 September 2018).
- Andrade, M.F.A. Perfil Ecocardiográfico Convencional e por Strain em Pacientes com Mucopolissacaridose na Bahia-Brasil. Master’s Thesis, Institute of Health Sciences, Federal University of Bahia, Salvador, Brazil, 2016. Available online: http://repositorio.ufba.br/ri/handle/ri/22545 (accessed on 10 September 2018).
- Domingues, J.S. Modelagem Matemática da Ventriculectomia Parcial Esquerda e Determinação de Parâmetro Cardíaco do Ventrículo Esquerdo. Ph.D. Thesis, Mechanical Engineering, Federal University of Minas Gerais, Belo Horizonte, Brazil, 2017. Available online: http://www.bibliotecadigital.ufmg.br/dspace/handle/1843/BUBD-AN5NKP (accessed on 10 September 2018).
- Lopez, L.; Colan, S.D.; Frommelt, P.C.; Ensing, G.J.; Kendall, K.; Younoszai, A.K.; Lai, W.W. Recomendações para os métodos de quantificação durante a realização do ecocardiograma pediátrico: Relatório escrito pelo grupo da Sociedade Americana de Ecocardiografia e do Conselho em Cardiopatias Congênitas. Am. Soc. Echocardiogr. 2014. Available online: http://asecho.org/wordpress/wp-content/uploads/2014/01/PedQuantification-Portuguese-5.pdf (accessed on 10 September 2018).
- Otto, C.M. Fundamentos de Ecocardiografia Clínica, 5th ed.; Elsevier: Rio de Janeiro, Brazil, 2014. [Google Scholar]
- Marks, A.R. Cardiac function and circulatory control. In Goldman’s Cecil Medicine, 24th ed.; Goldman, L., Schafer, A.I., Eds.; Elsevier: Philadelphia, PA, USA, 2011; Volume 1. [Google Scholar]
- Da Silva, A.A.; da Silva, A.F.; Ferreira, C.B.N.D.; Botelho, E.S.L.; de Vasconcellos, H.D.; de Souza, K.M.; Fernandes, M.R.; Filho, M.F.S. Ecocardiograma Transesofágico Intraoperatório. In ETI Ecocardiografia Transesofágica no Intraoperatório; Bagatini, A., Pires, O.C., Filho, M.F.S., Ferreira, C.B.N.D., Eds.; Sociedade Brasileira de Anestesiologia: Rio de Janeiro, Brazil, 2013. [Google Scholar]
- Piveta, R.B.; Hajjar, L.A.; Osella, O.F.S.; Vieira, M.L.C.; Filho, R.K. Cardiomiopatia Pós-quimioterapia. Avanços Recentes e Perspectivas da Ecocardiografia nas Cardiopatias, 1st ed.; Ramires, J.A.F., Filho, R.K., Vieira, M.L.C., Eds.; Atheneu: Rio de Janeiro, Brazil, 2016. (In Portuguese) [Google Scholar]
- Zipes, D.P.; Libby, P.; Bonow, R.O.; Mann, D.L.; Tomaselli, G.F. Braunwald’s Heart Disease: A Textbook of Cardiovascular Medicine, 11th ed.; Elsevier: New York, NY, USA, 2018. [Google Scholar]
- De Andrade, M.M.; Espinoza, B.L.M.; de Oliveira Nascimento, F.A.; Rocha, A.; Vasconcelos, D.F.; de Jesus, P.; Carvalho, H.S. Hybrid algorithm for segmentation of the left ventricle in two-dimensional echocardiography. Revista Brasileira de Engenharia Biomedica 2006, 22, 23–33. [Google Scholar]
- Melo, S.A., Jr.; Macchiavello, B.; Andrade, M.M.; Carvalho, J.L.; Carvalho, H.S.; Vasconcelos, D.F.; Berger, P.A.; da Rocha, A.F.; Nascimento, F.A.O. Semi-automatic algorithm for construction of the LV area variation curve over a complete cardiac cycle. Biomed. Eng. Online 2010, 9, 5. [Google Scholar] [CrossRef] [PubMed]
- Domingues, J.S.; Vale, M.P.; Martinez, C.B. New mathematical model for the surface area of the left ventricle by the truncated prolate spheroid. Sci. World J. 2017, 2017, 6981515. [Google Scholar] [CrossRef] [PubMed]
- Baccani, B.; Domenichini, F.; Pedrizzetti, G. Model and influence of mitral valve opening during the left ventricular filling. J. Biomech. 2003, 36, 355–361. [Google Scholar] [CrossRef]
- Nielsen, P.M.F.; Le Grice, I.J.; Smaill, B.H.; Hunter, P.J. Mathematical model of geometry and fibrous structure of the heart. Am. J. Physiol. 1991, 260 Pt 2, H1365–H1378. [Google Scholar] [CrossRef]
- Katz, T.L.; Mattos, C.F.G.; Kowatsch, I.; Vieira, M.L. Critical Analysis of Echocardiographic Measurements of Left Ventricular Mass. Revista Brasileira de ecocardiografia e Imagem Cardiovascular 2010, 23, 95–100. [Google Scholar]
- Bezerra, S.J. Um Modelo Matemático Para o Cálculo do Volume Ventricular Esquerdo. Master’s Thesis, Applied Mathematics, UNICAMP, Campinas, Brazil, 1985. Available online: http://repositorio.unicamp.br/handle/REPOSIP/307328 (accessed on 10 September 2018).
- Martin, G.; Sutton, S.J.; Plappert, T. The Echocardiographers’ Guide; Informa Healthcare: London, UK, 2006; pp. 35–42. [Google Scholar]
- Brown, D.; Garber, J. Cardiac Size. Available online: http://www.vermontveterinarycardiology.com/index.php/for-cardiologists/for-cardiologists?id=136 (accessed on 10 September 2018).
© 2018 by the authors. Licensee MDPI, Basel, Switzerland. This article is an open access article distributed under the terms and conditions of the Creative Commons Attribution (CC BY) license (http://creativecommons.org/licenses/by/4.0/).