Review

Time-Resolved Fluorescence in Photodynamic Therapy

by
Shu-Chi Allison Yeh
1,
Michael S. Patterson
2,
Joseph E. Hayward
2 and
Qiyin Fang
1,3,*
1
School of Biomedical Engineering, McMaster University, 1280 Main Street West, Hamilton, ON L8S 4K1, Canada
2
Department of Medical Physics and Applied Radiation Sciences, McMaster University, 1280 Main Street West, Hamilton, ON L8S 4K1, Canada
3
Department of Engineering Physics, McMaster University, 1280 Main Street West, Hamilton, ON L8S 4K1, Canada
*
Author to whom correspondence should be addressed.
Photonics 2014, 1(4), 530-564; https://doi.org/10.3390/photonics1040530
Submission received: 4 November 2014 / Revised: 4 December 2014 / Accepted: 4 December 2014 / Published: 9 December 2014
(This article belongs to the Special Issue Biomedical Optics and Optical Imaging)

Abstract

:
Photodynamic therapy (PDT) has been used clinically for treating various diseases including malignant tumors. The main advantages of PDT over traditional cancer treatments are attributed to the localized effects of the photochemical reactions by selective illumination, which then generate reactive oxygen species and singlet oxygen molecules that lead to cell death. To date, over- or under-treatment still remains one of the major challenges in PDT due to the lack of robust real-time dose monitoring techniques. Time-resolved fluorescence (TRF) provides fluorescence lifetime profiles of the targeted fluorophores. It has been demonstrated that TRF offers supplementary information in drug-molecular interactions and cell responses compared to steady-state intensity acquisition. Moreover, fluorescence lifetime itself is independent of the light path; thus it overcomes the artifacts given by diffused light propagation and detection geometries. TRF in PDT is an emerging approach, and relevant studies to date are scattered. Therefore, this review mainly focuses on summarizing up-to-date TRF studies in PDT, and the effects of PDT dosimetric factors on the measured TRF parameters. From there, potential gaps for clinical translation are also discussed.

1. Introduction

Photodynamic therapy (PDT) has been applied in various clinical fields including dermatology [1], age-related macular degeneration [2], oncology [3], etc. In treatment of malignant lesions, it was first used for treating superficial bladder cancer [4], and subsequently approved for esophageal [5], lung [6], and high-grade dysplasia of Barrett’s Esophagus [7] by the use of the photosensitizer Photofrin®. Treating skin basal cell carcinomas with 5-aminolevulinic acid (5-ALA) administration has been shown to have high efficacy and was approved in Europe [5]. Other ongoing clinical trials include prostate [8], ovarian [9], and head/neck cancers [10,11]. The histories and principles of PDT were reviewed in detail by Dougherty [12], MacDonald [13], Brown [5], and Wilson [3].
Unlike traditional methods such as chemotherapy and radiotherapy, PDT allows a relatively higher degree of specificity by targeting malignant and pre-malignant cells. It is also preferred when surgical removal is considered risky in certain cases such as esophageal [14] and brain tumors [15,16]. The specificity of PDT is achieved by a two-fold process: the drug (i.e., photosensitizer, which will be used interchangeably here) is first “preferentially” retained in tumor cells due to higher metabolic activities and a leaky vasculature at the tumor sites [12]. In addition, preferentially treating malignant/tumor tissue over normal tissue can be achieved by selective illumination of the target tissue volume by light sources matching the absorption peak of the photosensitizer. PDT-induced cellular effect can be achieved through two pathways: (i) Drugs in their triplet excited state couple with ground stage oxygen molecules (Type II PDT) and produce cytotoxic singlet oxygen. Due to its short diffusion range, it ultimately leads to apoptotic cell death and reduces unwanted damage to normal tissue. There are different apoptosis pathways induced by PDT, including the activation of plasma membrane death receptors, mitochondria, lysosomes, and endoplasmic reticulum (ER), which are all potential photosensitizer binding sites. Photosensitizers binding to these subcellular organelles can trigger cascade reactions involving proteins regulating apoptosis (e.g., Bcl-2 family), release of cathepsins (binding to lysosomes) and Ca2+ (binding to ER). These apoptotic mechanisms are preferred to necrotic cell death, but it is subject to cell types, intracellular photosensitizer localization, overall dose, and oxygenation [17,18,19]. (ii) Free radicals such as hydroperoxides can also be generated when photosensitizers in their triplet state interact with biological substrates (Type I PDT). This involves a one-electron oxidation-reduction reaction that produces reactive oxygen species (ROS), and consequently causes necrotic damage in most cases [20]. Photochemical processes of PDT have been reviewed extensively in work from Oleinick et al. and Calzavara-Pinton et al. [17,21].

1.1. Limitation Factors in PDT Dosimetry

As implied by its working mechanism, the efficacy of PDT depends strongly on factors that directly manipulate drug-tissue interactions, including (i) local concentration of the photosensitizer, (ii) the amount of light it absorbs (fluence), and (iii) oxygenation status of the lesion [3]. The effective dosage is eventually altered by additional biological factors such as different drug uptake [22,23,24], various tissue optical properties [25], changes in vasculature and perfusion [26,27], and inconsistencies in tissue oxygenation [28], as well as unexpected photophysical and photochemical changes of photosensitizers [29,30,31]. The schematics of the three main dose factors are illustrated in Figure 1a, and the interdependencies of dose factors [32] are summarized in Table 1. These interdependencies yield a problem: an optimum dose cannot be provided based on the current clinical standards using prescribed drug and light doses. In other words, real-time monitoring of dose parameters to account for the interdependency of these factors may minimize the risks of collateral damage (overdose) and cancer recurrence (underdose). Systematic reviews of PDT dosimetry can be found in work by Wilson and Patterson [3,32].
Table 1. Interdependencies of dose factors.
Dose FactorsInterdependenciesResults
PhotosensitizerIndividual variabilityVariation in uptake, local location, and concentration;
Light fluenceLarge extinction coefficient leads to self-shielding from light
OxygenChemically deplete oxygen molecules
Light FluenceIndividual variabilityVariation in distribution
PhotosensitizersHigh fluence rate can photobleach photosensitizers
OxygenHigh fluence rate can deplete oxygen molecules [33]
OxygenIndividual variabilityVariation in vasculature, perfusion, and oxygen saturation
PhotosensitizerVariation in photobleaching rate
PDT treatmentPotential vasculature occlusion that reduces oxygen supply
As mentioned previously, local drug concentration is one of the major factors that affects treatment efficacy. Fluorescence emission of the photosensitizer has been considered as a good candidate to reflect local drug concentration in PDT [34,35], which may mitigate its dosimetric dilemma. These strategies include explicit dosimetric approaches that measure the main influencing factors independently [36]; implicit approaches, which take every interdependency into account and eventually model an indirect parameter (photobleaching) to reflect singlet oxygen production [29,37,38]; and direct dosimetry that measures the phosphorescence to reveal singlet oxygen concentration [39]. Descriptions and limitations of each technique are summarized in Table 2. Nonetheless, there still exists a major challenge in steady-state fluorescence measurement: the measured fluorescence intensity suffers from intensity artifacts due to heterogeneity of tissue optical properties, changes in local environment, unknown chromophores and photoproducts of the original photosensitizing agents with overlapped spectra, and detection geometry [35]. That is, although analytical models have been proposed to solve light propagation before entering the detector [25], the corrected steady-state signal may not be sufficient to represent drug–molecular interactions and tissue response. As a result, investigation of physiological (e.g., local environment) and photosensitizer changes (e.g., photoproduct formation) is still required to interpret local drug concentration and effectiveness.
Figure 1. (a) Schematics of PDT principles and the interdependencies between dose factors. The photosensitizers (PS) are pumped to an excited state (S1) by the light source (ϒ). The excited PS can return to the ground state via fluorescence emission (F) or the intersystem crossing pathway. With intersystem crossing, PS at the triplet excited state (T1) go through energy transfer with the ground state oxygen molecules (O2) and yield cytotoxic singlet oxygen (1O2). 1O2 eventually results in various treatment effects including apoptosis/necrosis and vasculature occlusion. During the PDT procedures, all of the following factors contribute to challenges in dosimetry, including the interdependencies of dose factors (as indicated in Table 1), dynamics in the PDT process (various rate constants, K), and heterogeneous tissue optical properties (µsa) that affect both light delivery (ϒ) and detection (D). (b) Steady-state fluorescence only measures a single time point during the decay dynamics (as indicated by the black arrow). Time-resolved fluorescence decay measures the temporal profiles that are sensitive to non-radiative energy transfer such as the changes in microenvironment and drug–molecular interactions (as indicated by τ1 and τ2).
Photonics 01 00530 g001
Table 2. Dosimetrics of PDT.
DosimetricMeasured ParametersLimitations
ExplicitMain dose factors: Photosensitizer concentration; light fluence; oxygen concentrationDifficult to acquire complete data set and require a model to combine all these for the effective dose; ignored all microdosimetric changes induced from interdependencies of dose factors (as listed in Table 1) [32]
ImplicitPhotobleachingNeed photosensitizers or a second reporter that can be photobleached; need to know the degree of photosensitizer coupling to cytotoxic photoproduct (e.g., 1O2); accurate modeling in tissue optics is required
DirectSinglet oxygen phosphorescence at 1270 nmLow SNR and technically difficult, e.g., requires photodetectors sensitive in the NIR region. Also, it does not account for effects from free radicals and other dose interdependencies [39,40]

1.2. The Potential Role of Time-Resolved Fluorescence (TRF) for PDT Dosimetry

Fluorescence lifetime (τ) can be defined as the average time a fluorophore remains in the excited state after excitation; in other words, lifetime is the time it takes for the number of excited molecules to decay to 1/e of the original population. The decay of the intensity as a function of time can be expressed as It = Ae−t/τ, where I is the intensity at time t, and A is the normalization term [41]. TRF parameters τ and A have been used to probe a range of biological phenomena [42,43,44] due to the following reason. The rate of de-excitation of the fluorophore depends on the total rate constant of both radiative (fluorescence) and non-radiative (i.e., energy transfer) processes, as illustrated in Figure 1a. In other words, the decay dynamics are sensitive to intermolecular interactions and changes of adjacent microenvironment, while relatively independent of the artifact existing in the steady-state measurements [42], as illustrated in Figure 1b. For example, photosensitizers can exhibit various degrees of toxicity when they bind to different intracellular organelles, or form aggregates and photoproducts. Nevertheless, these events yield similar emission spectra and cannot be detected using steady-state measurement. Therefore, additional contrast based on time-domain parameters may help distinguish these changes, and reveal the drug-molecular interactions for further correlation with treatment efficacy [31,45]. Note that TRF measurements of photosensitizers could be performed with the same wavelength used for treatment, providing convenience for treatment monitoring. In the following sections, the principles of time-domain fluorescence will be briefly summarized (Section 2), followed by a review of time-resolved fluorescence studies in PDT photosensitizers (Section 3) and a survey of its clinical challenges and feasibility in terms of instrumentation and data analysis (Section 4).

2. Principles of TRF Spectroscopy and Imaging

Time-resolved fluorescence spectroscopy (TRFS) is able to measure fluorescence decay profiles at each wavelength [41]. The time-domain parameters retrieved from each decay curve (as shown in Figure 1b) can be a combination of n exponential terms from various fluorescence species, expressed as:
F ( t ) =   i = 1 n A i * exp ( t τ i )
where F(t) is the fluorescence intensity at time t and Ai are normalized coefficients that denote the relative contributions of individual fluorescence lifetime components (τi). Non-linear least squares (NLLS) analysis is a widely used approach that estimates Ai and τi using multiple exponential approximation [46,47]. With individual parameters, the average lifetime (τ) can be calculated using fractional or amplitude-weighted approaches to represent the decay dynamics [41]. The challenges of using NLLS will be further discussed in Section 4.
Since changes of fluorescence lifetime are subject to non-radiative and emission processes that occur between 10−13 to 10−8 s, TRFS has been widely used in chemistry for liquid samples to probe a variety of phenomena such as solvent dynamics, polymer photophysics, molecular reorientation, etc. [48]. For biomedical applications, single-point spectroscopic analysis can be further extended to fluorescence lifetime imaging that measures the TRF parameters of each pixel with a point-scanning interface or wide-field detectors.
When measuring the TRF parameters of PDT photosensitizers in a complex microenvironment, time resolution and the measuring accuracy covering a broad range of decay times play key roles. For instance, most of the photosensitizers exhibit multiple exponential decay behavior with an average lifetime in the range of several nanoseconds [45]. The absorption-emission spectra of these photosensitizers also overlap with many intrinsic fluorophores (i.e., autofluorescence) with lifetimes ranging between hundreds of picoseconds to a few nanoseconds. Therefore, TRF measurement and analysis in this regime are challenging and only become feasible owing to advances in high-speed optoelectronics [49]. In this section, we briefly review two main approaches to measure TRF: time-domain and frequency domain techniques, followed by a discussion of their clinical feasibility. Detailed review of TRFS techniques and analysis were presented in references from Lakowicz [41] and Marcu [49].

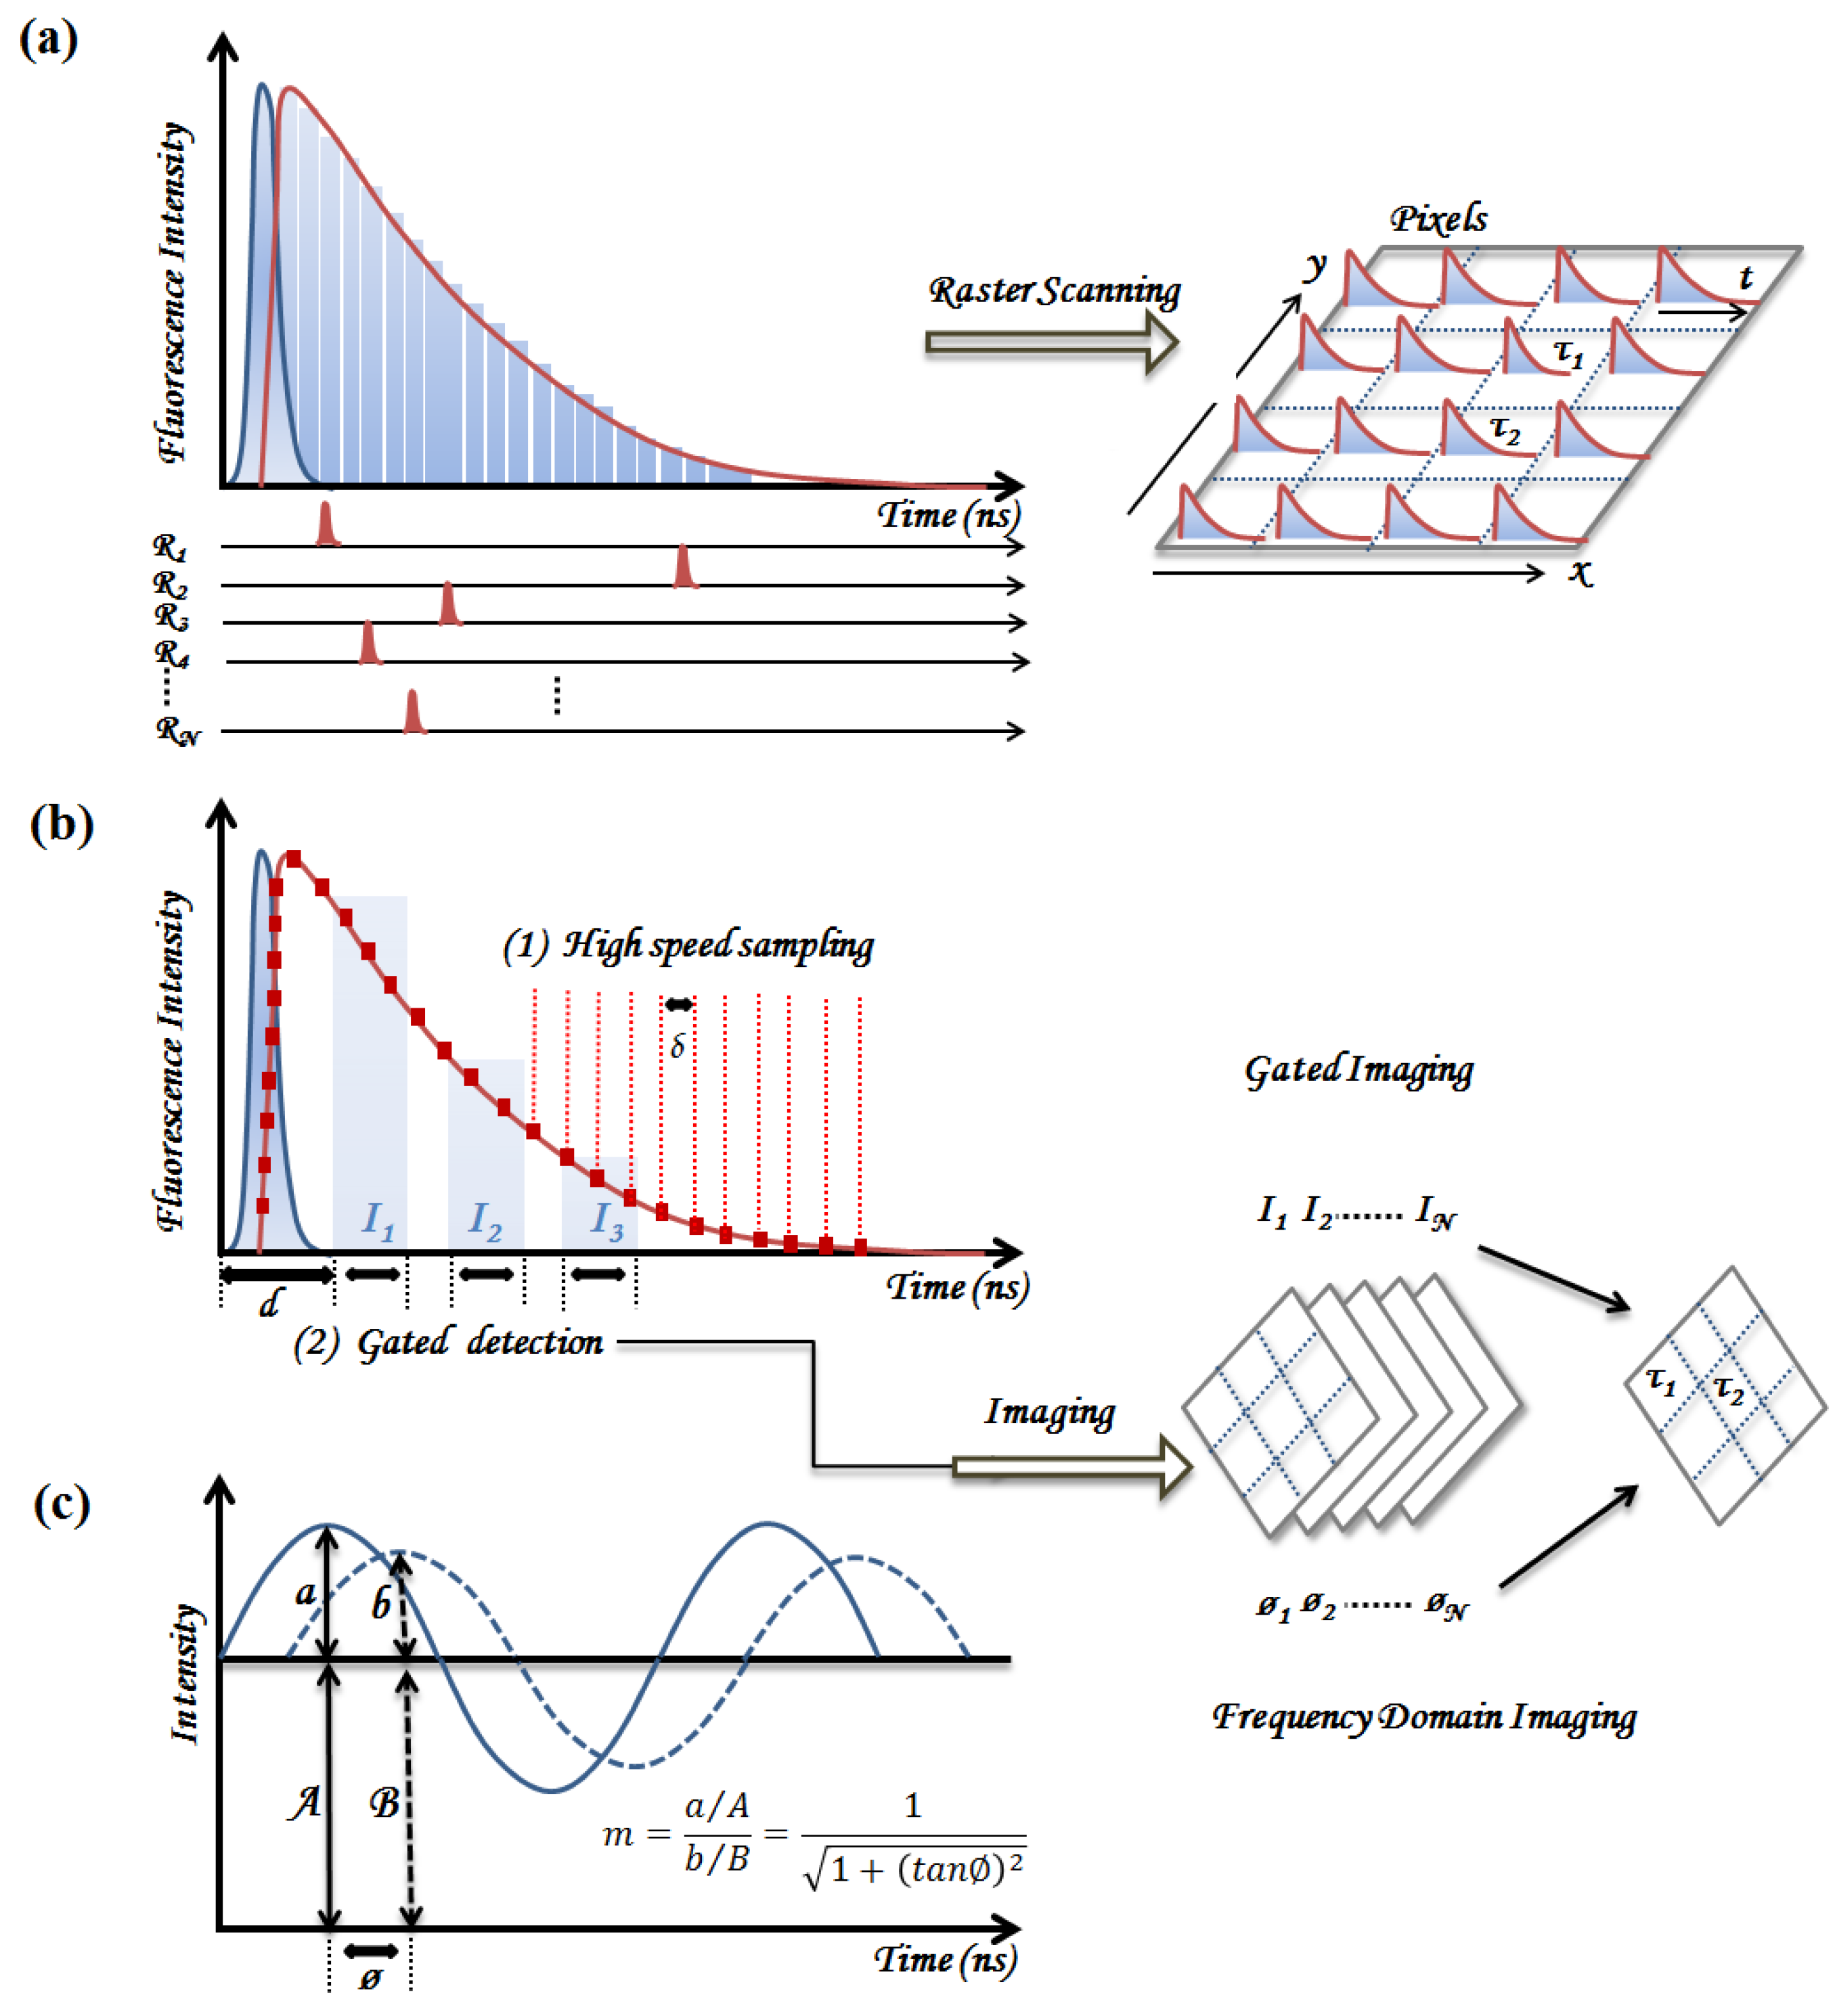
2.1. Time-Domain Fluorescence Spectroscopy and Imaging

In time-domain (TD) measurement, short pulsed lasers are used to enable the recording of the fluorescence emission decay in pulse sampling and time-correlated single photon counting.

2.1.1. Time-Correlated Single Photon Counting (TCSPC)

TCSPC is based on the detection of single photons after excitation by a pulsed source. A single photon is detected from an excitation pulse at random and the arrival time of each detected single photon relative to the excitation pulse is converted to voltage signals with a time resolution up to a few picoseconds. A probability histogram was then built from repetitive measurements of the arrival time of a detected single photon emission, as illustrated in Figure 2a [50]. TCSPC is a well-established technique with single photon sensitivity and high temporal resolution. It is also a relatively low cost option comparing to other time-resolved measurement techniques in the nanosecond to picosecond regime. However, in order to achieve good statistical accuracy while maintaining low detection rate (1%) to avoid pulse pile-up, there are trade-offs between data acquisition time, SNR and the measurement accuracy. Since only a single photon is detected for each pulse, TCSPC is not an efficient detection method that requires high repetition rate excitation sources, and the sample may suffer photobleaching. Nonetheless, TCSPC is the most widely used time-resolved fluorescence measurement technique.
TCSPC-FLIM (Fluorescence Lifetime Imaging Microscopy) can be achieved by the combination of TCSPC electronics and a scanning interface, as shown in Figure 2a. It is also possible to perform multi-spectral TCSPC imaging by simultaneously recording several spectral bands with the photo detector arrays and multi-channel counting electronics. One problem associated with multi-spectral imaging may be the trade-off between the number of pixels and the number of detector channels because of a limited memory space [50].
Figure 2. (a) The histogram built using TCSPC and the raster-scanning techniques used for fluorescence lifetime images. (b) Principles of high-speed sampling and time gated techniques. The fluorescence decay can be collected through different time gates (I1 to I3). In time-gated imaging technique, immediately after the excitation pulse, intensity information within several delays of gating pulse will attribute to a stack of intensity images (I1 to IN). Ultimately, for each pixel, the processed lifetime image can be constructed from the measured stack of fluorescence images. (c) Principles of frequency domain spectroscopy, where the fluorescence lifetime can be calculated based on the phase delay (ø) and the demodulation ratio, m. Fluorescence lifetime imaging can also be reconstructed using an ICCD with various phase delay (ø1, ø2… øN).
Photonics 01 00530 g002

2.1.2. Pulse Sampling Techniques

Fluorescence decay can also be measured using pulse sampling or time-gated techniques. In pulse sampling techniques, as shown in Figure 2b, the full decay profile after each pulse excitation is repetitively sampled by a photodetector (e.g., PMT or photodiode) followed by a digitizer. Since acquisition can be done with a single detector and digitizer pair, such measurements can be performed with good temporal and spectral resolution [41,49,51]. When the fluorophores exhibit high quantum yield, decay profiles from a single excitation pulse may be adequate for retrieving TRF parameters, which is considered one of the main advantages of the pulse sampling technique. The potential fast data acquisition (e.g., ns laser pulses) thus provides a unique advantage for clinical applications [51]. For example, flexible fiber probes can be coupled to endoscopy systems for clinical surveillance [52,53,54,55,56]. Multiple time-resolved spectra can either be acquired by sequentially scanning in the spectral domain (e.g., via a monochromator) [57] or using a multiple fiber delay arrangement [58]. Although this technique is more often used for single-point spectroscopy measurements, fluorescence lifetime imaging has also been reported recently [59,60].
Instead of sampling the full fluorescence decay, the time-gated technique only measures integrated fluorescence intensities in the gated window delayed by a different time relative to the excitation pulse. The whole fluorescence decay can be reconstructed by repeating the gated detection process. This is also a preferred FLIM (Figure 2b) technology in clinical application as faster data acquisition can be achieved using an intensified charge-coupled device (ICCD) [61]. In particular, fast two-gate detection scheme (also termed rapid lifetime determination) is an efficient method to estimate fluorescence lifetimes, which measures the ratio of the integrated intensities acquired in two time windows with equal width. Detailed descriptions may be found in work from Sharman and Agronskaia [62,63]. Due to the low frame rate of the ICCD, only a limited number of time-delayed windows can be used in this technique, hence limiting its application to rather simple decay profiles. In addition, the spatial resolution of this technique is limited by that of the ICCD.

2.2. Frequency Domain Fluorescence Spectroscopy

Frequency domain (FD) measurement utilizes a periodically modulated excitation source to obtain the phase shift (ø) between the emission and excitation waveforms, and the demodulation ratio represents the change in modulation depth of fluorescence signals with respect to the waveform of the exciting light [64], as illustrated in Figure 2c. Assuming a molecule with single exponential decay excited by the modulated source of an angular frequency, the estimation of fluorescence lifetime can be simply retrieved by the phase shift and demodulation ratio. These two parameters can be measured through a range of modulation frequency to resolve multiple exponential components [41]. FD-FLIM is usually implemented in wide-field techniques, but can also be used in the confocal scanning system [64]. Typically, the homodyne method is used, where the electronic gain of imaging intensifier is modulated at the same frequency as the excitation light. The coming fluorescence light with certain modulated frequency will mix with the modulated gain in the imaging intensifier to achieve phase shift and demodulation ratio at different locations. After acquiring a stack of steady-state phase images (ø1, ø2… øN) in which the detector phases are distributed between 0 and 2π, the lifetime can be measured for each pixel by extracting the demodulation ratio and the phase lag (Figure 2c).

2.3. Summary of Instrumentation Requirements for Clinical Implementation

As typical fluorescence lifetimes of organic fluorophores are around a few nanoseconds, lifetime changes caused by non-radiative energy transfer in hundreds of picoseconds are not trivial. Therefore, temporal resolution, fast acquisition, and accurate analysis are the main considerations in clinical settings. There are usually trade-offs in the selection of instrumentation. For example, TCPSC is capable of achieving time resolution down to tens of picoseconds, while the acquisition time is limited by detection efficiency. Time-gated or pulse sampling techniques are more desirable for clinical implementation due to their high data acquisition speed and the potential use of rapid lifetime determination (RLD) algorithms [63]. For example, pulse sampling and time-gated FLIM can rapidly acquire fluorescence decay in parallel. In addition, it is very efficient to reject unwanted background from short-lived fluorescence. This method is later used in time-domain endoscopic FLIM for real-time imaging acquisition [65]. However, higher fluence and fluorescence quantum yield are required to achieve sufficient signal-to-noise ratio (SNR). Their temporal resolution is also limited by the laser pulse shape, instrumental responses and the detection gate (i.e., down to ~100 ps) when compared to TCPSC. Table 3 summarized the advantages and limitations of TD technology. FD technique has less stringent requirements regarding electronics, light source (e.g., no ultrafast lasers), and computation (e.g., no deconvolution). In addition, time-domain yields certain artifacts while detecting fluorophores with its fluorescence decay longer than the inter-pulse duration; therefore, frequency domain method used to be a more feasible way to perform lifetime analysis of long-lived fluorophores. However, repetitive measurements using various modulation frequencies are usually necessary to encompass the multiple fluorescence lifetime components in tissue; thus the long data acquisition time limits its applications in clinical settings. Phasor representation for fast FD-FLIM analysis is now under investigation and has been shown to achieve good performance [66].
Table 3. Summary of time-domain techniques [49].
AdvantagesDisadvantages
TCSPC
High sensitivity and temporal resolution
Low systematic errors
Suitable for resolving complex decays
Easy implementation to existing scanning system
Low cost

Very slow data acquisition to achieve desired signal
Requires post-processing to correct distortions in long fluorescence lifetimes [67,68]
Cannot tolerate ambient light
Time-gated and pulse sampling
Capable of single-shot detection
Rapid data acquisition of fluorescence decays
Good for background subtraction
Immune to ambient lighting

Difficult to predict instrument noise
Low sensitivity so requires sufficient quantum yield
Time resolution is subject to the gate window
High instrumentation cost
General
Broad excitation spectra of short pulsed lasers
Can be operated at room light ( f *< 10 Hz )

Complex opto-electronic systems for detector and light sources compared to FD–FLIM
*f represents pulse repetition rate.

3. Applications of TRF on PDT Photosensitizers

In this section, we review previous TRF studies on PDT photosensitizers. PDT photosensitizers were known to go through multiple transitions after drug administration, which include photoproduct formation, self-aggregation, and compound formation through binding with adjacent molecules. These changes could greatly alter the PDT effect as they hinder the energy transfer between the excited-state photosensitizer and the adjacent oxygen molecules. However, steady-state fluorescence measurements alone are not sufficient to probe the above changes as these fluorescence species present significant spectral overlap [45,69]. Therefore, TRF measurements have become an attractive complementary tool to characterize these transitions and drug interactions with biological molecules. In vitro studies then offer a good platform to initiate the investigation in molecular perspectives. In vivo studies, however, are still quite limited due to the limitations in technology development (further discussed in Section 4); TRF measurements on endogenous fluorophores will also be discussed along with photosensitizers.

3.1. Time-Resolved Studies of PDT Photosensitizers in Solution and In Vitro

TRF studies relevant to different PDT photosensitizers have been reported by several research groups in the past decades [31,43,45,70,71,72,73,74,75,76]. FDA-approved PDT photosensitizers include Photofrin®, 5-aminolevulinic acid-induced protoporphyrin IX (ALA-PpIX), and verteporphyrin, Other photosensitizing agents in research stage, such as mTHPC (m-tetrahydroxyphenylchlorin, Foscan®), phthalocyanine (Pc) compounds, and chlorin-based compounds (i.e., HPPH), also showed promising results in terms of their singlet oxygen yield and more red-shifted absorption bands [77]. We summarized TRF measurements of photosensitizers in Table 4. In addition, the cellular environment is a more complex system when compared to bulk solutions. Other than the solvent effect, the distinct microenvironment of subcellular organelles (e.g., molecular binding) leads to various degrees of quenching effect on photosensitizers. Photosensitizers of various concentration and lipophilicity may result in self-aggregation, and the photodynamic process may generate a variety of photoproducts. Moreover, in an in vivo environment, a drastic change of oxygen level and abundant endogenous fluorophores also contribute to additional variations in TRF parameters. How these factors affect lifetime measurements of the photosensitizers will be further discussed.
Table 4. Summary of TRF studies of photosensitizers.
PS. Lifetimes (τ) / LocalizationPS. Conc. Ex. (nm) Em. (nm)
HpD/ Photofrin 14 ns (Organic solution) [43]5 µg/mL364 615
10 ns (Organic solution) [70] 0.06–6 µg/mL405 > 580
5.5 ns (Mitochondria, MLL) [70]10 µg/mL810600–750
13.3 ns (Monomer, mitochondria) [70] 10 µg/mL810 600–750
13.6 ns (Monomer, mitochondria) [45] 2 µg/mL398627–651
8.5 ns (Aggregates, mitochondria) [45]2 µg/mL398651–687
8.0 ns (Aggregates, mitochondria) [78]5 µg/mL514600–700
4.8 ns (Cell membrane) [78] 5 µg/mL514600–700
1.0 ns (Aggregates, mouse model) [31]20 mg/kg514630
13 ns (Monomers, mouse model) [31]20 mg/kg514630
PpIX16.4 ns (Organic solution) [70] ; 10 mM810600–750
6.3 ns (Averaged. mitochondria) [70] 10 mM810 600–750
7.5 ns (Averaged, mitochondria) [79]1 mM398610–640
2–4 ns (Photoproducts, cytoplasm) [69]1 mM398>590
5.4 ns (Ppp, Mitochondria) [71]20 µM670674
mTHPC10 ns (Ethanol solution) [72] 40 µM355456–794
8.4 ns (Methanol) [73] 15 µM590> 630
4.8 ns (Macrophages, V79) [73]15 µM380–450>630
AlPcS2
ZnPPC
4.0 ns (Macrophages, V79) [73]100 µM380–450>630
2.5–3 ns (Macrophages, V79) [73]10–50 µM380–450>630
HPPH5.7 ns (PBS) [74]100 µM400670–710
7.6 ns (liposome confined) [74]100 µM400670–710
6.4 ns (tissue phantom) [75]0.5 µM660720
4.3 ns (mouse tumor, before PDT) [75] 3 µM/kg660720
5.0 ns (mouse tumor, after PDT) [75]3 µM/kg660720
Chlorin-e64.5 ns (Monomer, methanol) [76]5 µM800635–740
~ 0.5 ns (Aggregates, methanol) [76]5 µM800740
0.5–3 ns (Part. aggregated, Lysosome) [76]5 µM430>710
~0.1 ns (Aggregates, Lysosome) [76]5 µM430>710

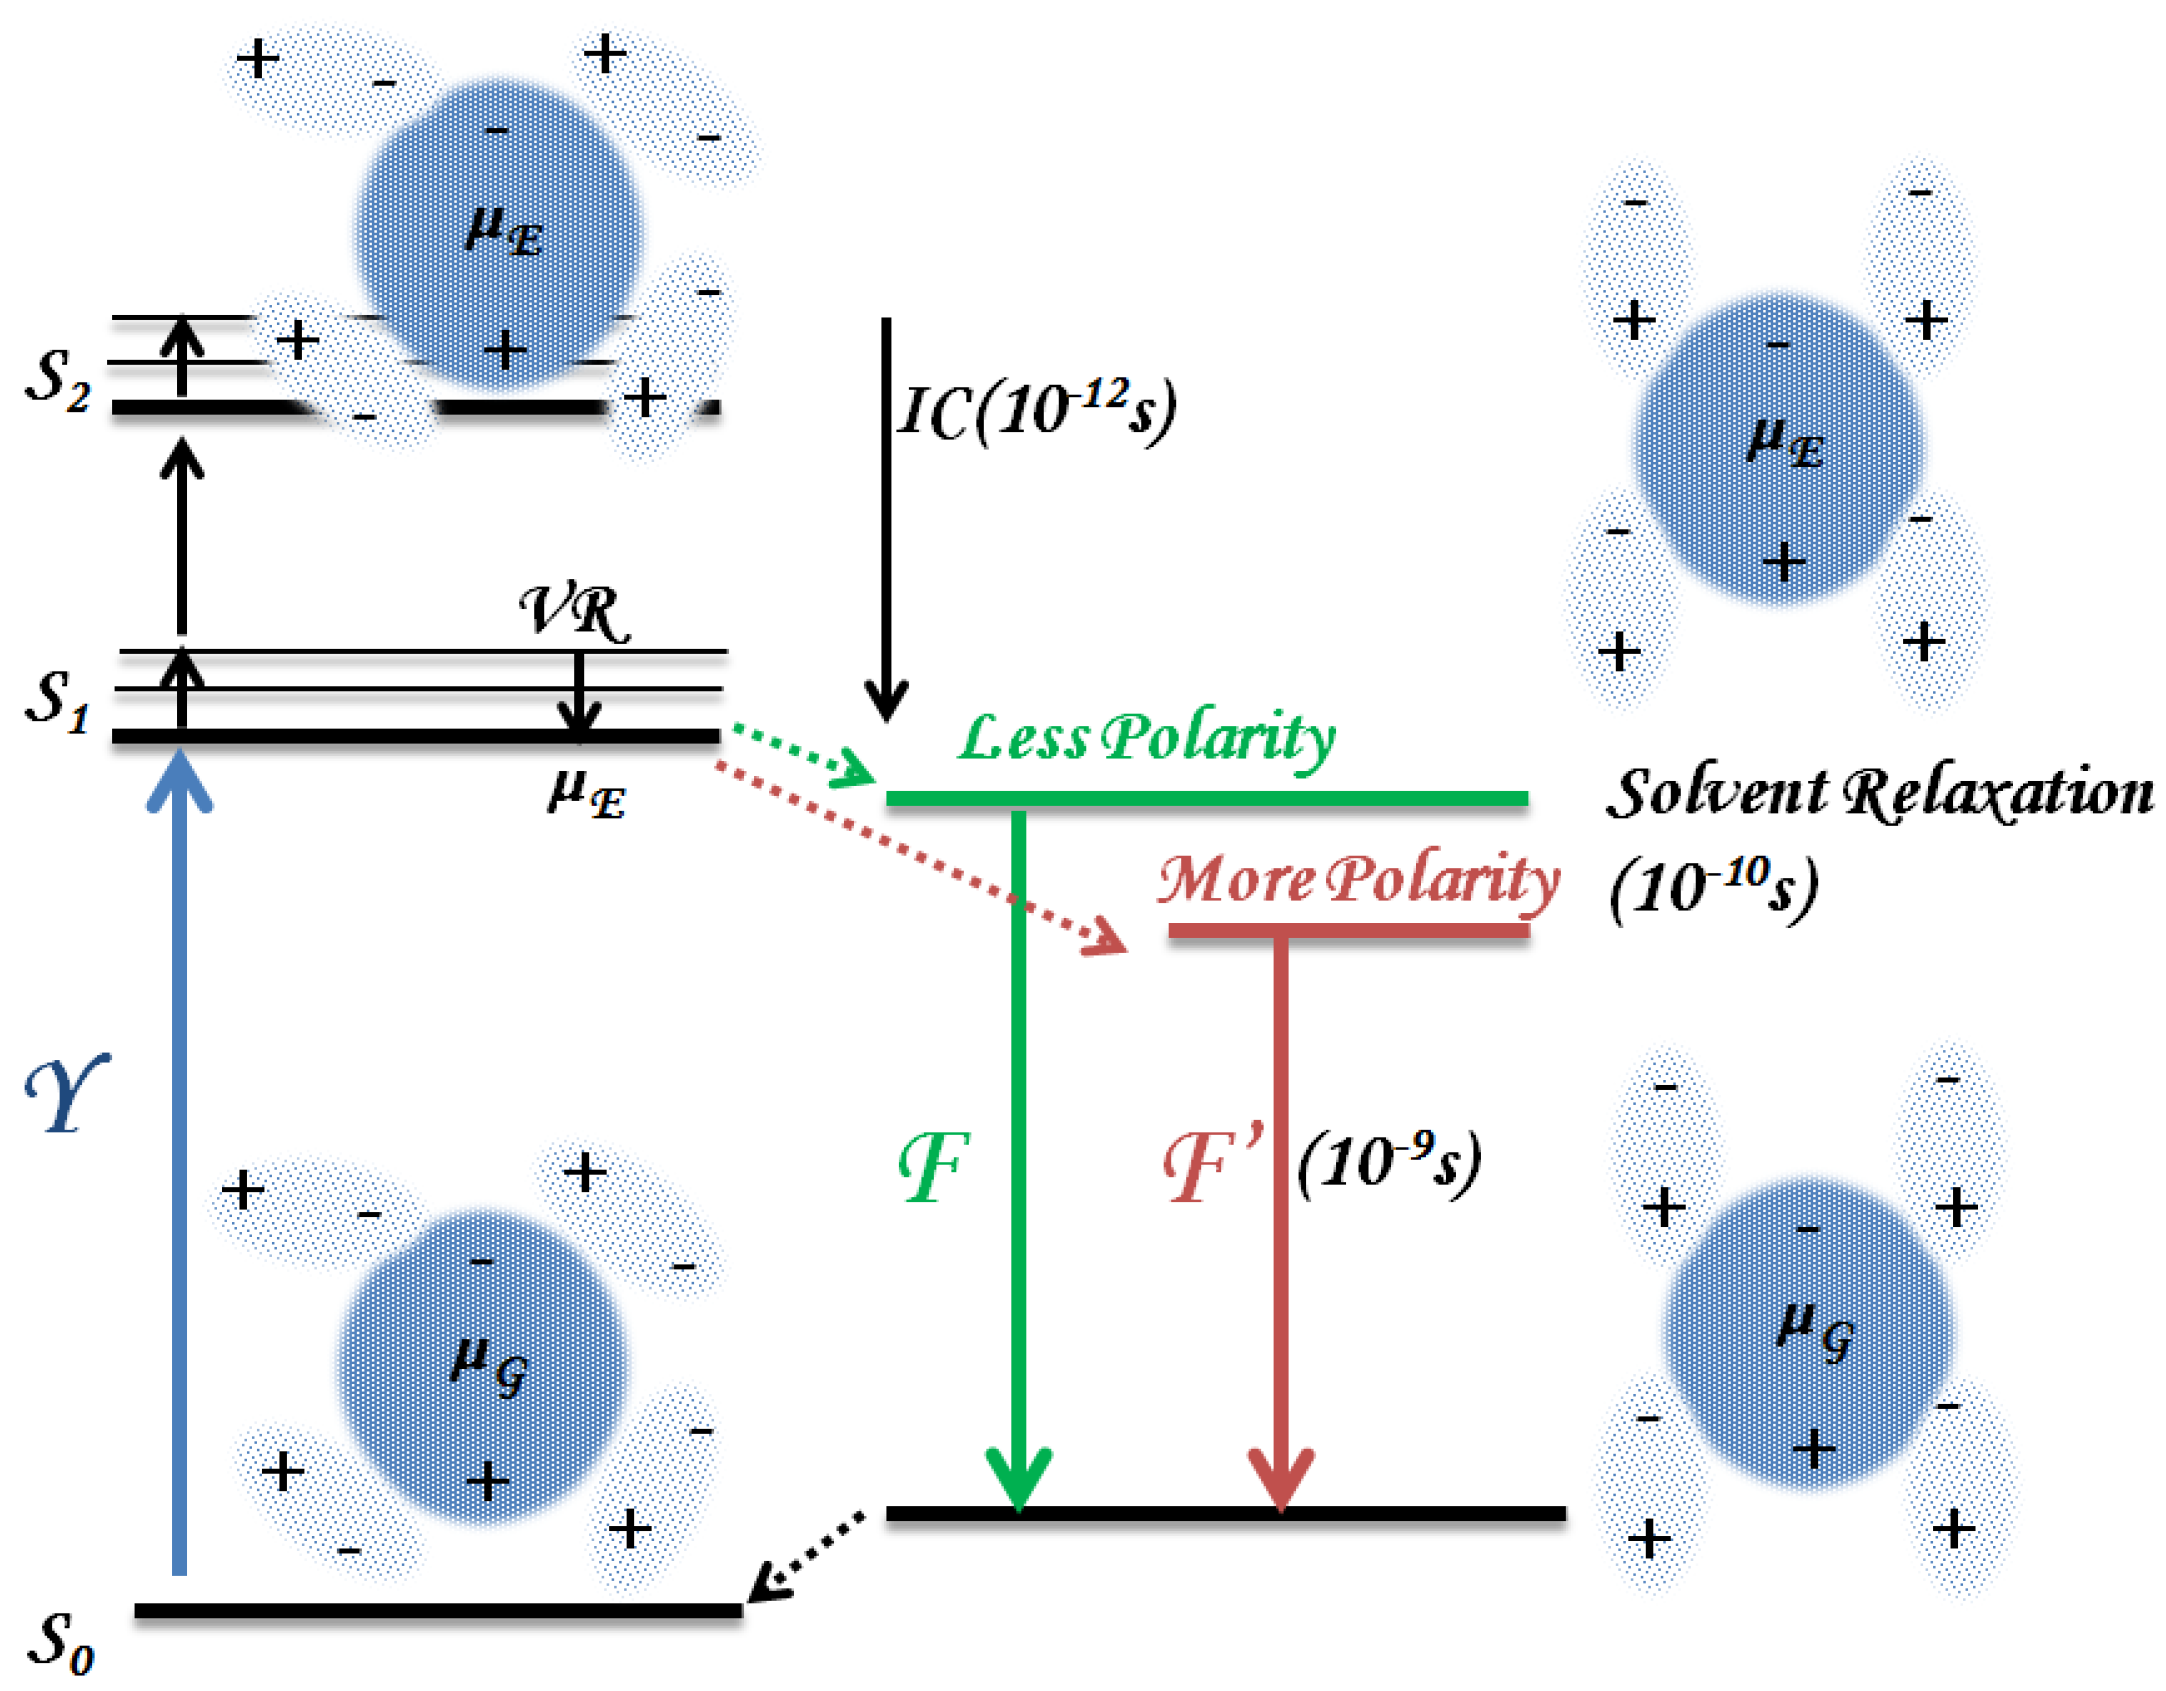
3.1.1. Solvent Effect

Solvent effect is related to the solvent relaxation that can lead to both spectral shifts and lifetime changes. As shown in Figure 3, fluorophores at the excited states exhibit larger dipole moment (µE) than ground state (µg). The solvent dipole reorientation is then driven by the dipole moment of the excited fluorophores, and the solvent with a higher polarity leads to an increased energy relaxation with a more red-shifted emission.
Connelly et al. investigated the fluorescence lifetime of mTHPC in living cells using time-gated fluorescence lifetime imaging technique in combination with the line-scanning confocal fluorescence microscope [73]. In vitro results showed mTHPC exhibited apparent photobleaching and had a significantly shorter lifetime (4.8 ± 0.3 ns) than in methanol solution (8 ± 0.4 ns). These results are found to be inconsistent with previous ethanol solution-based measurements using time-resolved excited-state absorption and emission spectra: the lifetimes of 10 ns correspond to the timescale of fluorescence (S1), and are independent of oxygen concentration [72]. The inconsistency of the measurements in solution can be attributed to certain variables, including the solvent effect and the time resolution of the measurement techniques. In particular, as solvent effect is associated with energy relaxation from the surrounding solvent molecules, it also results in changes in non-radiative decay rates (Knr). The increase of Knr to adjacent biomolecules and the consequent lower quantum yield is found in less polar solvent. Hence, when using solvents such as water, ethanol, or methanol sorted with descending polarity, fluorescence lifetime can be quenched further in less-polar environments [41].
Figure 3. Schematics of solvent relaxation. The excited fluorophores have larger dipole moment (µE) than ground state fluorophores (µg). The solvent relaxation phenomenon is due to the reorientation of solvent molecules surrounding the excited fluorophores. The more polar the solvent is, the further the emission energy is reduced. This leads to solvent-dependent spectral shift and lifetime changes. Fluorescence lifetime can be affected by the increase of non-radiative decay rates in non-solvent environments. VR and IC denote vibrational relaxation and internal conversion. Note that both VR and IC are independent of solvent relaxation because these transitions occur in a shorter time frame (10−12 s). Non-radiative energy transfer (10−10 s) and fluorescence (10−9 s) are then affected by the solvent effect.
Photonics 01 00530 g003

3.1.2. Binding to Biomolecules

It is noted that the fluorescence lifetimes of the photosensitizers were shortened significantly when measured in biological environment, as shown in the mTHPC experiment discussed above. This dynamic quenching effect is also consistent between types of cell lines and photosensitizers, while the extent of quenching depends on the drug localization. This phenomenon may serve as one of the advantages of using TRF to probe drug-molecular interactions. Several photosensitizers have been tested in a variety of cell lines and different binding sites were reported including mitochondria [80,81,82,83], lysosome [73], and cell membrane-based PDT [84,85].

Mitochondrial Localization

5-aminolevulinic acid (ALA) induced protoporphyrin IX (PpIX) and Photofrin® are two common photosensitizers approved for clinical PDT treatments; hence, more photophysical and photobiological studies regarding these photosensitizers have been done. Although different pathways were involved in the drug internalization processes [17], mitochondrial depolarization is the main mechanism that induces apoptotic cell death [81]. 5-ALA is an endogenous heme precursor that can lead to phototoxic PpIX synthesis through ferrochelatase inside the mitochondria. The nature of reduced ferrochelatase enzyme activities in tumor cells gives exogenous 5-ALA an advantage to accumulate extra PpIX. Maximum intracellular PpIX level is typically reached within six hours, but high variability between cell lines were observed [86,87,88,89]. Unlike 5-ALA, Photofrin® is integrated into mitochondria with a different pathway. It goes through plasma membrane and cytoplasm (pyruvate kinase activation) within three hours and contacts outer mitochondrial membrane to form the voltage-dependent anion channel within five hours; eventually the more hydrophobic components will reach the mitochondrial inner membrane and bind to cardiolipin [17,80,82,90]. Thus, several TRF studies were performed in an attempt to characterize the changes of time-domain parameters due to mitochondrial binding, and correlate these changes with treatment efficacy (apoptosis).
For example, Russell et al. characterized the lifetimes of Photofrin® and 5-ALA-induced PpIX inside living MLL (Mat-Lylu) cells using TCSPC-FLIM with the intention to help regulate the dosage of PDT in real time [70]. The fluorescence lifetimes of both drugs in methanol or cells agreed well with previous studies [31,43,45], as summarized in Table 4. Among different experimental settings that employed various modalities, cell lines, and drug concentrations, the measured lifetimes typically exhibited an average lifetime of more than 10 ns in solvent that correspond to monomers, while significantly quenched lifetimes of less than 8 ns were found when bound to mitochondria. These results suggested that the fluorescence lifetime-based technique might be able to provide a quantitative measurement of intermolecular interactions and may be a good candidate for in vivo PDT dosage monitoring. Further discussion of the slight discrepancy in individual lifetime components (short- or long-lived components) will be mentioned later in the photoproduct and self-aggregation section.

Lysosome Localization

Studies have shown that anionic porphyrins tend to localize in lysosomes [91], and lysosomal localization has been proposed as one of the critical subcellular targets in PDT [92]. Subsequent studies demonstrated that the lysosome-localized photosensitizers are also capable of causing apoptotic cell death by indirect activation of mitochondria-associated apoptotic pathways after destruction of the lysosomal membrane. Chlorin-based compounds and Phthalocyanine are the main photosensitizers internalized via lysosomes [93]. AlPc (aluminum phthalocyanine chloride) and ZnPc are also photosensitizers with great potential in PDT because of their red-shifted excitation spectra, which could allow for better tissue penetration during clinical interventions. Connelly et al. compared the fluorescence lifetimes of AlPcS2 in aqueous solution and in living V79 cells. Similar values of mean lifetime (4.8 ns) were obtained in bulk solution and in vivo, but a broad lifetime histogram was observed when the drug was incubated in cells. These results agreed well with the value reported by MacRobert et al, where the unquenched monomers exhibit the fluorescence lifetime of 5.4 ns in cells [94]. A short-lived component of 1 ns was also found and could be attributed to the quenching from non-fluorescence aggregates, which agreed with the cell measurement performed by Moan et al. [95].

Cell Membrane Localization

Cell membrane is a relatively uncommon target in PDT, while it remains an interesting target of PDT due to its fast-reaction PDT effect. The phototoxic effect can be observed within a short time frame after light irradiation, which can cease cell proliferation with low dose of Photofrin® (7 µg/mL) using light fluence of 10 J/cm2. Although efficient, the plasma membrane-mediated PDT was reported to manifest necrotic cell death [84]. Cell phenotype demonstrated swelling, blebbing, and disintegration of the membrane [12] without signs of apoptosis such as DNA fragmentation. Yeh et al. studied the lifetime changes of Photofrin® through the uptake process and correlated the lifetime changes to subcellular localization. The fluorescence lifetime of Photofrin® was found to be significantly shortened when the drug is first bound to plasma membrane at 1 h of incubation (4.3 ns compared to 7.3 ns at cytoplasm). This phenomenon can be attributed to specific intermolecular reactions between Photofrin and the receptors at the plasma membrane. Another explanation is that the increased photobleaching of Photofrin® monomers might be caused by a much higher fluence required for sufficient SNR during the initial uptake of Photofrin® [78]. This leads to the shortened average fluorescence lifetimes from Photofrin® aggregates [31]. The effect of irradiance will be further discussed in the section on “prolonged irradiation”.
It is important to note that redistribution of the photosensitizers to the cell cytoplasm can occur in any types of photosensitizers that eventually disintegrate the membrane of subcellular organelles [81]. Therefore, characterization of lifetime changes throughout the drug uptake duration might provide an indicator for cell responses. Multiple endogenous fluorophores such as NADH and FAD should be taken into account together to represent cell function, and will be further discussed in Section 3.3.

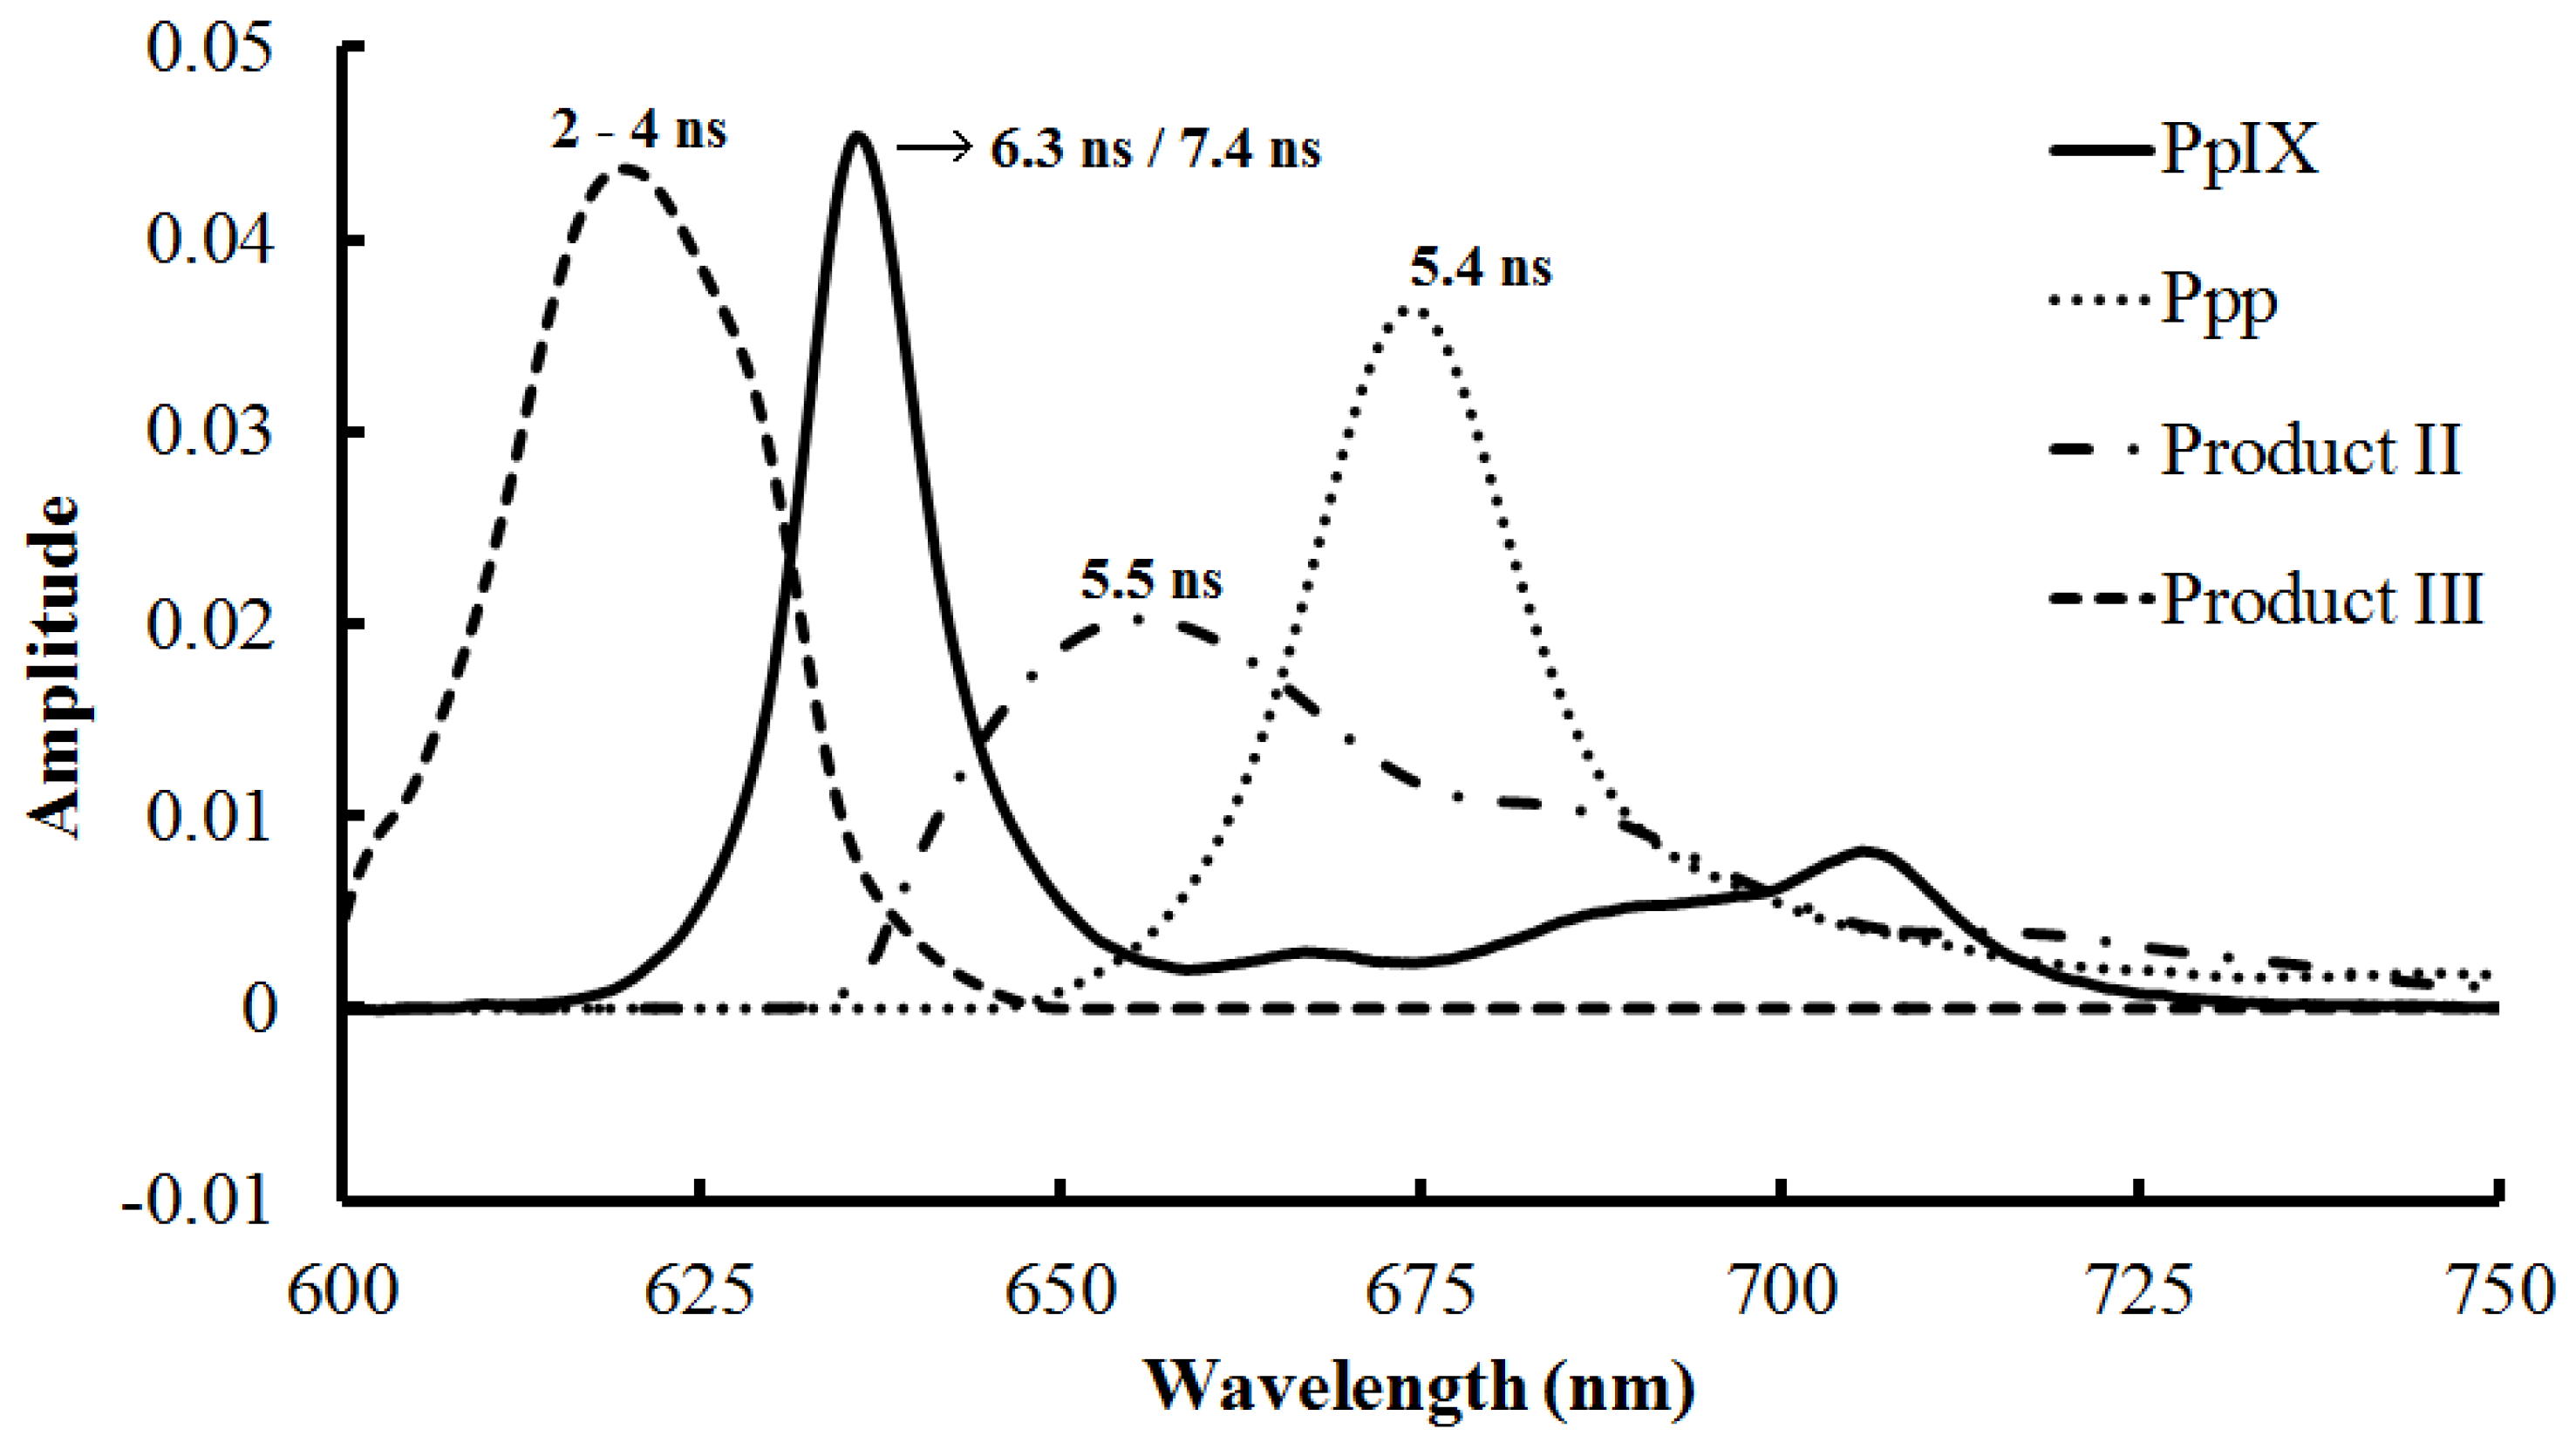
3.1.3. Photoproducts and Self-Aggregation

Photoproduct and self-aggregation could exhibit distinct fluorescence spectra, fluorescence lifetimes, and phototoxicity. These phenomena have been proved to be one of the major issues that introduce variability in PDT efficacy and inaccuracy during monitoring. Therefore, an effort has also been made to investigate their properties by manipulating drug concentration and the use of spectral-resolved TRF measurement.
In 1990, König et al. demonstrated aggregation studies by using different concentrations of Hematoporphyrin derivative (HpD), which is a previous generation of photosensitizer and is known to be a mixture of monomeric and aggregated porphyrins. Results showed that the short-lived component (~2 ns) increased while the photoproduct of HpD was formed. This phenomenon is associated with the increase of photosensitizer concentration (10-5 to 10-3 M) and/or the light energy (80 mW for 0 to 120 min). This result first suggested the fact that photoproduct formation needs to be considered during lifetime imaging [31].
5-ALA induced PpIX is also known to produce several intermediate photoproducts, as shown in Figure 4 [29,69]. Its photoproducts with varying lipophilic characteristics can localize at different locations in the cells, and some of the photoproducts (i.e., Ppp and its photoproducts) also play cytotoxic roles in treatment [30,96]. However, it is not easy to differentiate them with steady-state fluorescence measurements due to the significant spectrum overlap, while TRF may be an alternative candidate, as labeled in Figure 4. Theodossiou et al. attempted to characterize the cell photosensitizing properties of Ppp in a murine keratinocyte cell line (PAM 212) by using fluorescence microscopy and time-resolved spectroscopy. Ppp is one of the photoproducts from 5-ALA induced PpIX and was shown to be effective in cell killing. Time-course fluorescence studies up to 400 min of incubation were performed to examine drug localization, quantum yields and decay times, and Ppp with the decay time of 5.35 ± 0.17 ns was found in cells after 4 h of incubation [71]. The study of photoproduct and self-aggregation can be further advanced with the development of spectral-resolved FLIM (SLIM). Lifetimes were obtained by TCSPC-FLIM and were further classified into eight wavelength channels. As a result, four-dimensional data including photon distribution (x, y), the wavelength (λ), and the lifetimes (τ) were built. SLIM studies measured in solution and cells both showed that different metabolites of 5-ALA exhibited significantly different decay rates compared to PpIX monomers, and also localized at different intracellular regions [69].
Figure 4. The emission spectrum of 5-ALA-induced PpIX and its photoproducts. The monomer and photoproducts of the photosensitizers demonstrate significant spectral overlap. Fluorescence lifetimes of different 5-ALA metabolites in cells are also labeled. PpIX fluorescence lifetimes are quenched to 6.3 ± 1.2 ns [70] and 7.4 ± 0.6 ns [79] measured in different cell lines; Ppp (5.4 ± 0.2 ns) and its photoproduct (Product II, 5.5 ± 0.4 ns) have similar lifetimes, but both demonstrate faster decay compared to PpIX [71]; Product III corresponds to Uroporphyrins and other intermediate metabolites that show significant shorter lifetime of 2 to 4 ns and can be easily differentiated from PpIX [69] (Reproduced from data in [29]).
Photonics 01 00530 g004
Photofrin® has also been extensively investigated by the fluorescence lifetime-based technique both in bulk solution and in vitro using SLIM [45]. Photofrin® at a concentration of 2 µg /mL was first incubated in HepG2 cells (Human hepatoblastoma cell line) for 24 h. The decay traces were then calculated by the bi-exponential model. As known by spectroscopic studies, Photofrin® has its main fluorescence emission bands at the wavelength ranges of 627–639 nm, 639–651 nm, and 687–699 nm. Accordingly, lifetime results from these three emission bands were approximately 12 ns (11.2–13.6 ns); however, at the emission band of 663–675 nm and 651–663 nm, which correspond to the photoproducts of Photofrin®, the measured lifetime values were apparently shorter (~ 8.9–9.3 ns) than the monomers. Furthermore, the spectral range of 508–520 nm can be attributed to autofluorescence of flavin molecules inside cancer cells and exhibited the lifetime value of 5.2 ns. In other words, analyzing fluorescence lifetimes at different spectral ranges can be an important approach to realize mitochondrial metabolism under PDT treatments. This is further supported by later studies, where Photofrin® exhibited a slower component of 11.6 ± 0.5 ns coming from monomers and a fast component of 4.8 ± 0.9 ns from aggregates or photoproducts using bulk measurement. A significantly quenched lifetime of 5.5 ± 1.2 ns was also found in cells after incubation of Photofrin® at10 µg/mL for 18 h [70]. It should be noted that the concentration of the photosensitizer can affect the extent of aggregation, and different fitting algorithms can also lead to discrepancy in lifetime estimation, but a consistent finding of quenched lifetimes in aggregates and photoproducts can still be a distinct feature when probing fluorescence lifetime changes. The degree of lipophilicity is a factor that can alter photosensitizer distribution inside the cells, where lysosome distribution is usually found in strongly lipophilic sensitizers (i.e., Chlorin e6) and could lead to more aggregate formation [76].

3.1.4. Prolonged Irradiation

The fluorescence lifetime components of photosensitizers were also found to be dependent on the irradiation dose. Studies have shown that prolonged irradiation can result in the production of an extra short-lived component in the lifetime range of hundreds of ps. König et al. performed in vivo fluorescence measurements and the results clearly showed that the intensity of short-lived components (1.0 ± 0.3 ns) increased when the excitation fluence was raised. This phenomenon could be explained by the photoproduct formation due to photobleaching of HpD monomers. This agreed well with later research using Photofrin® and chlorin compounds [31,76,78].

3.2. Time-Resolved Studies of PDT Photosensitizer in Vivo

Photosensitizers have been shown to undergo fluorescence lifetime changes in the cell environment. The changes are significant and relatively independent of fluorophore concentration. Efforts have been made to direct this technique towards clinical applications including the investigation of the instrumentation and analysis in tissue phantom and in vivo, although photosensitizer studies were still quite limited. To achieve time-resolved mapping of photosensitizers in a thicker tissue volume, time-domain (TD) NIR fluorescence diffuse optical tomography (FDOT) has become an attractive option to account for light propagation in tissue by the use of multiple source-detector pairs across the targeted area [75,97,98,99]. Imaging reconstruction was then performed based on the normalized Born approximation [100]. Mo et al. in 2012 used a time-gated fluorescence tomography system to characterize the fluorescence lifetime of a PDT photosensitizer, 2-(1-hexyloxyethyl)-2-devinyl pyropheophorbide-a (HPPH), in a tissue phantom as well as a human head-and-neck xenograft in a mouse model [75]. HPPH-based PDT has shown effective results in superficial cancers such as Barrett’s esophagus [101], head, and neck tumors [102]. In this experiment, the HPPH in a tube was embedded in a liquid phantom of which the optical properties match healthy mouse tissue. The correct location of the HPPH tube was extracted, which showed both the quantum yield and the mean lifetime of 6.4 ns. Results were further validated by consistent measurement from a standard fluorophore, Atto 655. Changes of fluorescence lifetimes of HPPH in vivo were characterized before and after PDT, with the scanning depth from 5 mm to 13 mm underneath the surface. Shorter fluorescence lifetimes were observed in vivo and an increase from 4.3 ns to 5.0 ns was obtained after treatment (Figure 5). The tomographic results also showed a 20% increase in photosensitizer photobleaching at the surface of the tumor mass due to the increased fluence rate close to the irradiation plane. Fluorescence lifetimes of HPPH also increased by 16% after PDT treatment, which could be related to changes in physiological parameters. It is important to note that the change of physiological parameters, in particular oxygen level and blood perfusion, could all contribute to the changes in fluorescence lifetimes [103]. In addition, changes from the standard dose parameters—fluence distribution and photobleaching of the photosensitizers—should also be considered [75]. These influencing factors are discussed in the following sections.
Figure 5. In vivo imaging of the HPPH-targeted tumor in mice before treatment. The mouse was immersed in the optical matching fluid (µa = 0.4 cm−1; µs' = 10 cm−1. Note: µs'= µs (1-g), which accounts for anisotropic scattering dominating in tissue. g is the anisotropy factor with a typical value of 0.9).The reconstructed fluorescence lifetime and quantum yield at different depth agreed well with reported values (The figure is from [75], with permission from SPIE).
Photonics 01 00530 g005

3.2.1. Endogenous Fluorophores

Endogenous fluorophores that participate in oxidative phosphorylation are common fluorescence markers that reflect cell metabolism and mitochondrial function. These include reduced nicotinamide adenine dinucleotide (NADH), reduced NADH phosphate (NADPH), and flavin adenine dinucleotide (FAD) [104,105]. In vitro TRF measurement of photosensitizers focused more on the lifetime changes of the photosensitizers themselves; however, it is indispensable to take the interactions from abundant endogenous fluorophores into account for in vivo environment. In fact, though abundant endogenous fluorophores present in tissue provide insight for probing the phototoxicity of PDT, they also interfere with the fluorescence lifetime estimation to some extent, which will be further discussed in Section 4.1. With the potential to correlate biological effect (cell function) to the treatment dose, endogenous fluorescence lifetimes were studied alone or incorporated with photosensitizers to investigate cell function after PDT. Pogue et al. tackled the changes of NADH fluorescence lifetimes both in vitro and in vivo after the cell damage induced by verteporphyrin-mediated PDT [104]. Results have demonstrated that the NADH fluorescence was reduced both in vitro and in murine muscle after a toxic PDT dose was given that introduced immediate mitochondrial damage. This can be more likely attributed to compromised mitochondrial membrane that ceased the accumulation of NADH molecules [18], or the oxidation caused by the singlet oxygen induced by the photodynamic reactions. Fluorescence lifetimes remained the same at approximately 1.5 ns throughout the time course and were found to be shorter than the no-drug control groups (2.1 ns). Later cell experiments performed by Wang et al. [106] further characterized the NADH lifetimes in an attempt to differentiate staurosporine (STS)-induced apoptosis from hydrogen peroxide-induced necrosis, which could be essential for monitoring cell responses to the treatment. It is noted that the fluorescence lifetime of NADH increased within 15 min after apoptosis was introduced, while no change was observed in necrotic cells. The observed changes were much earlier than regular apoptosis detection techniques that require 2 to 4 h for cytochrome c and caspase 3 activation [107]. These results are consistent with earlier work from Ghukasyan et al. that showed a significant increase of protein-bound NADH occurred only in apoptosis that caused an increase fluorescence lifetime to 3.6 ns [105]. Wang et al. further used 5-ALA-mediated PDT to induce cell apoptosis and have a consistent finding as STS-induced apoptosis (increased NADH lifetime) [108]. With the alteration of fluorescence properties of endogenous fluorophores during apoptosis, it is feasible to perform noninvasive treatment monitoring and detection of cell death by considering both the changes of fluorescence lifetimes from photosensitizer (the drug–molecular interactions), and the endogenous fluorophores (the treatment effect).

3.2.2. Microenvironment—Oxygen Level, Vascularization, and pH

The dynamic physiological factors induced by PDT can also alter fluorescence lifetimes of the photosensitizers and inevitably increase the complexity of data analysis. These factors include the size of tumor masses [75], oxygen saturation [103], vascularization [109], and pH [110]. For example, oxygen supplied by the surrounding capillary vessels plays an important role in PDT treatment. Large tumor masses usually manifest an oxygen level of nearly zero in tissue far away from the capillary supplies. Studies have been done to show the oxygen diffusion capability into the tissue and the kinetics between oxygen pressure and photosensitizer quenching using Photofrin [28,111], Pd-porphyrins [112], and mTHPC [113]. However, the oxygen pressure and the extent of oxygen depletion were not solely based on the blood perfusion, but also on the local photosensitizer concentration and light dose. High local drug concentration can bear multiple cycles of excitation before photobleaching and can use up oxygen easily; a dose of high irradiance also aggravates the depletion effect, thus limiting the overall PDT efficacy [33]. It is noted that these changes associated with the depletion of oxygen through the photosensitizing processes could possibly increase the fluorescence lifetime of photosensitizers in tissue due to reduced quenching effects [114]. PDT-associated blood perfusion changes can also cause consequent effects on oxygen supplies and photobleaching rates; occlusion of vessels and reduced vasculature deep within the tumor mass also affect delivery of the photosensitizers [32]. Changes in interstitial fluid pressure induced by PDT can also result in changes in pH [103]. Correlating all of these factors becomes essential to interpret fluorescence lifetime measurement in vivo.

3.3. Discussion

To discuss the feasibility of using TRF as a complementary tool for PDT dosimetry, one needs to first answer the following question: What information provided by TRF is relevant to PDT dosimetry? Abundant in vitro and some preliminary in vivo studies have demonstrated the capability of using TRF to probe the photosensitizers in a biological environment. Differences in TRF results were observed between photosensitizers and cell lines, but some key observations that are related to PDT dosimetry are summarized in Table 5.
Table 5. Implications from TRF-PDT.
Key Information for DosimetryInformation Yielded by PDT-FLIM
Drug interactions with subcellular organelles (Section 3.1.2)Quenching of photosensitizer fluorescence lifetime while binding to biomolecules [73,115].
Changes of fluorescence lifetimes through the drug uptake process [78].
Photoproducts (Section 3.1.3)FLIM is able to determine photoproduct species although significant spectral overlap exists. Understanding of photoproduct contribution is essential to avoid over- or underdose estimation [31,45,69].
Apoptosis (Section 3.2.1)NADH fluorescence lifetime would increase immediately after the initiation of apoptosis. This can be applicable to apoptosis-mediated PDT [105,116,117].
Necrosis (Section 3.2.1)NADH fluorescence lifetime does not change through the necrosis procedures. This can be related to necrosis-mediated PDT (plasma membrane as a target) [116,117].
Cell function (Section 3.2.1)Cell metabolism and mitochondrial malfunction can be revealed by the ratio of free NADH (short lifetime) and bound NADH [44,104,117].
Oxygen Sensing (Section 3.2.2)Decreased oxygen level lead to increased lifetime [75].
An instrument with low laser repetition rate and CCD detection is under development for sensing oxygen concentration and fluorescence lifetime [118].
To correlate TRF with PDT dosimetry, we first consider what the most important factors are to build up the effective PDT dose. These encompass the local drug concentration, effective light fluence, and oxygen levels [3]. However, the approaches to accurately quantify these parameters are still under investigation [25,119] with either indirect [29,38] or direct dosimetry [25,40,118]. As for direct dosimetry, it may be noted that phosphorescence measurements of singlet oxygen provide a direct indicator as well as a measure of oxygen depletion, but certain practical issues have to be considered. It is a challenging task to probe short-lived singlet oxygen species because the phosphorescence signal is so weak and there is a significant background due to fluorescence. More importantly, singlet oxygen may not be solely responsible for the treatment effect. The overall efficacy still relies on the interdependencies indicated in Table 1 and Figure 1a, and free radicals could potentially be significant in hypoxic or anoxic conditions. Although TRF does not probe any of the three parameters directly, it is able to reveal another key dosimetry factor: the biological effect at the molecular/cellular level, which includes several transitional steps such as drug interactions with its targets, photoproduct formation, singlet oxygen quenching, and cell function alterations. For example, it is able to probe the quenched fluorescence lifetimes and the contribution of photoproducts when drugs are bound to various subcellular organelles. Cell function alterations such as mitochondrial depolarization and cell death pathways can be characterized according to the proportional intensity and lifetime changes of autofluorescence [116,117]. This can lead to overall changes in the amplitude-weighted average lifetime of the photosensitizers. More specifically, TRF may help discriminate apoptotic and necrotic responses after treatment. For example, autofluorescence lifetime could be correlated to type II (singlet-oxygen) PDT when NADH exhibits increased lifetime immediately after apoptosis, or type I (free radicals) PDT if no such change is observed. However, the presence of both cytotoxic oxygen species, free radicals and singlet oxygen, may result in a quenched fluorescence lifetime for photosensitizers. In other words, fitting the data with multiple exponents could be essential to delineate the differences and dependencies when different types of photosensitizers (type I or type II) are used in PDT. Overall, dynamic relationships should be taken into account while interpreting the results in vivo, where the supporting vasculature plays a role in the PDT parameters, including oxygen and photosensitizer concentration. Is TRF measured in vitro going to be independent of these in vivo changes? It is unlikely that the in vitro time-resolved features are still completely applicable when measured in animal models. Efforts have to be made to characterize the effect of the surrounding in vivo environment (i.e., the change of oxygen level, drug delivery, light delivery, and pH) to the proportional changes of individual fluorescence lifetimes (i.e., photosensitizers, photoproducts, endogenous fluorophores, and the overall changes of average lifetimes). This further poses an inherent challenge: the complexity of data analysis (Section 4.3). Furthermore, the self-aggregation and photoproduct phenomena discussed in Section 3.1.3 raise another question: is fluorescence lifetime actually independent of fluorophore concentration and light delivery? In theory, within a certain range of concentrations that do not cause aggregation of photosensitizers, the fluorescence lifetime of the fluorophore should remain unchanged. As a result, fluorescence lifetime alone cannot provide concentration information. In fact, it will be affected by the drug concentration accumulated at its target due to the formation of dimers at high concentration; the photobleaching of monomers also leads to an increase in the proportion of photoproducts, and changes the average fluorescence lifetime. These factors will play a more complicated role in animal models. To date, there is a lack of TRF studies that correlate TRF parameters to treatment efficacy. A practical question is how TRF may reflect treatment progress or the final effect. Contribution of the specific lifetime component can change significantly during the treatment progress and this eventually alters the amplitude-weighted average lifetime. Overall, the sensitivity of time-resolved parameters offers a great opportunity to look into biological responses after PDT, but also introduces significant complexity in terms of data analysis and interpretation. Development of clinical friendly instrumentation and analysis are in progress and will enable researchers to further tackle these questions (further discussed in Section 4).

4. Challenges and Advances in Using TRF for Clinical Applications

In vitro and in vivo results demonstrated the potential to employ TRF for dose monitoring. However, when implementing the in vitro technique at the tissue level or in animal models, the questions become more complicated, as mentioned in Section 3.3. In short, in vivo applications introduce complexity to the microenvironment, including diversity of fluorophores, variation in photosensitizer and light delivery, perfusion, etc. Therefore, the following perspectives must be taken into account:
(i)
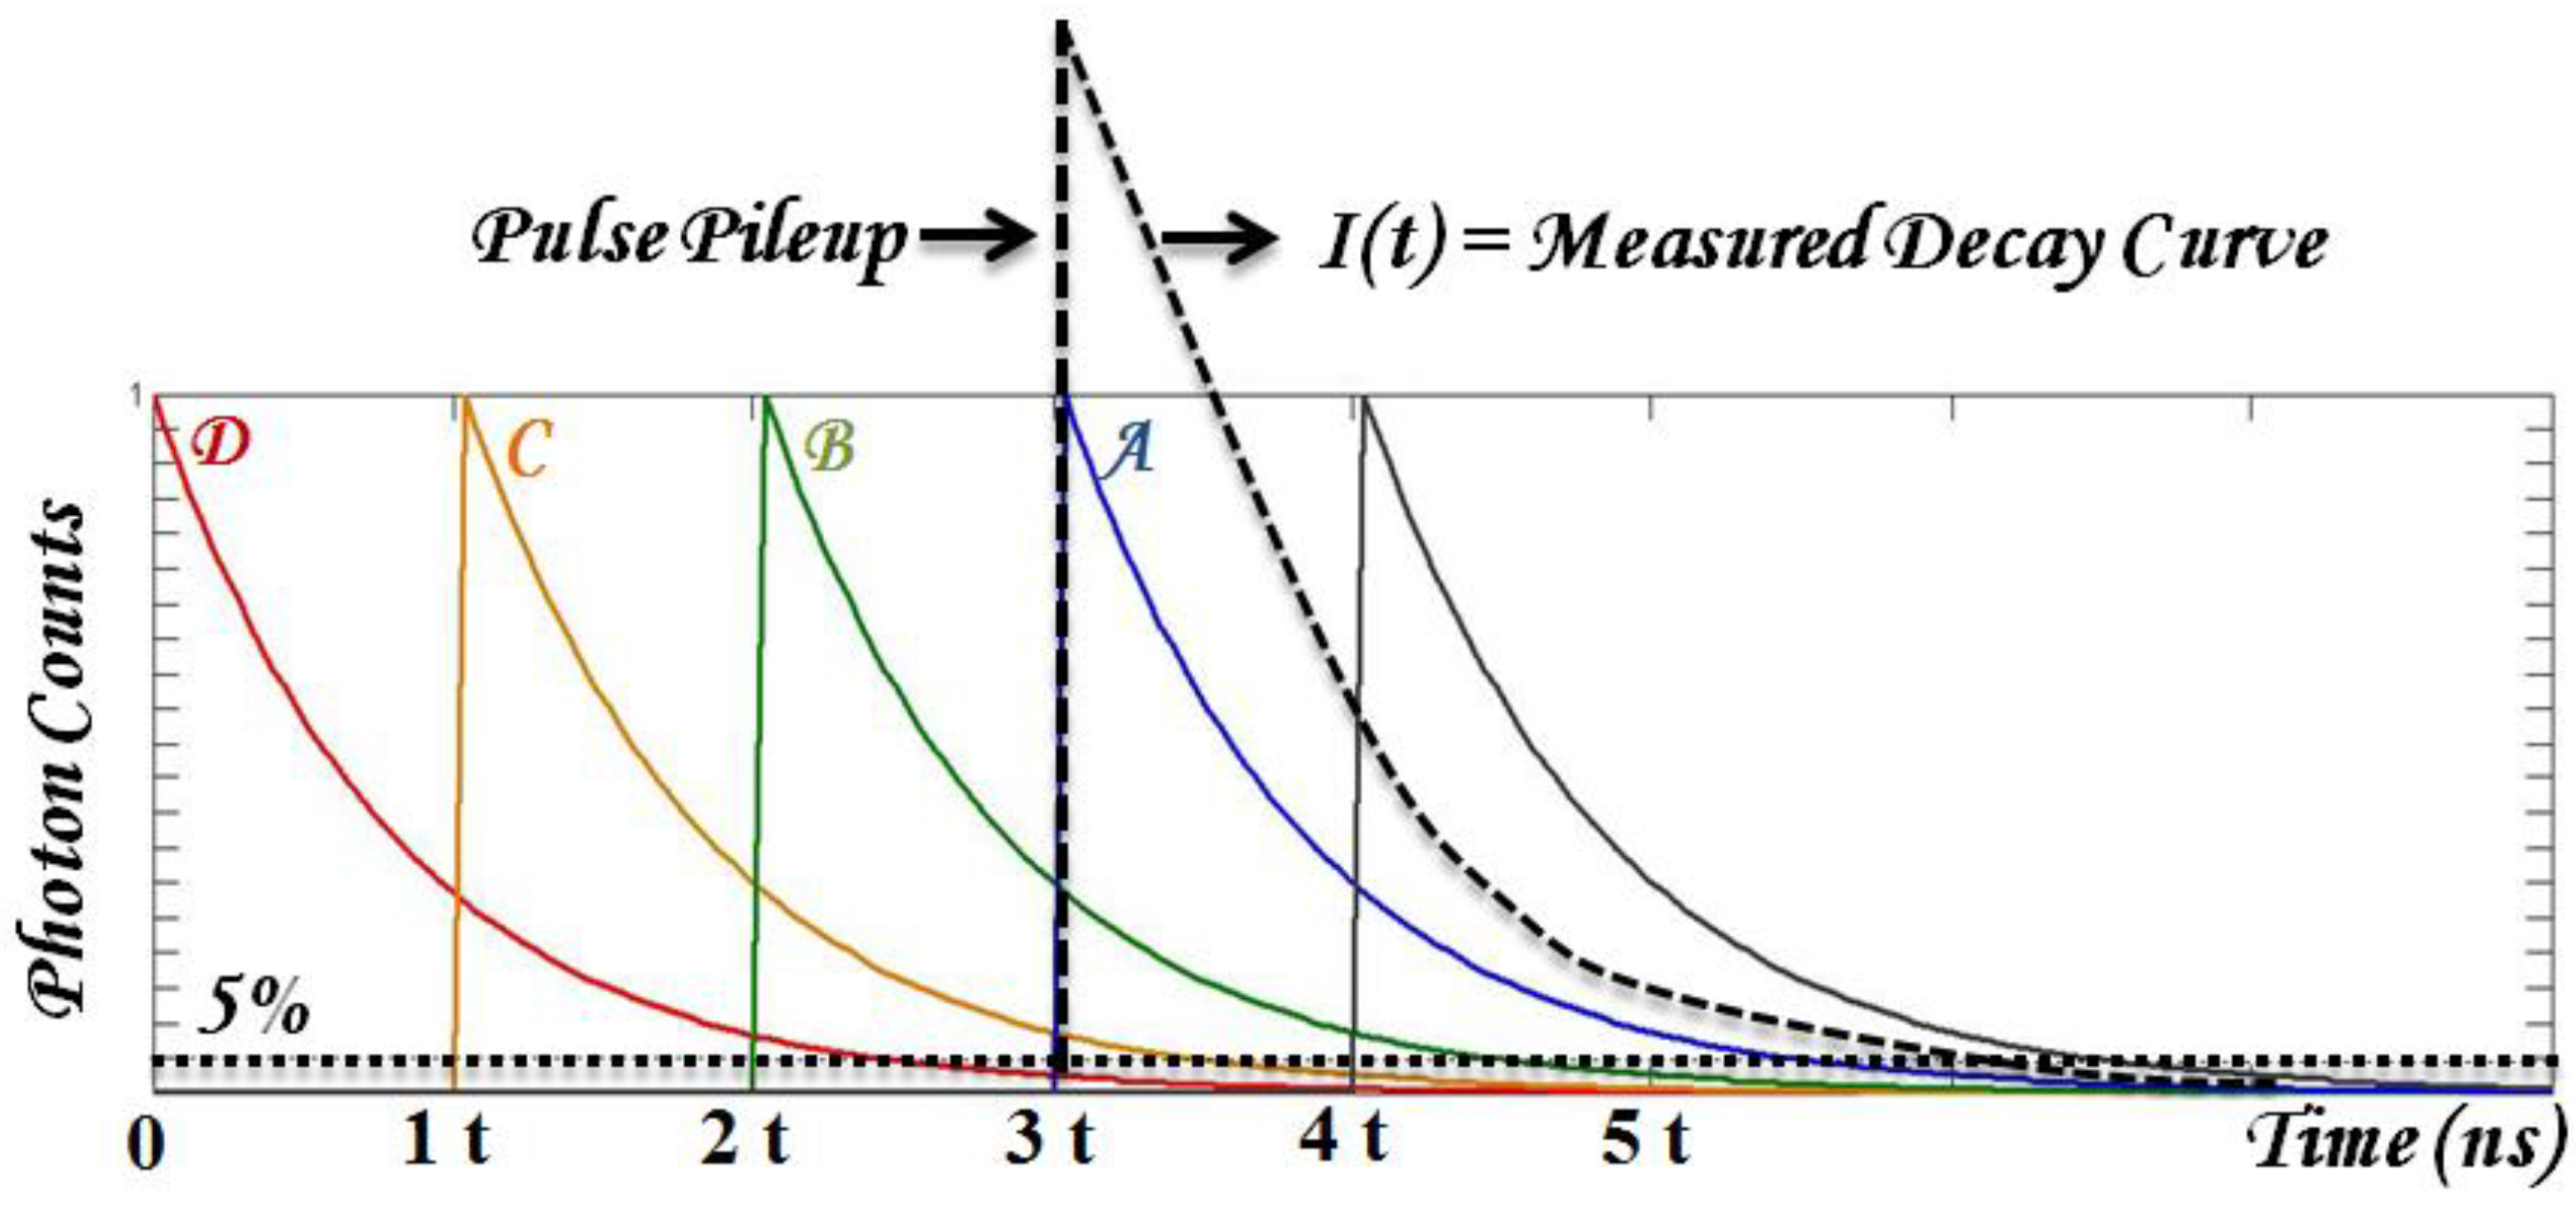
Robust data analysis that deals with substantial biological variables and low SNR. Time-domain parameters are typically retrieved from fitting the results with known decay dynamics. Fitting accuracy may be reduced in multiple exponential decay and low SNR from photosensitizer fluorescence. In addition, the typical fluorescence lifetime range of photosensitizers can be long enough to introduce pulse pile-up and incomplete decay problems using time-domain TRF techniques. To be practical, the first challenge to overcome is to have fast and robust algorithms to retrieve time-resolved parameters, τi (lifetime) and Ai (coefficients).
(ii)
Tissue optics that affects light focusing and drug targeting efficiency. This can be approached by modeling light transport using diffuse optical tomography.
(iii)
Compatible instrumentation for clinical implementation. It is desired to have compact instrumentation with accessibility to desired tissue target (e.g., coupled to endoscopy). In addition, spectral-resolved analysis (e.g., hyperspectral TRF) may provide additional advantages in terms of interpreting multiple sources of fluorophores.

4.1. Data Analysis

Fluorescence emission profiles of photosensitizers have been shown to exhibit multiple exponential decays with a relatively lower SNR. SNR is particularly important when analyzing multiple fluorescence lifetime components, and is usually one of the major considerations for data acquisition in clinical settings. In this section, we mainly review approaches in analyzing time-domain TRF for its feasibility in clinical implementation.
In time-domain TRF, the measured fluorescence decay curve is a convolution of the true fluorescence decay, F (Equation (1)), with the instrumental response function (IRF) of the optical system. The time-resolved parameters such as lifetime can be estimated through deconvolution [41]. Global analysis based on non-linear least squares (NLLS) [46,47] is a common approach that shows good accuracy in lifetime estimation. It assumes fluorescence lifetimes are spatially invariant, thus a high SNR decay profile averaged from all pixels can be used to retrieve fractional contributions of lifetime components. Another method particularly proposed in biological systems is the stretched exponential model [120]. This assumes a continuous distribution of lifetimes by using a single decay model that can be generalized, thus it does not require assumptions of the decay function and is considered computationally efficient compared to NLLS. However, the Fourier transform of the model for frequency-domain data cannot be expressed in analytical solutions, and numerical approximation has not been successfully presented. Also, data interpretation is challenging when considering a continuous lifetime distribution [121], thus limiting its use. When approaching complex tissue characterization in PDT, NLLS still suffers from certain limitations: (i) NLLS gives non-unique solutions of fluorescence decay times and their coefficients. The inaccurate local minima can be obtained due to the low SNR in multi-exponential fitting. (ii) The retrieved exponential components are usually not sufficient to represent the different types of fluorophores in tissue, and lead to difficulties in data interpretation [41,49]. (iii) Nonlinear optimization is computationally expensive. Therefore, several techniques have been proposed to overcome computational challenges and estimation accuracy. For example, Maus et al. compared performance of maximum likelihood estimation (MLE) and NLLS on low SNR data and found that MLE resulted in better accuracy in multiexponential analysis with photon counts of 1000 to 20000, while NLLS underestimated the fluorescence lifetimes by about 5% [122]. Laguerre basis functions (LBF) are another alternative proposed in previous TCSPC and time-gated FLIM [123,124,125], where the intrinsic fluorescence decays are expanded to a set of orthonormal functions to provide unique estimation of fluorescence lifetime coefficients. To improve clinical compatibility, Jo et al. performed a global analysis based on a common LBF for data in every pixel obtained from a time-gated FLIM system. Results showed an improved computational speed in the order of a few seconds, which is at least two times faster than standard NLLS [125].
Incomplete decay of long-lived fluorophores can introduce estimation error in time-domain TRF using ultrafast lasers. As demonstrated in Figure 6, when the fluorescence decay cannot be completed within the pulse duration (t), the decay tails from previous excitation pulses are superimposed to the currently measured decay curve, I(t). The consequent estimation error can be critical when the lifetime changes of energy transfer can be as short as 0.1–0.2 ns [126]. Previous studies have used the forward model to estimate the measured parameters based on original values [67,68,127], as well as the inverse model to recover the original values from estimated results [68]. Leung et al. simulated the effect of incomplete decay using a bi-exponential model. It is noted that the pulse pile-up caused errors in individual coefficients (Ai), but not in the individual lifetimes (τi). In addition, an increased estimation error can be caused when there is an increased discrepancy of original lifetime components (τ2- τ1), or a convergence of individual coefficients to 0.5 (Ai = 0.5) [68]. The inverse model thus provided a way to correct the measured coefficients and the eventual average lifetimes for a more valid interpretation of fluorophore concentration and interactions.
Figure 6. Schematics of incomplete decay when an ultrafast laser is used in time-domain TRF. Ultrafast laser pulses with an inter-pulse interval of t yield fluorescence emission that follows exponential decay profiles, as indicated by the decay curves A–D, corresponding to each pulse. The tails of previous decays (B–D) are superimposed on the current decay (A) when t is not sufficiently long for a full fluorescence decay, causing distortion of the measured decay curve, I(t). The effect becomes more prominent when t is decreased or with a slow decay profile (adapted from [68], with permission from OSA).
Photonics 01 00530 g006

4.2. Tissue Optics in PDT and Lifetime Measurement

In PDT, scattering dominates light transport when red to NIR light sources are used, although hemoglobin also plays a role in light absorption as a function of oxygen content. As turbid tissue is heterogeneous, spatial and individual variation of tissue optical properties is always one of the major concerns in light-mediated therapies. These factors alter PDT targeting efficiency due to attenuation of the effective light dose. For example, the fluence rate near the tissue surface could be several times greater than the delivered irradiance due to backscattering. This applies to both surface and intracavitary irradiation schemes. In interstitial treatment, the distribution of light dose is still affected by the effective attenuation coefficient, defined as [3 µaa + µ's) ]1/2. The variation in light fluence can cause various extents of photosensitizer photobleaching and biological effect. Mathematical solutions to model light fluence and distribution in superficial, interstitial, and intracavitary applications were done to further account for the effect of scattering and absorption [25]. Detailed reviews of light propagation and modeling can be found in recent work from Zhu et al. and Jacques [25,128]. This may be further correlated with dose monitoring using time-resolved parameters.
In addition, light propagation of the emitted photons leads to distortion of measured data, although fluorescence lifetime estimation is supposed to be relatively more independent of light path when the propagation time is shorter than the fluorescence decay time. However, potential distortions still exist: (i) the measured fluorescence lifetime may not be attributed to the targeted location, and (ii) the penetration depth and the total light path can be increased when a NIR source is used. Therefore, both diffusion theories [129,130] and Monte Carlo simulations [131,132] can be applied in an attempt to retrieve intrinsic fluorescence yield and time decay based on source-detector geometries and tissue optical properties. A thorough modeling of these coefficients in vivo is essential for accurate data interpretation, while keeping the computational speed reasonable. Recent improvement including the use of TD-FDOT (Figure 5), frequency-domain [97,133,134,135], and asymptotic TD (ATD) approach [136] have been proposed to reduce the computational complexity when dealing with non-linear problems [41,136,137]. Time-domain analysis can lead to computational challenges in order to solve non-linear problems (Equation (1)). Thus, frequency-domain that calculates the phase shifts between the fluorescence emission and excitation simplifies the problem to a linear solution Y(i) = Ax. Y is the ratio of emission to excitation photon density from the measurements (i) that depends on the source location, detector location, modulation frequency, and wavelength. A represents the effect from each imaging voxel, where the two-point Green’s function yields for light propagation in tissue by taking into account parameters such as detection geometry and tissue optical properties. Eventually, the reconstruction is to solve quantum yield and the fluorescence lifetime represented by x. The first approach to analyze time-resolved fluorescence tomography is using a normalized Born approximation, which was extensively reviewed to resolve 3D map of fluorescence distribution [133]. Ratiometric analysis of the excitation and emission sets is used to reconstruct the tomographic image, thus the normalized data are independent of parameters of the optical system and the coupling efficiency to the sample [97]. In addition to frequency-domain approaches, the asymptotic separation (ATD) approach has been proposed. Considering the contribution of each lifetime component (Equation 1) is a function of time affected by light transport in tissue, it can be independent of time only when considering times longer than light propagation in the background medium. Therefore, ATD separates the analysis into temporal and spatial steps and has been shown to significantly simplify the complexity of the fitting process using NLLS on each source-detector pair. Performance of FD and ATD approaches were compared by Kumar et al. [136], where simulations and phantom studies were done to examine the accuracy of 3D fluorescence lifetime reconstruction. Results showed that ATD demonstrated better capability to resolve distinct lifetimes in the turbid medium, while the comparison of computation speed was not explicitly indicated in current FLIM tomography studies.

4.3. Instrumentation

To implement TRF technology for PDT treatment monitoring, it is necessary to have instrumentation that can access the treatment area other than superficial malignancies. In addition, instrumentation that can encompass spectral-resolved information may further improve data interpretation. The advances in these developments are reviewed in Section 4.3.1 (regarding FLIM endoscopy) and Section 4.3.2 (regarding hyperspectral TRF).

4.3.1. FLIM Endoscopy

The output of light can be coupled to a flexible fiber bundle endoscope, which will be compatible with in vivo imaging of the gastrointestinal tract during PDT application. Wide-field time-domain FLIM has been proposed for clinical applications and a real-time flexible endoscopic FLIM system has been reported [61], which can achieve 29 frames per second when the RLD algorithm is used. TCSPC-based FLIM endoscopy has also been developed to accommodate low SNR applications (i.e., FRET) [138] and can potentially be used depending on the acquisition speed required by the application.
Most current clinical FLIM applications use UV to blue emission lasers to acquire fluorescence decays of the endogenous fluorescence [139]; however, when photosensitizers and their interactions with biomolecules are the main fluorophores, red to NIR lasers play an important role in matching the photosensitizer’s absorption peaks and reducing unwanted autofluorescence background. In particular, absorption from hemoglobin typically reaches its minimum in the optical window between 600 and 900 nm. An NIR laser operating at this range provides an opportunity to achieve high-resolution optical imaging and better penetration depth comparable with the tissue thickness in histopathological analysis [139]. König et al. introduced the first multi-photon endoscope for clinical settings in 2003 using femtosecond two-photon excitation [140]; this has been tested on skin cancer diagnosis. Note that the mode-locked femtosecond Ti:Sapphire lasers are currently the primary light sources for multi-photon FLIM. Therefore, the incomplete decay effect should be considered when using it to probe photosensitizers and their interactions with biomolecules [67,68]. However, the two-photon endomicroscope is not widely used in current biomedical research field because several restrictions are posed when using optical fibers for delivering the femtosecond excitation pulses of the desired pulse energy.

4.3.2. Hyperspectral TRF Imaging

As summarized in Section 3, photosensitizers go through photoproduct/aggregate transitions and an energy transfer with the microenvironment that lead to dynamic PDT efficacy. Moreover, when probing the biological, not only is the status of photosensitizers considered, but also the endogenous fluorophores that correlate with viability. In other words, the source of fluorophores can exhibit broad-band emission spectra with significant spectrum overlap, which leads to difficulties in data interpretation. Therefore, more comprehensive assessment may be required to deal with the complexity in vivo.
Spectral-resolved TRF techniques have been proposed by several research groups to probe the aforementioned biological reactions. The spectral partition can be achieved by scanning methods (hyperspectral) over the whole spectrum range, or parallel acquisition of multiple spectral bands. Typically, parallel acquisition is faster by using multiple band-pass filters [141] or multiple-delay optical fiber bundles [58], while it may not be sufficient to deal with significant spectral overlap in PDT application. In contrast, scanning methods such as grating-based monochromator [51], spectrometer with multichannel PMTs [142], and an acousto-optic tunable filter (AOTF) [57,59] can yield more detailed spectrum information. Among these techniques, AOTF uses the acoustic wave to modulate spatial refractive index of a birefringent crystal, which diffracts light of different wavelengths [57]. The modulation frequency of acoustic waves is in the order of microseconds. Therefore, faster hyperspectral data acquisition becomes its main advantage for clinical implementation when compared to other approaches that typically need tens of seconds to complete a full spectral scan [51]. Moreover, Nie et al. reported an AOTF-based hyperspectral FLIM to render four dimensional data (x, y, τ, λ), and the system was validated using the standard fluorophores and porcine skin tissue [59]. Although current development is still used ex vivo, the development of hyperspectral TRF may render more thorough information and help the interpretation of PDT dynamics.

5. Conclusion and Outlook

In this report, we have reviewed dosimetric limitations in PDT as well as current progress of time-resolved fluorescence for its feasibility in PDT dosimetry. Up-to-date, explicit, implicit, or direct dosimetrics based on steady-state fluorescence measurement have been proposed to improve real-time monitoring of treatment efficacy, while the additional imaging contrast given by fluorescence lifetime can provide new information that looks into PDT dynamics. Towards this goal, time-resolved studies have been performed using common PDT photosensitizers in cellular and animal models. In particular, we reviewed influencing factors such as molecular bindings, photoproducts, irradiation doses, endogenous fluorophores, and the overall microenvironment that could lead to fluorescence lifetime changes of the photosensitizers. These studies have provided encouraging results that showed the potential to correlate changes of time-domain parameters to the eventual drug-molecular interactions and cell toxicity produced by PDT. Recently, time-resolved studies have been tested in vivo using mouse models and the retrieved 3D fluorescence yield and lifetime mapping demonstrated good agreement between phantom and animal studies. This advance has been successfully applied in PDT photosensitizer (HPPH) to study photobleaching and fluorescence lifetime changes before and after treatment. The eventual goal is to correlate “real time” biological effects at the molecular/cellular level to eventual tissue responses, and adjust treatment parameters based on the detected changes and this correlation. Hence, robust and rapid mapping of TRF results, the scope and speed of data acquisition, and penetration depth play key roles when considering the feasibility of PDT dosimetry in vivo. These challenges still exist and the use of TRF in PDT may actually introduce even more complexity for dosimetry. However, with the development of hyperspectral TRF, the use of TD-FDOT to account for tissue optics, robust data analysis for low SNR data, and the rapidly emerging in vivo PDT-TRF studies, time-resolved fluorescence can still be promising in aiding PDT dosimetry.

Acknowledgments

This work was supported in part by the Natural Sciences and Engineering Council (NSERC) of Canada (Qiyin Fang), Canadian Cancer Society Research Institute (Qiyin Fang). Qiyin Fang holds the Canada Research Chair in Biophotonics.

Conflict of Interests

The authors declare no conflict of interest.

References

  1. Kalka, K.; Merk, H.; Mukhtar, H. Photodynamic therapy in dermatology. J. Am. Acad. Dermatol. 2000, 42, 389–413. [Google Scholar] [CrossRef] [PubMed]
  2. Weinreb, R.; Cotlier, E.; Schmidt-erfurth, U.; Hasan, T. Mechanisms of action of photodynamic therapy with verteporfin for the treatment of age-related macular degeneration. Surv. Ophthalmol. 2000, 45, 195–214. [Google Scholar] [CrossRef] [PubMed]
  3. Wilson, B.C.; Patterson, M.S. The physics, biophysics and technology of photodynamic therapy. Phys. Med. Biol. 2008, 53, R61–R109. [Google Scholar] [CrossRef] [PubMed]
  4. Nseyo, U.O.; Shumaker, B.; Klein, E.; Sutherland, K. Photodynamic therapy using porfimer sodium as an alternative to cystectomy in patients with refractory transitional cell carcinoma in situ of the bladder. Bladder Photofrin Study Group. J. Urol. 1998, 160, 39–44. [Google Scholar] [CrossRef] [PubMed]
  5. Brown, S.B.; Brown, E.A.; Walker, I. The present and future role of photodynamic therapy in cancer treatment Photodynamic therapy. Lancet Oncol. 2004, 5, 497–508. [Google Scholar] [CrossRef] [PubMed]
  6. Usuda, J.; Kato, H.; Okunaka, T.; Furukawa, K.; Yamada, K.; Suga, Y.; Honda, H.; Nagatsuka, Y.; Ohira, T.; Tsuboi, M.; et al. Photodynamic Therapy (PDT) for lung cancers. J. Thorac. Oncol. 2006, 1, 489–493. [Google Scholar] [CrossRef]
  7. Overholt, B.F.; Wang, K.K.; Burdick, J.S.; Lightdale, C.J.; Kimmey, M.; Nava, H.R.; Sivak, M.V; Nishioka, N.; Barr, H.; et al. Five-year efficacy and safety of photodynamic therapy with Photofrin in Barrett’s high-grade dysplasia. Gastrointest. Endosc. 2007, 66, 460–468. [Google Scholar] [CrossRef]
  8. Eggener, S.E.; Scardino, P.T.; Carroll, P.R.; Zelefsky, M.J.; Sartor, O.; Hricak, H.; Wheeler, T.M.; Fine, S.W.; Trachtenberg, J.; et al. Focal therapy for localized prostate cancer: A critical appraisal of rationale and modalities. J. Urol. 2007, 178, 2260–2267. [Google Scholar] [CrossRef]
  9. Molpus, K.L.; Kato, D.; Hamblin, M.R.; Lilge, L.; Bamberg, M.; Hasan, T. Intraperitoneal photodynamic therapy of human epithelial ovarian carcinomatosis in a xenograft murine model. Cancer Res. 1996, 56, 1075–1082. [Google Scholar] [PubMed]
  10. Hopper, C.; Kübler, A.; Lewis, H.; Tan, I.B.; Putnam, G. mTHPC-mediated photodynamic therapy for early oral squamous cell carcinoma. Int. J. Cancer 2004, 111, 138–146. [Google Scholar] [CrossRef] [PubMed]
  11. Nyst, H.J.; van Veen, R.L.P.; Tan, I.B.; Peters, R.; Spaniol, S.; Robinson, D.J.; Stewart, F.; Levendag, P.C.; Sterenborg, H.J.C.M. Performance of a dedicated light delivery and dosimetry device for photodynamic therapy of nasopharyngeal carcinoma: Phantom and volunteer experiments. Lasers Surg. Med. 2007, 39, 647–653. [Google Scholar] [CrossRef] [PubMed]
  12. Dougherty, T.J.; Gomer, C.J.; Henderson, B.W.; Jori, G.; Kessel, D.; Korbelik, M.; Moan, J.; Peng, Q. Photodynamic therapy. J. Natl. Cancer Inst. 1998, 90, 889–905. [Google Scholar] [CrossRef] [PubMed]
  13. Macdonald, I.J.; Dougherty, T.J. Basic principles of photodynamic therapy. J. Porphyr. Phthalocyanines 2001, 5, 105–129. [Google Scholar] [CrossRef]
  14. Portale, G.; Hagen, J.A.; Peters, J.H.; Chan, L.S.; DeMeester, S.R.; Gandamihardja, T.A.K.; DeMeester, T.R. Modern 5-year survival of resectable esophageal adenocarcinoma: single institution experience with 263 patients. J. Am. Coll. Surg. 2006, 202, 588–596. [Google Scholar] [CrossRef] [PubMed]
  15. Muller, P.J.; Wilson, B.C. Photodynamic therapy of brain tumors–A work in progress. Lasers Surg. Med. 2006, 38, 384–389. [Google Scholar] [CrossRef] [PubMed]
  16. Johansson, A.; Palte, G.; Schnell, O.; Tonn, J.-C.; Herms, J.; Stepp, H. 5-Aminolevulinic acid-induced protoporphyrin IX levels in tissue of human malignant brain tumors. Photochem. Photobiol. 2010, 86, 1373–1378. [Google Scholar] [CrossRef] [PubMed]
  17. Oleinick, N.L.; Morris, R.L.; Belichenko, I. The role of apoptosis in response to photodynamic therapy: what, where, why, and how. Photochem. Photobiol. Sci. 2002, 1, 1–21. [Google Scholar] [CrossRef] [PubMed]
  18. Kessel, D.; Luo, Y.; Deng, Y.; Chang, C.K. The role of subcellular localization in initiation of apoptosis by photodynamic therapy. Photochem. Photobiol. 1997, 65, 422–426. [Google Scholar] [CrossRef] [PubMed]
  19. Price, M.; Heilbrun, L.; Kessel, D. Effects of the oxygenation level on formation of different reactive oxygen species during photodynamic therapy. Photochem. Photobiol. 2013, 89, 683–686. [Google Scholar] [CrossRef] [PubMed]
  20. Vanden Berghe, T.; Vanlangenakker, N.; Parthoens, E.; Deckers, W.; Devos, M.; Festjens, N.; Guerin, C.J.; Brunk, U.T.; Declercq, W.; Vandenabeele, P. Necroptosis, necrosis and secondary necrosis converge on similar cellular disintegration features. Cell Death Differ. 2010, 17, 922–930. [Google Scholar] [CrossRef] [PubMed]
  21. Calzavara-Pinton, P.G.; Venturini, M.; Sala, R. Photodynamic therapy: Update 2006. Part 1: Photochemistry and photobiology. J. Eur. Acad. Dermatol. Venereol. 2007, 21, 293–302. [Google Scholar] [CrossRef] [PubMed]
  22. Gupta, S.; Dwarakanath, B.S.; Muralidhar, K.; Jain, V. Cellular uptake, localization and photodynamic effects of haematoporphyrin derivative in human glioma and squamous carcinoma cell lines. J. Photochem. Photobiol. B. 2003, 69, 107–120. [Google Scholar] [CrossRef] [PubMed]
  23. Mojzisova, H.; Bonneau, S.; Vever-Bizet, C.; Brault, D. Cellular uptake and subcellular distribution of chlorin e6 as functions of pH and interactions with membranes and lipoproteins. Biochim. Biophys. Acta 2007, 1768, 2748–2756. [Google Scholar]
  24. Kiesslich, T.; Berlanda, J.; Plaetzer, K.; Krammer, B.; Berr, F. Comparative characterization of the efficiency and cellular pharmacokinetics of Foscan- and Foslip-based photodynamic treatment in human biliary tract cancer cell lines. Photochem. Photobiol. Sci. 2007, 6, 619–627. [Google Scholar]
  25. Sandell, J.L.; Zhu, T.C. A review of in vivo optical properties of human tissues and its impact on PDT. 2012; 4, 773–787. [Google Scholar]
  26. Abels, C. Targeting of the vascular system of solid tumours by photodynamic therapy (PDT). Photochem. Photobiol. Sci. 2004, 3, 765–771. [Google Scholar] [CrossRef] [PubMed]
  27. Chang, C.J.; Sun, C.H.; Liaw, L.H.; Berns, M.W.; Nelson, J.S. In vitro and in vivo photosensitizing capabilities of 5-ALA versus photofrin in vascular endothelial cells. Lasers Surg. Med. 1999, 24, 178–186. [Google Scholar] [CrossRef] [PubMed]
  28. Georgakoudi, I.; Foster, T.H. Singlet oxygen- versus nonsinglet oxygen-mediated mechanisms of sensitizer photobleaching and their effects on photodynamic dosimetry. Photochem. Photobiol. 1998, 67, 612–625. [Google Scholar] [CrossRef] [PubMed]
  29. Dysart, J.S.; Patterson, M.S. Photobleaching kinetics, photoproduct formation, and dose estimation during ALA induced PpIX PDT of MLL cells under well oxygenated and hypoxic conditions. Photochem. Photobiol. Sci. 2006, 5, 73–81. [Google Scholar] [CrossRef] [PubMed]
  30. Schneckenburger, H.; Steiner, R.; Rueck, A. In vivo photoproduct formation during PDT with ALA-induced endogenous porphyrins. J Photochem. Photobiol. B. 1993, 18, 287–290. [Google Scholar] [CrossRef] [PubMed]
  31. König, K.; Wabnitz, H.; Dietel, W. Variation in the fluorescence decay properties of haematoporphyrin derivative during its conversion to photoproducts. J. Photochem. Photobiol. B. 1990, 8, 103–111. [Google Scholar] [CrossRef] [PubMed]
  32. Wilson, B.C.; Patterson, M.S.; Lilge, L. Implicit and explicit dosimetry in photodynamic therapy : a new paradigm. Lasers Med. Sci. 1997, 12, 182–199. [Google Scholar] [PubMed]
  33. Weston, M.A.; Patterson, M.S. Monitoring oxygen concentration during photodynamic therapy using prompt photosensitizer fluorescence. Phys. Med. Biol. 2013, 58, 7039–7059. [Google Scholar] [CrossRef] [PubMed]
  34. Diamond, K.R.; Malysz, P.P.; Hayward, J.E.; Patterson, M.S. Quantification of fluorophore concentration in vivo using two simple fluorescence-based measurement techniques. J. Biomed. Opt. 2005, 10, 024007. [Google Scholar] [CrossRef] [PubMed]
  35. Diamond, K.R.; Patterson, M.S.; Farrell, T.J. Quantification of fluorophore concentration in tissue-simulating media by fluorescence measurements with a single optical fiber. Appl. Opt. 2003, 42, 2436–2342. [Google Scholar] [CrossRef]
  36. Patterson, M.S.; Wilson, C.; Graff, R. In vivo tests of the concept of photodynamic threshold dose in normal rat liver photosensitized by aluminum pthalocyanine. Photochem. Photobiol. 1990, 51, 343–349. [Google Scholar] [CrossRef] [PubMed]
  37. Sheng, C.; Hoopes, P.J.; Hasan, T.; Pogue, B.W. Photobleaching-based dosimetry predicts deposited dose in ALA-PpIX PDT of rodent esophagus. Photochem. Photobiol. 2007, 83, 738–748. [Google Scholar] [PubMed]
  38. Dysart, J.S.; Patterson, M.S. Characterization of Photofrin photobleaching for singlet oxygen dose estimation during photodynamic therapy of MLL cells in vitro. Phys. Med. Biol. 2005, 50, 2597–2616. [Google Scholar] [CrossRef] [PubMed]
  39. Niedre, M.; Patterson, M.S.; Wilson, B.C. Direct near-infrared luminescence detection of singlet oxygen generated by photodynamic therapy in cells in vitro and tissues in vivo. Photochem. Photobiol. 2002, 75, 382–391. [Google Scholar] [CrossRef] [PubMed]
  40. Jarvi, M.T.; Niedre, M.J.; Patterson, M.S.; Wilson, B.C. Singlet oxygen luminescence dosimetry (SOLD) for photodynamic therapy: Current status, challenges and future prospects. Photochem. Photobiol. 2006, 82, 1198–1210. [Google Scholar] [CrossRef] [PubMed]
  41. Lakowicz, J.R. Principles of Fluorescnece Spectroscopy, 3rd ed.; Springer: New York, NY, USA, 2006. [Google Scholar]
  42. Suhling, K.; French, P.M.W.; Phillips, D. Time-resolved fluorescence microscopy. Photochem. Photobiol. Sci. 2005, 4, 13–22. [Google Scholar] [CrossRef] [PubMed]
  43. Cubeddu, R.; Ramponi, R.; Bottiroli, G. Time-resolved fluorescence spectroscopy of hematoporphyrin derivative in micelles. Chem. Phys. Lett. 1986, 128, 439–442. [Google Scholar] [CrossRef]
  44. Wu, Y.; Zheng, W.; Qu, J.Y. Sensing cell metabolism by time-resolved autofluorescence. Opt. Lett. 2006, 31, 3122–3124. [Google Scholar] [CrossRef] [PubMed]
  45. Ruck, A.; Hulshoff, C.; Kinzler, I.; Becker, W.; Steiner, R. SLIM : A new method for molecular imaging. Microsc. Res. Tech. 2007, 492, 485–492. [Google Scholar] [CrossRef]
  46. Verveer, P.J.; Squire, A.; Bastiaens, P.I. Global analysis of fluorescence lifetime imaging microscopy data. Biophys. J. 2000, 78, 2127–2137. [Google Scholar] [CrossRef] [PubMed]
  47. Pelet, S.; Previte, M.J.R.; Laiho, L.H.; So, P.T.C. A fast global fitting algorithm for fluorescence lifetime imaging microscopy based on image segmentation. Biophys. J. 2004, 87, 2807–2817. [Google Scholar] [CrossRef]
  48. Bright, F.V; Munson, C.A. Time-resolved fluorescence spectroscopy for illuminating complex systems. Anal. Chim. Acta 2003, 500, 71–104. [Google Scholar] [CrossRef]
  49. Marcu, L. Fluorescence lifetime techniques in medical applications. Ann. Biomed. Eng. 2012, 40, 304–331. [Google Scholar] [PubMed]
  50. Becker, W.; Bergmann, A.; Biskup, C. Multispectral fluorescence lifetime imaging by TCSPC. Microsc. Microanal. 2007, 70, 403–409. [Google Scholar]
  51. Fang, Q.; Papaioannou, T.; Jo, J.A.; Vaitha, R.; Shastry, K.; Marcu, L. Time-domain laser-induced fluorescence spectroscopy apparatus for clinical diagnostics. Rev. Sci. Instrum. 2004, 75, 151. [Google Scholar] [CrossRef]
  52. Papaioannou, T.; Preyer, N.W.; Fang, Q.; Brightwell, A.; Carnohan, M.; Cottone, G.; Ross, R.; Jones, L.R.; Marcu, L. Effects of fiber-optic probe design and probe-to-target distance on diffuse reflectance measurements of turbid media: an experimental and computational study at 337 nm. Appl. Opt. 2004, 43, 2846–2860. [Google Scholar] [CrossRef] [PubMed]
  53. Pfefer, T.J.; Paithankar, D.Y.; Poneros, J.M.; Schomacker, K.T.; Nishioka, N.S. Temporally and spectrally resolved fluorescence spectroscopy for the detection of high grade dysplasia in Barrett’s esophagus. Lasers Surg. Med. 2003, 32, 10–16. [Google Scholar] [PubMed]
  54. Mycek, M.-A.; Schomacker, K.T.; Nishioka, N.S. Colonic polyp differentiation using time-resolved autofluorescence spectroscopy. Gastroenterol. Endosc. 1998, 48, 390–394. [Google Scholar] [CrossRef]
  55. Butte, P.V.; Fang, Q.; Jo, J.A.; Yong, W.H.; Pikul, B.K.; Black, K.L.; Marcu, L. Intraoperative delineation of primary brain tumors using time-resolved fluorescence spectroscopy. J. Biomed. Opt. 2010, 15, 027008. [Google Scholar] [CrossRef]
  56. Butte, P.V; Mamelak, A.N.; Nuno, M.; Bannykh, S.I.; Black, K.L.; Marcu, L. Fluorescence lifetime spectroscopy for guided therapy of brain tumors. Neuroimage 2011, 54, S125–S135. [Google Scholar] [CrossRef] [PubMed]
  57. Yuan, Y.; Hwang, J.; Krishnamoorthy, M.; Ye, K.; Zhang, Y.; Ning, J.; Wang, R.C.; Deen, M.J.; Fang, Q. High-throughput acousto-optic-tunable-filter-based time-resolved fluorescence spectrometer for optical biopsy. Opt. Lett. 2009, 34, 1132–1134. [Google Scholar] [CrossRef] [PubMed]
  58. Yuan, Y.; Papaioannou, T.; Fang, Q. Single-shot acquisition of time-resolved fluorescence spectra using a multiple delay optical fiber bundle. Opt. Lett. 2008, 33, 791–793. [Google Scholar] [CrossRef] [PubMed]
  59. Nie, Z.; An, R.; Hayward, J.E.; Farrell, T.J.; Fang, Q. Hyperspectral fluorescence lifetime imaging for optical biopsy. J. Biomed. Opt. 2013, 18, 1–7. [Google Scholar] [CrossRef]
  60. Sun, Y.; Chaudhari, A.J.; Lam, M.; Xie, H.; Yankelevich, D.R.; Phipps, J.; Liu, J.; Fishbein, M.C.; Cannata, J.M.; Shung, K.K.; et al. Multimodal characterization of compositional, structural and functional features of human atherosclerotic plaques. Biomed. Opt. Express 2011, 2, 2288–2298. [Google Scholar] [CrossRef] [PubMed]
  61. Munro, I.; McGinty, J.; Galletly, N.; Requejo-Isidro, J.; Lanigan, P.M.P.; Elson, D.S.; Dunsby, C.; Neil, M.A.A.; Lever, M.J.; Stamp, G.W.H.; et al. Toward the clinical application of time-domain fluorescence lifetime imaging. J. Biomed. Opt. 2005, 10, 051403. [Google Scholar] [CrossRef] [PubMed] [Green Version]
  62. Agronskaia, A.V; Tertoolen, L.; Gerritsen, H.C. Fast fluorescence lifetime imaging of calcium in living cells. J. Biomed. Opt. 2004, 9, 1230–1237. [Google Scholar] [CrossRef] [PubMed]
  63. Sharman, K.K.; Periasamy, A.; Ashworth, H.; Demas, J.N. Error analysis of the rapid lifetime determination method for double-exponential decays and new windowing schemes. Anal. Chem. 1999, 71, 947–952. [Google Scholar] [CrossRef] [PubMed]
  64. Booth, M.J.; Wilson, T. Low-cost, frequency-domain, fluorescence lifetime confocal microscopy. J. Microsc. 2004, 214, 36–42. [Google Scholar] [CrossRef] [PubMed]
  65. Sun, Y.; Phipps, J.E.; Meier, J.; Hatami, N.; Poirier, B.; Elson, D.S.; Farwell, D.G.; Marcu, L. Endoscopic fluorescence lifetime imaging for in vivo intraoperative diagnosis of oral carcinoma. Microsc. Microanal. 2013, 4, 1–8. [Google Scholar]
  66. Celli, A.; Sanchez, S.; Behne, M.; Hazlett, T.; Gratton, E.; Mauro, T. The epidermal Ca(2+) gradient: Measurement using the phasor representation of fluorescent lifetime imaging. Biophys. J. 2010, 98, 911–921. [Google Scholar] [CrossRef] [PubMed]
  67. Barber, P.R.; Ameer-Beg, S.M.; Gilbey, J.; Carlin, L.; Keppler, M.; Ng, T.; Vojnovic, B. Multiphoton time-domain fluorescence lifetime imaging microscopy: Practical application to protein-protein interactions using global analysis. J. R. Soc. Interface 2009, 6, S93–S105. [Google Scholar]
  68. Leung, R.W.K.; Yeh, S.-C.A.; Fang, Q. Effects of incomplete decay in fluorescence lifetime estimation. Biomed. Opt. Express 2011, 2, 2517–2531. [Google Scholar] [PubMed]
  69. Ruck, A. Fluorescence lifetime imaging in PDT. An overview. Med. Laser Appl. 2005, 20, 125–129. [Google Scholar] [CrossRef]
  70. Russell, J.A.; Diamond, K.R.; Collins, T.J.; Tiedje, H.F.; Hayward, J.E.; Farrell, T.J.; Patterson, M.S.; Fang, Q. Characterization of fluorescence lifetime of Photofrin and delta-aminolevulinic acid induced protoporphyrin IX in living cells using single and two-photon excitation. IEEE J. Quantum Electron. 2008, 14, 158–166. [Google Scholar] [CrossRef]
  71. Theodossiou, T.; MacRobert, A.J. Comparison of the photodynamic effect of exogenous photoprotoporphyrin and protoporphyrin IX on PAM 212 murine keratinocytes. Photochem. Photobiol. 2002, 76, 530–537. [Google Scholar] [CrossRef] [PubMed]
  72. Howe, L.; Sucheta, A.; Einarsdottir, O.; Zhang, J.Z. Time-resolved studies of the excited-state dynamics of meso-Tetra (hydroxylphenyl) cholorin in Solution. Photochem. Photobiol. 1999, 69, 617–623. [Google Scholar] [CrossRef] [PubMed]
  73. Connelly, J.P.; Botchway, S.W.; Kunz, L.; Pattison, D.; Parker, A.W.; MacRobert, A.J. Time-resolved fluorescence imaging of photosensitiser distributions in mammalian cells using a picosecond laser line-scanning microscope. J. Photochem. Photobiol. A Chem. 2001, 142, 169–175. [Google Scholar] [CrossRef]
  74. Mermut, O.; Noiseux, I.; Bouchard, J.-P.; Cormier, J.-F.; Desroches, P.; Fortin, M.; Gallant, P.; Leclair, S.; Vernon, M.L.; et al. Effect of liposomal confinement on photothermal and photo-oximetric fluorescence lifetimes of photosensitizers with varying hydrophilicity. J. Biomed. Opt. 2008, 13, 041314. [Google Scholar] [CrossRef] [PubMed]
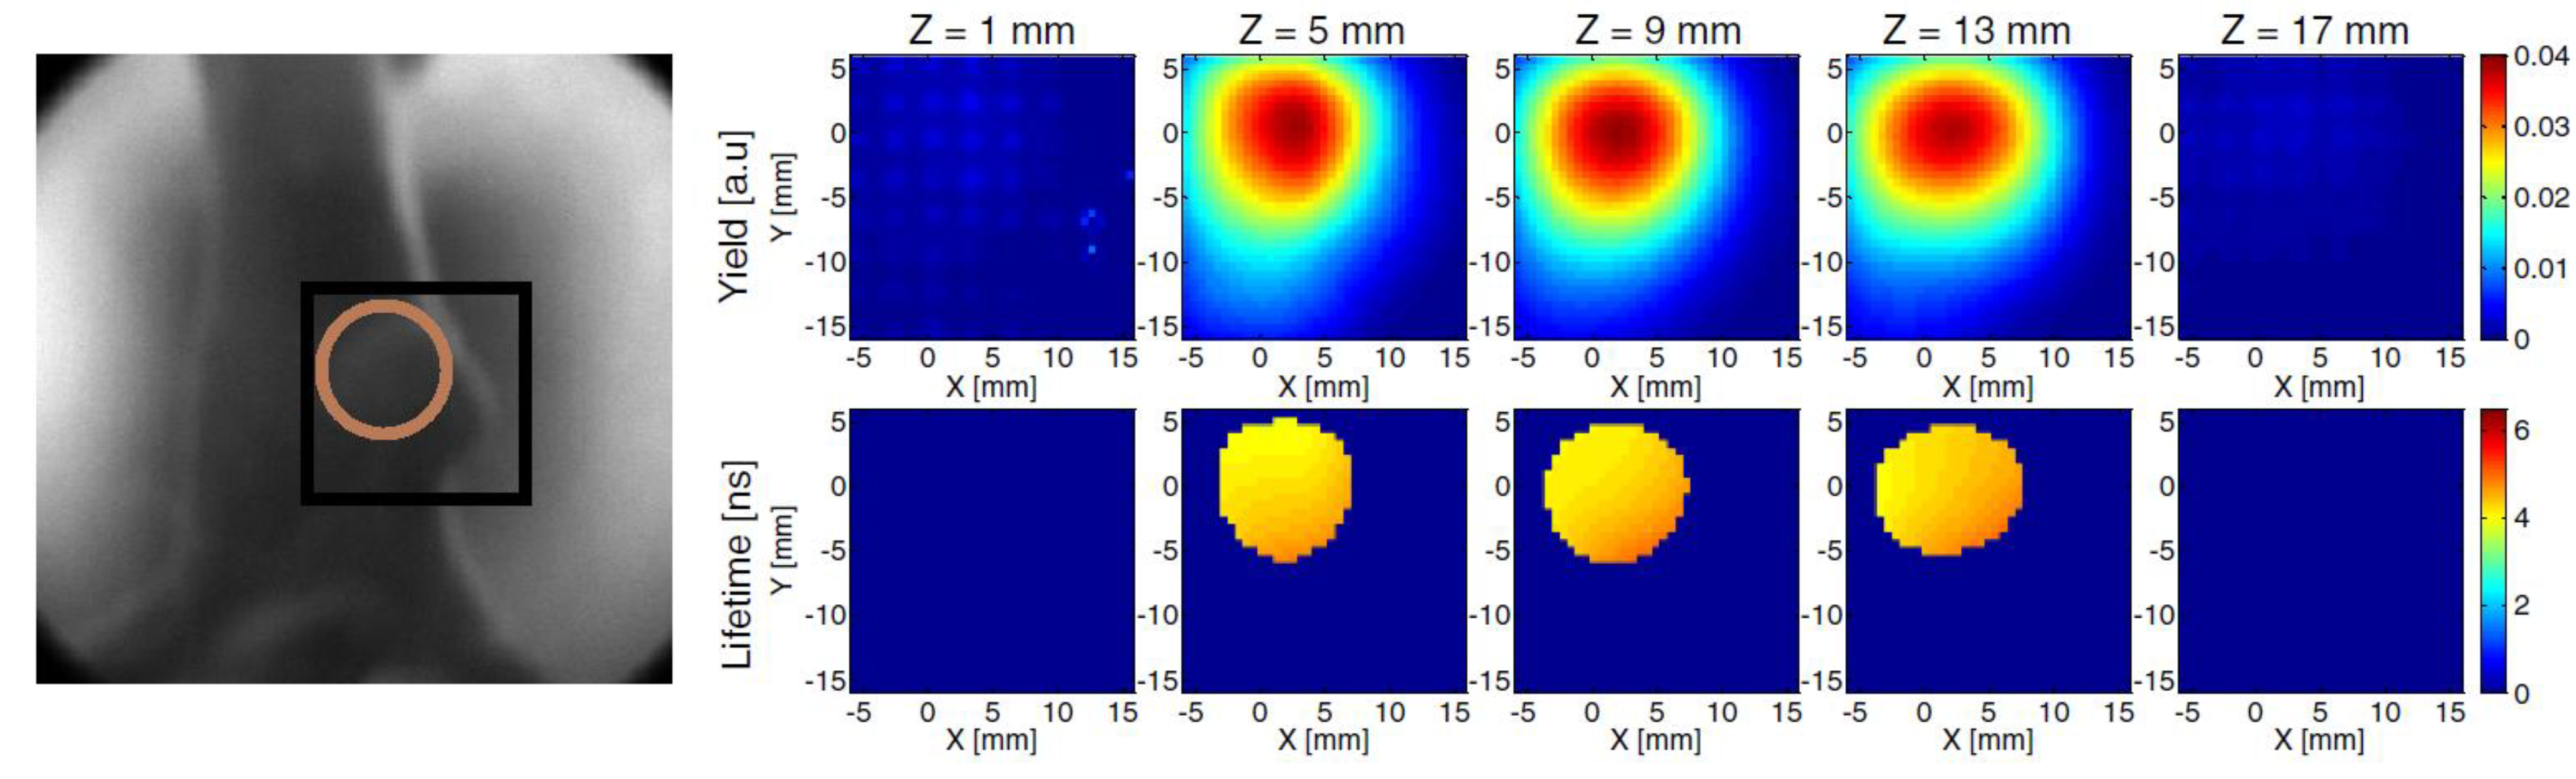
  75. Mo, W.; Rohrbach, D.; Sunar, U. Imaging a photodynamic therapy photosensitizer in vivo with a time-gated fluorescence tomography system. J. Biomed. Opt. 2012, 17, 071306. [Google Scholar] [CrossRef] [PubMed]
  76. Kelbauskas, L.; Dietel, W. Internalization of aggregated photosensitizers by tumor cells : subcellular yime-resolved fluorescence spectroscopy on derivatives of pyropheophorbide-a ethers and chlorin e6 under femtosecond one- and two-photon excitation. Photochem. Photobiol. 2002, 76, 686–694. [Google Scholar] [CrossRef] [PubMed]
  77. O’Connor, A.E.; Gallagher, W.M.; Byrne, A.T. Porphyrin and nonporphyrin photosensitizers in oncology: preclinical and clinical advances in photodynamic therapy. Photochem. Photobiol. 2009, 85, 1053–1074. [Google Scholar] [CrossRef] [PubMed]
  78. Yeh, S.-C.A.; Diamond, K.R.; Patterson, M.S.; Nie, Z.; Hayward, J.E.; Fang, Q. Monitoring photosensitizer uptake using two photon fluorescence lifetime imaging microscopy. Theranostics 2012, 2, 817–826. [Google Scholar] [PubMed]
  79. Kress, M.; Meier, T.; Steiner, R.; Dolp, F.; Erdmann, R.; Ortmann, U.; Rück, A. Time-resolved microspectrofluorometry and fluorescence lifetime imaging of photosensitizers using picosecond pulsed diode lasers in laser scanning microscopes. J. Biomed. Opt. 2003, 8, 26–32. [Google Scholar] [CrossRef] [PubMed]
  80. Hilf, R. Mitochondria are targets of photodynamic therapy. J. Bioenerg. Biomembr. 2007, 39, 85–89. [Google Scholar] [CrossRef] [PubMed]
  81. Morgan, J.; Oseroff, A. Mitochondria-based photodynamic anti-cancer therapy. Adv. Drug Deliv. Rev. 2001, 49, 71–86. [Google Scholar] [CrossRef] [PubMed]
  82. Saczko, J.; Mazurkiewicz, M.; Chwiłkowska, A.; Kulbacka, J.; Kramer, G.; Ługowski, M.; Snietura, M.; Banaś, T. Intracellular distribution of Photofrin in malignant and normal endothelial cell lines. Folia Biol. (Praha). 2007, 53, 7–12. [Google Scholar] [PubMed]
  83. Singh, G.; Jeeves, W.P.; Wilson, B.C.; Jang, D. Mitochondrial photosensitization by Photofrin II. Photochem. Photobiol. 1987, 46, 645–649. [Google Scholar] [CrossRef]
  84. Hsieh, Y.-J.; Wu, C.-C.; Chang, C.-J.; Yu, J.-S. Subcellular localization of Photofrin determines the death phenotype of human epidermoid carcinoma A431 cells triggered by photodynamic therapy: when plasma membranes are the main targets. J. Cell. Physiol. 2003, 194, 363–375. [Google Scholar] [CrossRef] [PubMed]
  85. Lassalle, H.-P.; Wagner, M.; Bezdetnaya, L.; Guillemin, F.; Schneckenburger, H. Fluorescence imaging of Foscan and Foslip in the plasma membrane and in whole cells. J. Photochem. Photobiol. B. 2008, 92, 47–53. [Google Scholar] [CrossRef] [PubMed]
  86. Khursid, A.; Atif, M.; Firdous, S.; Zaidi, S.S.Z.; Salman, R.; Ikram, M. Study of the efficacy of 5 ALA-mediated photodynamic therapy on human larynx squamous cell carcinoma (Hep2c) cell line. Laser Phys. 2010, 20, 1673–1678. [Google Scholar] [CrossRef]
  87. AlSalhi, M.S.; Atif, M.; AlObiadi, A.; Aldwayyan, A.S. Photodynamic damage study of HeLa cell line using ALA. Laser Phys. 2011, 21, 733–739. [Google Scholar] [CrossRef]
  88. Fakhar-e-Alam, M.; Atif, M.; Rehman, T.; Sadia, H.; Firdous, S. The role of sensitivity of ALA (PpIX)-based PDT on Human embryonic kidney cell line (HEK293T). Laser Phys. 2011, 21, 1428–1437. [Google Scholar] [CrossRef]
  89. Atif, M.; Fakhar-e-Alam, M.; Firdous, S.; Zaidi, S.S.Z.; Suleman, R.; Ikram, M. Study of the efficacy of 5-ALA mediated photodynamic therapy on human rhabdomyosarcoma cell line (RD). Laser Phys. Lett. 2010, 7, 757–764. [Google Scholar]
  90. Chwiłkowska, A.; Saczko, J.; Modrzycka, T.; Marcinkowska, A.; Malarska, A.; Bielewicz, J.; Patalas, D.; Banaś, T. Uptake of photofrin II, a photosensitizer used in photodynamic therapy, by tumour cells in vitro. Acta Biochim. Pol. 2003, 50, 509–513. [Google Scholar] [PubMed]
  91. Woodburn, K.W.; Vardaxis, N.J.; Hill, J.S.; Kaye, A.H.; Phillips, D.R. Subcellular localization of porphyrins using confocal laser scanning microscopy. Photochem. Photobiol. 1991, 54, 725–732. [Google Scholar] [CrossRef] [PubMed]
  92. Geze, M.; Morli, P.; Mazi, J.C.; Smith, K.M.; Santw, R. Lysosomes, a key target of hydrophobic for photochemotherapeutic applications photosensitizers proposed. 1993, 20, 23–35. [Google Scholar]
  93. Høgset, A. Photochemical internalisation in drug and gene delivery. Adv. Drug Deliv. Rev. 2004, 56, 95–115. [Google Scholar] [CrossRef] [PubMed]
  94. Scully, A.; Ostler, R.B.; Phillips, D.; O’Neill, P.; Townsend, K.M.S.; Parker, A.W.; MacRobert, A.J. Application of fluorescence lifetime imaging microscopy to the investigation of intracellular PDT mechanisms. Bioimaging 1997, 5, 9–18. [Google Scholar] [CrossRef]
  95. Moan, J.; Berg, K.; Bommer, J.C. Action spectra of phthalocyanines with respect to photosensitization of cells. Photochem. Photobiol. 1992, 56, 171–175. [Google Scholar] [PubMed]
  96. Ma, L.; Bagdonas, S.; Moan, J. The photosensitizing effect of the photoproduct of protoporphyrin IX. J. Photochem. Photobiol. B. 2001, 60, 108–113. [Google Scholar] [CrossRef] [PubMed]
  97. Nothdurft, R.E.; Patwardhan, S.V; Akers, W.; Ye, Y.; Achilefu, S.; Culver, J.P. In vivo fluorescence lifetime tomography. J. Biomed. Opt. 2009, 14, 024004. [Google Scholar]
  98. Kumar, A.T.N.; Raymond, S.B.; Dunn, A.K.; Bacskai, B.J.; Boas, D.A. A time domain fluorescence tomography system for small animal imaging. IEEE Trans. Med. Imaging 2008, 27, 1152–1163. [Google Scholar] [CrossRef] [PubMed]
  99. Milstein, A.B.; Oh, S.; Webb, K.J.; Bouman, C.A.; Zhang, Q.; Boas, D.A.; Millane, R.P. Fluorescence optical diffusion tomography. Appl. Opt. 2003, 42, 3081–3094. [Google Scholar] [CrossRef] [PubMed]
  100. Ntziachristos, V.; Weissleder, R. Experimental three-dimensional fluorescence reconstruction of diffuse media by use of a normalized Born approximation. Opt. Lett. 2001, 26, 893–895. [Google Scholar] [CrossRef] [PubMed]
  101. Nava, H.R.; Allamaneni, S.S.; Dougherty, T.J.; Michele, T.; Tan, W.; Wilding, G.; Henderson, B.W. Photodynamic therapy (PDT) using HPPH for the treatment of precancerous lesions associated with Barrett’s esophagus. Lasers Surg Med 2011, 43, 705–712. [Google Scholar]
  102. Sunar, U.; Rohrbach, D.; Rigual, N.; Tracy, E.; Keymel, K.; Cooper, M.T.; Baumann, H.; Henderson, B.H. Monitoring photobleaching and hemodynamic responses to HPPH-mediated photodynamic therapy of head and neck cancer: a case report. Opt. Express 2010, 18, 14969–14978. [Google Scholar] [CrossRef] [PubMed]
  103. Sud, D.; Zhong, W.; Beer, D.G.; Mycek, M.-A. Time-resolved optical imaging provides a molecular snapshot of altered metabolic function in living human cancer cell models. Opt. Express 2006, 14, 4412–4426. [Google Scholar] [CrossRef] [PubMed]
  104. Pogue, B.W.; Pitts, J.D.; Mycek, M.-A.; Sloboda, R.D.; Wilmot, C.M.; Brandsema, J.F.; O’Hara, J. In vivo NADH fluorescence monitoring as an assay for cellular damage in photodynamic therapy. Photochem. Photobiol. 2001, 74, 817–824. [Google Scholar] [CrossRef] [PubMed]
  105. Ghukasyan, V.V; Kao, F. Monitoring cellular metabolism with fluorescence lifetime of reduced nicotinamide adenine dinucleotide. J. Phys. Chem. 2009, 113, 11532–11540. [Google Scholar]
  106. Wang, H.-W.; Gukassyan, V.; Chen, C.-T.; Wei, Y.-H.; Guo, H.-W.; Yu, J.-S.; Kao, F.-J. Differentiation of apoptosis from necrosis by dynamic changes of reduced nicotinamide adenine dinucleotide fluorescence lifetime in live cells. J. Biomed. Opt. 2008, 13, 054011. [Google Scholar] [CrossRef] [PubMed]
  107. Maeno, E.; Shimizu, T.; Okada, Y. Normotonic cell shrinkage induces apoptosis under extracellular low Cl conditions in human lymphoid and epithelial cells. Acta physiol 2006, 187, 217–222. [Google Scholar]
  108. Yu, J.-S.; Guo, H.-W.; Wang, C.-H.; Wei, Y.-H.; Wang, H.-W. Increase of reduced nicotinamide adenine dinucleotide fluorescence lifetime precedes mitochondrial dysfunction in staurosporine-induced apoptosis of HeLa cells. J. Biomed. Opt. 2011, 16, 036008. [Google Scholar] [CrossRef] [PubMed]
  109. Becker, T.L.; Paquette, A.D.; Keymel, K.R.; Henderson, B.W.; Sunar, U. Monitoring blood flow responses during topical ALA-PDT. Biomed. Opt. Express 2010, 2, 123–130. [Google Scholar] [CrossRef] [PubMed]
  110. Niesner, R.; Peker, B.; Schlüsche, P.; Gericke, K.-H.; Hoffmann, C.; Hahne, D.; Müller-Goymann, C. 3D-resolved investigation of the pH gradient in artificial skin constructs by means of fluorescence lifetime imaging. Pharm. Res. 2005, 22, 1079–1087. [Google Scholar] [CrossRef] [PubMed]
  111. Georgakoudi, I.; Nichols, M.G.; Foster, T.H. The mechanism of Photofrin photobleaching and its consequences for photodynamic dosimetry. Photochem. Photobiol. 1997, 65, 135–144. [Google Scholar] [CrossRef] [PubMed]
  112. Mitra, S.; Foster, T.H. Photochemical oxygen consumption sensitized by a porphyrin phosphorescent probe in two model systems. Biophys. J. 2000, 78, 2597–2605. [Google Scholar] [CrossRef] [PubMed]
  113. Finlay, J.C.; Mitra, S.; Foster, T.H. In vivo mTHPC photobleaching in normal rat skin exhibits unique irradiance-dependent features. Photochem. Photobiol. 2002, 75, 282–288. [Google Scholar] [CrossRef] [PubMed]
  114. Nichols, M.G.; Foster, T.H. Oxygen diffusion and reaction kinetics in the photodynamic therapy of multicell tumour spheroids. Phys. Med. Biol. 1994, 39, 2161–2181. [Google Scholar] [CrossRef] [PubMed]
  115. Errington, R.J.; Ameer-Beg, S.M.; Vojnovic, B.; Patterson, L.H.; Zloh, M.; Smith, P.J. Advanced microscopy solutions for monitoring the kinetics and dynamics of drug-DNA targeting in living cells. Adv. Drug Deliv. Rev. 2005, 57, 153–167. [Google Scholar] [CrossRef] [PubMed]
  116. Guo, H.-W.; Chen, C.-T.; Wei, Y.-H.; Lee, O.K.; Gukassyan, V.; Kao, F.-J.; Wang, H.-W. Reduced nicotinamide adenine dinucleotide fluorescence lifetime separates human mesenchymal stem cells from differentiated progenies. J. Biomed. Opt. 2008, 13, 050505. [Google Scholar] [PubMed]
  117. Su, G.-C.; Wei, Y.-H.; Wang, H.-W. NADH fluorescence as a photobiological metric in 5-aminolevlinic acid (ALA)-photodynamic therapy. Opt. Express 2011, 19, 21145–21154. [Google Scholar] [CrossRef] [PubMed]
  118. Zhong, W.; Urayama, P.; Mycek, M.-A. Imaging fluorescence lifetime modulation of a ruthenium-based dye in living cells: the potential for oxygen sensing. J. Phys. D. Appl. Phys. 2003, 36, 1689–1695. [Google Scholar] [CrossRef]
  119. Celli, J.P.; Spring, B.Q.; Rizvi, I.; Evans, C.L.; Samkoe, K.S.; Verma, S.; Pogue, B.W.; Hasan, T. Imaging and photodynamic therapy: Mechanisms, monitoring, and optimization. Chem. Rev. 2010, 110, 2795–2838. [Google Scholar] [PubMed]
  120. Lee, K.C.; Siegel, J.; Webb, S.E.; Lévêque-Fort, S.; Cole, M.J.; Jones, R.; Dowling, K.; Lever, M.J.; French, P.M. Application of the stretched exponential function to fluorescence lifetime imaging. Biophys. J. 2001, 81, 1265–1274. [Google Scholar] [CrossRef] [PubMed]
  121. Budiman, M.; Stroshine, R.L.; Cornillon, P. Moisture measurement in cheese analogue using stretched and multi-exponential models of the magnetic resonance T2 relaxation curve. J. Dairy Res. 2002, 69, 619–632. [Google Scholar] [CrossRef] [PubMed]
  122. Maus, M.; Cotlet, M.; Hofkens, J.; Gensch, T.; De Schryver, F.C.; Schaffer, J.; Seidel, C.A. An experimental comparison of the maximum likelihood estimation and nonlinear least-squares fluorescence lifetime analysis of single molecules. Anal. Chem. 2001, 73, 2078–2086. [Google Scholar] [CrossRef] [PubMed]
  123. Maarek, J.M.; Marcu, L.; Snyder, W.J.; Grundfest, W.S. Time-resolved fluorescence spectra of arterial fluorescent compounds: Reconstruction with the Laguerre expansion technique. Photochem. Photobiol. 2000, 71, 178–187. [Google Scholar] [CrossRef] [PubMed]
  124. Jo, J.A.; Fang, Q.; Marcu, L. Ultrafast Method for the Analysis of Fluorescence Lifetime Imaging Microscopy Data Based on the Laguerre Expansion Technique. IEEE J. Quantum Electron. 2005, 11, 835–845. [Google Scholar] [CrossRef] [PubMed]
  125. Jo, J.A.; Fang, Q.; Papaioannou, T.; Baker, J.D.; Dorafshar, A.H.; Reil, T.; Qiao, J.-H.; Fishbein, M.C.; Freischlag, J.A.; Marcu, L. Laguerre-based method for analysis of time-resolved fluorescence data: application to in vivo characterization and diagnosis of atherosclerotic lesions. J. Biomed. Opt. 2006, 11, 021004. [Google Scholar] [CrossRef]
  126. Chen, Y.; Periasamy, A. Characterization of two-photon excitation fluorescence lifetime imaging microscopy for protein localization. Microsc. Res. Tech. 2004, 63, 72–80. [Google Scholar] [CrossRef] [PubMed]
  127. Barber, P.R.; Ameer-Beg, S.M.; Gilbey, J.D.; Edens, R.J.; Ezike, I.; Vojnovic, B. Global and pixel kinetic data analysis for FRET detection by multi-photon time-domain FLIM. Proc. SPIE 2005, 5700, 171–181. [Google Scholar]
  128. Jacques, S.L. How tissue optics affect dosimetry of photodynamic therapy. J. Biomed. Opt. 2010, 15, 051608. [Google Scholar] [CrossRef] [PubMed]
  129. Patterson, M.S.; Pogue, B.W. Mathematical model for time-resolved and frequency-domain fluorescence spectroscopy in biological tissues. Appl. Opt. 1994, 33, 1963–1974. [Google Scholar] [CrossRef] [PubMed]
  130. Wu, J.; Partovi, F.; Field, M.S.; Rava, R.P. Diffuse reflectance from turbid media: An analytical model of photon migration. Appl. Opt. 1993, 32, 1115–1121. [Google Scholar] [CrossRef]
  131. Vishwanath, K.; Pogue, B.; Mycek, M. Quantitative fluorescence lifetime spectroscopy in turbid media : Comparison of theoretical , experimental and computational methods. Phys. Med. Biol. 2002, 47, 3387–3405. [Google Scholar] [CrossRef] [PubMed]
  132. Vishwanath, K.; Mycek, M.-A. Time-resolved photon migration in bi-layered tissue models. Opt. Express 2005, 13, 7466–7482. [Google Scholar] [CrossRef] [PubMed]
  133. Pyka, T.; Schulz, R.; Ale, A.; Ntziachristos, V. Revisiting the normalized Born approximation: effects of scattering. Opt. Lett. 2011, 36, 4329–4331. [Google Scholar]
  134. Patwardhan, S.V; Culver, J.P. Quantitative diffuse optical tomography for small animals using an ultrafast gated image intensifier. J. Biomed. Opt. 2008, 13, 011009. [Google Scholar] [CrossRef] [PubMed]
  135. Andersen, A.H.; Kak, A.C. Simultaneous algebraic reconstruction technique (SART): A superior implementation of the art algorithm. Ultrason. Imaging 1984, 6, 81–94. [Google Scholar] [CrossRef] [PubMed]
  136. Kumar, A.T.N.; Raymond, S.B.; Bacskai, B.J.; Boas, D.A. Comparison of frequency-domain and time-domain fluorescence lifetime tomography. Opt. Lett. 2008, 33, 470–472. [Google Scholar] [CrossRef] [PubMed]
  137. Kumar, A.T.; Raymond, S.B.; Boverman, G.; Boas, D.A.; Bacskai, B.J. Time resolved fluorescence tomography of turbid media based on lifetime contrast. Opt. Express 2006, 14, 12255–12270. [Google Scholar] [CrossRef] [PubMed]
  138. Fruhwirth, G.O.; Ameer-Beg, S.; Cook, R.; Watson, T.; Ng, T.; Festy, F. Fluorescence lifetime endoscopy using TCSPC for the measurement of FRET in live cells. Opt. Express 2010, 18, 11148–11158. [Google Scholar] [CrossRef] [PubMed]
  139. König, K. Clinical multiphoton tomography. J. Biophotonics 2008, 1, 13–23. [Google Scholar] [CrossRef] [PubMed]
  140. Konig, K.; Riemann, I. High-resolution multiphoton tomography of human skin with subcellular spatial resolution and picosecond time resolution. J. Biomed. Opt. 2003, 8, 432–439. [Google Scholar] [CrossRef] [PubMed]
  141. Xie, H.; Bec, J.; Liu, J.; Sun, Y.; Lam, M.; Yankelevich, D.R.; Marcu, L. Multispectral scanning time-resolved fluorescence spectroscopy (TRFS) technique for intravascular diagnosis. Biomed. Opt. Express 2012, 3, 1521–1533. [Google Scholar] [CrossRef] [PubMed]
  142. De Beule, P.A.A.; Dunsby, C.; Galletly, N.P.; Stamp, G.W.; Chu, A.C.; Anand, U.; Anand, P.; Benham, C.D.; Naylor, A.; French, P.M.W. A hyperspectral fluorescence lifetime probe for skin cancer diagnosis. Rev. Sci. Instrum. 2007, 78, 123101. [Google Scholar] [CrossRef] [PubMed]

